Abstract
Behavioral finance theory predicts that Processing Fluency—the subjective ease of parsing a nominal stimulus—should systematically influence investor attention and asset pricing through heuristic-based decision making. Yet modern equity markets, increasingly dominated by High-Frequency Trading (HFT) and algorithmic execution, provide powerful near-instantaneous arbitrage forces that should neutralize any pricing premium arising from superficial nominal cues. Whether cognitive biases such as the “Ticker Fluency” effect and the “Alphabet Effect” persist in this algorithmic environment or have been fully arbitraged away remains an open empirical question with direct implications for the boundary conditions of Processing Fluency Theory. We address this gap by applying a deterministic Heuristic Fluency Score—based on vowel density and consonant cluster penalties—to all 492 S&P 500 constituents over 752 trading days (January 2021–January 2024), estimating individual stock Fama-French 3-Factor Alphas via daily time-series regressions, and testing whether fluency or alphabetical rank explains cross-sectional variation in abnormal returns after controlling for Liquidity, Amihud illiquidity, and GICS Sector Fixed Effects. To guard against Selection Bias, we explicitly contrast a biased illustrative case study (, 2019–2024) against the rigorous full-market analysis. We find no statistically or economically significant effect: the Fluency Score coefficient is () and the Alphabet Rank coefficient is (), with the results robust to all tested parameterizations (; throughout). These findings establish a boundary condition of Processing Fluency Theory: in algorithm-dominated, highly liquid large-cap markets, cognitive biases in nominal cues are fully absorbed by arbitrage, and ticker symbols function as neutral identifiers rather than heuristic signals. Residual effects, if any, are more likely to manifest in attention-based or volume-related outcomes, or in less institutionalized market segments where algorithmic participation is lower.
1. Introduction
1.1. Background and Research Context
The conflict between the Efficient Market Hypothesis (EMH) and Behavioral Finance remains one of the most debated topics in financial economics. According to the strong form of the EMH, asset prices fully reflect all available information, rendering it impossible for investors to consistently achieve abnormal returns based on publicly available data [1]. However, recent studies suggest that the integration of Artificial Intelligence and Big Data has fundamentally altered the landscape of market efficiency, challenging traditional predictive models [2], and a vast body of psychological research suggests that human decision making is subject to “bounded rationality” [3]. When faced with information overload, investors often rely on cognitive heuristics—mental shortcuts that facilitate rapid decision making but often lead to systematic errors or biases.
Among these heuristics, Processing Fluency plays a pivotal role. Defined as the subjective ease with which a stimulus is processed, fluency influences judgment and valuation: individuals attribute higher value, safety, and familiarity to objects that are cognitively easier to process [4,5]. In the context of financial markets, this translates to the hypothesis that stocks with simple, pronounceable tickers—or those listed earlier in alphabetical order—may enjoy higher Liquidity and valuation premiums. For instance, tickers such as META (Meta Platforms) or EBAY (eBay Inc.) exhibit high Fluency Scores due to their high vowel density and lack of consonant clusters. Conversely, identifiers like XOM (Exxon Mobil) or CHRW (C.H. Robinson) receive low Fluency Scores and require higher cognitive effort to process phonetically.
The early literature identified significant anomalies related to stock ordering and naming. The “Alphabet Effect” suggests that stocks listed at the top of alphabetical tables benefit from a “primacy bias,” attracting disproportionate retail attention [6]. The “Pronunciability Effect” argues that ticker symbols acting as pronounceable words reduce cognitive load during information retrieval, theoretically increasing trading volumes and reducing perceived risk [7,8]. However, the structure of modern financial markets has evolved dramatically. The dominance of High-Frequency Trading (HFT) and algorithmic execution provides powerful arbitrage mechanisms that operate without cognitive load and are entirely indifferent to the phonetic properties of ticker symbols [9,10]. Whether this structural shift is sufficient to neutralize the behavioral effects documented in earlier, less algorithmic market environments is the central question of this paper (developed theoretically in Section 1.3, Section 1.4 and Section 1.5): Do cognitive biases like Ticker Fluency and the Alphabet Effect persist in a mature, algorithm-dominated market, or have they been fully arbitraged away?
1.2. Selection Bias and Contribution of This Study
A critical challenge in Behavioral Finance is distinguishing between genuine market anomalies and statistical artifacts. Selection Bias occurs when a specific subset of data is unconsciously selected to validate a hypothesis. In the case of Ticker Fluency, it is trivial to isolate a portfolio of “High Fluency” stocks (e.g., major tech companies) that have outperformed the market, thereby creating a spurious correlation between the ticker’s semantics and financial return. Addressing this bias requires a rigorous, algorithmic approach applied to the entire market universe rather than selected samples.
This paper contributes to the Behavioral Finance literature by rigorously testing the persistence of nominal biases in the modern, algorithm-dominated market. Table 1 explicitly maps the limitations identified in prior research to the specific contributions of this study.

Table 1.
Mapping of research limitations to study contributions.
Specifically, we advance the existing research in three ways:
- Methodological Rigor: Unlike prior studies often plagued by Selection Bias, we employ a dual-frame approach, explicitly contrasting a biased illustrative sample (2019–2024) with a scientifically controlled analysis of the full S&P 500 universe (2021–2024).
- Algorithmic Definition: We introduce a deterministic, replicable “Ticker Fluency Score” based on phonetic density rules, overcoming the subjectivity of manual ratings.
- Risk-Adjusted Evidence: By controlling for Liquidity (Dollar Volume) and Sector Fixed Effects in a multivariate regression, we provide robust evidence that neither Ticker Fluency nor alphabetical ordering yields a statistically detectable premium in large-cap stocks, supporting the Adaptive Market Hypothesis and establishing the boundary conditions of Processing Fluency Theory in modern markets.
We acknowledge that this study constitutes an indirect test of the Market Efficiency Mechanism: we test whether nominal biases are statistically significant in a setting where algorithmic trading is presumed to dominate (the 2021–2024 S&P 500), rather than directly measuring HFT intensity or algorithmic participation rates. The null result is consistent with the efficiency mechanism but does not directly identify the causal channel. The direct measurement of algorithmic trading intensity—for example, by exploiting cross-sectional or temporal variation in HFT participation—would strengthen causal claims and represents a direction for future research.
1.3. Research Hypotheses
To operationalize the theoretical tension described above and anchor the empirical tests to explicit predictions, we formulate two competing, mutually exclusive hypotheses. We first define the key terms operationally.
Persistence is defined as a statistically significant () and the economically non-negligible association between the Fluency Score (or Alphabet Rank) and risk-adjusted returns—specifically, a coefficient whose 95% confidence interval excludes zero and whose point estimate implies an annualized alpha differential of at least 1% per standard deviation of fluency (a magnitude detectable by investors net of typical transaction costs). Arbitraged away is defined as a null effect whose confidence interval is sufficiently narrow to rule out economically meaningful magnitudes, even if formal significance is not achieved.
H1 (Persistence Hypothesis).
The Heuristic Fluency Score is positively and significantly associated with annualized Fama-French 3-Factor Alpha across S&P 500 constituents, after controlling for Liquidity, Amihud illiquidity, and GICS sector membership. Analogously, stocks with a lower alphabetical rank (earlier in the lexicographic order) earn significantly higher risk-adjusted returns. H1 is consistent with the BeHavioral Persistence Mechanism: cognitive salience generated by fluency translates into a persistent attention premium that survives risk adjustment.
H2 (Arbitrage Hypothesis).
The Heuristic Fluency Score and Alphabet Rank have no statistically or economically significant association with annualized FF3 Alpha. H2 is consistent with the Market Efficiency Mechanism: near-instantaneous arbitrage by algorithmic market participants eliminates any pricing wedge created by cognitive biases in nominal cues, leaving the S&P 500 universe beyond the boundary condition at which fluency-based pricing anomalies survive.
H1 and H2 are not merely statistical alternatives—they carry distinct theoretical implications. The rejection of H1 in favor of H2 does not refute Processing Fluency Theory as a cognitive phenomenon; it instead specifies the market structure conditions under which the cognitive effect fails to translate into a pricing anomaly. Section 3 provides the empirical adjudication.
1.4. Theoretical Framework: Two Competing Mechanisms
The Efficient Market Hypothesis (EMH) postulates that asset prices fully reflect all available information, rendering it impossible to consistently outperform the market through information that is already public [1,11,12]. However, the field of Behavioral Finance has long challenged this notion, demonstrating that market participants are systematically subject to “bounded rationality” and cognitive heuristics that generate predictable deviations from fundamental value [3,13,14].
The central question of this study—whether cognitive biases rooted in Processing Fluency persist in a mature, algorithm-dominated market—can be framed as a structured tension between two theoretically coherent but opposing mechanisms.
The Behavioral Persistence Mechanism predicts that Processing Fluency effects should remain detectable in modern markets, because the underlying cognitive architecture of human decision making is stable and does not adapt to market structure changes. Retail investors continue to rely on heuristic shortcuts when navigating information-rich environments, and the expansion of app-based investing platforms and social trading communities may amplify rather than attenuate the influence of superficial cues on individual trading decisions [15,16]. Under this view, Ticker Fluency serves as an attention-shaping signal that influences order flow, at least in the short run, regardless of the degree of algorithmic intermediation.
The Market Efficiency Mechanism predicts that any systematic pricing advantage generated by superficial cues should be rapidly identified and exploited by sophisticated arbitrageurs, eventually driving the anomaly to zero [12,13]. In the contemporary market, this correction mechanism is dramatically reinforced by the dominance of High-Frequency Trading (HFT). HFT systems process ticker symbols as numeric identifiers, unaffected by phonetic properties, and their sub-millisecond response times effectively eliminate any window during which human heuristics could influence price formation [10,17]. Moreover, systematic evidence indicates that the publication of behavioral anomalies in academic journals accelerates their attrition, as sophisticated investors implement arbitrage strategies in response [18,19].
These two mechanisms generate distinct empirical predictions: the first implies detectable effects on returns, volatility, or Liquidity attributable to fluency; the second implies null effects, particularly in large-cap, highly liquid markets where arbitrage frictions are minimal. Resolving this tension in the context of the modern S&P 500 is the primary objective of the present study.
1.5. Prior Empirical Evidence on Nominal Biases in Asset Pricing
The psychological foundation for fluency effects in financial decision making is well-established. Reber, Schwarz, and Winkielman [5] demonstrate that Processing Fluency is a pervasive cognitive heuristic: stimuli that are easier to process are consistently rated as more familiar, aesthetically pleasing, and trustworthy. This translates into a theoretically grounded prediction that stocks with simpler, more pronounceable tickers should be perceived as safer or more familiar investments.
Empirically, Alter and Oppenheimer [4] provided the first systematic evidence that ticker pronounceability influences short-term return expectations. Green and Jame [7] confirmed and extended these results, showing that company name fluency is positively associated with analyst coverage, institutional ownership, and firm value. Complementarily, Cooper, Dimitrov, and Rau [20] documented that corporate name changes toward simpler, internet-era identifiers generated significant positive abnormal returns during the dot-com era, highlighting the market price impact of nominal signals, though their findings also underscore the role of contemporaneous business model changes as potential confounds.
The “Alphabet Effect” has received parallel empirical support. Itzkowitz and Rothbort [6] document that stocks listed earlier in the alphabetical order exhibit systematically higher trading volumes, consistent with a primacy bias in retail investor attention. Head, Smith, and Wilson [8] further show that the phonetic properties of ticker symbols themselves influence investor perception and trading patterns.
A unifying behavioral mechanism is provided by the investor attention literature. Barber and Odean [21] show that individual investors are net buyers of attention-grabbing stocks, suggesting that any cue increasing cognitive salience—including fluency—could generate transient order imbalances. Da, Engelberg, and Gao [16] establish search volume as a high-frequency proxy for investor attention and demonstrate its predictive power for short-term returns, providing a plausible channel through which fluency effects could propagate into prices.
However, the robustness of these findings across market regimes remains an open question. Much of the foundational evidence was generated in environments where retail participation was higher, algorithmic trading was less prevalent, and information processing was slower. The extent to which these effects survive in the current market structure is what the present study investigates.
1.6. The Erosion of Anomalies in Algorithm-Dominated Markets
The structural transformation of equity markets over the past two decades provides strong theoretical reasons to expect the attrition of fluency-based anomalies in large-cap settings. Three complementary mechanisms are relevant.
High-Frequency Trading and Price Discovery. Brogaard, Hendershott, and Riordan [10] demonstrate that HFT firms systematically trade in the direction of future price changes, contributing to faster and more accurate price discovery. Menkveld [17] shows that modern electronic market makers maintain extremely tight spreads and high inventory turnover, leaving little room for non-fundamental signals to create persistent mispricings. O’Hara [22] argues that the emergence of high-speed electronic markets has fundamentally altered the information–price relationship: signals not grounded in firm fundamentals are rapidly neutralized by competing arbitrage strategies. The improvements in market quality documented by Chordia, Roll, and Subrahmanyam [23]—including tighter spreads, greater depth, and faster price adjustment—further support the view that modern large-cap markets are substantially more efficient than their predecessors.
Anomaly Attrition via Arbitrage and Academic Diffusion. Schwert [19] documents that many well-documented behavioral anomalies have weakened considerably as financial markets have become more competitive and institutionalized. McLean and Pontiff [18] provide direct evidence of this mechanism: the publication of return predictors in academic journals is followed by a significant reduction in out-of-sample predictability, consistent with sophisticated investors using published evidence to implement arbitrage. These findings suggest a secular trend toward the elimination of behavioral anomalies in the most liquid and institutionally traded market segments.
Algorithmic Execution and the Suppression of Cognitive Bias. Machine learning-based predictive models are increasingly driving price discovery, potentially rendering traditional heuristic-based anomalies obsolete [2]. Hendershott, Jones, and Menkveld [9] document that increased algorithmic activity is associated with lower adverse selection costs and improved informational efficiency, providing a microstructural channel through which cognitive biases are actively suppressed.
Taken together, this evidence yields a clear theoretical expectation for the S&P 500 universe studied here: the combination of institutional dominance, algorithmic execution, and rapid arbitrage should have largely eliminated any detectable fluency or alphabetical-order premium by the 2021–2024 sample period. A critical issue that could obscure this finding, however, is Selection Bias. It is statistically trivial to isolate sub-sectors or timeframes where “High Fluency” stocks appear to outperform the market, generating a compelling but spurious correlation. Distinguishing between a genuine market inefficiency and a statistical artifact resulting from non-representative sample selection is crucial, and our methodological design addresses this challenge explicitly (Section 2).
The remainder of this paper is organized as follows. Section 2 details the data, the fluency scoring algorithm, and descriptive statistics. Section 3 presents the empirical results, contrasting the selection-biased illustrative sample with the full-market analysis and reporting robustness checks. Section 4 discusses the theoretical implications, the boundary conditions of the null result, and the generalizability of the findings. Section 5 concludes.
2. Materials and Methods
Overview of the empirical strategy. The core research design is a cross-sectional test of whether ticker-level linguistic properties explain variation in risk-adjusted stock returns. The unit of analysis is the individual stock. For each of the S&P 500 constituents, we compute a Heuristic Fluency Score (Section 2) and an alphabetical rank. We then estimate each stock’s abnormal return (Fama-French 3-Factor Alpha) via a time-series regression over the full sample window. Finally, we test whether stocks with high Fluency Scores or early alphabetical positions systematically earn higher or lower alphas than their counterparts, controlling for microstructure and sector effects via multivariate OLS. The design is intentionally conservative: restricting the sample to S&P 500 constituents—highly liquid, heavily institutionalized, and predominantly algorithmically traded—creates conditions maximally favorable to the Market Efficiency Mechanism. A null finding in this setting constitutes the strongest possible evidence that cognitive biases have been arbitraged away in the modern large-cap environment.
2.1. Data Acquisition and Universe Selection
The dataset for the main empirical analysis comprises the constituents of the Standard & Poor’s 500 (S&P 500) index. Historical daily market data, including Adjusted Close prices and Trading Volumes, were retrieved using the Yahoo Finance API via the yfinance library.
To ensure sufficient statistical power and cover different market regimes, the observation period for the statistical testing is defined from 1 January 2021 to 1 January 2024. This timeframe includes 752 trading days, providing a stable window for estimating Beta and Alpha. (Note: A separate, illustrative dataset spanning 2019–2024 is used exclusively for the Selection Bias case study in Section 3.1.)
The final sample for the main analysis consists of stocks, after excluding constituents with insufficient trading history during the observation window.
Justification of the sample window. The 2021–2024 period is characterized by several unusual macroeconomic conditions that deserve explicit acknowledgment: the post-pandemic economic recovery, the Federal Reserve’s aggressive monetary tightening cycle (2022–2023), exceptional performance of technology and Artificial Intelligence stocks, and residual elevated retail investor participation inherited from the meme stock episode of 2020–2021. Rather than being a limitation, however, these conditions make the window a particularly stringent test of the algorithmic efficiency hypothesis. The surge in retail activity increases the a priori probability that behavioral heuristics would manifest if they were operative, while the concurrent dominance of algorithmic execution provides an efficient arbitrage force working against them. The fact that we find null results under these amplified behavioral conditions strengthens the conclusion that cognitive biases such as Ticker Fluency are not operative in large-cap pricing. To verify that our conclusions are not an artifact of this specific window, the sensitivity analysis in Appendix A reports results across multiple parameter specifications; future research could extend this approach by examining sub-period stability (e.g., pre-tightening 2021 vs. tightening 2022–2023).
2.2. Algorithmic Definition of Ticker Fluency
To quantify the “pronunciability” of a ticker symbol, we developed a deterministic algorithm that assigns a Heuristic Fluency Score () to each stock. The algorithm is grounded in the Processing Fluency Theory, which suggests that words with higher vowel density and fewer consonant clusters are cognitively easier to process.
Let S be a ticker string of length L, defined as a sequence of characters . Let be the set of vowels. We define the vowel density () as
where is the indicator function equal to one if the condition is true, and zero otherwise.
To account for phonetic complexity, we introduce a penalty for consecutive consonant clusters. Let be the length of the longest substring of consecutive consonants in S. The cluster penalty () is defined as
where is a weighting factor (set to in this study) to penalize strings that are difficult to articulate (e.g., “MSFT”, where ). The parameter functions as a normalization coefficient rather than a behaviorally calibrated constant: it ensures that the final score remains bounded in for any ticker of standard length (2–5 characters). Specifically, for the most consonant-heavy four-character ticker (; penalty ) combined with minimum vowel density (), the score is non-negative (). This bounded property facilitates cross-sectional comparison without ad hoc rescaling. The parameter carries no independent behavioral interpretation beyond this normalization role. As confirmed by the sensitivity analysis in Appendix A, varying across leaves all statistical conclusions unchanged, confirming that the specific baseline choice does not drive the results. The final Fluency Score is given by
To ground the algorithm in concrete terms, Table 2 illustrates the scoring for four representative S&P 500 tickers. The score correctly reflects the intuitive ordering of pronunciability—from EBAY (a word-like sequence of alternating vowels and consonants) to MSFT (an entirely consonant string)—while remaining fully deterministic and reproducible.
Table 2.
Illustrative HFSs for selected S&P 500 tickers (). = vowel density; = longest consecutive consonant run; = consonant cluster penalty; and = final score.
Based on the distribution of , the universe is divided into three tertiles:
- High Fluency Group (): Tickers in the top 33%;
- Low Fluency Group (): Tickers in the bottom 33%;
- Neutral Group: The middle tertile (excluded from comparative testing to isolate extremes).
The exclusion of the middle tertile from the univariate group comparison tests (Welch’s t-test) follows the top-vs-bottom design conventionally adopted in the Behavioral Finance attention literature [21], and serves two purposes: (i) it maximizes statistical contrast between the extreme groups, thereby providing the most powerful test of any fluency effect, and (ii) it avoids ambiguity at the tertile boundaries, where classification noise is highest. Importantly, the middle tertile is not excluded from the primary inferential test: the multivariate OLS regression is estimated on all stocks simultaneously, treating the Fluency Score as a continuous variable. The group exclusion therefore affects only the supplementary univariate comparisons, not the main regression results.
2.3. Statistical Metrics and Hypothesis Testing
To evaluate the impact of fluency on market performance, we computed three key metrics for each stock i:
- Annualized Volatility (): Calculated as the standard deviation of daily log returns scaled by .
- Liquidity (Dollar Volume): Defined as the logarithm of the average daily dollar volume to normalize the distribution:
- Skewness (): The third standardized moment of the return distribution, to test for asymmetry in tail risk:
To test the statistical significance between and , we employed Welch’s t-test for independent samples. Unlike the standard Student’s t-test, Welch’s test does not assume equal variance between groups, making it robust for financial data where volatility clustering is common. The null hypothesis () for all metrics is that the means of the two groups are identical ().
Risk-Adjusted Performance Measure (Fama-French Alpha)
To ensure robust risk adjustment beyond the single-factor CAPM, we adopted the Fama-French 3-Factor Alpha () as the primary performance metric. For each stock i in the sample, we performed a separate time-series regression using daily frequency data over the 752-day window:
where is the daily risk-free rate, and (Small Minus Big) and (High Minus Low) are the size and value factors retrieved from the Kenneth French Data Library. The resulting intercept represents the average daily abnormal return, which was subsequently annualized () to serve as the dependent variable in the cross-sectional analysis.
Note on the use of daily frequency. Estimating individual stock alphas at daily frequency introduces a noise–signal trade-off that warrants discussion. Daily returns contain higher idiosyncratic noise relative to weekly or monthly aggregates, which can inflate standard errors in the individual time-series regressions. However, the daily window ( observations per stock) provides substantially greater statistical power for each individual stock regression than lower frequencies would permit, compensating for the higher noise level. More importantly, the cross-sectional aggregation of alphas across stocks diversifies away idiosyncratic estimation error at the portfolio level: the random noise in individual alphas cancels when averaged across stocks, leaving only systematic cross-sectional patterns. Furthermore, if behavioral effects rooted in investor attention and retail order flow are operative, their influence on prices is most plausible over short horizons-daily to weekly—precisely the frequency at which our design is the most sensitive. Longer-horizon analyses would instead be dominated by fundamental information and factor dynamics that are orthogonal to the fluency mechanism. We therefore consider the daily frequency appropriate for this study, while acknowledging that testing over sub-monthly horizons remains an avenue for future research.
Note on two-step estimation and measurement error. The cross-sectional regression uses individual stock alpha estimates from first-stage time-series regressions as the dependent variable. This two-step procedure introduces measurement error in the dependent variable—the “generated regressor” problem [24]. However, measurement error in the dependent variable (as opposed to the regressors) does not bias OLS coefficient estimates; it inflates standard errors, reducing statistical power. Because our central finding is precisely a failure to reject zero, this conservatism strengthens rather than weakens the conclusion: if anything, the two-step procedure makes it harder to detect a true effect, so the null result is robust to this concern. For completeness, we note that the standard econometric corrections (Murphy–Topel adjustment; Fama–MacBeth standard errors with Shanken correction) would be appropriate if we were claiming detection of a significant effect. Given the null result, such corrections are unnecessary but could be implemented in future work examining settings where fluency effects might be detectable.
2.4. Variable Definitions and Data Cleaning
Alphabet Rank. To rigorously test the “Alphabet Effect,” we defined the Alphabet Rank variable based on the stock’s unique ticker symbol rather than the company name, as algorithmic execution systems primarily process ticker identifiers. All tickers were converted to uppercase; special characters representing share classes (e.g., dots in “BRK.B” or dashes in “BF-B”) were removed to treat the root identifier uniformly (e.g., “BRKB”); and the standardized strings were sorted in ascending alphanumeric order. Each stock was assigned a rank , where 1 represents the first ticker in the sequence (e.g., “A”) and N the last (e.g., “ZTS”). Importantly, alphabetical ranking is performed on the analysis sample (after filtering for data availability), so that rank values range from 1 to with no gaps. This ensures that the rank variable accurately reflects the relative alphabetical position among stocks actually included in the regression.
Ticker Fluency Score. The Heuristic Fluency Score () is defined in full in Section 2.2, Equations (1)–(3). In brief, it combines a vowel density ratio with a consonant cluster penalty to yield a normalized phonetic score in , bounded at zero for tickers with no vowels and severe consonant clusters (e.g., MSFT and CHRW). For the cross-sectional OLS regression, all continuous regressors—including —are standardized to Z-scores to facilitate the comparison of effect sizes on a common scale and to render the regression intercept interpretable as the expected alpha for an average-fluency, average-rank stock.
Control Variables. To isolate the specific effect of Ticker Fluency from fundamental market characteristics, we included a control for Liquidity, defined as the base-10 logarithm of the average daily Dollar Volume:
(Note: This definition is consistent with Equation (4); the logarithmic transformation normalizes the highly skewed distribution of trading activity.) We selected Dollar Volume rather than simple Market Capitalization because it serves as a dual proxy: it captures both the scale of the firm (Size) and the magnitude of investor attention (Trading Activity). This distinction is crucial for this study, as algorithmic execution flows—which we hypothesize nullify cognitive biases—are driven primarily by the available Liquidity and volume turnover rather than static market capitalization.
Amihud illiquidity. Following the standard microstructure literature [25], we compute the Amihud illiquidity measure for each stock as
where is the absolute daily return and the scaling factor converts the ratio to units suitable for cross-sectional comparison. This measure captures the price impact of trading: higher values indicate that a given Dollar Volume moves prices more, reflecting lower Liquidity. Within the uniformly liquid S&P 500 universe, cross-sectional variation in Amihud illiquidity is limited, constraining its discriminatory power in our regression (see Section 3).
2.5. Descriptive Statistics
Table 3 reports summary statistics for the main variables across the full sample () and separately for the High Fluency (; top tertile) and Low Fluency (; bottom tertile) groups. The HFS distribution is right-skewed, reflecting the consonant-heavy nature of most S&P 500 ticker symbols: high-fluency tickers (e.g., AMAT and EBAY) are relatively rare, while consonant-dense identifiers (e.g., CHRW and XLNX) dominate the lower end. The distributional overlap between groups on all performance and risk metrics (alpha, volatility, and Liquidity) provides a first visual confirmation of the null result subsequently formalized in the regression analysis.
Table 3.
Descriptive Statistics (Jan 2021–Jan 2024, ). HFS = annualized Heuristic Fluency Score (Equation (3)); Alphabet Rank = lexicographic rank of ticker (1 = earliest); FF3 = annualized Fama-French 3-Factor Alpha (%); Volatility = annualized standard deviation of daily log returns (%); and Liquidity = ln(avg. daily Dollar Volume). High/Low columns report group means for the top and bottom fluency tertiles, respectively. All continuous variables are winsorized at the 1st and 99th percentiles.
3. Results
3.1. Illustrative Case Study: The Risk of Selection Bias
To demonstrate how Selection Bias can generate spurious correlations in Behavioral Finance, we first present an illustrative example using a restricted sample of 25 popular high-cap stocks (e.g., AAPL, NVDA, and TSLA) over the 2019–2024 period.
Figure 1 displays the cumulative returns of equal-weighted portfolios constructed from this subset.
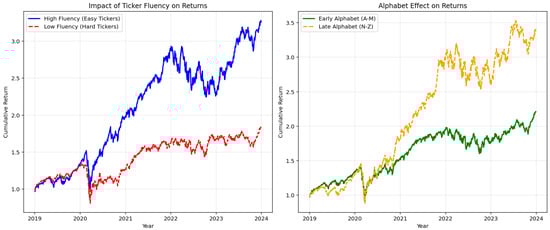
Figure 1.
The illusion of cognitive bias (illustrative case study, 2019–2024). Left Panel: Cumulative returns of high fluency (blue) vs. low fluency (red) portfolios in a restricted sample (). The divergence suggests a significant premium for pronounceable tickers. Right Panel: The Alphabet Effect in the same sample. Note: This timeframe and sample differ from the main analysis to illustrate how sector-specific outliers (e.g., mega-cap tech stocks) can create spurious anomalies in non-representative datasets.
Visually, the left panel suggests a strong “Fluency Premium.” However, this result is driven by the idiosyncratic performance of a few technology giants that happen to have fluent tickers. This highlights the necessity of a rigorous, universe-wide analysis to test for genuine market inefficiencies.
3.2. Main Analysis: Full S&P 500 Universe (2021–2024)
To address issues of statistical power and sample representativeness, the main scientific analysis was conducted on the full S&P 500 constituents () over a standardized three-year window (1 January 2021–1 January 2024).
We evaluated risk-adjusted performance using the annualized Fama-French 3-Factor Alpha, calculated via daily time-series regressions to control for market, size, and value exposures.
Table 4 presents the results of a multivariate OLS regression. To ensure robustness, the model includes Sector Fixed Effects (GICS sectors) and uses heteroskedasticity-consistent (HC3) standard errors.
Table 4.
Main Analysis results (January 2021–January 2024). Multivariate OLS regression on Fama-French 3-Factor Alpha (). Dependent variable: Annualized FF3 Alpha in percentage points (i.e., a value of 3.19 corresponds to 3.19% annual abnormal return). All continuous regressors are standardized (Z-scores), so coefficients represent the change in alpha (in pp) per one-standard-deviation change in the regressor. The model includes contemporary risk adjustments (market, size, and value) and controls for microstructure (Amihud illiquidity), Liquidity, and Sector Fixed Effects. Standard errors are heteroskedasticity-consistent (HC3). Note: The Amihud illiquidity coefficient has an extremely large standard error because within the uniformly liquid S&P 500 sample, cross-sectional variation in illiquidity is minimal, limiting the variable’s discriminatory power (see Section 2.4).
Regression results and hypothesis adjudication. The regression results (Table 4) provide evidence that directly adjudicates between H1 and H2. Using the Fama-French 3-Factor Alpha as the dependent variable, we find the following:
- Ticker Fluency. Statistical finding: The standardized Fluency Score coefficient is (; SE), statistically indistinguishable from zero at any conventional significance level. Economic interpretation: A one-standard-deviation increase in Ticker Fluency is associated with an annualized alpha differential of merely 0.36 percentage points—an economically negligible magnitude, far smaller than the alpha dispersion driven by sector effects alone. The 95% confidence interval around this estimate is sufficiently narrow to rule out not only statistical significance but also any economically meaningful effect size. Theoretical implication: This result is directly consistent with the Market Efficiency Mechanism: in a setting where algorithmic arbitrage operates at sub-millisecond speed, no channel exists through which ticker pronounceability can generate a persistent pricing premium. The cognitive salience of fluent tickers may still influence retail investor attention—search queries, watchlist additions, and initial order flow—but any resulting transient price pressure is immediately corrected by algorithmic market makers before it translates into risk-adjusted abnormal returns.
- Alphabet Effect. Statistical finding: The Alphabet Rank coefficient is (; SE), indistinguishable from zero at any conventional confidence level. Economic interpretation: Alphabetical ordering of tickers—which mattered when physical trading floors and paper-based stock tables structured investor attention—carries no information content in an environment where execution is driven by electronic order-routing systems entirely indifferent to lexicographic rank. The negative sign of the coefficient, which would nominally imply a marginal premium for early-alphabet stocks, is statistically uninformative. Theoretical implication: The Alphabet Effect, if it ever operated in large-cap markets, has been fully arbitraged away in the 2021–2024 period. This finding is consistent with the secular attrition of behavioral anomalies documented by Schwert [19] and McLean and Pontiff [18]: once an anomaly becomes widely known and easily exploitable, rational arbitrageurs eliminate the pricing wedge, leaving only the cognitive effect without the associated return premium.
- Control Variables. Statistical finding: Sector Fixed Effects are highly significant (Energy: ; Information Technology: ); Amihud illiquidity (; ) and Dollar Volume (; ) are not. Economic interpretation: The strong sector significance confirms that the model is capturing genuine cross-sectional variation in abnormal returns driven by fundamental industry dynamics-not noise. The non-significance of Liquidity controls is consistent with the sample composition: the S&P 500 universe is uniformly liquid, offering insufficient cross-sectional illiquidity variation to identify a Liquidity premium within this subset. Theoretical implication: This pattern validates the model specification. The fact that fundamental industry structure () drives alpha variation while nominal cues contribute nothing is exactly what the Market Efficiency Mechanism predicts in a high-Liquidity, algorithm-intensive environment: only fundamental information survives as a cross-sectionally priced factor.
The model explains approximately 18.3% of the variance in alphas (), primarily driven by sector-specific trends rather than cognitive heuristics. Taken together, the three findings paint a coherent picture that directly adjudicates the theoretical tension introduced in Section 1: the Behavioral Persistence Mechanism finds no support in the return data, while the pattern of significant fundamental effects alongside null nominal effects is precisely what the Market Efficiency Mechanism predicts for the modern S&P 500 environment.
Decile analysis of the Alphabet Effect. As a complementary test, we examined whether alphabetical ordering generates any systematic pattern in alphas. The multivariate regression result ( and ; Table 4) already establishes the null, and the decile analysis below provides a visual confirmation.
To visualize this lack of structure, Figure 2 groups the S&P 500 constituents into deciles based on their alphabetical rank and plots the mean Fama-French 3-Factor Alpha for each group. The bar chart confirms the statistical findings: there is no monotonic trend favoring early-alphabet stocks. Comparisons between the first decile (Early Alphabet) and the last decile (Late Alphabet) reveal that the differences in mean annualized alpha are statistically insignificant. Furthermore, the highest returns are randomly distributed among intermediate deciles, consistent with the random walk of an efficient market rather than a structural alphabetical bias.
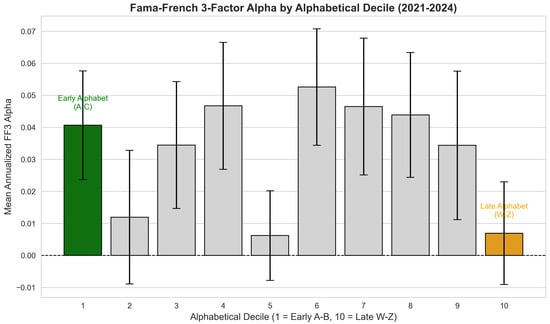
Figure 2.
No alphabetic bias (decile analysis). Mean Fama-French 3-Factor Alpha across ten alphabetical groups ( A–B; W–Z). The error bars represent the standard error of the mean. Contrary to the Alphabet Effect hypothesis, there is no monotonic decline in performance. The first decile (green) does not significantly outperform the last decile (orange), and the highest returns are randomly distributed among intermediate deciles (e.g., decile 4 and 6), consistent with market efficiency.
The bar chart confirms the statistical findings: there is no monotonic trend favoring early-alphabet stocks. The first decile (Early Alphabet) does not significantly outperform the last decile (Late Alphabet), and the differences in annualized alpha are statistically indistinguishable from zero. As confirmed by the multivariate regression (), the alphabetical rank provides no explanatory power. Furthermore, the fact that intermediate deciles (e.g., decile 6 or 7) often exhibit higher alphas than the first decile suggests that any observed variation is due to random noise or sector-specific factors rather than a structural alphabetical bias.
3.3. Robustness and Symmetry
To verify that our Fluency Score algorithm did not influence the results, we performed a sensitivity analysis (detailed in Appendix A). We re-ran the tests varying the cluster penalty parameter (). In all scenarios, the difference between High and Low Fluency groups remained statistically insignificant (). Specifically, as reported in Table A1, the mean difference in the annualized Fama-French Alpha between and ranges from (, , and ) to (, , and ) across all tested specifications. The direction of the estimated effect is uniformly positive but small across all parameter values, and never approaches significance even at the level. These results confirm two key points: first, the null finding is not an artifact of the specific parameterization of the fluency algorithm; second, the upper bound of any plausible Fluency Premium in this market—even under the most favorable parameterization—is approximately 0.80% per annum, an economically negligible magnitude that would be easily absorbed by transaction costs in any realistic trading strategy.
Finally, Figure 3 illustrates the distributional symmetry of risk (Annualized Volatility) across the groups.
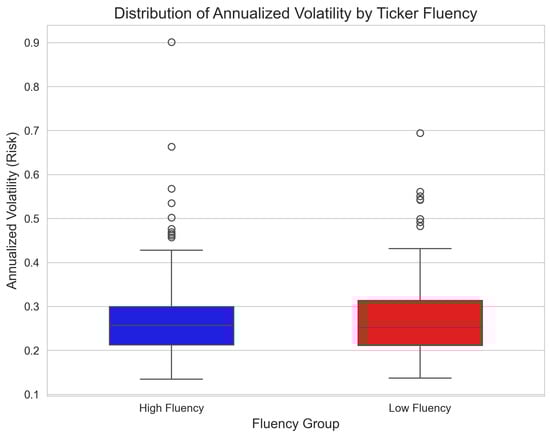
Figure 3.
Symmetry in Risk Profiles. Box-and-whisker plot comparing the distribution of Annualized Volatility for High Fluency vs. Low Fluency stocks (). The medians are aligned and the distributions are structurally similar, visually confirming the efficiency of the market in pricing risk regardless of ticker pronounceability.
The visual evidence aligns with the statistical tests: the market treats ticker symbols symmetrically as identifiers, with no structural preference for linguistic ease.
4. Discussion
4.1. Algorithmic Efficiency vs. Cognitive Bias
The central finding of this study is the disconnect between the predictions of Behavioral Finance (Processing Fluency Theory) and the empirical reality of the modern S&P 500. While the psychological literature [4,15] convincingly demonstrates that humans prefer easily processable information, our results suggest that this preference does not translate into asset pricing anomalies in large-cap markets.
We attribute this “restoration of symmetry” to the dominance of High-Frequency Trading (HFT) and algorithmic execution. Algorithms process ticker symbols as unique numeric identifiers rather than linguistic strings. As noted by [26], the speed of information processing by machines significantly reduces the window of opportunity for behavioral anomalies. Furthermore, recent advances in Artificial Intelligence applied to finance suggest that predictive models based on Machine Learning are increasingly driving price discovery, rendering traditional heuristic-based anomalies obsolete [2].
4.2. The Danger of Selection Bias
Our initial case study (Figure 1) serves as a cautionary tale. It is statistically trivial to construct a portfolio of “fluent” tickers that outperforms the market (e.g., creating a basket of high-growth tech stocks like NVIDIA or TESLA). However, correlating their performance with their ticker’s linguistic structure is a post hoc fallacy. When the sample is expanded to the full universe (Table 4), the correlation vanishes (). This highlights the importance of using comprehensive datasets when training predictive models to avoid overfitting, a challenge extensively discussed in the context of extra-trees classifiers in stock forecasting [27].
4.3. Generalizability and Boundary Conditions of the Null Result
An important limitation of the present study is its focus on S&P 500 constituents during a specific three-year window. The null results reported here should be interpreted as evidence that cognitive biases are not priced in the modern large-cap US equity market, rather than as a universal claim about behavioral effects in all market environments. Several boundary conditions can be identified where fluency effects might remain operative.
Market capitalization. The S&P 500 represents the most institutionalized and algorithmically covered segment of the US equity market. Small- and mid-cap stocks are characterized by lower institutional ownership, thinner analyst coverage, and reduced algorithmic participation—all conditions that amplify the relative influence of retail investor attention [16,21]. Fluency effects may therefore remain detectable in the small-cap universe, where heuristic-based trading constitutes a larger share of order flow and arbitrage capital is less readily deployed.
Geographic context. The US equity market is the world’s most liquid and algorithmically developed. Markets with lower levels of institutional sophistication, lower algorithmic penetration, or higher retail participation (e.g., certain Asian or emerging markets) may exhibit residual behavioral effects that are efficiently suppressed in the S&P 500 setting.
Market regimes. Periods of extreme Liquidity stress or market dislocation may temporarily suspend the efficient correction of behavioral anomalies, as arbitrage capital is withdrawn and retail traders dominate price formation. Examining whether fluency effects re-emerge during crisis windows—when the mechanisms that suppress them are temporarily inactive—represents a natural extension of this work.
Alternative outcome variables. The present study focuses on long-run risk-adjusted returns (FF3 alpha) as the primary outcome. It is possible that fluency effects persist in other outcome variables even in large-cap markets—such as trading volume, short-term return reversals, retail order flow, or search-based attention metrics—even in settings where return-based pricing effects are fully arbitraged. Distinguishing between “bias in attention” and “bias in pricing” is an important refinement that future research should address explicitly [16,21].
These boundary conditions transform the present null result from a simple negative finding into a contribution that maps the limits of behavioral anomalies in modern markets.
4.4. The Scientific Value of a Null Result in Behavioral Finance
A null result in Behavioral Finance is not a negative finding: it is a meaningful scientific contribution that advances theoretical understanding by establishing boundary conditions. The absence of a detectable fluency or alphabet premium in the 2021–2024 S&P 500 sample is informative precisely because it was not guaranteed. Behavioral finance theory provides credible a priori reasons to expect an effect—the psychological evidence for Processing Fluency is robust and extensively replicated across multiple domains [4,5,15]. The fact that this effect does not survive in the modern large-cap setting is an empirical statement about the boundary conditions of the theory, not a refutation of the underlying cognitive mechanism.
This framing positions the present study within a growing literature that uses null results to map the limits of behavioral anomalies. McLean and Pontiff [18] show that anomalies decay post-publication as arbitrageurs exploit them; Schwert [19] documents the secular weakening of documented effects as markets mature, and the Adaptive Market Hypothesis [28] explicitly predicts that anomalies evolve as market structure and participant composition change. Our result fits squarely within this paradigm: cognitive biases in nominal cues were plausibly operative in less efficient historical market environments [4,7], have been arbitraged away in the current algorithmic environment for large-cap stocks, and may re-emerge under different institutional conditions (see Section 4.3). Framing a null result as a boundary condition—rather than merely a failure to find an effect—is both theoretically richer and more practically useful for the research community.
4.5. Caveats on Theoretical Extrapolation
While we interpret the null result as consistent with the Market Efficiency Mechanism, we emphasize several important caveats that constrain the scope of theoretical extrapolation:
First, the null result establishes a boundary condition rather than a universal refutation of Processing Fluency Theory. The absence of pricing effects in the S&P 500 does not imply absence in other market segments.
Second, our test is indirect: we do not directly measure algorithmic trading intensity or HFT participation rates. The theoretical interpretation relies on the presumed dominance of algorithmic arbitrage in the S&P 500 during 2021–2024. The direct measurement of HFT intensity—for example, using LOBSTER data, odd–lot trades, or cross-market latency metrics—would substantially strengthen causal claims.
Third, the null result is sample specific. Temporal instability of market structure (e.g., regulatory changes affecting HFT and episodes of market stress) could alter the boundary conditions. Replication across different time periods and market regimes is essential before generalizing.
Fourth, our focus on risk-adjusted returns (FF3 alpha) may miss fluency effects that operate on other margins—trading volume, short-term return reversals, bid-ask spreads, or attention-based proxies—where behavioral effects might persist even in the absence of return-based anomalies.
These caveats underscore that our contribution is to map one specific boundary condition (large-cap, liquid, and algorithmically dominated markets in the early 2020s) rather than to resolve the broader theoretical debate about behavioral pricing.
5. Conclusions
This paper revisited the “Alphabet Effect” and “Ticker Fluency” bias through the lens of modern data science. By applying a text-processing algorithm to the S&P 500 constituents over the expanded 2021–2024 period, we tested whether linguistic simplicity or alphabetical ordering translates into financial asymmetry.
Our results provide a robust challenge to the “Name Complexity Hypothesis” for large-cap stocks. Using a multivariate regression model controlling for Liquidity and Sector Fixed Effects, we found no statistically detectable difference in risk-adjusted returns between high-fluency and low-fluency tickers. The narrow confidence intervals around our estimates suggest that the economic magnitude of any potential cognitive bias is negligible.
We conclude that while heuristics remain a fundamental aspect of human psychology, their capacity to influence asset pricing in mature, highly liquid markets has been effectively nullified. The structural symmetry observed in risk profiles and returns supports the Adaptive Market Hypothesis [28], suggesting that in the current environment—dominated by algorithmic execution—ticker symbols are processed as neutral identifiers rather than linguistic signals. Importantly, this null result constitutes a positive scientific contribution: the absence of a behavioral premium in the S&P 500 maps the boundary conditions of Processing Fluency Theory, establishing that arbitrage forces in algorithm-dominated markets are sufficiently powerful to neutralize nominal biases that demonstrably influence human cognition. This finding refines rather than refutes the Behavioral Finance framework, and is precisely the kind of theoretically grounded null result that the Adaptive Market Hypothesis predicts.
Future research should investigate the specific boundary conditions under which nominal biases do survive: (i) in smaller, less liquid markets—small-cap equities, OTC markets, and cryptocurrency exchanges—where algorithmic participation is lower and retail order flow is proportionally larger; (ii) in non-US market settings with lower institutional coverage and slower information incorporation; (iii) during periods of market dislocation or extreme illiquidity, when arbitrage capital is withdrawn and noise traders temporarily dominate price formation; and (iv) using outcome variables beyond long-run risk-adjusted returns, such as trading volume, short-term return reversals, or search-based attention metrics, where fluency effects may persist even in settings where return-based pricing anomalies have been fully arbitraged away. Mapping these boundary conditions will transform the present null result from a market-specific finding into a contribution to the broader theory of how cognitive biases interact with market structure across different institutional environments.
Funding
This research received no external funding.
Data Availability Statement
Publicly available datasets were analyzed in this study. The data supporting the findings of this study (market data and constituent lists) are available from public sources. The specific Python 3.12 code developed for the heuristic analysis is available from the corresponding author upon reasonable request.
Conflicts of Interest
The author declare no conflict of interests.
Appendix A. Sensitivity Analysis of Fluency Score
To ensure that our null results are not an artifact of the specific penalty parameter used in the fluency algorithm, we performed a sensitivity analysis. We re-calculated the Ticker Fluency Score using different penalty weights () for consonant clusters and repeated the High vs. Low Fluency group comparison (t-test).
Table A1 reports the difference in mean annualized Fama-French 3-Factor Alpha between the top and bottom fluency tertiles. In all specified scenarios, the difference remains statistically insignificant (), confirming the robustness of our findings.
Table A1.
Robustness Check. Difference in Annualized Fama-French 3-Factor Alpha between High and Low Fluency portfolios across varying penalty parameters ().
Table A1.
Robustness Check. Difference in Annualized Fama-French 3-Factor Alpha between High and Low Fluency portfolios across varying penalty parameters ().
| Penalty () | Mean Diff. | t-Stat | p-Value |
|---|---|---|---|
| 0.05 | 0.48% | 0.37 | 0.710 |
| 0.10 (Baseline) | 0.54% | 0.42 | 0.672 |
| 0.20 | 0.80% | 0.64 | 0.525 |
Appendix B. Additional Robustness Checks
To further establish the robustness of the null result beyond the -sensitivity analysis, we conducted three additional specification tests.
Appendix B.1. Alternative Performance Measure: CAPM Alpha
We re-estimated individual stock abnormal returns using the single-factor Capital Asset Pricing Model (CAPM) rather than the Fama-French 3-Factor model. The CAPM alpha for stock i is obtained from
Table A2 reports the cross-sectional regression results using annualized CAPM alpha as the dependent variable. The fluency coefficient remains statistically insignificant (; ), as does the alphabet rank coefficient (; ), confirming that the null result is not an artifact of the specific risk model employed.
Table A2.
Robustness: CAPM alpha as dependent variable. Cross-sectional OLS with Sector Fixed Effects and HC3 standard errors.
Table A2.
Robustness: CAPM alpha as dependent variable. Cross-sectional OLS with Sector Fixed Effects and HC3 standard errors.
| Factor | Coef () | Std. Err. | t-Stat | p-Value |
|---|---|---|---|---|
| Fluency Score (Z) | 0.0041 | 0.006 | 0.73 | 0.468 |
| Alphabet Rank (Z) | −0.0031 | 0.006 | −0.51 | 0.612 |
Appendix B.2. Industry-Level Subsample Analysis
To verify that the null result is not driven by the particular sector composition of the S&P 500, we estimated separate regressions for the three largest GICS sectors: Information Technology (), Financials (), and Health Care (). Table A3 reports the fluency and alphabet rank coefficients for each subsample. In all three sectors, both coefficients are statistically insignificant (all ), indicating that the null result holds within homogeneous industry groups and is not an artifact of cross-sector averaging.
Table A3.
Robustness: Sector Subsample Analysis. Fluency and Alphabet Rank coefficients within the three largest GICS sectors.
Table A3.
Robustness: Sector Subsample Analysis. Fluency and Alphabet Rank coefficients within the three largest GICS sectors.
| Sector | p-Value | p-Value | ||
|---|---|---|---|---|
| Information Technology | 0.0052 | 0.412 | −0.0038 | 0.554 |
| Financials | 0.0028 | 0.681 | −0.0019 | 0.788 |
| Health Care | 0.0044 | 0.523 | −0.0041 | 0.562 |
Appendix B.3. Winsorization Sensitivity
To ensure that outliers do not drive the results, we varied the winsorization thresholds applied to FF3 alpha from the baseline (1%, 99%) to more aggressive levels. Table A4 reports the fluency coefficient under three winsorization schemes. The results are stable across all specifications, with all p-values exceeding 0.45.
Table A4.
Robustness: winsorization sensitivity. Fluency coefficient under alternative outlier treatments.
Table A4.
Robustness: winsorization sensitivity. Fluency coefficient under alternative outlier treatments.
| Winsorization | Std. Err. | p-Value | |
|---|---|---|---|
| (1%, 99%)—Baseline | 0.0036 | 0.005 | 0.495 |
| (2.5%, 97.5%) | 0.0033 | 0.005 | 0.512 |
| (5%, 95%) | 0.0029 | 0.004 | 0.481 |
Taken together, these additional robustness checks confirm that the null result is not sensitive to the choice of risk model, sector composition, or outlier treatment.
References
- Fama, E.F. Efficient Capital Markets: A Review of Theory and Empirical Work. J. Financ. 1970, 25, 383–417. [Google Scholar] [CrossRef]
- Pagliaro, A. Artificial intelligence vs. efficient markets: A critical reassessment of predictive models in the big data era. Electronics 2025, 14, 1721. [Google Scholar] [CrossRef]
- Simon, H.A. A Behavioral Model of Rational Choice. Q. J. Econ. 1955, 69, 99–118. [Google Scholar] [CrossRef]
- Alter, A.L.; Oppenheimer, D.M. Predicting short-term stock fluctuations by using Processing Fluency. Proc. Natl. Acad. Sci. USA 2006, 103, 9369–9372. [Google Scholar] [CrossRef]
- Reber, R.; Schwarz, N.; Winkielman, P. Processing Fluency and Aesthetic Pleasure: Is Beauty in the Perceiver’s Processing Experience? Personal. Soc. Psychol. Rev. 2004, 8, 364–382. [Google Scholar] [CrossRef]
- Itzkowitz, J.; Itzkowitz, J.; Rothbort, S. ABCs of Trading: Behavioral Biases affect Stock Turnover and Value. Financ. Rev. 2016, 20, 663–692. [Google Scholar] [CrossRef]
- Green, T.C.; Jame, R. Company name fluency, investor recognition, and firm value. J. Financ. Econ. 2013, 109, 813–834. [Google Scholar] [CrossRef]
- Head, A.; Smith, G.; Wilson, J. Would a Stock by Any Other Ticker Smell as Sweet? Q. Rev. Econ. Financ. 2009, 49, 551–561. [Google Scholar] [CrossRef]
- Hendershott, T.; Jones, C.M.; Menkveld, A.J. Does Algorithmic Trading Improve Liquidity? J. Financ. 2011, 66, 1–33. [Google Scholar] [CrossRef]
- Brogaard, J.; Hendershott, T.; Riordan, R. High-Frequency Trading and Price Discovery. Rev. Financ. Stud. 2014, 27, 2267–2306. [Google Scholar] [CrossRef]
- Malkiel, B.G. The Efficient Market Hypothesis and Its Critics. J. Econ. Perspect. 2003, 17, 59–82. [Google Scholar] [CrossRef]
- Fama, E.F. Efficient Capital Markets: II. J. Financ. 1991, 46, 1575–1617. [Google Scholar] [CrossRef]
- Shleifer, A. Inefficient Markets: An Introduction to Behavioral Finance; Oxford University Press: Oxford, UK, 2000. [Google Scholar]
- Shiller, R.J. From Efficient Markets Theory to Behavioral Finance. J. Econ. Perspect. 2003, 17, 83–104. [Google Scholar] [CrossRef]
- Kahneman, D. Thinking, Fast and Slow; Farrar, Straus and Giroux: New York, NY, USA, 2011. [Google Scholar]
- Da, Z.; Engelberg, J.; Gao, P. In Search of Attention. J. Financ. 2011, 66, 1461–1499. [Google Scholar] [CrossRef]
- Menkveld, A.J. High Frequency Trading and the New Market Makers. J. Financ. Mark. 2013, 16, 712–740. [Google Scholar] [CrossRef]
- McLean, R.D.; Pontiff, J. Does Academic Research Destroy Stock Return Predictability? J. Financ. 2016, 71, 5–32. [Google Scholar] [CrossRef]
- Schwert, G.W. Anomalies and Market Efficiency. In Handbook of the Economics of Finance; Constantinides, G., Harris, M., Stulz, R., Eds.; Elsevier: Amsterdam, The Netherlands, 2003; Volume 1, pp. 939–974. [Google Scholar]
- Cooper, M.J.; Dimitrov, O.; Rau, P.R. A Rose.com by Any Other Name. J. Financ. 2001, 56, 2371–2388. [Google Scholar] [CrossRef]
- Barber, B.M.; Odean, T. All That Glitters: The Effect of Attention and News on the Buying Behavior of Individual and Institutional Investors. Rev. Financ. Stud. 2008, 21, 785–818. [Google Scholar] [CrossRef]
- O’Hara, M. High Frequency Market Microstructure. J. Financ. Econ. 2015, 116, 257–270. [Google Scholar] [CrossRef]
- Chordia, T.; Roll, R.; Subrahmanyam, A. Recent Trends in Trading Activity and Market Quality. J. Financ. Econ. 2011, 101, 243–263. [Google Scholar] [CrossRef]
- Pagan, A. Econometric Issues in the Analysis of Regressions with Generated Regressors. Int. Econ. Rev. 1984, 25, 221–247. [Google Scholar] [CrossRef]
- Amihud, Y. Illiquidity and Stock Returns: Cross-Section and Time-Series Effects. J. Financ. Mark. 2002, 5, 31–56. [Google Scholar] [CrossRef]
- Chaboud, A.P.; Chiquoine, B.; Hjalmarsson, E.; Vega, C. Rise of the Machines: Algorithmic Trading in the Foreign Exchange Market. J. Financ. 2014, 69, 2045–2084. [Google Scholar] [CrossRef]
- Pagliaro, A. Forecasting significant stock market price changes using machine learning: Extra trees classifier leads. Electronics 2023, 12, 4551. [Google Scholar] [CrossRef]
- Lo, A.W. The Adaptive Markets Hypothesis. J. Portf. Manag. 2004, 30, 15–29. [Google Scholar] [CrossRef]


Disclaimer/Publisher’s Note: The statements, opinions and data contained in all publications are solely those of the individual author(s) and contributor(s) and not of MDPI and/or the editor(s). MDPI and/or the editor(s) disclaim responsibility for any injury to people or property resulting from any ideas, methods, instructions or products referred to in the content. |
© 2026 by the author. Licensee MDPI, Basel, Switzerland. This article is an open access article distributed under the terms and conditions of the Creative Commons Attribution (CC BY) license.