Abstract
To tackle the safety performance concerns of Squat shear walls in nuclear island structures (which serve as shields for powerhouses) under seismic action, this research endeavors to explore the seismic performance of such shear walls with different reinforcement ratios. Pseudo-static loading tests were carried out on 6 shear wall specimens, which were divided into 3 groups (with different reinforcement ratios). The focus was on analyzing the specimens’ failure process, load-deformation hysteretic curves, shear strength, ductility, strain, and other crucial parameters. The experimental findings demonstrate that all specimens underwent shear failure, which was characterized by the compression of web concrete. A higher reinforcement ratio can alleviate the buckling extent of structural steel. Specifically, an elevated horizontally distributed steel ratio notably enhances the ductility and energy dissipation capacity of the specimens, thereby effectively improving the yield load, stiffness, and ductility of squat shear walls. Nevertheless, its influence on cumulative energy dissipation and crack development is limited. Based on the analysis of the specimens’ failure modes, hysteretic curves, skeleton curves, energy dissipation, and stiffness degradation laws, finite-element numerical analysis was carried out on selected specimens. Comparison with the experimental results showed a good consistency between the two. Ultimately, the influence of the reinforcement ratio on the seismic performance of the shear walls was ascertained, and the research on the variation rules of the seismic performance parameters of squat shear walls was completed after verification through finite-element modeling. Based on this, a nonlinear fitting approach was employed to construct a regression prediction model for the seismic performance of shear walls in the Hainan Changjiang Multipurpose Modular Small Reactor Technology Demonstration Project. Typical squat shear walls were chosen for seismic response analysis, and the corresponding outcomes were acquired. Finally, a series of seismic vulnerability curves for nuclear island shear walls with varying guarantee rates were formulated for verification.
1. Introduction
The 2011 Fukushima nuclear disaster significantly underscored the inherent risks associated with nuclear facilities subjected to seismic events surpassing their design basis. This event catalyzed a fundamental paradigm shift in global nuclear safety standards, transitioning from the conventional “strength assurance” methodology to a “performance-based” framework. Contemporary regulatory codes, exemplified by the IAEA SSG-9, ASCE/SEI 43-05, and China’s Seismic Design Code for Nuclear Power Plants (GB 50267-2019) [1], mandate that containment structures and internal components satisfy explicit performance criteria across multiple seismic intensity levels. Furthermore, these standards emphasize the critical role of probabilistic risk assessments. Consequently, this evolution has introduced unprecedentedly rigorous evaluation demands concerning the seismic performance of primary lateral force-resisting elements within nuclear power plants, specifically the reinforced concrete low shear walls of the nuclear island. These structural components are characterized by distinctive features, including low height-to-width ratios, elevated axial compression, and substantial cross-sectional thickness. The intricate nonlinear behavior and progressive damage mechanisms of these walls under seismic loading are pivotal determinants of the nuclear island’s overall safety and structural integrity, thereby necessitating comprehensive and detailed investigation. As a crucial element of the structural system in multi-story residential buildings, squat shear walls are extensively employed in seismic design. Currently, the majority of seismic research on squat shear walls centers around energy-dissipating structures. For instance, steel-reinforced concrete is utilized to enhance the bearing capacity, deformation capacity, and energy-dissipating capacity of squat shear walls. Low-cycle reversed loading tests on symmetric double short-pier shear walls have demonstrated that these shear walls exhibit superior ductility and energy dissipation capacity. In conclusion, both the monolithic and double-pier characteristics have a significant impact on the seismic design of squat shear walls. The effective identification of the deformation characteristics of squat shear walls directly influences the seismic checking calculation and structural design of shear walls. The existing approach for identifying the types of squat shear walls is primarily the monolithic coefficient method based on empirical judgment. According to the mode superposition method and the base shear method, the primary characteristic of the lateral deformation of squat shear walls can be represented by their fundamental vibration mode. Based on the orthogonal theory, a complete orthogonal basis for the plane deformation decomposition of 4-node square elements was established, which facilitates the deformation decomposition of squat shear walls and the relative deformation decomposition of their fundamental vibration mode. Moreover, based on the analysis of the fundamental vibration mode of shear walls, an intuitive and effective method for identifying the types of squat shear walls was proposed. A comparative analysis with the monolithic coefficient method reveals that the latter misidentifies some monolithic shear walls as double-pier shear walls, a problem that demands sufficient attention in shear wall design.
As a clean energy source, nuclear power presents irreplaceable advantages when compared to fossil fuels such as coal, oil, and natural gas. In recent years, nuclear power projects have experienced rapid global development. In March 2011, a magnitude 9.0 earthquake in Japan triggered the Fukushima nuclear leakage accident, which disrupted the global supply chain and led to economic losses exceeding 300 billion US dollars. The explosion and nuclear radiation disaster resulting from this incident served as a cautionary example for the construction of nuclear power plants across the world. Nuclear island squat shear walls are extensively employed to mitigate structural lateral displacement and resist lateral forces owing to their substantial lateral stiffness and high strength. Generally, shear walls with an aspect ratio (height-to-span ratio) less than 2 are categorized as squat shear walls, which exhibit higher lateral stiffness and load-bearing capacity. Such walls are also commonly utilized in structures with stringent requirements for lateral stiffness, such as industrial buildings and nuclear power plants featuring large bays and significant depths. Research has indicated that this type of low-rise wall tends to undergo brittle shear failure after reaching its peak strength, accompanied by a rapid decline in both strength and stiffness. Recent studies have made certain progress in the seismic performance of low-rise shear walls in nuclear island structures. For instance, experiments have been conducted to explore the potential application of new materials such as high-strength steel bars and steel plate–concrete composite walls. Additionally, the integration of machine learning and high-fidelity simulation has enhanced the capability for performance prediction. However, significant gaps remain in current research, mainly in three aspects:
- (1)
- Shortage of experimental data: There is a severe lack of systematic test data that can accurately reflect extreme working conditions of nuclear islands—such as extremely high axial compression, very low aspect ratios, and full-scale dimensions—which casts doubt on the reliability of numerical models.
- (2)
- Lack of mechanistic correlation: Effective quantitative models have yet to be established linking micro-scale material damage (concrete cracking, steel bar buckling) to macro-scale structural performance limit states, and further to fragility parameters required for plant-level probabilistic safety assessment.
- (3)
- Limitations in analytical methods: Performance-oriented probabilistic seismic fragility analysis methods tailored to specific nuclear island components are still underdeveloped, making it difficult to directly support accurate risk-informed decision-making.
These shortcomings constrain a scientific understanding and reliable evaluation of the seismic safety of shear walls in nuclear island structures.
On the other hand, the reinforcement ratio plays a crucial role in the seismic performance of the wall. Generally, a higher reinforcement ratio leads to better ductility and seismic resistance of the wall. Therefore, conducting research on the structural characteristics and seismic behavior of squat shear walls holds significant practical implications [2]. As a novel type of lateral force-resistant component, nuclear island squat shear walls are being increasingly utilized in high-rise buildings, high-rise structures, and other civil engineering projects. Currently, domestic and foreign scholars have carried out numerical simulations and experimental investigations on the axial compression performance, flexural behavior, and overall structural stress characteristics of nuclear island squat shear walls in civil engineering structures [3,4,5,6,7,8,9].
Zhang L et al. [10], Zhou B et al. [11], and Wang K et al. [12] investigated the mechanical properties of steel-concrete composite shear walls under vertical axial compression, monotonic loading, and cyclic loading. They deduced the calculation formula for the bearing capacity of composite walls and analyzed their load-bearing characteristics. Finite element numerical simulations were utilized to analyze the test results under in-plane shear loading, and the elastic buckling coefficient and the corresponding design method were put forward. Through these investigations, the load–displacement curves, strength, stiffness, strain distribution patterns, steel-concrete interaction mechanisms, and failure modes of composite shear walls were acquired. Existing research is predominantly carried out via small-scale model tests and numerical simulations. Some studies [13,14,15,16] proposed the design theory for squat shear walls based on experimental results. Huang W et al. [17] found that the quantity and distribution of web reinforcement are the primary factors affecting the shear-bearing capacity of squat shear walls. Other studies [18,19,20] disclosed that increasing the shear-span ratio of squat shear walls alters their failure mode, specifically from shear failure to flexural failure, while concurrently reducing their deformation capacity and energy dissipation capacity. Francesco M et al. [21] indicated that a higher axial compression ratio is more likely to induce shear failure while leading to higher shear strength. Yiwen W et al. [22] examined the influence of the axial compression ratio on the shear-bearing capacity and ultimate displacement ratio of squat shear walls. Additionally, some researchers have reported that although axial tension reduces the shear-bearing capacity, lateral stiffness, and energy dissipation capacity, it improves the ultimate deformation capacity and ductility of squat shear walls [23,24,25,26].
Upon a comprehensive review of domestic and international research on shear walls, it is discovered that several crucial parameters, namely the shear-span ratio, the ratio of opening area to wall area, opening location, and the number of openings, have a substantial impact on the seismic performance of shear walls. According to relevant experimental and finite-element simulation findings: as the ratio of opening area to wall area rises, the shear-bearing capacity and cracking load gradually decline, while the horizontal displacement of perforated shear walls increases significantly, accompanied by evident stiffness degradation and enhanced ductility. Moreover, the maximum shear stress of the wall increases, and stress concentration occurs at the corners of the openings. When this area ratio reaches a certain critical value, the stiffness of the coupling beams above the openings drops precipitously; during the loading process, the coupling beams first develop cracks and eventually fail prematurely. Reducing the shear-span ratio leads to a marked increase in lateral bearing capacity and lateral stiffness, yet results in reduced ductility, weakened energy-dissipation capacity, obvious stiffness degradation, and a failure mode that tends towards brittle failure. Meanwhile, relevant literature suggests that the opening location also exerts a considerable influence on the mechanical performance of shear walls: the farther the horizontal position of the opening is from the load-application point, the more significant the reduction in stiffness and the increase in top displacement, along with a decreased cracking load and shear-bearing capacity. Furthermore, the cracking degree of shear walls with eccentric openings is more severe than that of those with centrally located openings. Changes in opening location have a substantial effect on the stress distribution, crack distribution, and maximum shear stress of shear walls. However, a thorough analysis of existing domestic and international studies reveals significant research deficiencies: most existing studies focus on solid shear-wall structures, while only a few explore perforated shear walls with large shear-span ratios. In contrast, the shear-span ratio of perforated shear walls in actual nuclear power plant projects is relatively small. Moreover, among the limited studies on perforated shear walls with low shear-span ratios, the specimens typically adopt small scale factors, leading to inherent size effects that significantly affect the experimental results. Additionally, both experimental and simulation studies on such shear walls involve a small number of specimens, resulting in insufficient test data that lacks adequate comparability.
Consequently, existing research fails to offer sufficient support for formulating the failure criteria and performance equations of squat perforated shear walls in nuclear power plants. Conducting a substantial number of comparative tests on squat perforated shear walls that align with the actual engineering conditions of nuclear power plants holds significant importance. Although extensive research has been carried out on the seismic performance of squat reinforced concrete shear walls, the existing results still exhibit several crucial limitations that hinder their direct application in high-safety-grade structures such as nuclear islands. Most experimental and numerical investigations rely on scaled specimens or simplified two-dimensional models, which are unable to comprehensively capture the mechanical behavior of full-scale, three-dimensional nuclear island walls under actual seismic conditions, particularly the effects of interactions among floor slabs, adjacent wall piers, and foundations. A large proportion of research efforts have concentrated on analyzing the failure modes and load-bearing capacity of the walls themselves, yet have not effectively correlate the micro-mechanical properties of the walls with macro-level probabilistic risk assessment. The methodology for converting the nonlinear behaviors of walls (e.g., damage indices) into fragility curves for the probabilistic safety assessment of the overall structure remains under-developed, lacking a comprehensive performance-based analysis framework.
In recent years, some studies have continued to employ pseudo-static tests to investigate the performance of complex shear wall systems [27,28]. In addition, advanced numerical simulation techniques have been utilized to gain deeper insights into the hysteretic behavior of such structural components. This study aims to directly address the aforementioned research gaps by integrating high-fidelity numerical simulation, machine learning, and probabilistic engineering analysis methods, thereby providing a systematic performance evaluation and fragility analysis framework specifically tailored to nuclear island squat shear walls. The specific contributions of this study are as follows:
- (1)
- Establishment of a nuclear-island-specific 3D wall performance database and regression prediction model
Considering the structural and mechanical characteristics of nuclear island squat shear walls, a library of 3D nonlinear finite element models was constructed, incorporating key design parameters (e.g., reinforcement ratio, axial compression ratio, aspect ratio) and boundary conditions. Based on this model library, a machine learning regression model capable of accurately predicting critical engineering demand parameters (e.g., drift ratio, concrete damage index) of nuclear island walls under varying seismic intensities was developed for the first time, filling the gap in background-specific models within this domain.
- (2)
- Development of a performance-based fragility analysis method enabling “from micro-performance to macro-risk” translation
The aforementioned regression prediction model was innovatively embedded as a capacity evaluation module into the demand analysis workflow based on incremental dynamic analysis (IDA). This method directly establishes a quantitative correlation between wall design parameters and their failure probabilities under different limit states (e.g., minor damage, severe collapse), achieving a seamless connection from component-level nonlinear analysis to system-level probabilistic risk assessment.
- (3)
- Provision of case validation and engineering insights for typical nuclear island structures
Through a comprehensive case study on a typical nuclear island structure, the full-process application of the proposed framework was demonstrated. This not only generated practical fragility curves for the squat shear walls of the structure but also identified the key design parameters influencing their fragility, thereby providing direct support for seismic performance optimization and risk-informed decision-making in nuclear island structures. To address the aforementioned limitations, this study aims to deliver three corresponding core contributions:
Firstly, by conducting refined numerical simulations and parametric analyses that incorporate the typical structural features of nuclear islands, this work seeks to bridge the gap in high-fidelity performance data, thereby deepening the understanding of the complex failure mechanisms in low-rise shear walls.
Secondly, through in-depth analysis of the damage accumulation process in walls under multi-directional seismic actions, this research endeavors to establish a quantitative mapping relationship between micro-scale damage indicators and macro-scale engineering demand parameters, preliminarily linking microscopic damage mechanisms with macroscopic performance evaluation.
Finally, a probabilistic seismic fragility analysis framework tailored for low-rise shear walls in nuclear island structures is proposed. By generating component-level fragility curves, it provides essential inputs for reliably integrating structural responses into the overall probabilistic safety assessment of nuclear power plants, thereby advancing the practical application of performance-based seismic design in nuclear engineering.
In conclusion, the principal incremental scientific contribution of this research resides in the integration of nuclear-island-specific contexts, three-dimensional realistic behavioral simulation, data-driven performance prediction, and probabilistic fragility assessment. It fills the methodological gap between the refined performance characterization of specific components and the quantitative assessment of seismic risks for the entire structure.
2. Test Plan
2.1. Specimen Setup
In this study, the specimens are categorized into Group L and Group S, primarily distinguished by their sectional height. Group L specimens feature a relatively larger shear span ratio (λ ≈ 0.5), whereas Group S specimens have a smaller shear span ratio (λ ≈ 0.3). This design aims to investigate the independent influence of geometric dimensions—particularly the shear span ratio—on the failure modes and seismic performance of low-rise shear walls, as well as its coupling effect with reinforcement ratios, under comparable reinforcement conditions. As shown in Table 1, each group includes three levels of reinforcement ratio (low, medium, and high), enabling the separation and comparison of geometric effects and material strengthening effects. Six groups of squat shear wall specimens with different reinforcement ratio parameters were experimentally tested. These specimens were classified into Group L and Group S according to their cross-sectional dimensions. Within each group, the three specimens share an identical ratio of horizontal to vertical reinforcement, while each specimen has a unique total reinforcement ratio. The detailed design specifications are presented in Table 1 and Figure 1.

Table 1.
Design details of the specimen reinforcement.
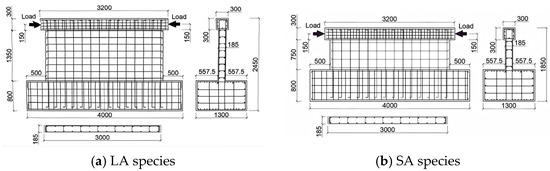
Figure 1.
Design size of specimens.
All specimens were constructed using C40 concrete (with a grade of 40 MPa) and HRB400 steel (with a grade of 400 MPa). Each specimen maintains a constant ratio of vertical to transverse reinforcement. The top load-bearing beam was designed with dimensions of 300 mm × 300 mm × 3200 mm, reinforced with 10Φ25 longitudinal bars and Φ10@100 stirrups. The bottom bearing beam was designed with dimensions of 1300 mm × 800 mm × 4000 mm, reinforced with 32Φ25 longitudinal bars, supplemented with 6Φ10 web reinforcement, and equipped with Φ10@50/100 stirrups.
All specimens were engineered to fail in a shear-dominated manner. Shear connectors with a diameter of 10 mm were arranged on both the flanges and webs of the steel components within the shear wall, aiming to guarantee efficient shear transfer between the concrete and steel elements. Jacks installed at the bottom of the shear wall were employed to rectify installation errors and attain precise positioning (refer to Figure 2). Additionally, short steel bars were welded to the steel members in the foundation zone to improve the anchoring performance.
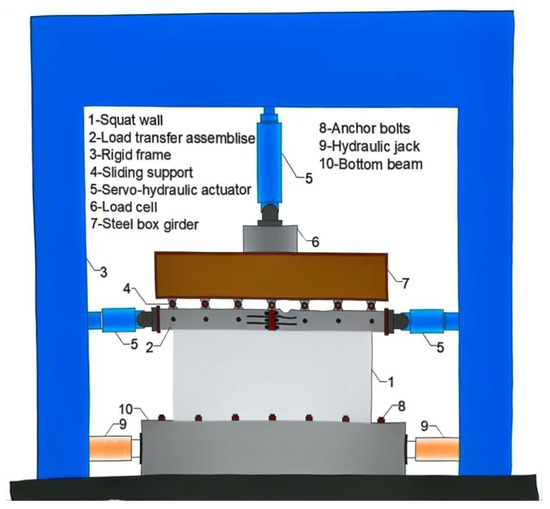
Figure 2.
The leading device of Squat wall.
The properties of the concrete and steel used in the specimens are shown in Table 2.
Table 2.
The mechanical properties of the rebar.
All specimens were designed in accordance with the principle of “strong shear, weak bending” to ensure that shear-dominated failure would occur during actual testing. In the design phase, the nominal flexural capacity (Mn) and nominal shear capacity (Vn) of each specimen under the given axial load and reinforcement layout were calculated according to the Code for Design of Concrete Structures (GB 50010-2010) [29] and Code for Seismic Design of Buildings (GB 50011-2010) [30]. The results indicate that for all specimens, the ratio Vn/(Mn/Lw) is less than 1.0 (where (Lw) is the wall length), meaning the designed shear strength is lower than the shear force corresponding to flexural failure. This design ensures that under horizontal loading, the specimens will reach their shear capacity before attaining their flexural capacity, thereby achieving the intended shear-dominated failure mode. The failure patterns observed in the tests confirm this design intention.
2.2. Experimental Device
In this experiment, a 30,000 kN multifunctional loading system developed by the Harbin Institute of Technology was utilized for loading. The horizontal sliding function of this system allows for the application of constant vertical loading even when the specimen experiences horizontal displacement. Moreover, rigid displacement is eliminated through the integration of horizontal jacks, steel beams, and supporting structures within the system. Each specimen was firmly anchored to the ground via a reinforced concrete foundation block and high-strength threaded rods. During the experiment, a vertical hydraulic jack, in combination with a steel beam possessing sufficient flexural stiffness, was employed to apply uniform axial compression to the shear wall. All specimens in this study were tested under a cantilever configuration, using the test setup depicted in Figure 2.
2.3. Loading Plan
Prior to the application of cyclic lateral loading, the pre-designed axial load was applied to the top of each specimen and maintained constant throughout the entire test. Lateral loading was applied by controlling the lateral displacement at the loading height of the specimen. During the test, the vertical axial load was sustained to ensure a constant axial load ratio of 0.3 for the shear wall. Subsequently, horizontal loading was exerted by two symmetrically-arranged horizontal servo-hydraulic actuators.
A hybrid loading protocol was employed in the test: before the appearance of visible cracks on the squat shear wall, loading was carried out under load control, with one cycle repeated at each load level. Once cracks manifested, the loading mode was switched to displacement control, with two cycles executed at each displacement stage. The loading process was halted when the specimen failed or the horizontal load decreased to approximately 85%of the peak load. Specifically, before the specimen yielded, only one loading cycle was applied at each displacement level; after the displacement exceeded the yield displacement, three cyclic loading repetitions were conducted at each displacement level.
Strain gauges were attached to the steel bars and steel components to monitor their strain evolution, which provided the basis for determining specimen yielding. Specimen yielding was considered to occur when either the steel bars or steel components reached the predefined yield strain of 2000 με, whichever occurred first. Additionally, the test was terminated if either the lateral bearing capacity declined by more than 50%of the peak lateral strength or axial failure took place, with the termination criterion determined by the first-occurring condition. As shown in Figure 3, positive loading denotes the left-to-right pushing force applied to the specimen, while negative loading refers to the pulling force exerted on the specimen from the top.
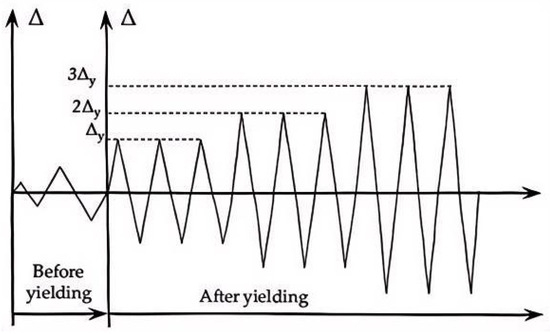
Figure 3.
Loading scheme.
2.4. Measurement Methods
To acquire the strain and displacement data during the entire test, each specimen was equipped with a sufficient quantity of internal strain gauges and external measurement apparatuses. Linear variable differential transformers (LVDTs) were utilized to monitor the top displacement, flexural deformation, shear deformation, and axial deformation of the shear wall. As depicted in Figure 4, internal strain gauges were employed to measure the strains in the steel bars and steel components; these gauges, installed on specialized brackets, were arranged on the rear surface of the wall.
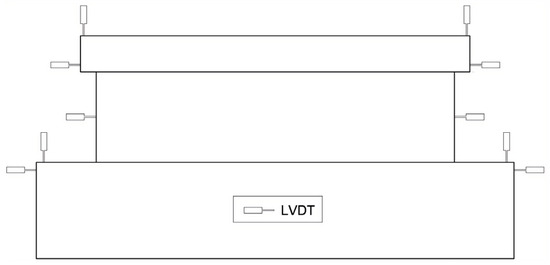
Figure 4.
Measuring instrument layout.
3. Experimental Results Analysis and Discussion
3.1. Hysteresis Curve
By measuring the horizontal load exerted at the top of each specimen and the corresponding horizontal displacement, the horizontal load–displacement hysteresis curve can be obtained. This curve is able to portray the entire evolutionary process of structural deformation and displacement, thereby offering a foundation for assessing the seismic performance of the structure. The hysteresis curves of the three groups of shear wall specimens are shown in Figure 5.
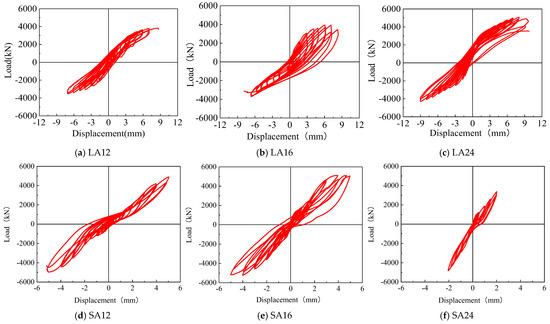
Figure 5.
Hysteresis curve of specimens.
As shown in Figure 5, all hysteresis curves displayed an approximately linear response at the initial loading stage, suggesting that all specimens remained in the elastic state during this period. After the initiation of cracks in the shear walls, the structural stiffness started to gradually degrade as the lateral displacement increased. During the loading process, the load-bearing capacity in the first loading cycle was higher than that in subsequent cycles, which indicated a progressive reduction in the structural strength, stiffness, and load-bearing capacity. Additionally, as the reinforcement ratio of the squat shear walls increased, both the number of load cycles endured and the ultimate displacement attained showed an upward tendency, demonstrating that the deformation resistance of squat shear walls was significantly improved with a higher reinforcement ratio.
3.2. Skeleton Curve
The skeleton curve is defined as the curve formed by connecting the peak load points of each loading cycle. It can not only reflect the load-deformation relationship of the specimens during the entire test process but also serve as a basis for assessing the strength, stiffness, and ductility of the components. The skeleton curves corresponding to the three groups of specimens are shown in Figure 6.
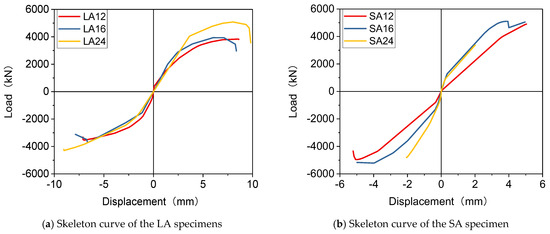
Figure 6.
The skeleton curves of the specimens.
In the initial loading phase, all specimens remained within the elastic range, and the skeleton curves displayed an approximately linear tendency. As the horizontal load increased, cracks initiated, propagated, and continued to evolve gradually. Simultaneously, the reinforcing bars in the specimens shifted from the linear-elastic stage to the elastoplastic stage, and the skeleton curves gradually demonstrated a nonlinear bending trend. Before attaining the maximum horizontal load, the curvature of the skeleton curves decreased gradually, which indicates a continuous deterioration in the structural stiffness of the specimens.
When the load dropped beyond the peak value, the specimens in Group SA experienced continuous displacement growth during the load-declining stage, suggesting that severe damage had occurred to the structure. Conversely, the skeleton curves of Group LA specimens showed no significant descending branch before failure, which represents a sudden failure mode; this finding is consistent with the brittle failure phenomenon observed during the experiment. Overall, increasing the reinforcement ratio can effectively improve the ductility of the specimens and exert a significant impact on their failure modes.
The skeleton curve of Specimen LA24 presented a distinct descending branch, with clearly distinguishable characteristic points (i.e., cracking point, yield point, peak load point, and ultimate point). The significant variation in the curve’s curvature across different stages indicated that this specimen had favorable ductility and energy dissipation capacity.
In contrast, the skeleton curves of Specimens SA16, SA12, and SA24 showed no obvious descending branch or curvature inflection points, remaining approximately linear with minimal curvature variation. This phenomenon implied that the specimens underwent slight stiffness degradation, and their failure occurred without obvious precursors. Additionally, the peak load and ultimate load of these specimens were relatively close, which reflected their inferior ductility and energy dissipation performance.
3.3. Energy Dissipation
The energy dissipation performance of shear wall specimens can serve as an indicator of their seismic performance. This study employs the energy dissipation calculation method for shear wall specimens put forward in the “Seismic Test Code for Buildings”. The calculation formula for the energy dissipation coefficient E is presented as follows:
Here, SABC and SCD respectively signify the areas encircled by the upper loop (A-B-C) and the lower loop (C-D-A) within one full cycle of the load–displacement hysteresis curve, which represent the energy dissipated by the structure during a single loading cycle. SOBE and SODF refer to the areas of the triangles formed by connecting the vertices (B, D) of the corresponding half-loops to the origin (O) of the coordinate system, which represent the theoretical elastic strain energy at the given amplitude, as depicted in Figure 7.
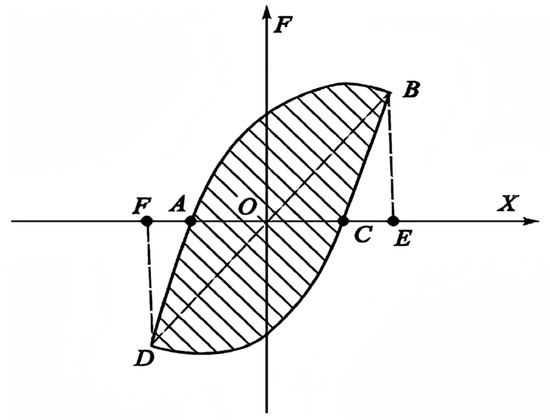
Figure 7.
Calculation diagram of the energy dissipation coefficient.
Through the calculation of the hysteretic curve generated during the first cycle of displacement loading at each stage, the energy dissipation performance of the shear wall is acquired. The calculation results are presented in Table 3 and Table 4.
Table 3.
Energy dissipation per cycle of specimens.
Table 4.
Cumulative energy dissipation of specimens.
From Figure 8, it can be discerned that the energy dissipation coefficient of each specimen undergoes a gradual increase at the initial stage. As the horizontal displacement increases and the specimens subsequently enter the plastic stage, both the energy dissipation coefficient and the energy dissipation capacity display a tendency of rapid growth. The cumulative energy dissipation growth rate of the specimens with the highest reinforcement ratio (SA24 and LA24) is found to be lower than that of the specimens in the other two groups. However, the maximum cumulative energy dissipation is achieved by the specimens with a medium reinforcement ratio (SA16 and LA16), which suggests that the reinforcement ratio exhibits a non-linear influence on the cumulative energy dissipation of squat shear walls. An optimal range (around 1.6% in this study) appears to exist, maximizing the energy dissipation capacity. Both excessively low and very high reinforcement ratios may not lead to the best cumulative energy dissipation, the former due to premature strength degradation, and the latter possibly due to restricted crack development and deformation capacity, especially in walls with very low aspect ratios (e.g., SA group).
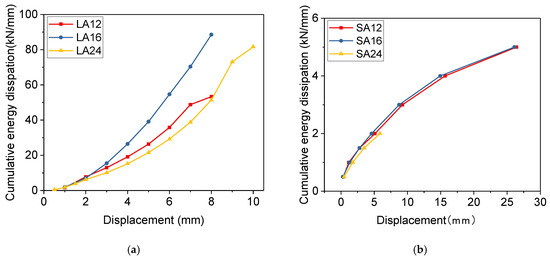
Figure 8.
The curves of energy dissipation of specimens. (a) The curve of cumulative energy dissipation of LA specimens. (b) The curve of cumulative energy dissipation of SA specimens.
As depicted in Figure 8, the analysis of the energy dissipation performance of shear wall specimens leads to the following crucial findings: During the displacement loading stage, the slope of the cumulative energy dissipation-displacement curve for most specimens gradually increases with an increasing number of loading cycles, indicating a progressive acceleration in the growth rate of cumulative energy dissipation. This trend reflects the occurrence of internal damage and stiffness degradation in the specimens as the loading level rises, which in turn contributes to the enhancement of their energy dissipation capacity and rate. Regarding the influence of key parameters, the axial compression ratio has a distinct effect on cumulative energy dissipation: specimens with a smaller axial compression ratio exhibit a higher growth rate of cumulative energy dissipation, better ductility, and a larger ultimate displacement value, suggesting that such specimens can fully dissipate and absorb the input energy. In terms of the shear-span ratio, comparative diagrams show that specimens with a larger shear-span ratio present relatively more complete hysteretic curves, higher energy dissipation coefficients, and greater final cumulative energy dissipation values, demonstrating that a larger shear-span ratio corresponds to superior energy dissipation performance. As for the horizontal reinforcement ratio, the final cumulative energy dissipation of the specimens increases moderately with the increase in the reinforcement ratio within a certain range; however, once the reinforcement ratio exceeds a specific threshold, its influence on cumulative energy dissipation becomes insignificant. Therefore, increasing the horizontal reinforcement ratio within a reasonable range can effectively improve the cumulative energy dissipation of shear wall specimens.
3.4. Ductility Ability
The displacement ductility coefficient, μ, is calculated from the yield displacement (Uy) and the ultimate displacement (Uu). For low-rise shear walls, where shear-dominated failure often results in a backbone curve lacking a distinct yield point, the equivalent energy method recommended by the Specification for Seismic Test of Buildings (JGJ/T 101-2015) was primarily adopted to determine the yield point, as it is widely used in engineering practice [27]. To assess the applicability of this method in the current study, a comparative calculation was also performed using the geometric tangent method (where the yield point is defined as the intersection of the initial stiffness line and the tangent line of the post-peak descending branch [28]). The yield displacements and ductility coefficients obtained from the two methods are compared in the table below. The comparison shows that while the absolute values calculated by the two methods differ, the key trends remain consistent: an increase in the reinforcement ratio enhances member ductility, and specimens in Group S generally exhibit lower ductility than those in Group L. This confirms that the main conclusions of this study are not sensitive to the choice of yield point determination method. Given the prevalence of the equivalent energy method in design codes, its results are used for the subsequent analysis, shown in Table 5.
Table 5.
Comparison of Equivalent Energy Method and Geometric Tangent Method of Skeleton Curve.
The displacement ductility coefficient is used for analysis, and its expression is:
where μ is the ductility coefficient; Uu is the ultimate displacement of the specimen; Uy is the yield displacement of the specimen. The calculation and experimental results are shown in Table 6 and Table 7.
Table 6.
The displacement of each feature point and the ductility factor of the specimens.
Table 7.
The load of each feature point of the specimens.
As is discernible from Figure 9 and Figure 10, squat shear walls present relatively minor ultimate displacement and ductility coefficient values, which implies inferior deformation capacity and sub-optimal ductility performance. With the augmentation of the reinforcement ratio, the cracking displacement, displacement angle, and yield displacement of the three groups of specimens all decline, while the yield load rises correspondingly. This indicates that a higher reinforcement ratio can postpone the occurrence of cracking and yielding in squat shear walls and enhance their stiffness simultaneously. Among the three specimen groups, the SA specimens with the highest reinforcement ratio attain the maximum ultimate displacement, ultimate displacement angle, and ductility coefficient, which demonstrates that an appropriately increased reinforcement ratio is beneficial for improving the ductility of squat shear walls [31,32,33].
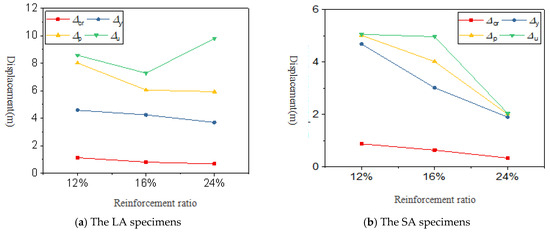
Figure 9.
The relation curve between the reinforcement ratio and the load at feature points.
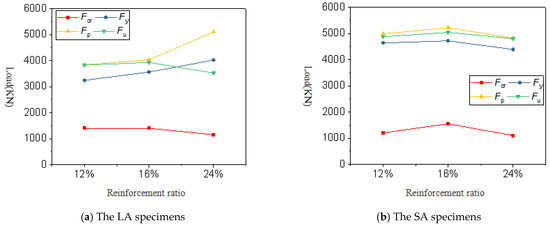
Figure 10.
The relation curve between the reinforcement ratio and the load at feature points.
- (1)
- The ductility coefficient is a crucial index reflecting the ductility of specimens. The ductility coefficients of all six squat shear wall specimens were relatively low, falling below the range of 3–4 stipulated for reinforced concrete seismic structures in the Specification for Seismic Test of Buildings (JGJ/T 101-2015). This is ascribed to the high stiffness and poor deformation resistance of squat shear walls, which lead to small peak and ultimate displacement values, consequently resulting in low ductility coefficients, inferior ductile performance, and a brittle failure mode of the walls.
- (2)
- The average cracking displacement angle of the specimens was merely 0.055% (close to 1/2000), indicating that squat shear walls are characterized by a small cracking displacement. Nevertheless, the average cracking load reached 1165.63 kN, which is close to or even equivalent to the failure load of conventional reinforced concrete shear walls. This manifests the inherent characteristics of reinforced concrete squat shear walls: high stiffness, small deformation, and high loading accuracy.
- (3)
- Calculated by the equal-energy method, the average yield displacement angle of the six specimens was 0.336% (close to 1/300), with an average yield load of 3719.95 kN. These results demonstrate that the specimens still possess substantial post-cracking performance potential. After cracking, as the horizontal load increased, the load–displacement ratio gradually decreased, signifying the occurrence of stiffness degradation and irreversible damage in the specimens during this stage.
- (4)
- The average peak displacement and ultimate displacement of the six specimens were 0.507%and 0.561% (close to 1/200 and 1/180, respectively), while the average peak load and ultimate load were 4451 kN and 4077 kN. After yielding, the specimens experienced accelerated stiffness degradation and aggravated damage. Meanwhile, the peak displacement point and ultimate displacement point of the specimens were in close proximity, indicating that the specimens failed shortly after reaching the peak load without exhibiting an obvious descending branch. This observation is consistent with the brittle-dominated failure phenomenon observed in the tests.
In summary, a smaller shear-span ratio results in a relatively smaller ultimate displacement angle and poorer ductility of the specimens; a lower axial compression ratio leads to a larger ultimate displacement angle and enhanced ductility; and an increase in the horizontal reinforcement ratio can also moderately augment the ultimate displacement angle of the specimens.
3.5. Stiffness Degradation
Under cyclic reversed loading conditions, when the peak load borne by a structural component remains constant, the phenomenon in which the displacement at the peak-load point of the component increases as the number of loading cycles increases is defined as stiffness degradation. The stiffness degradation of box-column model components has an impact on the seismic performance of box-column models under cyclic reversed loading. Specifically, stiffness degradation denotes the phenomenon where the stiffness of a test specimen decreases with the increase in the number of loading cycles. Stiffness can be represented by secant stiffness [14,34,35]. According to the definition of secant stiffness stipulated in the Standard for Test Methods of Earthquake-Resistant Buildings (JGJ 101-1996) [36], it is calculated using the following Formula (3):
Among these, (Ki) represents the tangent stiffness during the initial loading cycle; (+Pi) and (−Pi) denote the peak loads in the positive and negative directions during the (i)-th loading cycle; (+∆i) and (−∆i) signify the displacements corresponding to the peak loads in the positive and negative directions during the (i)-th loading cycle. In the formula, the secant stiffness (Ki) (measured in kN/mm) is defined as the ratio of the sum of the absolute values of the positive and negative maximum horizontal loads to the sum of the absolute values of the positive and negative maximum displacements during the (i)-th loading cycle.
The stiffness degradation of each shear-wall specimen, derived from the backbone curves, is presented in Table 8. Three groups of representative specimens were selected to conduct an investigation and comparison of the stiffness degradation characteristics under the influence of three key parameters: the shear-span ratio, the axial compression ratio, and the reinforcement ratio, as depicted in Figure 11.
Table 8.
Stiffness degradation of shear wall specimens.
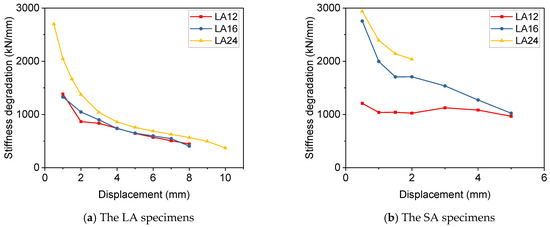
Figure 11.
Comparison curve of stiffness degradation of the specimens.
According to Table 8, the stiffness degradation comparison curve of each specimen is shown in Figure 11.
As depicted in Figure 11, the stiffness degradation trends of the three groups of specimens are comparable, namely, the stiffness of the specimens gradually diminishes as the loading displacement increases. In the initial stage, the stiffness degradation rate of the shear-wall specimens is rapid and then gradually decelerates. During the cracking, yielding, and failure stages with the progress of loading, the slope of the stiffness-displacement curve gradually decreases. The steel ratio exerts a certain influence on the stiffness of squat shear walls. Specifically, the stiffness of squat shear walls is directly proportional to the steel ratio.
- (1)
- From the comparative analysis of stiffness degradation, it can be inferred that all shear-wall specimens display fundamentally the same stiffness degradation trend. The stiffness of the shear-wall specimens reaches its maximum at the initial stage. As the loading stages progress, the secant stiffness of the specimens gradually declines. This implies that during the loading process, the development and propagation of cracks, as well as the increase in steel-bar stress, lead to damage of the specimens, which in turn causes a gradual reduction in their stiffness. Meanwhile, the displacement increases at a faster rate than the load.
- (2)
- It can be discerned from the stiffness degradation comparison diagrams that the stiffness degrades rapidly in the initial stage. As the loading displacement continuously increases, the stiffness degradation rate of the specimens slows down and even tends to stabilize. This is because, in the stage from cracking to yielding of the specimens, the propagation of cracks and the increase in steel-bar stress significantly reduce the stiffness of the specimens, resulting in a rapid downward trend of the stiffness. After the specimens pass through the yielding stage, their stiffness has already dropped to a relatively low level, and the stiffness degradation decelerates during subsequent loading.
- (3)
- The shear-span ratio of the specimens determines their residual stiffness at failure. When the specimens experience severe brittle failure, they possess a relatively high initial stiffness, and the residual stiffness before failure remains substantial (>1000 kN/mm). Notably, the shear-span ratio of all these specimens is 0.3. In contrast, when the specimens undergo partially ductile failure, they are characterized by lower initial stiffness and smaller residual stiffness (<400 kN/mm), with most of these specimens having a shear-span ratio of 0.5. These findings indicate that the geometric dimensions of the specimens have a crucial impact on their stiffness.
- (4)
- Under the condition that other parameters are fixed, the larger the axial compression ratio, the higher the initial stiffness of the specimens and the greater the residual stiffness before failure. Moreover, a higher horizontal reinforcement ratio contributes to a certain increase in the initial stiffness, enhances the ductility of the specimens, and increases their loading displacement.
3.6. Crack Width
In this experiment, researchers directly observed the cracks and recorded the development of the cracks from the cracking stage under various displacement-controlled load levels. The crack width of the specimen is shown in Table 9.
Table 9.
Maximum crack width of each loading level.
As can be observed from Table 9, during the initial loading phase, the SA specimen with the highest reinforcement ratio exhibited the largest crack width. When the loading led to the yielding of the specimens, the crack width of the LA specimen with the lowest reinforcement ratio gradually surpassed that of the other two specimens until failure. However, the crack width of each specimen did not show significant differences. This suggests that higher reinforcement ratios can restrict crack development in low-story shear after yielding, yet the effect is limited. In addition to the maximum crack width, the crack development patterns of the specimens also exhibit important characteristics. For specimens in Group L (λ ≈ 0.5), cracks were primarily distributed in an inclined and crossing manner. As the load increased, new diagonal cracks continuously formed and extended in the middle region of the wall, ultimately resulting in several roughly parallel main diagonal cracks with a spacing of approximately 200–300 mm. In contrast, the crack pattern of Group S specimens (λ ≈ 0.3) differed: initial cracks appeared more frequently near the wall base and corners, followed by the development of a relatively single major diagonal sliding plane, with overall sparser crack distribution. This discrepancy is closely related to their distinct shear span ratios and final failure modes (see Table 10). Specimens with a higher reinforcement ratio, such as LA24, exhibited a greater number of cracks that were more evenly distributed, reflecting stronger restraint provided by reinforcement on concrete cracking.
It is worth noting that the maximum cumulative energy dissipation was observed in specimens with a reinforcement ratio of 1.6% (LA16, SA16), rather than in those with the highest ratio of 2.4%. This reveals a nonlinear influence of reinforcement ratio on energy dissipation capacity. Combined with the crack width data in Table 9, specimens with high reinforcement ratios (e.g., LA24, SA24) showed more restrained crack width development during the later loading stages. Although this helps control damage concentration, it may also limit energy dissipation mechanisms that rely on distributed cracking and extensive yielding of reinforcement. For LA24, its relatively high ductility (μ = 2.66) and plump hysteresis loops (Figure 5c) still indicate good energy dissipation capacity. In contrast, for SA24, the combination of a very low shear span ratio (λ = 0.3) and a high reinforcement ratio led to premature localized shear failure (Table 9), severely limited deformation capacity (Δu = 2.04 mm), and highly pinched hysteresis loops (Figure 5f), resulting in the lowest cumulative energy dissipation. This suggests that under very low shear span ratios, an excessively high reinforcement ratio may not effectively enhance energy dissipation and could instead promote brittle failure. A moderate reinforcement ratio (1.6%) strikes a better balance between providing sufficient shear strength and maintaining adequate deformation and crack development capacity, thereby achieving optimal cumulative energy dissipation.
4. Numerical Simulation and Parameter Analysis
4.1. Finite Element Model Establishment
- (1)
- Constitutive model
Accurate and reliable constitutive relations of steel and concrete materials are the prerequisite for numerical simulation research on reinforced concrete shear walls.
- ①
- Concrete constitutive model
This project uses a concrete damage plastic model for simulation analysis. The plastic damage model can not only simulate the mechanical properties of concrete under monotonic loading, but also simulate the performance under low-cycle reciprocating loading and dynamic loads. According to the concrete structure design code (GB50010-2002) [37], the stress–strain curve equation of concrete under uniaxial compression is determined by the following formula:
In the formula: , are the parameter values of the rising and falling sections of the uniaxial compressive stress–strain curve; is the uniaxial compressive strength of concrete; is the corresponding peak compressive strain of concrete. The stress–strain curve equation of concrete under uniaxial tension is determined by the following formula:
In the formula: is the parameter value of the descending section of the uniaxial tensile stress–strain curve; is the uniaxial tensile strength of concrete; is the corresponding peak tensile strain of concrete.
The concrete plastic damage model introduces a damage factor to simulate the characteristic that the unloading stiffness decreases as the damage increases by reducing the stiffness of the concrete in the compression and tension elastic stages. When the concrete material is damaged under the action of reciprocating load, it will be unloaded with a stiffness of 1−dE0. As the strain increases, the damage factor gradually increases, and the concrete damage becomes more and more serious. The damage factor is calculated according to the Sidoroff energy equivalence principle, and its formula is:
In the formula: d represents the concrete damage factor; σ is the true stress of concrete; ε is the true strain of concrete. According to relevant literature recommendations, the damage factor should be entered above 0.95. In ANSYS, compression damage is input in the form of dcxεcin, and tensile damage is input in the form of dtxεtpl. The hysteresis rule of ANSYS uses the damage factor and stiffness recovery coefficient to better reflect the stress behavior of concrete under reciprocating loads. The tensile stiffness recovery coefficient ωt represents the degree of recovery of the elastic modulus when the concrete moves from the compression zone to the tension zone. The compression stiffness recovery coefficient ωc represents the degree of recovery of the elastic modulus when the concrete moves from the tension zone to the compression zone. This project takes ωt = 0 and ωc = 1.0. Specify the multiaxial parameters of concrete to better simulate the multiaxial mechanical behavior of solid structures. This project uses an expansion angle of 50°, an eccentricity of 0.1, a ratio of biaxial strength to uniaxial strength of 1.16, and a viscosity coefficient of 0.0005 to simulate the multiaxial mechanical behavior of concrete.
- ②
- Reinforcement constitutive model
Given that the reinforcing effect of steel bars remains consistent in all directions after undergoing loading and unloading cycles, the research team adopted the Bilinear Isotropic Hardening Plasticity model as the constitutive model for steel bars. The yield strength of the steel bars and the stiffness degradation ratio were assigned values based on actual test measurements. The constitutive relationship of the steel bars is illustrated in Figure 12.
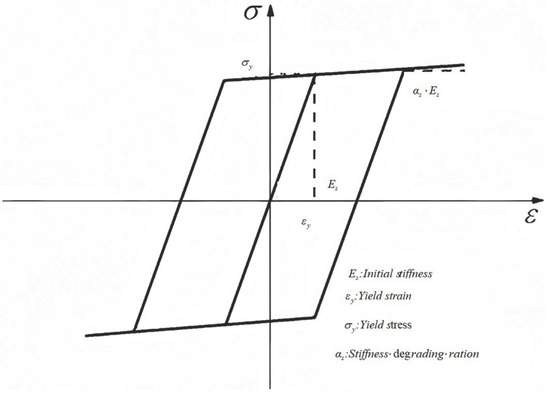
Figure 12.
Constitutive relationship diagram of steel bars.
Experimental findings suggest that the two edge regions of shear walls with a low shear-span ratio are the vulnerable parts, where cracks or damage are more likely to initiate. Therefore, enhancing or optimizing the mechanical performance of shear walls through the rational layout of reinforcing bars holds substantial research significance.
The baseline longitudinal and transverse reinforcement ratios were set at 1.2%, 1.6%, and 2.4%. Specifically, for specimens LA12 and SA12, an additional layer of vertical reinforcement was placed in the wall edge regions, accompanied by a corresponding reduction in the reinforcement quantity of the wall core region, thus maintaining the overall sectional reinforcement ratio at 1.2%. For specimen LA16, an extra layer of vertical reinforcement was added to the edge regions, leading to an overall sectional reinforcement ratio exceeding 1.6%. For specimen SA16, nearly two extra layers of vertical reinforcement were arranged in the edge regions to maintain the overall reinforcement ratio at 1.6%. Regarding specimen LA24, nearly two additional layers of vertical reinforcement were installed in the edge regions; in contrast, specimen SA24 was provided with approximately one to two extra layers of horizontal reinforcement in the same edge regions, both achieving an overall reinforcement ratio of 2.4%.:
- ③
- Unit type, boundary constraints and load application
The concrete of the shear wall was modeled using the 8-node linear brick reduced-integration element (C3D8R), while the reinforcing bars were discretized with the 2-node linear truss element (T3D2). Given that the foundation beam served as a fixed support in the model, the bottom boundary was constrained as a fixed end. Specifically, three rotational constraints and three translational constraints were imposed to fully restrain the six degrees of freedom of the bottom section, which corresponds to the Encastre constraint in the finite element software. The top surface of the shear wall panel was connected to the loading beam, and the bottom surface of the lower shear wall panel was bonded to the foundation beam via the Tie constraint. The reinforcing bars of all components were embedded in the concrete wall using the Embedded constraint, with the bond-slip behavior between steel and concrete neglected in this simulation. This connection configuration ensured that the rigid-body displacement of the model was governed solely by the deformation of the shear wall itself. Prior to load application, a reference point was established and coupled to the top surface of the shear wall through the Coupling constraint. The displacement load was then applied directly to this reference point for loading control.
- ④
- Mesh division
In this research, ANSYS software (2025 R2) was utilized to conduct a numerical simulation analysis of the stress evolution process in double-sided composite shear wall specimens. Concrete and reinforcing bars were modeled independently, with the bond-slip behavior between the reinforcing bars and concrete being disregarded. The reinforcing bars were embedded within the concrete matrix through the Embedded constraint. A rigid gasket was placed at the loading point to prevent stress concentration and excessive local deformation during the simulation. The base beam of the shear wall and the ground were subjected to fixed-end constraints, and the displacement-controlled loading method was implemented at the loading point.
For the construction of the finite element (FE) model, 8-node linear brick reduced-integration solid elements (C3D8R) were employed for both the concrete and the rigid gaskets, while 2-node linear truss elements (T3D2) were adopted for the reinforcing bars. The reinforcing bars were modeled using a bilinear elastic-plastic constitutive model, with the post-yield slope set at 0.01Es (where Es represents the elastic modulus of the reinforcing bars). The yield strength, tensile strength, and elastic modulus of the reinforcing bars were all determined from experimental measurements, and the von Mises yield criterion was applied. The Poisson’s ratio of the reinforcing bars was set to 0.3.
Concrete was simulated using the damage plasticity model integrated in ANSYS, and its mechanical parameters were assigned based on experimental test data. Figure 13a depicts the overall mesh division, Figure 13b presents the mesh of the reinforcing bar elements, Figure 13c shows the schematic diagram of the FE model, and Figure 13d displays the FE model diagram of the reinforcing bar skeleton.
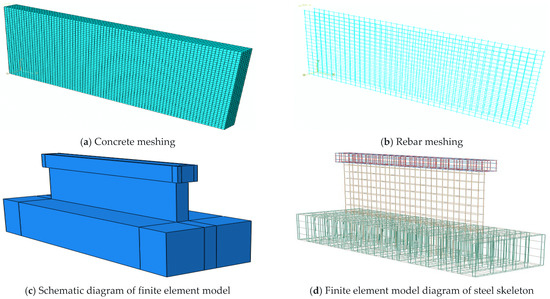
Figure 13.
Model meshing diagram.
4.2. Analysis of Damage Modes and Rules
Based on the experimental procedures and outcomes, the ultimate failure modes of the specimens were classified into diagonal compression-slip failure (DCSF), shear slip failure (SSF), flexure-shear failure (BSF), and local failure (LSF). The failure modes of the six low-profile shear wall specimens are presented in Table 10, where F represents the ultimate load and d denotes the corresponding displacement.
Table 10.
The failure modes of each specimen.
Table 10.
The failure modes of each specimen.
| Specimen | Fu/kN | Δu/mm | Failure Modes |
|---|---|---|---|
| LA12 | 3831.02 | 8.58 | DCSF |
| LA16 | 3932.80 | 7.28 | DCSF |
| LA24 | 3527.80 | 9.81 | BSF |
| SA12 | 4878.50 | 5.06 | SSF |
| SA16 | 5045.50 | 4.97 | LSF |
| SA24 | 4805.46 | 2.04 | LSF |
Detailed explications of the four failure modes are as follows:
- (1)
- Diagonal compression-slip failure (DCSF): This failure mode is characterized by the emergence of diagonal compression cracks in the shear wall, accompanied by distinct slippage between the wall panels.
- (2)
- Shear slip failure (SSF): It primarily manifests as substantial slippage along the predefined or potential shear planes of the specimen, with relatively few cracks in the wall body.
- (3)
- Flexure-shear failure (BSF): A composite failure mode that integrates both flexural and shear deformation features, typically involving the propagation of flexural cracks and diagonal shear cracks.
- (4)
- Local failure (LSF): Refers to localized damage occurring in specific regions of the shear wall (such as edge regions or loading points), without the overall failure of the entire specimen.
Shear Wall Failure Modes:
- (1)
- Oblique Compression-Slip Failure
Specimens LA12 and LA16 demonstrated a relatively high axial load ratio. In these two groups of low-rise shear wall specimens, the initial cracks were both horizontal, originating in the vicinity of the wall tops. As the load was applied, oblique cracks continuously emerged in the middle of the walls, and the width of the existing cracks continued to widen. When the specimens reached their ultimate bearing capacity, sudden failure occurred, exhibiting distinct brittle failure characteristics. At the time of failure, the concrete at the bottom of the shear walls suffered compressive failure, with partial concrete spalling, vertical reinforcement bending and deforming, and horizontal reinforcement being exposed. Under the action of the axial load, the walls experienced significant out-of-plane displacement, and the damage was concentrated in the bottom and edge regions. This failure mode is classified as oblique compression-slip failure.
- (2)
- Shear-Slip Failure
Specimen SA02 underwent shear-slip failure. Prior to the wall reaching its ultimate strength, diagonal through-cracks continuously formed, and their width increased gradually while remaining relatively narrow. When the wall attained its ultimate strength, the cracks at the bottom intensified significantly: the corner concrete on one side of the wall base suffered crushing failure, and the corner concrete on the opposite side of the wall top spalled. The destructive cracks were predominantly distributed obliquely, extending from the top of one side to the bottom of the other side to form diagonal through-shear cracks, which further developed into shear-slip planes at the diagonal junctions of the walls. Concrete spalled along these planes, accompanied by corner concrete crushing, ultimately leading to horizontal sliding and complete failure of the wall. This constitutes the shear-slip failure mode.
- (3)
- Flexure-Shear Failure
Specimen LA24 experienced flexure-shear failure. The reinforcement ratio of this specimen was 2.4%; a relatively high reinforcement ratio resulted in a certain extent of flexural failure in the specimen. However, since all specimens were shear walls with a low shear-span ratio, shear failure was dominant, leading to the occurrence of flexure-shear failure. The initial cracks were mostly oblique, with occasional horizontal cracks. As the load was applied, before reaching the ultimate bearing capacity, diagonal cracks in the wall continued to propagate, accompanied by the generation of multiple horizontal cracks. These cracks spread across the entire wall, showing a basically symmetrical distribution. When the wall reached its ultimate bearing capacity, damage occurred at the corners, forming shear diagonal cracks. Subsequently, these oblique cracks gradually developed into horizontal cracks induced by flexural failure. This failure mode is defined as flexure-shear failure.
- (4)
- Local Shear Failure
Local shear failure was observed in specimens SA16 and SA24, which were characterized by higher bearing capacity, significant stiffness, and smaller ultimate displacement. Before reaching the ultimate state, cracks appeared on both sides and in the middle area of the walls, gradually expanding into through-cracks. Due to their relatively high ultimate bearing capacity, when these squat shear walls reached the ultimate limit state, a large amount of concrete spalled from the top corners of the walls, exposing the horizontal reinforcement at the corner ends. This failure mode is local shear failure, as shown in Table 11.
Table 11.
Damage modes and rules.
In this simulation, the reinforcement in all components was embedded within the concrete walls using an ‘Embedded’ constraint, without considering the bond-slip effect between steel and concrete. This simplification is based on the following considerations:
- (1)
- The study primarily focuses on the global force–displacement response, failure mode, and key characteristic loads (cracking, yield, and peak load) of the components before reaching peak load. For such macroscopic behavior, the perfect bond assumption has been proven effective in many studies [31].
- (2)
- The specimens were constructed with appropriate detailing measures, such as welded short bars to enhance anchorage (see Section 2.1), which in practice are intended to minimize slippage.
However, it is important to acknowledge the limitations of this assumption: during the post-peak load stage, especially in specimens with high reinforcement ratios, severe concrete crushing and potential local buckling of reinforcement may occur, leading to significant bond degradation and slip. Neglecting this effect may cause the numerical model to overestimate the residual stiffness after peak load and may not accurately capture localized damage details, such as crack concentration. Future high-fidelity simulations could incorporate cohesive elements or discrete modeling approaches to account for bond-slip behavior. Nevertheless, as shown in Figure 14, Figure 15 and Figure 16, the current model demonstrates good agreement with experimental results in predicting failure modes, characteristic loads, and overall hysteretic trends. This indicates that the model is suitable and reliable for the main objective of this study—investigating the influence of design parameters on the macroscopic seismic performance of low-rise shear walls.
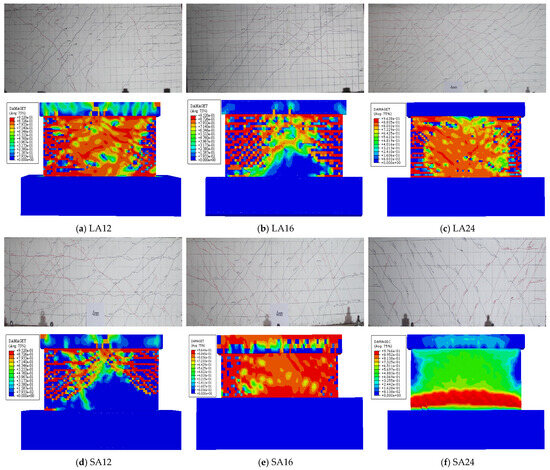
Figure 14.
Comparison of failure process and failure mode (when cracks reach 4 mm).
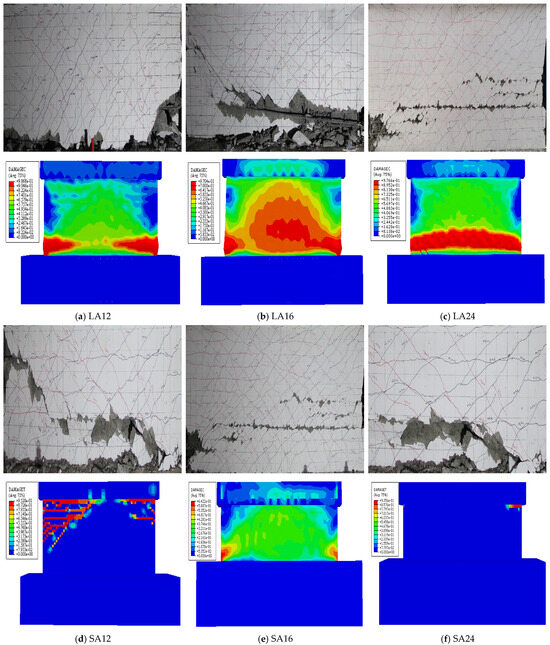
Figure 15.
Comparison of failure process and failure mode (after fracturing).
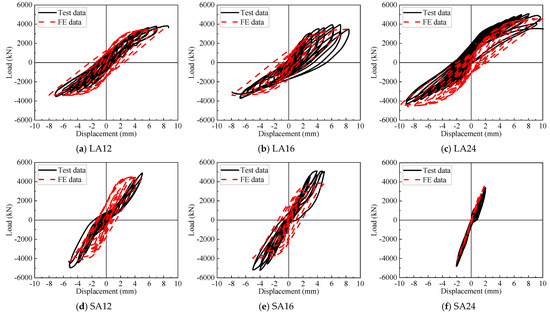
Figure 16.
The comparison of the load–displacement curves.
4.3. Comparison of Experimental and Finite Element Results
- (1)
- Comparison of Failure Process and Failure Mode (Onset of Cracks)
(1) In both the LA12 test specimen and the finite element model, the initial cracks originated from the upper part of the specimen, and the cracks predominantly propagated in oblique and horizontal directions. Figure 14a depicts the damage pattern of the LA16 test specimen and the finite element model when the first crack emerged at the 3-mm loading point. It is evident from the figure that the first crack appeared in the middle of the wall and propagated obliquely.
(2) Figure 14b illustrates the damage pattern of the first crack in the numerical model. Both oblique and horizontal cracks were observed at both ends of the wall. The maximum Mises stress of the reinforcement in LA12 also occurred at the upper part, with a value of 196.9 MPa, which is significantly lower than its yield strength. The maximum Mises stress of the reinforcement where the first crack occurred in LA16 was 142.7 MPa, which had not yet reached the yield state. It was observed that the cross-cracks in both the experimental model and the numerical model were fully developed; the cracks initiated more rapidly and densely, and were mainly concentrated in the middle area of the wall.
(3) In both the LA24 test specimen and the finite element model, the initial cracks were situated in the middle of the wall and propagated obliquely. The damage pattern of the first crack in the numerical model revealed both oblique and horizontal cracks at both ends of the wall. The maximum Mises stress of the reinforcement was 54.1 MPa, which had not yet reached the yield state, as shown in Figure 14c.
(4) In both the SA12 test specimen and the finite element model, the initial cracks originated from the right side of the wall end, and the cracks mainly propagated diagonally. The damage pattern of the first crack in the numerical model showed horizontal cracks at the wall end. The maximum Mises stress of the reinforcement was 99.5 MPa, which had not yet reached the yield state, as shown in Figure 14d.
(5) Figure 15e shows the damage pattern of the SA16 test specimen when the first crack occurred during the loading process. The first crack appeared at the wall end and mainly propagated horizontally. In the numerical model, horizontal cracks first appeared at the wall end, and the maximum Mises stress of the reinforcement was 74.9 MPa, which had not yet reached the yield state.
(6) Figure 14f presents the damage pattern of the SA24 test specimen when the first crack occurred during the loading process. The initial cracks were located at the right side of the wall end and the middle of the wall, and mainly propagated diagonally. In the numerical model, the maximum Mises stress of the reinforcement where the first crack occurred was 74.56 MPa, which had not yet reached the yield state.
Table 12 presents a quantitative comparison between the experimental and finite element model results in terms of cracking load (Fcr,exp vs. Fcr,FEM) and the corresponding displacement (Δcr,exp vs. Δcr,FEM). Overall, the cracking loads predicted by the finite element model fall within an average error margin of ±15%compared to the experimental values, and the predicted cracking displacements are also in close agreement. This good quantitative consistency, together with the visual alignment of failure patterns shown in Figure 14, jointly validates the reliability of the established finite element model in simulating the initial phase of nonlinear behavior of low-rise shear walls.
Table 12.
Comparison of Cracking Characteristics Test Results and Simulation Results.
- (2)
- Comparison of Failure Process and Failure Mode (At Crushing Stage)
(1) Under load control, specimens LA12 and LA16 developed cracks at the bottom of the walls when the load reached 1400 kN, prompting a switch from load control to displacement control. Upon reaching the 8 mm displacement level during the first forward loading cycle, both walls failed suddenly. At failure, a large amount of concrete at the right corner was crushed, part of the reinforcement yielded and became exposed, and concrete at the wall bottom spalled. Damage was more severe at the wall corners, accompanied by horizontal sliding. No obvious precursor signs were observed; the failure was abrupt and brittle, exhibiting a typical oblique compression-slip failure mode. The damage conditions of both the experimental model and the finite element model at ultimate bearing capacity are presented in Figure 15a,b. Comparison shows that the experimental model displayed clear shear failure across nearly two-thirds of the wall width, while the numerical model similarly exhibited pronounced crushing failure over approximately the same region.
(2) For specimen LA24, three oblique cracks appeared in the middle of the wall when the load reached 1150 kN, after which the loading mode was switched to displacement control. During the first forward cycle at 10 mm displacement, extensive concrete spalling occurred at the lower left corner, with minor spalling in the middle region. Subsequently, concrete at the lower left corner shattered, exposing the reinforcement. Oblique shear cracks developed before horizontal flexural cracks, and long horizontal cracks formed in the bottom area of the wall. The specimen ultimately failed in a flexure-shear mode, as shown in Figure 15c.
(3) In specimen SA12, cracks formed at the wall bottom at a load of 1200 kN, leading to a change from load control to displacement control. When the displacement reached the 6 mm level in the first forward loading cycle, the wall failed suddenly. Cracking occurred in the middle of the squat shear wall, forming a horizontal through-crack that acted as a slip surface, along which the wall slid. The failure was abrupt and brittle, characteristic of an oblique compression-slip failure, illustrated in Figure 15d.
(4) For specimen SA16, two horizontal cracks appeared on the right side at 1550 kN, and the control mode was switched to displacement control. Before the lateral wall could fail, the top-loaded beam failed first, preventing further loading; thus, the final failure mode was local. Comparison of the experimental and finite element models at ultimate bearing capacity shows that the experimental model did not exhibit concrete crushing, whereas the numerical model displayed significant compressive damage at local corners. As seen in the Mises stress distribution of the reinforcement, nearly half of the longitudinal reinforcement in the wall exceeded its yield strength, indicating that the wall would undergo considerable plastic deformation beyond this state (Figure 15e).
(5) When specimen SA24 was loaded to 1100 kN, two horizontal cracks appeared on the right side of the squat shear wall, and the control mode was switched to displacement control. Several diagonal through-cracks developed during loading. At the 2 mm displacement level, the top beam failed after the first loading cycle, resulting in a local failure mode, as shown in Figure 15f.
Similar damage processes were detected across the six groups of specimens; however, the following notable disparities were identified:
- (1)
- In specimens with relatively higher ρsh values, the oblique cracks on the web were more prominent, as depicted in Figure 16.
- (2)
- Discrepancies were observed in the buckling extent of steel plates among specimens with different reinforcement ratios: the higher the reinforcement ratio, the less severe the buckling extent.
4.4. Parameter Changes in Shear Walls with Different Reinforcement Ratios
The shear-span ratio, axial compression ratio, and axial compressive strength of concrete in squat shear walls have an impact on the cracking load, presenting a linear increasing or decreasing trend. A predictive model for the cracking load of squat shear walls is put forward, as depicted in Equation (7). A predictive model for the yield load is presented in Equation (8), and the regression equation corresponding to the yield load predictive model is provided in Equation (9).
In the formula:
Fcr—Cracking load (N);
—Concrete axial compressive strength (MPa);
—Shear-to-span ratio;
—Wall length (mm);
—Axis force (N);
—Wall thickness (mm);
—Undetermined polynomial coefficients, (i = 1, 2, 3, 4)
The design of parameters associated with the longitudinal and transverse reinforcement ratios of squat shear walls is primarily founded on three sets of numerical models of squat shear walls, each having the same axial compression ratio (μG = 0.2) and shear-span ratio (λ = 0.5). The longitudinal and transverse reinforcement ratios of these three sets of numerical models were individually adjusted, with the total longitudinal and transverse reinforcement ratios (ρh + ρv) set at 2.4%, 3.2%, and 4.8%respectively. The objective was to explore the influence of different longitudinal and transverse reinforcement ratios on the mechanical characteristics of squat shear walls.
Figure 17 depicts the impact of different longitudinal and transverse reinforcement ratio parameters on the failure load of squat shear walls. It can be observed from the figure that when the transverse reinforcement ratio increases while the longitudinal reinforcement ratio decreases (with the total longitudinal and transverse reinforcement ratio remaining constant).
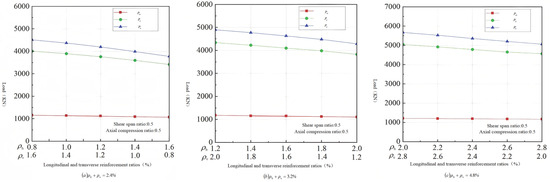
Figure 17.
Effect of different longitudinal and transverse reinforcement ratio parameters on the failure load pattern of low shear walls.
R2 (R-Square), also known as the coefficient of determination, is utilized to evaluate the goodness-of-fit between two sets of data. The closer the value of R2 is to 1, the better the fit between the two data sets. Among these, the R2 values for the predictions of cracking load and yield load reached 0.99589 and 0.99442 respectively. The prediction models demonstrate a high degree of correlation with the test values, suggesting that the prediction models proposed in this study possess high reliability.
To validate the correctness and rationality of the proposed prediction models for the failure performance of squat shear walls, the influencing factors from the physical test and numerical test models were substituted into each regression equation to compute the cracking load, yield load, and ultimate load. Subsequently, these computed values were compared with the results of the physical and numerical tests. The comparison results are presented in Figure 18.
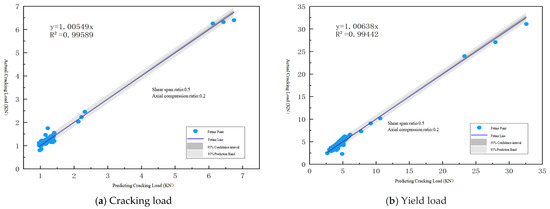
Figure 18.
Comparison of correlation parameters of different longitudinal and transverse reinforcement ratios.
4.5. Discussion on Parameter Sensitivity
The experimental results further indicate that, as shown in Figure 17 and Table 11, under a low shear span ratio λ (corresponding to Group S specimens), the mechanical behavior of the members tends to be more shear-dominated, making the specimens more prone to diagonal shear sliding or localized shear failure along inclined sections. Compared with specimens having a higher shear span ratio λ (Group L), the improvement in ductility achieved by increasing the reinforcement ratio is relatively limited in Group S, indicating a lower sensitivity to changes in reinforcement ratio. This difference in mechanical behavior reasonably explains why, under identical reinforcement conditions, the ductility coefficients of Group SA specimens are generally lower than those of Group LA specimens—a trend clearly reflected in the data presented in Table 5.
5. Case Study—Performance-Based Study on Vulnerability of Low Shear Walls
To apply the regression prediction model for the failure performance of nuclear island shear walls developed in the previous sections to practical engineering evaluation, this section selects a typical nuclear island structure for a case-study, with the aim of establishing the performance-based fragility curves of its squat shear walls. In this research, the seismic demand of the squat shear walls in the nuclear island is acquired through seismic response analysis. Subsequently, the aforementioned regression model (Section 3 and Section 4) is employed to predict their seismic capacity and failure states under earthquakes of varying intensities. By systematically quantifying the exceedance probability between seismic demand and seismic capacity, the performance-objective-oriented fragility curves are ultimately constructed, thus concluding the entire evaluation process from “model establishment” to “engineering application”.
The seismic vulnerability of the nuclear island shear wall refers to calculating the probability that the seismic demand of the nuclear island shear wall surpasses its seismic resistance capacity. This project selects a typical nuclear island structure to conduct seismic response analysis, obtains the seismic requirements of the nuclear island low-height shear wall, and applies the previously established regression prediction model for the failure performance of nuclear island shear walls to determine its seismic resistance, thereby establishing a performance-based vulnerability curve for the nuclear island low-height shear wall.
5.1. Finite Element Model of Typical Nuclear Island Structure and Earthquake Motion
When ANSYS is employed for the extended finite element analysis of the research model, the specific analysis process encompasses three stages: the pre-processing stage → the simulation calculation stage → the post-processing stage. The pre-processing stage of ANSYS is accomplished through seven modules, namely Part, Property, Assembly, Step, Interaction, Load, and Mesh. The simulation calculation stage of ANSYS is realized via the Job module, whereas the post-processing stage is achieved by utilizing the Visualization module.
In the ANSYS software, solid elements are utilized for concrete, and truss elements are applied for reinforcement. To satisfy the requirements of component performance and analysis accuracy, and taking into account the stress characteristics: under low-cyclic reversed loading, the box column shaft experiences bending deformation. Therefore, the solid element C3D8R (reduced integration element) is selected for the concrete of the box column shaft. For reinforcement bars, stirrups, tie bars, and concealed column stirrups, only axial deformation is considered; hence, truss elements T3D2 (3D two-node truss elements) are adopted.
The foundation beam serves a fixing function in the model. Consequently, the bottom of the model is designated as a fixed end, and six degrees of freedom of the bottom end are constrained by 3 rotational constraints and 3 translational constraints, which is the Encastre constraint method in the software. The upper surface of the shear wall panel is connected to the loading beam, and the lower surface of the lower shear wall panel is connected to the foundation beam through Tie connections. The reinforcement of each component is embedded in the wall by means of the Embedded technique (without considering the effect of bond-slip between the two). With such connection methods, the rigid-body displacement of the model depends solely on the connection between the shear walls.
The low shear wall of the core island selected for this project is taken from the bottom layer of the shear wall structure on the right side. The parameters of the core island shear wall model are presented in Table 13. The five typical time-histories of a nuclear power plant selected are all earthquake time-histories that are consistent with the site’s uniform hazard spectrum, and they include three directions: x, y, and z, as shown in Figure 19. A finite element model of a typical nuclear island structure is established using the ANSYS software, as depicted in Figure 20.
Table 13.
Related parameters of nuclear island low shear wall.
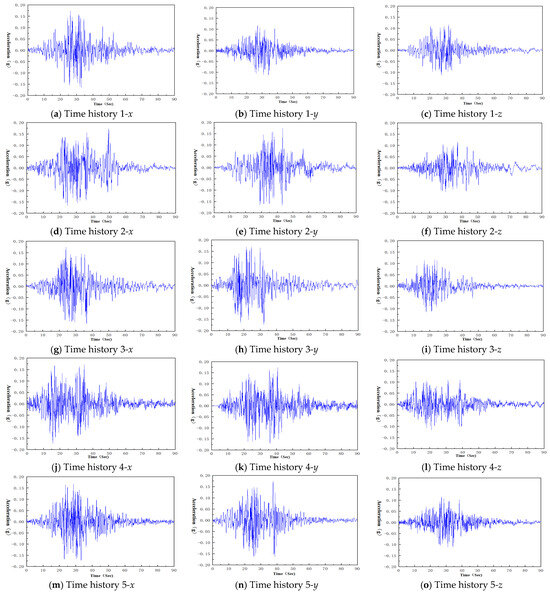
Figure 19.
Seismic Time History of a Nuclear Power Plant.
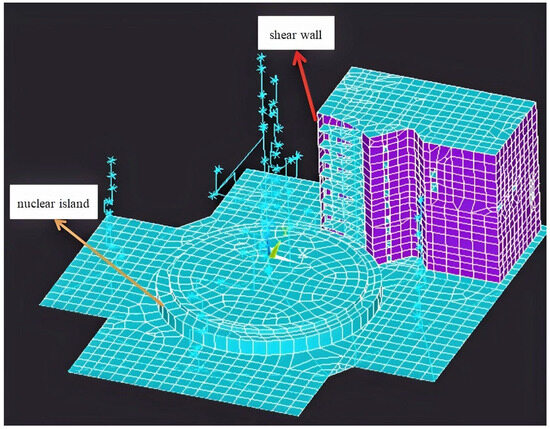
Figure 20.
Finite element model of a typical nuclear island structure.
5.2. Seismic Requirements for Nuclear Island Shear Walls
A seismic response analysis was conducted on the finite-element model of the nuclear island structure under three-dimensional seismic input. This analysis yielded the time-history curves of the shear force (as shown in Figure 21) and the time-history curves of the inter-story displacement (as shown in Figure 22) of the nuclear island shear walls.
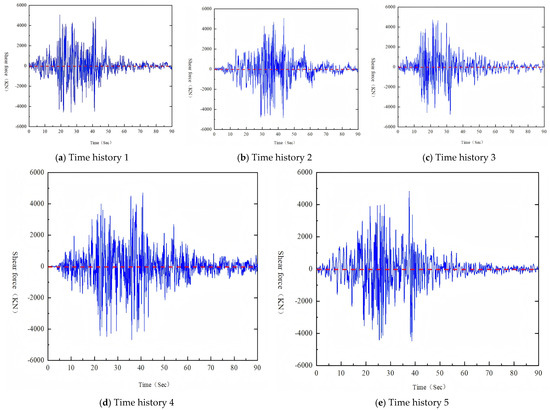
Figure 21.
Shear Force Time History Diagram.
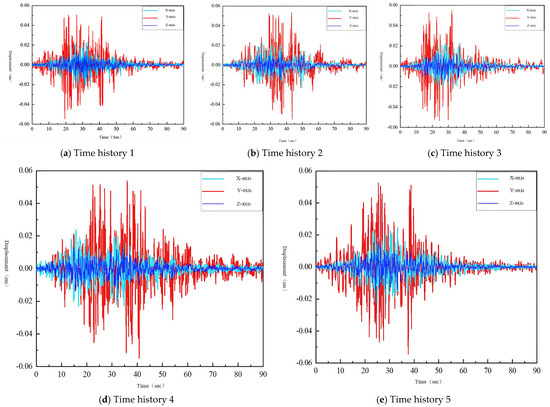
Figure 22.
Inter-story displacement time history.
By extracting the peak values from the time-history curves of the shear force and the inter-story displacement of the nuclear island shear walls, the calculated values of the structure’s lateral shear resistance capacity and inter-story displacement were acquired. The detailed data are presented in Table 14.
Table 14.
Seismic Response Analysis Results of Nuclear Island Shear Walls.
Regarding the calculation of the medians of the lateral shear resistance capacity and the inter-story displacement, it was assumed that the parameters followed a log-normal distribution. Consequently, the geometric mean was employed for estimation. The detailed calculation process of the medians can be referred to Equation (10) [22].
In the formula:
—the median value of lateral shear resistance or inter-story displacement;
—The lateral shear resistance or inter-story displacement of each time history;
—The number of earthquake time histories.
5.3. Seismic Vulnerability Analysis of Shear Walls in the Nuclear Island
Vulnerability analysis refers to providing a series of curves showing the relationship between structural failure probability and different seismic intensities. This project adopts the vulnerability analysis method proposed by Kennedy and Ravindra. When the structure’s reliability is guaranteed, the structural failure probability is calculated according to Formula (11).
where
—Standard Gaussian cumulative distribution function;
—Given seismic intensity index, usually PGA;
—Inverse of the standard Gaussian cumulative distribution function;
—Median seismic demand capacity;
—Random uncertainty reflecting demand and capacity;
—Epistemic uncertainty reflecting demand and capacity.
The determination of the vulnerability function parameters in this study—median value (), logarithmic standard deviation (), and epistemic uncertainty ()—follows the methodological framework originally proposed by Kennedy and Ravindra (1984) [38] and further advanced in EPRI NP-6041 (1991). Specifically, the median seismic capacity was derived via the conservative deterministic failure margin method, which involves calculating the demand-capacity ratio and systematically integrating the contributions of various failure modes. The logarithmic standard deviation () incorporates the aleatory uncertainties associated with both demand () and capacity () In contrast, the epistemic uncertainty () was quantified through expert consultation and model comparison, so as to reflect the knowledge limitations inherent in parameter estimation. To evaluate the impacts of these parameters, the global sensitivity analysis method was adopted in this study. The contribution percentages of different uncertainty sources to the final risk metrics were quantified by means of variance decomposition. The median capacity of the nuclear island shear wall under seismic motion, as well as the two stochastic parameters, are all determined according to the method provided in the EPRI report (EPRI-NP-6041, 1991). This method first requires calculating the capacity-demand ratio of the nuclear island shear wall. The capacity-to-demand ratio for conventional linear-elastic responses can be expressed as Equation (12).
In the formula:
—represents non-seismic loads (including gravity loads, pressure loads, etc.);
—represents the reduction in seismic resistance caused by vertical seismic effects.
For the ratio of capacity to demand that allows a certain level of inelastic response , it can be expressed as Equation (13).
In the formula:
—is the ductility reduction factor;
, taken as the reciprocal of the inelastic energy ratio.
From Equation (13) , it can be derived that at that time , thus defined as:
where
RLE—Review Level Earthquake, for this project the peak ground acceleration is taken as 0.174 g. Using the formula defined above for calculation, the median seismic intensity capability parameters are obtained, as shown in Table 15.
Table 15.
Vulnerability Calculation Parameters.
When calculating the seismic fragility curves of nuclear island shear walls, the impact of uncertainty needs to be considered. The uncertainty parameters are determined according to the values recommended in EPRI, as shown in Table 16 and Table 17.
Table 16.
Calculation parameters for demand uncertainty.
Table 17.
Calculation Parameters of Capability Uncertainty.
In this study, the fragility function parameters were determined using the method proposed by Kennedy and Ravindra, following the framework outlined in the EPRI NP-6041 report. This approach has been widely accepted and applied in seismic probabilistic risk assessment (SPRA) of nuclear power plant structures [38,39]. The logarithmic standard deviation β combines the uncertainty in demand (βR) and the uncertainty in capacity (βC), as summarized in Table 14 and Table 15. The selection of theseβvalues is primarily based on recommended values from the EPRI report, which are derived from statistical analysis of extensive test and simulation data on nuclear power plant components and reflect the nuclear industry’s balance between conservatism and reliability.
Specifically, for the limit state of “severe damage,” which corresponds to serious consequences, a relatively high capacity uncertainty (βC = 0.14) and a lower hysteretic energy reduction factor (Fu = 11.42) were adopted, as shown in Table 16 and Table 17. This combination results in a higher median capacity (Am = 1.99 g) and a relatively flat fragility curve (see Figure 23c). Such a treatment aligns with the conservative principles in nuclear safety standards for evaluating high-confidence-low-probability-of-failure (HCLPF) performance [40]. That is, when assessing failure states with severe consequences, more conservative parameter estimates—with greater uncertainty—are intentionally used to ensure the safety of the risk assessment outcomes. Therefore, the fragility curves developed in this study, particularly those for the severe damage state, can provide a nuclear safety-compliant reference for assessing the seismic margin of nuclear island shear walls and supporting risk-informed decision-making. By calculating the probability of failure as the peak ground acceleration increases from 0 by increments of 0.05 g up to 2 g, a seismic fragility curve for a typical nuclear island shear wall was ultimately established, as shown in Figure 23.
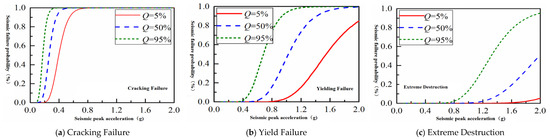
Figure 23.
Typical Vulnerability Curve of Nuclear Island Shear Walls.
6. Conclusions and Future Directions
This research focuses on typical podium squat shear walls of nuclear island structures. The finite element method and large-scale quasi-static tests are used for nonlinear simulation, and the results correlate well with experimental data. Eight design schemes for the walls are proposed based on different reinforcement layouts, especially at the edges and center. The calibrated simulation method analyzes and compares these schemes, and key conclusions are as follows:
- (1)
- This study systematically summarizes how the reinforcement ratio (ρ), shear span ratio (λ), and axial compression ratio (n) jointly influence the failure mode (ranging from diagonal compression sliding to flexural-shear failure), hysteretic characteristics (fullness, pinching), stiffness degradation, energy dissipation mechanism, and displacement ductility of low-rise shear walls. It is demonstrated that the geometric dimension (λ) fundamentally governs the failure pattern and ductility potential, while the reinforcement ratio serves as a key adjustable parameter for optimizing structural performance under a given λ.
- (2)
- The experimental results provided critical data—such as characteristic loads, displacements, and failure modes—which were used to calibrate and validate the finite element model, thereby ensuring its reliability in predicting key performance parameters. Three groups of reinforced concrete squat shear wall specimens with reinforcement ratios of 1.2%, 1.6%, and 2.4% were fabricated and pseudo-statically tested. The analysis shows: All walls failed in shear. After peak strength, web concrete spalled, lateral load-bearing capacity decreased, vertical bars buckled, and axial loads redistributed to boundary elements. A higher reinforcement ratio ( enhances lateral shear strength, energy dissipation, and ductility, and mitigates severe local buckling after peak strength.
- (3)
- The specimens had two failure modes: oblique compression-slip and bending-shear. The reinforcement ratio affects the failure mode; as it increases, the mode shifts from oblique compression-slip to flexural failure. A higher ratio increases yield load and ultimate displacement, improving deformation resistance but reducing horizontal ultimate load. It also improves ultimate displacement capacity and ductility, while a very low ratio may cause brittle failure.
- (4)
- Under monotonic lateral loading, the external frame anchors symmetric squat shear walls, and embedded tension plates constrain out-of-plane deformation. Unified deformation coordination makes embedded plates yield before the frame, following the “strong-frame weak-panel” principle. Symmetric walls overcome the unidirectional member drawback, with negligible differences in bidirectional lateral load-bearing capacity and displacement ductility. Specimens show no obvious pinching in hysteretic curves, indicating good seismic performance, ductility, and energy dissipation.
The reinforcement ratio has little impact on cumulative energy dissipation and crack-restraining, but affects wall stiffness positively. This study clarifies the influence of the reinforcement ratio on squat shear wall failure performance. Based on the validated finite element modeling approach, an investigation on the variation laws of the failure performance parameters of squat shear walls is conducted. The results show that the reinforcement ratio linearly influences wall stiffness. Then, a nonlinear fitting method is used to establish a regression prediction model for the failure performance of squat shear walls in the Hainan Changjiang Project, covering cracking load, yield load, and ultimate load. After clarifying the failure performance of nuclear island squat shear walls, typical nuclear island structures are selected for seismic response analysis to obtain the seismic response of representative squat shear walls. Finally, seismic vulnerability curves for nuclear island squat shear walls with different guarantee rates are established. In future research, large-scale performance-based tests will be carried out based on the above design and analysis to study the effects of reinforcement configurations on the mechanical performance of nuclear island squat shear walls, and the calibration of theoretical models and numerical simulation methods for the constitutive relationship of concrete locally constrained by steel bars will be refined to improve the theoretical and numerical analysis system. Conducting high-fidelity simulations that consider bond-slip behavior and more refined concrete damage modeling; performing experimental tests on full-scale or large-scale specimens; and integrating component-level fragility into the probabilistic risk model of the overall nuclear island system will be carried out.
Author Contributions
Conceptualization, W.Z. and C.Z.; methodology, W.Z.; software, H.C.; experiment, H.C.; investigation, Z.B.; data curation, H.C.; writing—original draft preparation, H.C.; writing—review and editing, H.C.; supervision, Z.B.; project administration, W.Z.; funding acquisition, C.Z. All authors have read and agreed to the published version of the manuscript.
Funding
This research was funded by NSFC (Project No. 52178126).
Data Availability Statement
The original contributions presented in this study are included in the article. Further inquiries can be directed to the corresponding author.
Conflicts of Interest
The authors declare no conflicts of interest.
References
- GB 50267-2019; Seismic Design Code for Nuclear Power Plants. Ministry of Housing and Urban-Rural Development of the People’s Republic of China & State Administration for Market Regulation: Beijing, China, 2019.
- Guan, M.; Lu, S.; Weng, Y.; Antiohos, A.; Patel, V.I.; Liang, Q.Q. Seismic performance of self-slitting composite shear walls with energy dissipation incorporating external O-connectors. Structures 2025, 79, 109555. [Google Scholar] [CrossRef]
- Zhang, Y.; Yang, X.; Ren, Q.; Zhu, Y. Experimental Study on the Seismic Behavior of Prefabricated Shear Walls Connected by Double-Pipe Reinforcing Bar Connectors. Struct. Des. Tall Spec. Build. 2025, 34, e70039. [Google Scholar] [CrossRef]
- Zhang, J.; Cai, R.; Liu, W.; Peng, C. Cyclic Behavior of Steel Fiber-Reinforced High-Strength Concrete Shear Walls with High-Strength Steel Bars. Int. J. Civ. Eng. 2025, 23, 1717–1733. [Google Scholar] [CrossRef]
- Wang, H.; Yu, J.; Dong, F.; Jiang, F.; Yu, K. Seismic shear behavior of masonry walls strengthened with engineered cementitious composites (ECC). J. Build. Eng. 2025, 104, 112230. [Google Scholar] [CrossRef]
- Zhao, C.; Yu, J.; Zhong, W.; Feng, X.; Zhang, P. Seismic Behavior of Buckling-Restrained Steel Plate Shear Walls With Various Interconnection Ratios. Struct. Des. Tall Spec. Build. 2025, 34, e2209. [Google Scholar] [CrossRef]
- Chen, Y.; Liu, R.; Shi, Q.; Ding, R.; Nie, X.; Gao, Q.; Sun, Y.; Fan, J. Experimental study on seismic behavior of a novel RC slab- SC wall joint based on UHPC and rebar—Steel plate lap splices. J. Build. Eng. 2024, 98, 110973. [Google Scholar] [CrossRef]
- Yao, Y.; Zhou, B.; Wei, X.; Zhai, W.; Shi, L.; Ding, X.; Wang, J.; Xu, Q.; Cheng, Z. Seismic behavior of composite shear walls with post-casting UHPC boundary elements and CRB600H steel bars. J. Build. Eng. 2024, 97, 110871. [Google Scholar] [CrossRef]
- Chen, P.; Wang, W.; Cai, W.; Li, J.; Ma, J. Seismic behavior of innovative reinforced concrete composite shear wall with PEC boundary columns. Structures 2024, 69, 107306. [Google Scholar] [CrossRef]
- Zhang, L.; Liu, G.; Liu, G.; Xin, H.; Cai, J.; Satyanaga, A.; Zhang, R.; Dai, G. Seismic Behavior of Cluster-Connected Prefabricated Shear Walls under Different Axial Compression Ratios. Buildings 2024, 14, 2768. [Google Scholar] [CrossRef]
- Zhou, B.; Si, Q.; Li, B.; Zong, L.; Li, S. Experimental and numerical study on seismic behavior of shear wall with cast-in situ concrete infilled walls. Struct. Concr. 2024, 25, 5056–5070. [Google Scholar] [CrossRef]
- Wang, K.; Liu, W.; Yang, S.; Xu, H. Seismic behavior of a hollow precast concrete shear wall with insulation under high axial compression ratios. Eng. Struct. 2024, 318, 118672. [Google Scholar] [CrossRef]
- Najafgholipour, M.A.; Radbakhsh, S.H.; Erfani, E. Evaluation of the seismic behavior of reinforced concrete structures with flat slab-column gravity frame and shear walls through nonlinear analysis methods. Earthq. Eng. Eng. Vib. 2024, 23, 713–726. [Google Scholar] [CrossRef]
- Hosseini, S.M.; Yekrangnia, M.; Shakiba, M.; Bazli, M.; Oskouei, A.V. Experimental study on seismic performance of squat RC shear walls reinforced with hybrid steel and GFRP rebars. Structures 2024, 64, 106487. [Google Scholar] [CrossRef]
- Al-Ahmar, R.; Al Ahmad Al Kousa, M.; Wardeh, G.; Al-Helwani, A. Seismic behavior of reinforced concrete shear walls using a combined model of multi-layer shell and fiber beam elements. Asian J. Civ. Eng. 2024, 25, 4355–4371. [Google Scholar] [CrossRef]
- Che, J.; Sun, Y. Seismic behavior of drift-hardening precast concrete walls reinforced with SBPDN rebars. Eng. Struct. 2024, 308, 118010. [Google Scholar] [CrossRef]
- Huang, W.; An, Y.; Miao, X.; Quan, W.; Wang, M. Research on seismic behavior and shear strength of precast composite walls with different reinforced concrete braces. Structures 2024, 61, 106067. [Google Scholar] [CrossRef]
- Liang, K.; Chen, L.; Su, R.K.L. Seismic behavior of BFRP bar reinforced shear walls strengthened with ultra-high-performance concrete boundary elements. Eng. Struct. 2024, 304, 117697. [Google Scholar] [CrossRef]
- Todea, V.; Dan, D.; Floruț, S.; Stoian, V.; Popescu, V. Numerical Study on the Seismic Performance of Hybrid Shear Walls with Centered Openings. J. Appl. Eng. Sci. 2023, 13, 281–288. [Google Scholar] [CrossRef]
- Sun, M.; Zhang, S.; Yang, J.; Fang, Y.; Xu, X. Investigation on Seismic Behavior of a Novel Precast Shear Wall System with Different Infill Wall Constructions. Materials 2023, 16, 7343. [Google Scholar] [CrossRef]
- Morelli, F.; Natali, A.; Poggi, G. Seismic behavior and nonlinear analysis of Hybrid Coupled Shear Walls. Procedia Struct. Integr. 2023, 44, 574–581. [Google Scholar] [CrossRef]
- Wu, Y.; Fan, S.; Guo, Y.; Duan, S.; Wu, Q. Experimental study and numerical simulation on the seismic behavior of diagonally stiffened stainless steel plate shear walls under low cyclic loading. Thin-Walled Struct. 2023, 182, 110165. [Google Scholar] [CrossRef]
- Xu, D.; Xiang, B.-Q.; Chong, X.; Xu, K.-Y.; Yan, J.-B.; Wang, T. Seismic performances of the joint between replaceable-coupling beams and composite shear wall. J. Constr. Steel Res. 2022, 197, 107462. [Google Scholar] [CrossRef]
- Li, X.; Zhang, J.; Cao, W.; Zhu, Y. Seismic behavior of steel fiber reinforced high strength concrete shear walls with different embedded steel configurations. J. Build. Eng. 2022, 53, 104551. [Google Scholar] [CrossRef]
- Wei, F.; Chen, H.; Xie, Y. Experimental study on seismic behavior of reinforced concrete shear walls with low shear span ratio. J. Build. Eng. 2022, 45, 103602. [Google Scholar] [CrossRef]
- Shi, K.; Zhang, M.; Li, P.; Xue, R.; You, P.; Zhang, T.; Cui, B. Seismic Behavior of Steel-Fiber-Reinforced High-Strength Concrete Shear Wall with CFST Columns: Experimental Investigation. Fibers 2021, 9, 75. [Google Scholar] [CrossRef]
- JGJ/T 101-2015; Specification for Seismic Test of Buildings. Chinese Standard: Beijing, China, 2015.
- Park, R. Evaluation of ductility of structures and structural assemblages from laboratory testing. Bull. N. Z. Natl. Soc. Earthq. Eng. 1989, 22, 155–166. [Google Scholar] [CrossRef]
- GB/T 50010-2010; The Code for Design of Concrete Structures. Ministry of Housing and Urban-Rural Development: Beijing, China, 2024.
- GB/T 50011-2010; The Code for Seismic Design of Buildings. Ministry of Housing and Urban-Rural Development: Beijing, China, 2016.
- Dooshabi, A.; Najafgholipour, M.A. Nonlinear finite element analysis of shear defective reinforced concrete beam to column connections strengthened with three practical techniques. Eng. Fail. Anal. 2024, 163, 108535. [Google Scholar] [CrossRef]
- Yao, D.; Gao, G.; Yang, Q.; Fan, F.; Yan, J. Mechanical behaviors and internal pressure bearing capacity of nuclear containment using UHPC and ECC: From numerical simulation, machine learning prediction to fragility analysis. Nucl. Eng. Des. 2024, 429, 113617. [Google Scholar] [CrossRef]
- Che, J.; Son, B.; Sun, Y. Seismic Damage and Behavior Assessment of Drift-Hardening Concrete Walls Reinforced by LBUHS Bars. Materials 2024, 17, 2070. [Google Scholar] [CrossRef]
- Akl, A.; Ezzeldin, M. Hybrid simulation testing of two-storey low-aspect-ratio nuclear RC shear walls with normal- and high-strength reinforcement: Seismic performance evaluation and economic assessment. Structures 2024, 69, 107500. [Google Scholar] [CrossRef]
- Gao, X.; Xu, Z.; Ren, X.; Li, J. Experimental analysis of RC and SPRC squat shear walls. J. Build. Eng. 2024, 93, 109861. [Google Scholar] [CrossRef]
- JGJ 101-1996; Specification of Testing Methods for Earthquake Resistant Building. Ministry of Housing and Urban-Rural Development: Beijing, China, 2015.
- GB 50010-2002; Code for Design of Concrete Structures. Ministry of Housing and Urban-Rural Development: Beijing, China, 2011.
- Kennedy, R.P.; Ravindra, M.K. Seismic fragilities for nuclear power plant risk studies. Nucl. Eng. Des. 1984, 79, 47–68. [Google Scholar] [CrossRef]
- EPRI. A Methodology for Assessment of Nuclear Power Plant Seismic Margin (Revision 1); EPRI: Washington, DC, USA, 1991. [Google Scholar]
- Hasan, M.; Morteza, G.S.; Mohsen, G. A Comparative Study between Pseudo-static and Dynamic Analyses on Rock Wedge Stability of an Arch Dam. Civ. Eng. J. 2018, 4, 179–187. [Google Scholar] [CrossRef]


Disclaimer/Publisher’s Note: The statements, opinions and data contained in all publications are solely those of the individual author(s) and contributor(s) and not of MDPI and/or the editor(s). MDPI and/or the editor(s) disclaim responsibility for any injury to people or property resulting from any ideas, methods, instructions or products referred to in the content. |
© 2026 by the authors. Licensee MDPI, Basel, Switzerland. This article is an open access article distributed under the terms and conditions of the Creative Commons Attribution (CC BY) license.