Abstract
Green innovation has become a core driving force for promoting sustainable development, making the accurate evaluation of enterprises’ green innovation efficiency an important research topic. Based on the Environmental, Social, and Governance (ESG) framework, this paper improves the SBM model to overcome shortcomings such as homogeneity in traditional SBM models during efficiency evaluation. By introducing an asymmetric slack measure, it breaks through the limitation of efficiency value ceilings, enabling gradient ranking of decision-making units and precisely distinguishing between efficient and inefficient enterprises, thereby better assessing the green innovation efficiency of hydrogen energy companies. The study shows that the improved SBM model significantly enhances the accuracy of enterprise efficiency evaluation. The contribution of this paper lies in constructing an improved SBM model integrated within the ESG framework, compensating for the lack of environmental dimensions in traditional evaluation methods, addressing issues of efficiency homogeneity and the static nature of the frontier, and achieving optimized ranking of frontier-efficient enterprises.
1. Introduction
In the context of global sustainable development, the correlation between the ESG system and corporate innovation ecology has become a key factor affecting industrial competition [1]. The hydrogen energy industry, as a strategic area for achieving carbon neutrality goals, shows a significant dynamic relationship between its innovation efficiency and the ESG evaluation system. However, Chinese hydrogen energy companies face many challenges in technological innovation, resource allocation, and other aspects, such as insufficient research and development investment, low allocation efficiency, and imperfect management systems, which limit their global competitiveness and urgently require optimization of green innovation efficiency and resource allocation [2]. Therefore, scientifically evaluating and improving the green innovation efficiency of hydrogen energy enterprises is crucial for promoting the sustainable development of the industry.
Given the need for such scientific evaluation, it is important to recognize that in the complex and ever-changing production and operation systems of enterprises, various decision-making units (DMUs) exhibit multidimensional differentiation in their input–output structures due to heterogeneity in resource endowments, technological pathways, and market environments. This heterogeneity is not only reflected in the imbalance of production factor allocation across industries but is also prominently present within the same industry, arising from structural asymmetries caused by technological generational differences, innovations in management paradigms, or economies of scale.
Traditional parametric efficiency evaluation methods are limited by predefined production function forms and symmetry distribution assumptions, making it difficult to effectively analyze the efficiency frontier of highly heterogeneous multi-input-multi-output systems. In this context, Data Envelopment Analysis (DEA) demonstrates unique advantages. The model constructs a non-parametric production frontier, breaking through the traditional efficiency measurement methods’ constraints on the form of production functions and data distributions, and is especially adept at handling multidimensional heterogeneous input–output data sets [3]. Its core methodology is reflected in three aspects: First, DEA constructs a convex production possibility set through linear programming techniques, achieving Pareto optimal solutions of relative efficiency for DMUs without predefining the parameter mapping between inputs and outputs [4]; second, DEA’s radial efficiency measurement based on frontier projection effectively avoids evaluation bias caused by asymmetric data distributions; third, DEA’s unique non-parametric nature allows it to handle mixed qualitative and quantitative data, as well as complex production scenarios such as variable returns to scale [5]. These features, combining topological robustness and dynamic adaptability, make DEA a powerful theoretical tool for resource optimization, technology innovation efficiency evaluation, and sustainable development policy simulation, surpassing traditional quantitative methods in both theoretical depth and practical breadth.
As a core method of non-parametric frontier analysis, the evolution of DEA reflects the paradigm breakthroughs in efficiency measurement theory. The CCR framework, established by Charnes, Cooper, and Rhodes in 1978 [3], created a new paradigm for relative efficiency assessment by constructing a production frontier in multi-dimensional input–output space. In 1984, Banker et al. introduced the BCC model by adding variable returns to scale constraints [6], effectively overcoming the theoretical limitations of the original CCR model under the constant returns to scale (CRS) assumption, making the efficiency evaluation more aligned with the nonlinear characteristics of real economic systems. However, traditional radial models have obvious flaws: they fail to capture the imbalance between input and output adjustments in real-world production. For example, some enterprises may experience resource waste in certain areas while facing shortages in others, and certain output indicators may fail to meet targets. This non-proportional slack issue can cause efficiency calculations to deviate from reality, and it does not provide managers with precise directions for improvement. To address this, Tone (2001) innovatively proposed an optimization framework based on slack measures (SBM) [7]. By introducing slack variables to simultaneously adjust for input surpluses and output deficiencies, the model significantly improved its robustness to real-world data noise. SBM not only provides a precise depiction of improvement paths for non-efficient units but also, through a dynamic weighting mechanism for slack variables, resolves the misjudgment of efficiency in heterogeneous data contexts, offering a more operational theoretical tool for efficiency optimization in complex systems. This method has been widely applied across various fields and industries [8,9,10].
Existing research in the field of efficiency evaluation faces twofold limitations: first, the traditional SBM model encounters the problem of efficiency homogeneity among efficient decision-making units [11]; second, the existing literature mostly focuses on the regional or industrial macro level, lacking a systematic deconstruction of the heterogeneous efficiency characteristics at the micro-enterprise level [12]. This research gap is particularly prominent in the hydrogen energy field, where related studies often neglect the environmental negative externalities in the green innovation process, resulting in an efficiency evaluation system with a missing ecological dimension [13]. By adopting a multidimensional, multi-output improved SBM model, this paper not only fills the research gap in the evaluation of heterogeneous efficiency at the micro-enterprise level but also introduces the ESG framework, fully incorporating the ecological dimension in the green innovation process, that is, based on the three dimensions of environment (E), society (S), and governance (G), relevant input–output indicators are selected.
Meanwhile, the improved SBM model demonstrates outstanding performance in handling the asymmetry of input–output relationships, enabling the model to more accurately reveal the heterogeneous characteristics of enterprises in the green innovation process, thereby providing a more comprehensive, detailed, and sustainability-compliant evaluation method for efficiency assessments in the hydrogen energy field and other green technology innovations. The contributions of this paper are as follows: (1) Constructing an improved SBM model integrated within the ESG framework to compensate for the missing environmental dimension, refining the differentiation of efficiency values through non-radial slack measurement, revealing the asymmetric characteristics in green innovation input–output, and solving the problems of homogeneity and the static nature of the frontier; (2) achieving the ranking optimization of frontier-efficient enterprises, breaking through the limitation of traditional DEA models that cannot distinguish decision-making units with an efficiency score of 1, thus providing a basis for the evaluation of enterprises’ green innovation competitiveness.
The other parts of this study can be summarized as follows. Section 2 sorts out the literature related to the topic of this study. Section 3 introduces the research methodology of this paper, namely the improved SBM model. Section 4 analyzes the green innovation efficiency measured by the improved SBM model. Section 5 summarizes the conclusions and discusses the limitations.
2. Literature Review
2.1. Research Progress on Green Innovation Efficiency
Green innovation, as a key driver of sustainable development, is centered on achieving the synergistic effects of economic growth and ecological protection through technological innovation [14]. Early research pointed out that green innovation has “dual externalities,” not only reducing internal costs for enterprises but also diminishing environmental negative externalities through technological diffusion [15]. With the intensification of global environmental issues, the scope of green innovation has gradually expanded to include multiple dimensions, such as recycling, pollution control, and eco-friendly processes [16,17].
In terms of evaluating the efficiency of green innovation, scholars generally agree that green innovation efficiency is a critical indicator for measuring its economic and environmental benefits, encompassing assessments at the enterprise, industry, and regional levels [18,19]. The existing literature on green innovation efficiency typically follows a three-tier analytical framework: the geographical spatial dimension, the industrial organization dimension, and the micro-subject dimension. From the geographical spatial perspective, in terms of multinational comparisons, research often focuses on institutional differences and technological diffusion paths between developed and developing countries [20]. In the context of China, studies show significant spatial heterogeneity: there are static efficiency measurements based on provincial administrative units [21] and key urban clusters [22], as well as dynamic mechanism analyses targeting regional development gaps [23] and spatial association effects [24,25].
From the perspective of industrial organization, at the industry level, research focuses on the regional distribution characteristics of specific industries, exploring their temporal–spatial evolution patterns and spatial differentiation mechanisms [26]. Other scholars have constructed a “technology–institution–market” interaction framework to deconstruct the driving factors of industrial green transformation [27]. Finally, the micro subject dimension. In contrast, micro-enterprise level research shows significant regional imbalance: internationally, research emphasizes green innovation policy incentives [28] and technology adoption barriers [29], while domestic empirical studies still face dual limitations—studies often focus on macro data sets of industrial enterprises at the provincial level [30,31], and methodologically, they rely on regional aggregate data to construct “virtual decision units,” although this type of “virtual decision unit”-based method offers overall comparability, it tends to obscure firm-level heterogeneity in organizational strategy, governance structure, and sustainability capabilities. This is particularly evident under the implementation of ESG strategies, where enterprises demonstrate significantly different green performance outcomes [32].
2.2. Methods for Measuring Green Innovation Efficiency
Efficiency research originated with Farrell’s [33] foundational work on production frontier theory, which decomposed efficiency into technical efficiency and allocative efficiency, providing a theoretical framework for subsequent studies. In the field of green innovation, efficiency measurement must address the complexity of multidimensional inputs and outputs, as well as environmental constraints [34]. Traditional parametric methods, such as Stochastic Frontier Analysis (SFA), estimate technical inefficiencies by predefining production functions, but their strong assumptions on function forms limit their application in multi-output scenarios [35,36]. For example, when Wang [37] used SFA to analyze industry innovation efficiency, he found that the method struggled to handle asymmetric data. In contrast, non-parametric methods like Data Envelopment Analysis (DEA) construct production frontiers and can evaluate the relative efficiency of decision-making units (DMUs) without predefining functional forms, showing significant advantages in multi-input and multi-output contexts [38]. Moreover, the non-parametric nature of DEA provides a reliable tool for measuring green innovation efficiency under strong heterogeneity and environmental constraints, demonstrating strong adaptability in dealing with complex variables such as resource rents and policy uncertainty [39]. Since the CCR model was introduced by Charnes et al. [3], DEA has evolved through the BCC model by Banker et al. [6], gradually forming an analytical system adapted to variable returns to scale and heterogeneous data [40].
However, traditional DEA models tend to overestimate efficiency values due to neglecting slack variables [41]. To address this, Tone [7] proposed the Slack-Based Measure (SBM) model, which simultaneously adjusts for input surpluses and output deficiencies, significantly enhancing the robustness of efficiency evaluations. The SBM model has been widely applied in environmental efficiency studies, such as Wu et al. [42], who combined the Shephard distance function to construct an SBM framework that includes undesired outputs, and Li et al. [43], who used a network SBM model to dynamically evaluate the environmental performance of China’s industrial system. Nevertheless, the traditional SBM model has notable limitations. On one hand, it cannot distinguish between different DMUs with an efficiency value of 1, leading to homogenization in efficiency evaluations for these efficient units, making it difficult to further differentiate between them [11]. On the other hand, its fixed production frontier lacks dynamic adjustment ability, making it unable to adapt to changes in inputs and outputs, thus failing to accurately reflect the real efficiency levels of decision units [44]. To capture the dynamic evolution characteristics of efficiency, the Malmquist index decomposes total factor productivity (TFP) into efficiency change (EC) and technological progress (TC), providing methodological support for dynamic efficiency analysis [45]. Yao and Zhang integrated the DEA and Malmquist models to reveal the dynamic relationship between innovation performance and environmental factors from a systemic perspective [46]. However, existing research mainly focuses on macro-level analyses and lacks a dynamic breakdown of enterprise heterogeneity characteristics [12].
Therefore, this paper constructs an improved super-efficiency SBM model, which removes the reference set of the DMU itself and employs asymmetric efficiency expansion to overcome the static limitations of traditional SBM’s production frontier. This method not only enables accurate measurement of static efficiency but also allows dynamic panel analysis to track technological breakthrough paths, providing dual theoretical support for optimizing micro-enterprise resource allocation and promoting low-carbon transformation.
3. Research Methods
3.1. Improved SBM Model
The framework of the improved SBM model for analyzing green innovation efficiency using asymmetric data is shown in Figure 1. Three-stage efficiency evaluation framework based on the SBM model. The framework consists of three phases: (1) Input Construction Phase, where input and output indicators are defined; (2) Efficiency Modeling Phase, where the traditional SBM model computes preliminary scores and the efficiency improvement layer refines them; and (3) Output Interpretation Phase, where results are aggregated and the final efficiency value is obtained. Arrows denote the logical flow and transformation of data across stages.
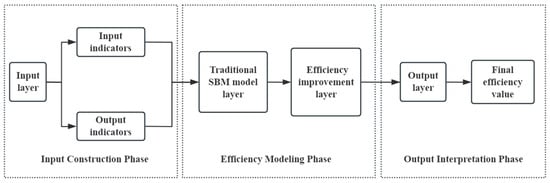
Figure 1.
Framework of the improved SBM model.
The SBM model proposed by Tone directly quantifies the specific values of input excess and output shortfall, and incorporates them into efficiency calculations. Its core formula is as follows:
Subject to the following constraints:
In the Slacks-Based Measure (SBM) model employed in this research, key parameters are defined as follows: the efficiency score ρ ∈ [0, 1] indicates the comprehensive efficiency level of Decision Making Units (DMUs), where values approaching 1 denote higher efficiency; the input slack variable quantifies the excess amount of the i-th input (i.e., positive deviation from the efficient frontier), while the output slack variable measures the shortfall in the r-th output (i.e., negative gap relative to the production frontier); whereas the intensity weight λj serves as a composite variable for the j-th DMU in constructing the efficiency frontier through linear combination. This non-oriented model simultaneously optimizes ρ and slack variables, thus resolving the inherent slack bias limitation in conventional DEA approaches. Notably, the objective function is expressed in a fractional (reciprocal) form, which balances both input and output slack ratios and allows the efficiency score to exceed 1 in the improved model—thus enabling further discrimination among frontier-efficient units. This non-oriented model simultaneously optimizes ρ and slack variables, thereby resolving the inherent slack bias limitation in conventional DEA approaches.
Subject to the following constraints:
In the improved SBM model, the efficiency score is denoted by ρ*, which typically takes a value greater than or equal to 1. A higher score indicates that the evaluated decision-making unit (DMU) demonstrates superior performance in terms of input utilization and output generation. In the improved SBM model, the efficiency score is denoted by ρ*, which typically takes a value greater than or equal to 1. A higher score indicates that the evaluated decision-making unit (DMU) demonstrates superior performance in terms of input utilization and output generation. Compared to the conventional SBM model, where the evaluated DMU is included in the reference set, the improved SBM removes it to allow further discrimination among efficient units. This explains the constraint form and the necessity of the j ≠ 0 notation, even though j nominally ranges from 1 to n. The exclusion of the evaluated DMU eliminates self-referential bias, which could otherwise lead to inflated or misleading efficiency scores, especially when many units appear equally efficient.
More fundamentally, the improved SBM model introduces structural changes to both the objective function and the constraint expressions relative to the standard SBM formulation. Specifically, the objective function adopts a fractional form, where efficiency is expressed as a ratio involving weighted averages of normalized slacks. This design not only maintains the slack-based evaluation logic but also allows the efficiency score to exceed 1, which is the primary reason that fully efficient DMUs can now be meaningfully ranked. The fractional structure implies that any reduction in slacks will proportionally increase the final efficiency value, and when a DMU performs significantly better than the constructed frontier, the efficiency score naturally exceeds 1. In contrast, the standard SBM model, using a [0, 1] scale with self-inclusion, cannot achieve such differentiation.
Together, the exclusion mechanism (j ≠ 0) and the reciprocal objective function enhance the model’s discriminatory power while preserving its non-radial and non-oriented characteristics, making it particularly suitable for identifying performance differences among frontier-efficient units.
In the improved SBM model, the objective function ρ* measures the overall technical efficiency (TE) of a decision-making unit under the assumption of constant returns to scale (CRS), incorporating both input slacks and output slacks . To obtain pure technical efficiency (PTE), the model can be adapted by adding a convexity constraint thereby enabling the evaluation under variable returns to scale (VRS).
Based on these two metrics, scale efficiency (SE) can be derived as:
This decomposition framework allows distinguishing whether inefficiencies arise from suboptimal management (technical inefficiency) or from operating at a non-optimal production scale.
In summary, the improved SBM model enhances evaluation objectivity by excluding the evaluated DMU from the reference set, while the adoption of a reciprocal objective function is the fundamental reason that allows efficiency scores to exceed 1—thereby enabling finer differentiation among frontier-efficient units.
3.2. Variable Selection and Data Description
This study collected detailed data from 62 hydrogen energy companies between 2018 and 2022, sourced from official annual reports and industry databases. Before conducting the empirical analysis, the data set underwent rigorous preprocessing to ensure the accuracy and reliability of the analysis. Data preprocessing included checking data integrity and handling missing values. Statistical methods were used to evaluate and impute some missing data, ensuring the uniformity and continuity of the subsequent analysis.
In terms of variable selection, this study systematically integrated the ESG framework into the evaluation system of green innovation efficiency for hydrogen energy companies. Specifically, the variables were selected to comprehensively capture the potential impact of the three ESG dimensions: Environment (E), Social (S), and Governance (G). By referencing a substantial body of literature on green innovation efficiency and ESG, the most representative and relevant input–output variables were ultimately chosen to build the evaluation framework, as detailed in Table 1.

Table 1.
Green innovation efficiency input–output indicators.
- (1)
- Input Indicator System
For the environmental dimension, drawing on Bai’s research [47], environmental governance expenditure is adopted to quantify the financial investment intensity of corporate environmental protection practices. For the social dimension, integrating research and development (R&D) manpower and capital investment, as well as employee compensation, based on studies by Pan [48] and Liang et al. [49], reflects the allocation of corporate innovation resources and the level of social responsibility fulfillment. For the governance dimension, with reference to Wang [50], the proportion of R&D investment and the proportion of independent directors are used to evaluate strategic execution efficiency and governance checks and balances, forming an assessment framework that integrates innovation drive and risk management.
- (2)
- Output Indicator System
For the environmental dimension, expected and unexpected outputs are distinguished. The number of green patents is used to measure green innovation achievements [51]; the negative externality of the environment is represented by logarithm of air pollution index [52]. For the social dimension, to reflect the management level of supplier diversity, supply chain dispersion, and the depth of corporate social responsibility report disclosure are combined [53], assessing the optimization capability of corporate social relation networks. For the governance dimension, operating revenue growth rate is selected as the core indicator of economic performance, and drawing on Wang [53], net intangible assets are introduced to quantify the risk mitigation value derived from governance mechanisms, forming an assessment paradigm that integrates economic outcomes and institutional capital.
4. Research Findings
4.1. Differentiation Improvement of Efficiency Value
Using MaxDEA Ultra 9.1 software, a static evaluation of the green innovation efficiency of enterprises was conducted based on both the original SBM model and the improved SBM model. The specific results are as follows:
The comparison of the green innovation efficiency measurement results for 62 hydrogen energy enterprises based on the improved SBM model and the traditional SBM model is shown in Table 2.
Table 2.
Green innovation efficiency values of hydrogen energy companies from 2018 to 2022.
The traditional SBM model assigns an efficiency value of 1 to multiple enterprises, indicating that these enterprises are identified as relatively efficient within the sample. However, when multiple decision-making units (DMUs) are assigned an efficiency score of 1 under the traditional SBM model, the method fails to capture underlying differences in input-output behavior. For example, in our data set, both Weichai Power and Weifu High-Technology Group achieve a score of 1, yet they exhibit distinct characteristics: Weichai Power has a significantly higher R&D investment amount (approximately CNY 6.5 billion) and more green invention applications (68 cases), while Weifu High-Technology Group has only CNY 596 million in R&D and 28 green inventions. Despite these observable differences in innovation intensity and environmental impact, the traditional SBM model treats them as equally efficient, leading to homogeneity in evaluation and masking actual performance variations. For example, enterprises such as Weichai Power (with ID number 1), Meijin Energy (with ID number 3), Jilin Electric Power (with ID number 5), Yunnei Power (with ID number 6), Baotailong (with ID number 53), and Baoshan Iron & Steel (with ID number 38) all receive an efficiency value of 1 under the traditional SBM model, making it impossible to identify the better-performing entities among them. In contrast, the improved SBM model introduces an efficiency value expansion mechanism on the original basis, further stratifying units with an efficiency value of 1, thereby significantly enhancing the discriminatory power of the efficiency measurement.
In this model, the efficiency values break through the traditional upper limit and form a continuous distribution, so that different efficient enterprises no longer “overlap” in the evaluation space but can be ranked and compared. For example, Meijin Energy has an average efficiency value of 1.629, Jilin Electric Power 1.329, Weichai Power 1.233, and Baoshan Iron & Steel and Baotailong are 1.320 and 1.289, respectively, clearly widening the gap between enterprises that originally had identical efficiency values under the traditional model. The improved model excludes the self-influence of the evaluated unit within its reference set, constructing a purer external comparison frontier, thus achieving a finer-grained identification of decision-making units even under the “efficient” state.
Figure 2 presents the radar chart comparison of enterprises’ green innovation efficiency values based on the traditional SBM model and the improved SBM model (for ease of viewing, the 62 enterprises are numbered). It can be intuitively observed from the figure that the traditional SBM model shows a tendency of efficiency values clustering across multiple decision-making units, especially in the region where efficiency values approach 1.0, with a clear “congestion” phenomenon. This indicates that the model lacks detailed discriminatory power among multiple enterprises, leading to the problem of efficiency homogeneity. In contrast, the improved SBM model exhibits a more dispersed and layered distribution pattern, with efficiency values showing significant gaps among different decision-making units, reflecting a higher degree of discrimination.
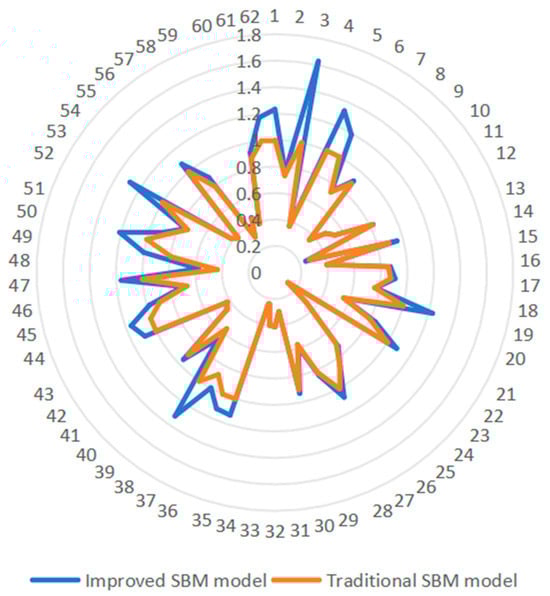
Figure 2.
Radar chart comparison of enterprises’ green innovation efficiency values based on the traditional SBM model and the improved SBM model.
Figure 3 depicts the distribution of enterprises across various efficiency intervals, based on the results derived from the traditional SBM model and the improved SBM model. Under the traditional model, a disproportionately large number of enterprises—30 in total—are clustered in the 0.8–1 interval, far exceeding the numbers in other intervals. This excessive concentration indicates the model’s limited ability to distinguish among high-performing units near the efficiency frontier, thereby masking nuanced differences in firm performance.
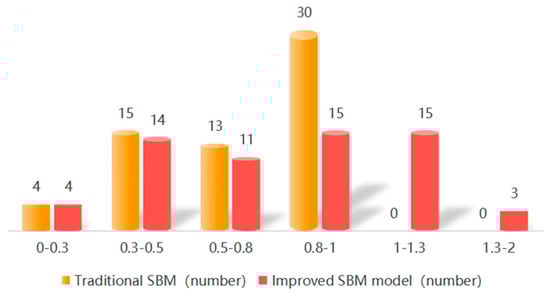
Figure 3.
Distribution structure of efficiency values under the traditional SBM model and the improved SBM model.
By contrast, the improved SBM model yields a significantly more stratified and balanced distribution of efficiency scores. The number of enterprises in the 0.8–1 range decreases from 30 to 15, and a notable portion of enterprises are redistributed into higher intervals. Specifically, 15 enterprises fall into the 1–1.3 range, and 3 enterprises are further extended into the 1.3–2 range. These results indicate that the model’s extended scoring mechanism successfully differentiates among originally “efficient” enterprises, assigning higher efficiency scores to those with relatively superior performance.
This layered distribution not only demonstrates improved resolution among efficient units but also enhances the interpretability and practical relevance of the evaluation outcomes. As such, the improved model provides a more robust analytical foundation for guiding resource allocation, identifying top performers, and informing incentive mechanisms in green innovation policy and management.
4.2. Ranking Optimization
Table A1 presents the enterprise green innovation efficiency ranking results based on the traditional SBM model and the improved SBM model. The comparison shows that the traditional SBM model exhibits a significant “efficiency saturation” phenomenon when measuring the efficiency of decision-making units (DMUs); that is, once some enterprises reach an efficiency value of 1.000, the model cannot further distinguish among these units on the efficiency frontier, leading to a large number of “ties” in the ranking and a lack of effective discrimination. For example, several enterprises such as Meijin Energy, Jilin Electric Power, Baoshan Iron & Steel, Baotailong, and Weichai Power are all assigned the same efficiency value of 1.000 under the traditional SBM model, resulting in a “congestion” at the efficiency frontier, making it difficult to reflect the actual differences in green innovation performance among these enterprises.
In contrast, the improved SBM model introduces a super-efficiency calculation mechanism, allowing efficiency values to exceed the traditional upper limit of 1.000, forming a more continuous and expansive distribution of efficiency values. Under the improved model, enterprises that originally shared the same efficiency value are now differentiated, presenting a more detailed hierarchical distinction. Specifically, the efficiency value of Meijin Energy increased from 1.000 to 1.629, Jilin Electric Power rose to 1.329, Baoshan Iron & Steel reached 1.320, Baotailong was 1.289, and Weichai Power was 1.233. These changes in efficiency values not only reflect the actual advantages these enterprises have in resource utilization and green innovation input–output performance but also validate the model’s effectiveness in refining the ranking of frontier-efficient units.
In terms of overall trends, the improved SBM model forms an efficiency gradient among the efficient enterprises, no longer treating enterprises with an efficiency value of 1.000 as a homogeneous group, but providing a more accurate distinction based on the degree of outperformance. For example, Center Power Tech, Tongji Science & Technology, and Yunnei Power achieved efficiency values of 1.229, 1.211, and 1.190, respectively, under the improved model, further widening the gap with other enterprises. This expanded ranking mechanism allows for the subtle differences among enterprises in green innovation capability and resource allocation efficiency to be fully reflected, thus enhancing the explanatory power and application value of the model evaluation.
Overall, the improved SBM model, while preserving the fundamental strengths of the original DEA framework, addresses the limitations of the traditional SBM in differentiating frontier-efficient enterprises by extending the range of efficiency scores and enhancing the stratification of evaluation results. This allows the model to not only identify whether a unit is efficient but also to reveal nuanced distinctions among efficient entities, offering a more refined analytical foundation for strategic decision-making, performance benchmarking, and the development of targeted policy incentives.
4.3. Dynamic Analysis of Changes in Enterprises’ Green Innovation Efficiency Values
The green innovation efficiency of hydrogen energy enterprises underwent a series of complex dynamic changes between 2018 and 2022, reflecting multidimensional fluctuations in technological evolution. The TE, PTE, and SE values presented in Table 3 are all derived using the improved SBM model. By incorporating slack variables and a super-efficiency framework, the proposed model overcomes the limitations of traditional SBM in evaluating units on the efficiency frontier. Unlike conventional methods, it enables a more refined stratification of efficiency scores and reveals performance differences even among technically efficient firms. Therefore, the trends shown in Table 3 reflect not only the overall dynamics of green innovation efficiency but also the improved model’s ability to distinguish nuanced variations in firm performance across years.
Table 3.
Decomposition of green innovation efficiency of hydrogen energy companies from 2018 to 2022.
Technical efficiency (TE) declined from 2018 to 2019, rebounded briefly in 2019–2020, dropped again in 2020–2021, and slightly recovered in 2021–2022. The rebound in 2020 may be attributed to favorable policy developments. Domestically, the Energy Law (Draft for Public Comments) released in 2020 explicitly encouraged the development of hydrogen energy, while many local governments rolled out supportive plans and incentives. Internationally, the EU’s Hydrogen Strategy and the U.S. Hydrogen Economy Blueprint accelerated global attention and short-term investment in hydrogen-related R&D. The subsequent decline in 2020–2021 reflects delays in translating policy-driven R&D into tangible outcomes, persistent technological bottlenecks, and disruptions from the pandemic. The modest recovery in 2021–2022 suggests that some enterprises began to realize returns from earlier investments, with hydrogen technologies entering pilot and demonstration stages.
Pure technical efficiency (PTE) fluctuated less significantly, decreasing from 1.032 in 2018 to 0.793 in 2021, showing that under controlled scale factors, the enterprises’ innovation capabilities did not decline sharply. However, the fact that PTE fell below 0.8 in 2021 suggests that enterprises faced systemic difficulties, such as tightened R&D funding or bottlenecks in core technologies.
Scale efficiency (SE) exhibited a U-shaped trend, standing at 0.873 in 2018, decreasing to 0.855 in 2019, rebounding to 0.922 in 2020, and then declining again to 0.853 in 2021 and further to 0.827 in 2022. This change indicates that the impact of economies of scale failed to continuously improve innovation efficiency, and after peaking in 2020, the phenomenon of diseconomies of scale intensified. Although the proportion of enterprises experiencing increasing returns to scale remained high, in 2021 and 2022, the number of enterprises experiencing decreasing returns to scale increased, indicating that some enterprises failed to match their scale expansion and fell into inefficiency. By 2022, no enterprises remained in the “constant returns to scale” state, suggesting that the industry was undergoing a structural adjustment.
In summary, the green innovation efficiency of hydrogen energy enterprises does not follow a simple upward or downward trend but rather constitutes a dynamic system influenced by multiple factors, including technological accumulation, management capability, market environment, and economies of scale. To enhance overall innovation efficiency, enterprises need to achieve a better balance between scale expansion and technological investment, avoiding low-efficiency expansion caused by blind scaling while building continuous innovation capabilities to break through the current bottlenecks in technical efficiency.
5. Conclusions and Discussion
This study constructs an improved SBM model based on the ESG framework to comprehensively evaluate the green innovation efficiency of 62 hydrogen energy enterprises from 2018 to 2022. The results show that the improved model significantly enhances the differentiation and sensitivity of efficiency values. In the traditional SBM model, enterprises with an efficiency value of 1 could not be further distinguished, leading to homogenization in efficiency evaluation. The improved SBM model, by breaking through the upper limit of efficiency values, enables effective ranking of these enterprises, allowing for fine-grained comparison among enterprises at the same efficiency level based on their super-efficiency values. Through the dynamic analysis of green innovation efficiency of hydrogen energy enterprises from 2018 to 2022, it is found that technical efficiency and scale efficiency exhibited certain fluctuations during this period. In particular, the decline in technical efficiency reflects bottlenecks in the innovation process, while the fluctuating trend in scale efficiency indicates that some enterprises did not fully leverage the advantages of scale expansion and may have experienced inefficiencies due to suboptimal scale operations. Overall, the changes in green innovation efficiency of hydrogen energy enterprises are influenced by multiple factors such as technological innovation, management capabilities, and market environment. In the future, enterprises should focus more on balancing technological accumulation and economies of scale to improve overall efficiency.
By systematically evaluating the green innovation efficiency of hydrogen energy enterprises, this study reveals the core patterns of technological evolution and resource allocation and their dual implications for enterprises’ sustainable development. At the theoretical level, the spatial–temporal differentiation of green innovation efficiency indicates that efficiency improvement is not solely dependent on technological breakthroughs but is the result of the synergy between technological accumulation, management optimization, and economies of scale. At the practical level, the multidimensional heterogeneity of green innovation efficiency provides clear strategic guidance for enterprises: (1) Leading enterprises can build industry standards through the technology spillover effect, converting super-efficiency values into market pricing power and supply chain dominance; (2) midstream enterprises should focus on correcting slack variables, such as reducing redundancy in environmental governance investments or improving the conversion rate of green patents to break through efficiency thresholds; (3) lagging enterprises should prioritize addressing diseconomies of scale, achieving efficiency leaps through industrial chain collaboration or technology integration. Moreover, the quantified correlation of environmental negative externalities forces enterprises to embed ESG into the entire innovation process, shifting from a “cost center” to a “value creator”.
For enterprise production practices, the improved model offers guiding value: First, the decomposition of slack variables enables the precise identification of inefficient links, supporting the development of differentiated improvement strategies; second, the dynamic comparison of super-efficiency values quantifies the marginal returns of technological iteration, providing a basis for R&D investment decisions. At the theoretical level, the model reconstructs the frontier dynamically and extends efficiency values, addressing the limitations of homogeneity and static nature in traditional DEA models, and providing a better mathematical framework for the analysis of heterogeneous data.
However, there are some limitations to this study: First, the five-year data span may not fully capture the technological cycle characteristics of the hydrogen energy industry; second, the quantification of undesirable outputs relies on logarithmic transformation, which weakens the actual impact of environmental negative externalities. Future research could combine longer panel data and introduce directional distance functions (DDF) to further optimize the measurement accuracy of undesirable outputs. Overall, through model innovation and empirical validation, this study provides an analytical tool with both theoretical rigor and practical operability for the green transition of the hydrogen energy industry, and its methodological framework can also be extended to the efficiency evaluation and policy design of other strategic emerging industries.
Author Contributions
Conceptualization, L.C. and Y.Y.; methodology, L.C.; software, Y.Y.; formal analysis, C.Y.; data curation, Y.Y. and C.Y.; writing—original draft preparation, L.C., Y.Y. and C.Y.; writing—review and editing, L.C., Y.Y. and C.Y. All authors have read and agreed to the published version of the manuscript.
Funding
This research is supported by 2023 Jiangsu University Philosophy and Social Science Research Major Project (Grant Number: 2023SJZD027). 2024 Key Project of Jiangsu Education Science Planning (Grant Number: JS/2024/ZD0111-04949). 2025 Jiangsu Graduate Research And Innovation Plan Project (Grant Number: KYCX25_1250). Postgraduate Education and Teaching Reform Project of Nanjing University of Posts and Telecommunications (Project Number: JGKT23_XJ20). 2023 Jiangsu Province Higher Education Teaching Reform Project (Project Number: 2023JSJG773).
Data Availability Statement
Data are contained within the article.
Acknowledgments
The authors acknowledge editors and reviewers for providing their valuable comments to improve this manuscript. The authors are in charge of all the mistakes in this research.
Conflicts of Interest
The authors declare that they have no conflicts of interest.
Appendix A
Table A1.
Enterprise ranking based on the improved SBM model.
Table A1.
Enterprise ranking based on the improved SBM model.
| Company | Traditional SBM Model | Rank | Improved SBM Model | Rank | Company | Traditional SBM Model | Improved SBM Model | ||
|---|---|---|---|---|---|---|---|---|---|
| Average | Average | Average | Average | ||||||
| Meijin Energy | 1.000 | 1 | 1.629 | 1 | Narada Power Source | 0.798 | 31 | 0.844 | 32 |
| Jilin Electric Power | 1.000 | 1 | 1.329 | 2 | Broad-Ocean Motor | 0.819 | 30 | 0.825 | 33 |
| Baoshan Iron & Steel | 1.000 | 1 | 1.320 | 3 | Satellite Chemical | 0.761 | 34 | 0.771 | 34 |
| Baotailong | 1.000 | 1 | 1.289 | 4 | Weifu High-Technology Group | 0.735 | 36 | 0.766 | 35 |
| Weichai Power | 1.000 | 1 | 1.233 | 5 | DEC | 0.734 | 37 | 0.751 | 36 |
| Center Power Tech | 1.000 | 1 | 1.229 | 6 | Antai Technology | 0.739 | 35 | 0.750 | 37 |
| Tongji Science & Technology | 1.000 | 1 | 1.211 | 7 | Sungrow | 0.710 | 38 | 0.733 | 38 |
| Yunnei Power | 1.000 | 1 | 1.190 | 8 | Yangmei Chemical | 0.671 | 39 | 0.702 | 39 |
| Lopal Tech | 1.000 | 1 | 1.176 | 9 | Nbtm New Materials Group | 0.558 | 41 | 0.664 | 40 |
| Baic Bluepark | 1.000 | 1 | 1.162 | 10 | Dowstone Technolog | 0.569 | 40 | 0.591 | 41 |
| Hunan Corun | 1.000 | 1 | 1.157 | 11 | SOPO | 0.435 | 47 | 0.577 | 42 |
| Shudao Equipment Technology | 1.000 | 1 | 1.129 | 12 | Hiconics | 0.552 | 42 | 0.556 | 43 |
| Longsheng Technology | 1.000 | 1 | 1.118 | 13 | Sinomascience&Technology | 0.534 | 43 | 0.535 | 44 |
| Sino-Platinum Metals | 1.000 | 1 | 1.092 | 14 | China Steel Tianyuan | 0.482 | 44 | 0.483 | 45 |
| Yolocard | 1.000 | 1 | 1.083 | 15 | Hanma Technology | 0.454 | 45 | 0.461 | 46 |
| SEC | 1.000 | 1 | 1.079 | 16 | Jinneng | 0.441 | 46 | 0.451 | 47 |
| East Group | 1.000 | 1 | 1.077 | 17 | Camel Group | 0.422 | 48 | 0.424 | 48 |
| ENN | 0.793 | 32 | 1.002 | 18 | Times New Material Technology | 0.422 | 48 | 0.422 | 49 |
| Dongfeng Automobile | 0.881 | 23 | 0.995 | 19 | Baosi Energy Equipment | 0.410 | 50 | 0.410 | 50 |
| Ch Dynamics | 0.899 | 20 | 0.977 | 20 | Lead | 0.400 | 51 | 0.400 | 51 |
| FOTON | 0.900 | 18 | 0.953 | 21 | Oxygen Plant | 0.395 | 52 | 0.396 | 52 |
| GEM | 0.886 | 21 | 0.952 | 22 | Tenglong Auto Parts | 0.389 | 53 | 0.389 | 53 |
| Zhongtai Cryogenic Technology | 0.900 | 18 | 0.932 | 23 | GWM | 0.383 | 54 | 0.383 | 54 |
| Dayuan Pumps Industry | 0.879 | 24 | 0.925 | 24 | Hangjin Technology | 0.366 | 55 | 0.368 | 55 |
| Kain Corporation | 0.884 | 22 | 0.912 | 25 | Sanhua Intelligent Controls | 0.357 | 56 | 0.361 | 56 |
| Dongfang Precision | 0.875 | 25 | 0.909 | 26 | Furui Special Equipment | 0.325 | 57 | 0.325 | 57 |
| Jingcheng Stock | 0.845 | 28 | 0.882 | 27 | Lanpec Technologies Limited | 0.307 | 58 | 0.307 | 58 |
| Lifan Technology | 0.791 | 33 | 0.875 | 28 | Great Power | 0.297 | 59 | 0.297 | 59 |
| Qingdao Hanhe Cable | 0.856 | 27 | 0.873 | 29 | Invt Technology | 0.280 | 60 | 0.248 | 60 |
| Kanhoo Industry | 0.857 | 26 | 0.863 | 30 | Houpu Clean Energy Group | 0.242 | 61 | 0.242 | 61 |
| SLAC | 0.822 | 29 | 0.847 | 31 | Everwin Precision Technology | 0.124 | 62 | 0.124 | 62 |
References
- Baldini, M.; Maso, L.D.; Liberatore, G.; Mazzi, F.; Terzani, S. Role of country- and firm-level determinants in environmental, social, and governance disclosure. J. Bus. Ethics 2018, 150, 79–98. [Google Scholar] [CrossRef]
- Qiao, J. Hydrogen Energy Industry in Henan Province: Industrial Transition and Innovation Path under the Green Energy Revolution. J. North. Econ. 2024, 10, 36–39. [Google Scholar]
- Charnes, A.; Cooper, W.W.; Rhodes, E. Measuring the efficiency of decision-making units. Am. Econ. Rev. 1978, 68, 39–41. [Google Scholar] [CrossRef]
- Charnes, A.; Cooper, W.W.; Golany, B.; Seiford, L.; Stutz, J. Foundations of data envelopment analysis for Pareto-Koopmans efficient empirical production functions. J. Econ. 1985, 30, 91–107. [Google Scholar] [CrossRef]
- Cooper, W.W. Encyclopedia of operations research and management science. In Data Envelopment Analysis; Springer: Boston, MA, USA, 2013; pp. 349–358. [Google Scholar]
- Banker, R.D.; Charnes, A.; Cooper, W.W. Some models for estimating technical and scale efficiency in data envelopment analysis. Manag. Sci. 1984, 30, 1078–1099. [Google Scholar] [CrossRef]
- Tone, K. A slacks-based measure of efficiency in data envelopment analysis. Eur. J. Oper. Res. 2001, 130, 498–509. [Google Scholar] [CrossRef]
- Chen, X.; Gao, Y.; An, Q.; Wang, Z.; Neralić, L. Energy efficiency measurement of Chinese Yangtze River Delta’s cities transportation: A DEA window analysis approach. Energy Effic. 2018, 11, 1941–1953. [Google Scholar] [CrossRef]
- Zheng, Z. Energy efficiency evaluation model based on DEA-SBM-Malmquist index. Energy Rep. 2021, 7, 397–409. [Google Scholar] [CrossRef]
- Wang, Q.; Liu, T.; Li, R. Leveraging Economic Efficiency for CO2 Reduction and Energy Transition: The Role of Climate Vulnerability, GVC Integration, Digitalization and Energy Intensity. Sustain. Dev. 2025. [Google Scholar] [CrossRef]
- Gao, X.; Guo, Z.; Zhao, M.; Li, G.; Wang, Q. The spatiotemporal evolution, differences, and spatial convergence of green development efficiency in Chinese cities. Chin. J. Ecol. 2025, 45, 3790–3805. [Google Scholar]
- Lyu, Y.; Zhang, L.; Wang, D. The impact of digital transformation on low-carbon development of manufacturing. Front. Environ. Sci. 2023, 11, 1134882. [Google Scholar] [CrossRef]
- Chen, W.; Wang, X.; Peng, N.; Wei, X.; Lin, C.; Pelozo, E.I. Evaluation of the Green Innovation Efficiency of Chinese Industrial Enterprises: Research Based on the Three-Stage Chain Network SBM Model. Math. Probl. Eng. 2020, 2020, 3143651. [Google Scholar] [CrossRef]
- Rennings, K. Redefining Innovation—Eco-Innovation Research and the Contribution from Ecological Economics. Ecol. Econ. 2000, 32, 319–322. [Google Scholar] [CrossRef]
- Chen, Y.S.; Lai, S.B.; Wen, C.T. The Influence of Green Innovation Performance on Corporate Advantage in Taiwan. J. Bus. Ethics 2006, 67, 331–339. [Google Scholar] [CrossRef]
- Brawn, E.; Wield, D. Regulation as a Means for the Social Control of Technology. Technol. Anal. Strateg. Manag. 1994, 3, 498–504. [Google Scholar] [CrossRef]
- Krabbe, J.J.; Willem, H. National Income and Nature: Externalities, Growth and Steady State: Externalities, Growth, and Steady State; Springer: Dordrecht, The Netherlands, 1992; Volume 5. [Google Scholar]
- Sun, Y.; Luo, B.; Wang, S.; Fang, W. What You See Is Meaningful: Does Green Advertising Change the Intentions of Consumers to Purchase Eco-Labeled Products? Bus. Strat. Environ. 2021, 30, 694–704. [Google Scholar] [CrossRef]
- Zhao, N.; Liu, X.; Pan, C.; Wang, C. The Performance of Green Innovation: From an Efficiency Perspective. Socio-Econ. Plan. Sci. 2021, 78, 101062. [Google Scholar] [CrossRef]
- Costantini, V.; Crespi, F.; Palma, D. Characterizing the Policy Mix and Its Impact on Eco-Innovation: A Patent Analysis of Energy-Efficient Technologies. Res. Policy 2017, 46, 799–819. [Google Scholar] [CrossRef]
- Gao, P.; Wang, X.H. Fiscal Investment, Environmental Regulation and Green Technology Innovation Efficiency—Empirical Analysis Based on Data from Industrial Enterprises Above Designated Size from 2008 to 2015. Ecol. Econ. 2018, 34, 93–99. [Google Scholar]
- Lv, C.C.; Shao, C.H.; Cui, Y. Spatiotemporal Evolution and Influencing Factors of Green Innovation Efficiency in China. Res. Financ. Econ. Issues 2020, 12, 50–57. [Google Scholar]
- Zhang, C.J.; Hou, M.X.; Chen, Y.Q. Spatiotemporal Evolution Trends of Green Innovation Efficiency in the Yangtze River Economic Belt. Sci. Technol. Manag. Res. 2022, 42, 51–58. [Google Scholar]
- Wang, R.; Duan, Y.C.; Liu, L.Q. Green Innovation Effect of Financial Agglomeration: Spatial Correlation Characteristics and Urban Heterogeneity. Stat. Inf. Forum 2024, 39, 58–73. [Google Scholar]
- Cheng, S.X.; Liu, S.J. Intellectual Property Protection and Urban Green Technology Innovation Efficiency in the Yangtze River Economic Belt—Spatial Effect Analysis Based on the Innovation Value Chain Perspective. China Univ. Geosci. Soc. Sci. Ed. 2024, 24, 41–56. [Google Scholar]
- Wu, C.; Yang, S.W.; Tang, P.C.; Wu, T.; Fu, S.K. Construction of Green Innovation Efficiency Improvement Model for China’s Heavy Pollution Industries. China Popul. Resour. Environ. 2018, 28, 40–48. [Google Scholar]
- Li, X.X.; Tang, X.H. Research on the Mechanism of Digital Transformation on Green Innovation Efficiency of Manufacturing Enterprises. Financ. Econ. 2024, 4, 85–94. [Google Scholar]
- Zailani, S.; Iranmanesh, M.; Nikbin, D.; Foroughi, B. Environmental Outcome of Green Technology Innovation Adoption in the Transportation Industry in Malaysia. Asian J. Technol. Innov. 2014, 22, 286–301. [Google Scholar] [CrossRef]
- Borsatto, J.; Amui, L.B.L. Green Innovation: Unfolding the Relation with Environmental Regulations and Competitiveness. Resour. Conserv. Recycl. 2019, 149, 445–454. [Google Scholar] [CrossRef]
- Li, C.S. Evaluation of Green Innovation Efficiency in China’s Industrial Enterprises—Analysis Based on a Panel Time-Varying Stochastic Frontier Model. Technol. Econ. 2020, 39, 119–125. [Google Scholar]
- Bai, M.G.; Zhang, Y.; Fu, Y.L.; Lu, Y.; Lu, K. Research on Green Technology Innovation Efficiency of Iron and Steel Enterprises from the Perspective of Innovation Value Chain. Anhui Univ. Technol. Soc. Sci. 2019, 36, 13–16. [Google Scholar]
- Liu, W.; Yan, H. The evaluation of ESG strategy implementation effect based on performance prism: Evidence from the industrial and commercial bank of China. Humanit. Soc. Sci. 2025, 12, 395. [Google Scholar] [CrossRef]
- Farrell, M.J. The Measurement of Productive Efficiency. J. Ser. A Gen. 1957, 120, 253–281. [Google Scholar] [CrossRef]
- Aigner, D.J.; Lovell, C.A.K.; Schmidt, P. Formulation and Estimation of Stochastic Frontiers Production Function Models. J. Econ. 1977, 1, 21–37. [Google Scholar] [CrossRef]
- Tovar, B. Technical Efficiency and Productivity Changes in Spanish Airports: A Parametric Distance Functions Approach. Transp. Res. Part E Logist. Transp. Rev. 2010, 46, 249–260. [Google Scholar] [CrossRef]
- Wang, M.; Zhang, H.; Dang, D.; Guan, J.; He, Y.; Chen, Y. Fiscal Decentralization, Local Government Environmental Protection Preference, and Regional Green Innovation Efficiency: Evidence from China. Environ. Sci. Pollut. Res. 2023, 30, 85466–85481. [Google Scholar] [CrossRef]
- Wang, M.; Wong, M.C.S. International R&D Transfer and Technical Efficiency: Evidence from Panel Study Using Stochastic Frontier Analysis. World Dev. 2012, 40, 1982–1998. [Google Scholar][Green Version]
- Bowlin, W.F. Measuring Performance: An Introduction to Data Envelopment Analysis (DEA). J. Cost Anal. 1998, 15, 3–27. [Google Scholar] [CrossRef]
- Chen, L.; Gozgor, G.; Mahalik, M.K.; Pal, S.; Rather, K.N. How does geopolitical risk affect CO2 emissions? The role of natural resource rents. Resour. Policy 2023, 87, 104321. [Google Scholar] [CrossRef]
- Yang, G.L.; Liu, W.B.; Zheng, H.J. A Review of Data Envelopment Analysis (DEA). Syst. Eng. 2013, 28, 840–860. [Google Scholar]
- Chen, L.; Xie, X.; Yao, Y.; Huang, W.; Luo, G. A Hybrid Data Envelopment Analysis–Random Forest Methodology for Evaluating Green Innovation Efficiency in an Asymmetric Environment. Symmetry 2024, 16, 960. [Google Scholar] [CrossRef]
- Wu, J.; Lu, X.; Guo, D.; Kao, C. Slacks-Based Efficiency Measurements with Undesirable Outputs in Data Envelopment Analysis. Int. J. Inf. Technol. Decis. Mak. 2017, 16, 1005–1021. [Google Scholar] [CrossRef]
- Li, Y.; Shi, X.; Emrouznejad, A.; Yang, F. Environmental Performance Evaluation of Chinese Industrial Systems: A Network SBM Approach. J. Oper. Res. Soc. 2018, 69, 825–839. [Google Scholar] [CrossRef]
- Färe, R.; Grosskopf, S.; Lindgren, B.; Roos, P. Productivity Changes in Swedish Pharmacies 1980–1989. J. Prod. Anal. 1992, 3, 85–101. [Google Scholar] [CrossRef]
- Malmquist, S. Index Numbers and Indifference Surfaces. Trabajos Estad. 1953, 4, 209–242. [Google Scholar] [CrossRef]
- Yao, K.; Zhang, Q. Impact of Scientific Innovation Climate on the Sustainable Effectiveness of Talent Introduction—Based on the DPSIR-DEA-Malmquist Model and Threshold Effect Analysis. Technol. Econ. 2025, 44, 63–79. [Google Scholar]
- Bai, X. Research on Performance Evaluation of Company S Based on ESG Perspective. Bachelor’s Thesis, Hebei University, Baoding, China, 2024. [Google Scholar]
- Pan, S.N. Research on the Impact of Corporate ESG Performance on Green Technology Innovation from the Perspective of R&D Expenditure. Commer. Exhib. Econ. 2024, 15, 186–192. [Google Scholar] [CrossRef]
- Liang, X.; Li, Y.Y. Construction of Performance Evaluation System for Metallurgical Industry Based on ESG Concept—A Case Study of Enterprise. Financ. Manag. Res. 2024, 8, 70–75. [Google Scholar]
- Wang, S.G.; Wang, B. Independent Director System, Corporate Governance, and Governance Culture of State-Owned Enterprises. Soc. Sci. Front. 2022, 9, 101–112. [Google Scholar]
- Wang, Q.L.; Wang, Z.Y. Measurement of Green Technology Innovation Efficiency in China’s Manufacturing Industry Based on DEA-Malmquist. Sci. Technol. Sq. 2023, 2, 65–78. [Google Scholar] [CrossRef]
- Liu, C.; Pan, H.F.; Li, P.; Zhang, X.Y. The Impact and Mechanism of Digital Transformation on Green Innovation Efficiency in Manufacturing Enterprises. China Soft Sci. 2023, 4, 121–129. [Google Scholar]
- Wang, D.F. Research on ESG Information Disclosure of New Energy Vehicle Enterprises—A Case Study of BYD. Mod. Bus. 2024, 11, 167–170. [Google Scholar] [CrossRef]
Disclaimer/Publisher’s Note: The statements, opinions and data contained in all publications are solely those of the individual author(s) and contributor(s) and not of MDPI and/or the editor(s). MDPI and/or the editor(s) disclaim responsibility for any injury to people or property resulting from any ideas, methods, instructions or products referred to in the content. |
© 2025 by the authors. Licensee MDPI, Basel, Switzerland. This article is an open access article distributed under the terms and conditions of the Creative Commons Attribution (CC BY) license (https://creativecommons.org/licenses/by/4.0/).