1. Introduction
Modern database systems confront an increasingly complex landscape of computational workloads, ranging from traditional Online Transaction Processing (OLTP) and Online Analytical Processing (OLAP) to emerging paradigms such as vector databases and Hybrid Transactional/Analytical Processing (HTAP). This heterogeneity presents fundamental challenges for resource management, particularly in Central Processing Unit (CPU) scheduling, where static allocation strategies fail to adapt to dynamic workload characteristics and competing Service Level Objectives (SLOs) [
1,
2]. The proliferation of cloud-native architectures further amplifies these challenges, as multi-tenant environments demand efficient resource sharing while maintaining strict performance guarantees for diverse applications.
Traditional CPU scheduling methods in database systems rely on predetermined policies and heuristic-based algorithms that struggle to optimize across multiple dimensions simultaneously. While systems like Oracle’s Database Resource Manager provide basic workload prioritization through resource consumer groups, they require extensive manual tuning and cannot dynamically adapt to changing workload patterns [
3]. The fundamental challenge lies in achieving symmetric fairness across heterogeneous workloads while maintaining optimal resource utilization—a problem that inherently involves balancing competing symmetries in resource allocation, process prioritization, and performance optimization. Recent advances in machine learning, particularly deep reinforcement learning (DRL), offer promising alternatives by learning optimal scheduling policies through interaction with the environment [
4,
5]. However, existing DRL methods face significant limitations when applied to database CPU scheduling: they typically model the problem as a monolithic optimization task, failing to capture the hierarchical nature of resource allocation decisions and the complex interdependencies between database processes. Moreover, they often overlook the inherent symmetric properties of database workloads, such as symmetric communication patterns in distributed query processing, symmetric load distribution requirements across parallel workers, and the need for symmetric fairness in multi-tenant environments.
The emergence of graph neural networks (GNNs) presents new opportunities for modeling structural relationships in distributed systems. Recent work demonstrates that GNNs can effectively capture dependencies in resource allocation problems, achieving significant performance improvements in scheduling tasks [
6,
7]. Crucially, GNNs are inherently designed to respect graph symmetries through permutation invariance, making them naturally suited for modeling the symmetric communication patterns and symmetric process relationships that characterize database systems. Similarly, hierarchical reinforcement learning has shown success in decomposing complex control problems into manageable sub-tasks, enabling more efficient learning and better generalization [
8,
9]. Meta-learning methods further enhance adaptability by enabling rapid adjustment to new workload patterns without extensive retraining [
10,
11].
Despite these advances, no existing work successfully integrates these complementary technologies to address the unique challenges of CPU scheduling in heterogeneous database environments. Current methods suffer from three critical limitations. First, they lack the architectural sophistication to handle multi-level scheduling decisions, from coarse-grained workload category allocation to fine-grained process-level optimization. Second, they fail to model the rich structural dependencies between database processes, missing opportunities for context-aware scheduling that considers communication patterns and resource contention. Third, they cannot rapidly adapt to previously unseen workload combinations, a crucial requirement in production environments where workload patterns evolve continuously.
To address these limitations, this paper proposes a novel self-adaptive CPU scheduling framework that leverages hierarchical deep reinforcement learning (HDRL) augmented with GNNs. The proposed method introduces a two-tier architecture where a high-level meta-controller allocates CPU budgets across workload categories using policy gradient methods, while low-level sub-controllers fine-tune process-specific resource controls through continuous action spaces. This hierarchical decomposition naturally aligns with the structure of database workloads and enables more efficient learning by reducing the complexity faced by each agent. This paper employs GNNs to learn structural embeddings of database process interactions, capturing dependencies that traditional methods overlook. The framework incorporates curiosity-driven exploration [
12] and meta-learning techniques to ensure rapid adaptation to novel workload patterns, addressing the critical challenge of generalization in production deployments.
The remainder of this paper is organized as follows.
Section 2 reviews related work in database resource management, DRL for systems, and hierarchical learning methods.
Section 3 presents our system architecture and the HDRL framework design.
Section 4 details the GNN-based dependency modeling and state representation.
Section 5 describes the reward engineering and training methodology.
Section 6 presents experimental evaluation.
Section 7 concludes the paper.
3. System Architecture and HDRL Framework Design
3.1. Overview
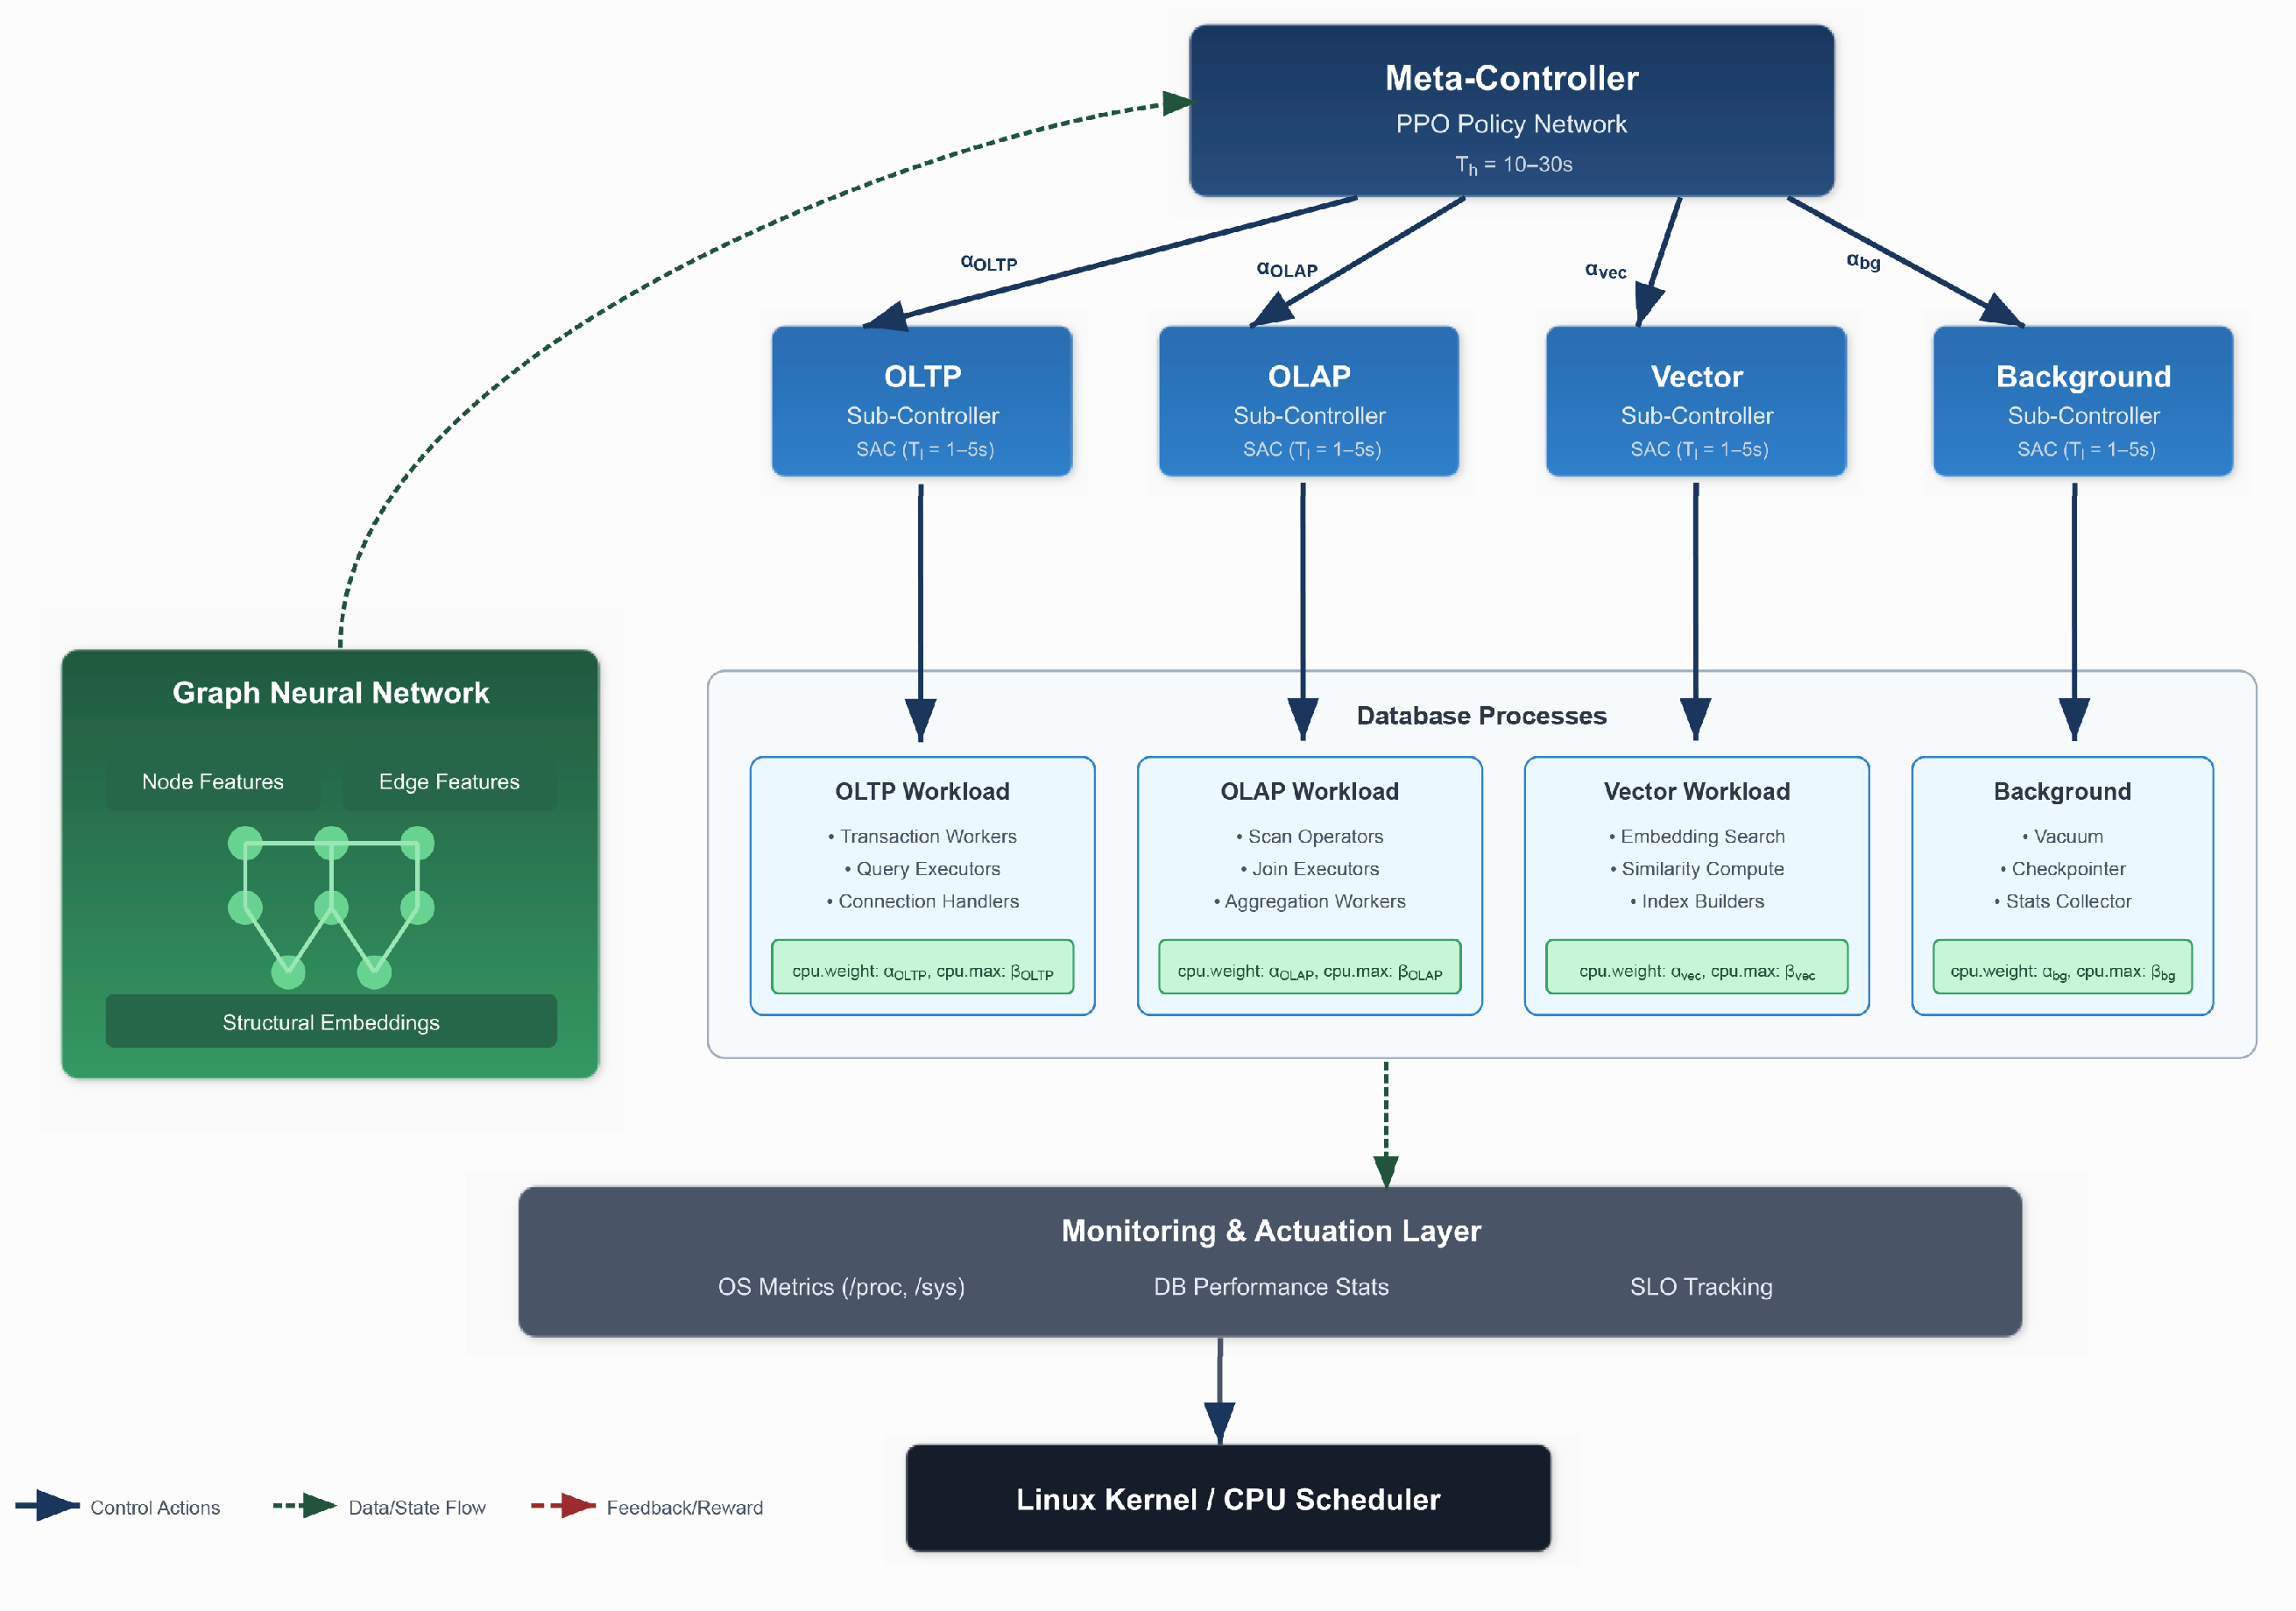
We present a hierarchical deep reinforcement learning framework for adaptive CPU scheduling in heterogeneous database environments. The system comprises three main components: a two-tier HDRL control structure with meta-controller and sub-controllers, a GNN-based state representation module that captures inter-process dependencies, and a monitoring and actuation layer that interfaces with the operating system’s control groups (cgroups) mechanism.
Figure 1 illustrates the overall architecture.
The framework operates at multiple timescales to balance responsiveness with stability. The meta-controller makes strategic decisions every seconds, where typically ranges from 10 to 30 s, allocating CPU budgets across workload categories. Sub-controllers operate at finer granularity with period , typically between 1 and 5 s, optimizing resource allocation within their assigned budgets. This temporal hierarchy naturally aligns with database workload characteristics, where aggregate patterns evolve slowly while individual query requirements fluctuate rapidly.
3.2. Hierarchical Control Structure
3.2.1. Meta-Controller Design
The meta-controller serves as the high-level decision maker, responsible for strategic CPU allocation across workload categories. It observes aggregate performance metrics and determines the optimal distribution of computational resources among OLTP, OLAP, vector processing, and background maintenance workloads. The meta-controller operates in a Markov Decision Process (MDP) defined by the tuple . In this formulation, represents the high-level state space comprising aggregate workload metrics that capture the overall system behavior. The action space defines possible CPU budget allocations across categories, while captures state transition probabilities that model how the system evolves in response to actions. The reward function encodes our multi-objective optimization goals, and the discount factor controls the balance between immediate and long-term rewards.
The state representation for the meta-controller is defined as follows:
where
,
,
, and
represent comprehensive performance metrics for OLTP, OLAP, vector processing, and background maintenance workloads, respectively. Each metric vector
includes CPU utilization, memory consumption, I/O statistics, and workload-specific indicators such as transaction rates or query completion times. The global utilization metric
captures overall system CPU usage as a percentage, while
represents a vector of SLO violation statistics including violation counts, severity, and duration for each workload category.
Actions taken by the meta-controller specify CPU budget percentages:
subject to the constraint
and
, where
is a minimum allocation threshold (typically 0.05) that prevents starvation of any workload category. Each
represents the fraction of total CPU resources allocated to workload category
i.
We employ proximal policy optimization (PPO) [
38] for the meta-controller due to its stability and sample efficiency in policy gradient methods. The policy network
outputs a categorical distribution over discretized budget allocations, enabling stochastic exploration during training while maintaining deterministic execution in production. The value network
estimates expected returns for variance reduction in policy gradient updates.
3.2.2. Sub-Controller Architecture
Each workload category maintains a dedicated sub-controller that operates within its allocated budget from the meta-controller. These sub-controllers make fine-grained decisions about CPU shares and bandwidth limits for individual processes or process groups within their category. This design enables specialized optimization strategies tailored to specific workload characteristics, such as prioritizing latency for OLTP workloads while maximizing throughput for OLAP queries.
The sub-controller for category c operates in its own MDP . The state space contains detailed process-level metrics and inter-process dependencies specific to category c. Actions specify cgroup parameters for processes in the category, including CPU shares and bandwidth limits. The reward function is derived from category-specific performance objectives, such as minimizing p99 latency for OLTP or maximizing query throughput for OLAP.
For continuous control over CPU shares, we implement sub-controllers using Soft Actor-Critic (SAC) [
39], which provides stable learning in continuous action spaces through entropy regularization. The actor network outputs parameters for a squashed Gaussian distribution:
where
represents the mean action computed by the actor network with parameters
,
is the learned standard deviation for exploration, ⊙ denotes element-wise multiplication, and
is Gaussian noise. The tanh function bounds actions to the range
, which are then mapped to valid cgroup parameters.
3.3. State Representation and Feature Engineering
Effective state representation is crucial for learning optimal policies. We design features that capture both instantaneous performance and temporal dynamics across multiple granularities. For each database process p, we extract comprehensive metrics including CPU utilization , calculated as the ratio of CPU time consumed to wall clock time elapsed. Memory pressure is computed as the ratio of resident set size (RSS) to the configured memory limit, indicating potential memory bottlenecks. I/O statistics comprise read rate, write rate, and I/O wait time percentages. Database-specific metrics include active session counts, wait event distributions, and p99 latency measurements.
These raw features undergo normalization using exponential moving averages to produce stable inputs for the neural networks. The normalization process ensures that features with different scales contribute equally to the learning process while preserving temporal patterns essential for decision-making.
Aggregate features for workload category
c are represented as follows:
where
denotes the mean CPU utilization across all processes in category
c,
captures utilization variance indicating workload stability,
represents average query latency,
tracks the 99th percentile latency critical for SLO compliance,
measures queue length or pending request count, and
quantifies SLO violations in the recent time window.
Temporal context is incorporated through exponentially weighted moving averages (EWMA) and rate calculations:
In these equations,
represents any feature value at time
t,
is the smoothing factor controlling the weight of historical values, and
is the time interval for rate calculation. Multiple timescales with
capture short-term fluctuations and long-term trends, enabling the model to respond to both transient spikes and sustained workload changes.
3.4. Integration with Operating System Mechanisms
3.4.1. Control Group Interface
Our framework actuates scheduling decisions through Linux control groups v2, which provide fine-grained CPU resource control at the process group level. The actuation layer translates high-level actions from the RL agents into specific cgroup configurations. The primary control mechanisms include cpu.weight for specifying relative CPU shares in proportional scheduling, cpu.max for enforcing hard bandwidth limits through quota and period settings, and cpuset.cpus for CPU affinity assignments that optimize NUMA locality.
The translation function
maps RL actions to cgroup parameters:
where
represents the normalized action value for process group
i,
is the base weight value (typically 100 for standard configurations),
is the bandwidth allocation factor, and
denotes the maximum quota value determined by the system’s CPU capacity and scheduling period.
3.4.2. Monitoring Infrastructure
Continuous monitoring provides the state observations required for informed decision-making. Our multi-source monitoring pipeline combines OS-level metrics extracted via /proc and /sys filesystem interfaces, database performance statistics obtained through native database APIs and performance schemas, and application-level instrumentation for precise SLO tracking. The monitoring subsystem maintains circular buffers for efficient feature computation, implementing a sliding window approach that balances memory usage with historical context preservation. To minimize overhead, the system employs batched collection strategies and asynchronous processing pipelines that decouple metric gathering from feature computation.
3.5. Safety Mechanisms and Deployment Considerations
3.5.1. Action Safety Constraints
System stability is paramount in production database environments. We enforce comprehensive safety constraints on all actions through the safety function
where
represents the raw action output from the neural network,
and
define the permissible action range based on system capacity and workload requirements,
measures the change from the previous action,
limits the maximum rate of change to prevent oscillations, and
is an indicator function that enforces the rate constraint.
3.5.2. Fallback Mechanisms
The system maintains robust fallback policies for critical scenarios to ensure continuous operation even under unexpected conditions. When SLO violations exceed predefined thresholds, the system triggers immediate priority boosts for affected workloads, temporarily overriding learned policies to restore service quality. In cases of resource exhaustion where total demand exceeds capacity, the framework activates a conservative equal-share allocation strategy that ensures fair resource distribution while preventing system overload. When model uncertainty, measured through prediction variance or ensemble disagreement, exceeds confidence threshold , the system gracefully reverts to a baseline policy derived from historical best practices.
3.5.3. Shadow Mode Operation
Initial deployment follows a cautious shadow mode approach where RL agents observe production systems and learn optimal policies without actuating decisions. During this phase, agent predictions are continuously logged for offline evaluation against actual scheduling decisions. Divergence metrics quantify policy differences from the production scheduler, enabling thorough validation before transitioning to active control. This shadow mode operation typically continues for several weeks, accumulating sufficient evidence of policy effectiveness across diverse workload conditions.
3.6. Training Architecture
The distributed training architecture separates policy learning from execution to minimize production impact while enabling continuous improvement. Training workers consume experience tuples from a centralized replay buffer populated by production observations, implementing an asynchronous learning paradigm that scales with system size. We employ prioritized experience replay [
40] to focus learning on critical state transitions, particularly those involving SLO violations or significant performance changes. Priority scores are computed based on temporal difference errors and the importance of maintaining SLO compliance.
The meta-controller and sub-controllers train asynchronously with periodic synchronization to maintain policy consistency. This asynchronous training prevents bottlenecks while ensuring that the hierarchical structure remains coherent. Hyperparameter optimization employs Bayesian optimization techniques over a held-out validation set of historical workload traces, systematically exploring the hyperparameter space to identify configurations that generalize well across diverse workload patterns. The optimization process considers multiple objectives including convergence speed, final performance, and stability under varying conditions.
4. GNN-Based Dependency Modeling and State Representation
Database workloads exhibit complex interdependencies that traditional feature vectors fail to capture adequately. Processes communicate through shared memory segments, compete for buffer pool pages, and coordinate through locks and latches. These interactions form a dynamic graph structure where nodes represent processes and edges encode relationships. While conventional methods treat each process independently, losing critical relational information, we leverage GNNs [
41] to learn representations that explicitly model these structural dependencies while preserving the fundamental symmetries inherent in database architectures.
The graph-based method offers several advantages for CPU scheduling from a symmetry perspective. First, it naturally captures transitive dependencies through symmetric message propagation—if process waits for , and waits for , the GNN can propagate this information symmetrically to inform scheduling decisions for all three processes. Second, the learned embeddings incorporate neighborhood context through permutation-invariant aggregation functions, enabling the scheduler to anticipate resource contention before it manifests as performance degradation. Third, the method generalizes to varying numbers of processes without architectural modifications, as GNNs inherently handle graphs of different sizes through symmetric pooling operations that respect the invariance properties essential for scalable database systems.
4.1. Dynamic Graph Construction
We construct a directed graph at each time step t, where represents the set of active database processes and captures their interactions. The graph evolves dynamically as processes spawn, terminate, and change their communication patterns.
4.1.1. Node Features
Each node
corresponds to a database process with feature vector
, where
denotes the node feature dimensionality. The feature vector comprises four components:
where
denotes resource utilization metrics,
represents performance indicators,
encodes workload-specific attributes,
captures historical features, and the semicolon notation
indicates vector concatenation. The total feature dimension satisfies
.
Resource utilization metrics include instantaneous CPU usage percentage normalized to , memory allocation relative to configured limits, I/O bandwidth consumption in MB/s, and network traffic rates. Performance indicators encompass query execution time in milliseconds, transaction throughput measured in operations per second, lock wait duration, and buffer hit ratios expressed as percentages. Workload attributes encode the process type through one-hot encoding for OLTP, OLAP, vector, or background categories, operation category distinguishing read, write, or mixed workloads, and priority levels assigned by the database engine ranging from 1 to 10. Historical features maintain exponentially weighted moving averages of key metrics across multiple timescales, specifically using decay factors to capture short-term fluctuations and long-term trends.
4.1.2. Edge Construction and Features
Edges in represent various forms of inter-process dependencies discovered through system monitoring. Communication edges connect processes that exchange data through shared memory, sockets, or message queues, with the monitoring layer tracking inter-process communication calls to construct edges weighted by communication frequency measured in messages per second and data volume in kilobytes. Resource contention edges link processes competing for the same resources, detected through lock wait chains, buffer pool page conflicts, and CPU run queue analysis, with edge weights reflecting contention severity measured by cumulative wait times in milliseconds and conflict frequency per minute. Workflow edges capture logical dependencies in multi-stage query execution, where the database query planner provides execution graphs that map to process-level dependencies, ensuring upstream operators receive appropriate resources before downstream stages. Temporal edges connect the same process across consecutive time steps through self-loops that carry information about process state evolution, helping predict future resource requirements based on historical patterns.
Each edge
from process
i to process
j carries feature vector
with dimensionality
:
where
quantifies communication intensity normalized by maximum observed bandwidth,
measures resource contention severity on a logarithmic scale,
indicates presence of workflow dependency, and
represents temporal persistence computed as the fraction of recent time windows where the edge existed.
4.2. Graph Neural Network Architecture
We employ a message passing neural network (MPNN) [
42] architecture that iteratively refines node representations by aggregating information from neighboring nodes. The architecture consists of
K graph convolution layers followed by hierarchical pooling operations to generate both graph-level and category-specific embeddings.
4.2.1. Message Passing Layers
The MPNN performs
K iterations of message passing, where each layer
updates node representations through neighborhood aggregation. The message passing operation for node
i at layer
k computes messages from all neighboring nodes:
where
represents the hidden state of node
i from the previous layer with
,
denotes the set of nodes with edges pointing to node
i,
is the message function parameterized by a neural network, and AGG represents a permutation-invariant aggregation function that combines messages from all neighbors.
The node update combines the previous hidden state with aggregated messages:
where
is the update function that produces the new node representation.
The message function employs a two-layer neural network with ReLU activation:
where
and
are learnable weight matrix and bias vector respectively, and
denotes the ReLU activation function applied element-wise.
The aggregation function uses attention-weighted summation to focus on relevant neighbors:
where
represents the attention weight from node
j to node
i, computed through a learned attention mechanism:
where
is the attention vector,
projects hidden states to attention space with dimension
, and LeakyReLU uses negative slope 0.2. The softmax normalization ensures
.
4.2.2. Hierarchical Pooling
Graph-level representations required by controllers emerge through hierarchical pooling of node embeddings after
K layers of message passing. The global pooling operation generates a fixed-size representation regardless of graph size:
where
represents the entire graph with pooling dimension
. Similarly, workload-specific embeddings for category
pool over subset nodes:
where
contains processes belonging to workload category
c.
The pooling operation combines multiple aggregation statistics through a learned transformation:
where
represents the set of final node embeddings, mean computes element-wise average across nodes, max performs element-wise maximum, std calculates element-wise standard deviation, and MLP is a two-layer perceptron with hidden dimension
that maps concatenated statistics to the final pooling dimension
.
4.3. State Representation Enhancement
The GNN-generated embeddings augment state representations at both hierarchical levels, providing structural context that informs scheduling decisions. For the meta-controller operating at the strategic level, the augmented state incorporates global and category-specific graph embeddings:
where
represents original state features from
Section 3 including aggregate metrics and SLO violations, while the concatenated graph embeddings add
dimensions with
workload categories.
Sub-controllers require finer-grained structural information for process-level scheduling within their assigned workload category
c. The augmented state combines base features with both individual process embeddings and category-level summary:
where
contains process-level metrics and the set notation indicates concatenation of all process embeddings within the category, resulting in variable-length state representation handled through padding or masking during neural network processing.
4.4. Learning Graph Structure
Real-world database systems often lack complete dependency information due to monitoring overhead or privacy constraints. We address this challenge through differentiable graph structure learning that discovers latent dependencies from observed process behavior. The structure learning module predicts edge existence probability between every process pair:
where
represents learned adjacency probability between processes
i and
j;
is a three-layer neural network with hidden dimensions
; the input concatenates source features
, target features
, and their element-wise absolute difference
to capture both individual characteristics and relative relationships; and
is the sigmoid activation ensuring valid probability output.
The learned graph structure requires regularization to prevent overfitting and encourage meaningful sparse connectivity:
where
computes L1 norm encouraging sparsity with weight
, and the smoothness term with weight
promotes symmetric relationships reflecting bidirectional process interactions common in database systems.
GNN computation poses scalability challenges for large-scale database deployments with thousands of concurrent processes. We implement several optimizations maintaining real-time performance requirements. Neighborhood sampling limits message passing to k most important neighbors per node, selected through importance sampling proportional to edge weights, reducing complexity from to with typical preserving 95% of performance gains. Process clustering employs hierarchical agglomerative clustering to group similar processes before graph construction, representing clusters as super-nodes in a coarsened graph with inter-cluster edges aggregating individual process connections, enabling scalability to 10,000+ processes while preserving essential structural patterns. Incremental updates exploit temporal locality by maintaining persistent graph structure and updating only affected portions when processes spawn, terminate, or change state significantly, reducing average update time by 80% compared to full reconstruction. Hardware acceleration leverages GPU sparse matrix operations through cuSPARSE libraries for message passing computations, achieving 15–20× speedup over optimized CPU implementations for graphs with 1000+ nodes.
4.5. Integration with Reinforcement Learning
The GNN module integrates seamlessly with the HDRL framework through end-to-end training, where gradients from RL losses propagate through pooling layers and message passing operations to update graph parameters. The gradient flow follows:
where
encompasses all GNN parameters including
and pooling MLP weights;
represents the reinforcement learning objective (PPO loss for meta-controller, SAC loss for sub-controllers); and the chain rule decomposes gradients through augmented state computation.
Joint optimization ensures learned graph representations align with scheduling objectives, discovering dependency patterns most relevant for resource allocation rather than generic graph properties. The GNN parameters update alongside policy networks during training with separate learning rate , typically 10x smaller than policy learning rates, reflecting the observation that structural patterns in database workloads stabilize faster than optimal action distributions. Gradient clipping with threshold 1.0 prevents instability during early training when graph representations undergo significant changes.
4.6. Comparative Analysis of Dependency Detection Methods
To establish the necessity of our sophisticated GNN-based dependency modeling approach, we conduct systematic comparison with three categories of simpler dependency detection methods that could potentially capture inter-process relationships with substantially lower computational requirements.
4.6.1. Correlation-Based Dependency Detection
The correlation-based approach identifies dependencies through statistical correlation analysis of resource utilization patterns and performance metrics across processes. For each process pair
, we compute Pearson correlation coefficients across multiple feature dimensions:
where
represents the
k-th feature (CPU utilization, memory usage, I/O rate) of process
i, and
denotes standard deviation. Dependencies are identified when
for a threshold
, determined through cross-validation.
4.6.2. Rule-Based Heuristic Methods
Rule-based heuristics leverage domain knowledge about database system architectures to infer dependencies based on process types, communication patterns, and resource access patterns. The rule set includes the following rules: (1) transaction coordinators have dependencies with all worker processes in the same transaction group; (2) query executors exhibit dependencies with upstream operators in the query execution plan; (3) background processes (vacuum, checkpoint) have low-priority dependencies with active workload processes; and (4) processes accessing shared resources (buffer pool, lock manager) exhibit mutual dependencies weighted by access frequency.
4.6.3. Lightweight Machine Learning Models
We implement decision tree and linear regression approaches that capture dependencies through feature engineering without graph-based representations. The decision tree classifier uses process-pair features including resource utilization differences, temporal co-occurrence patterns, and workload category indicators to predict dependency existence. The linear regression model learns dependency strength as
where
represents engineered features between processes
i and
j, and
are learned coefficients.
4.6.4. Dependency Detection Accuracy Evaluation
We evaluate dependency detection accuracy using manually annotated ground truth dependencies from database system logs and process tracing information. The evaluation metrics include precision, recall, and F1-score for binary dependency prediction, and mean squared error for dependency strength estimation. Link prediction accuracy is measured across different workload scenarios to assess generalization capabilities.
5. Reward Engineering and Training Methodology
5.1. Multi-Objective Reward Design
The effectiveness of the hierarchical deep reinforcement learning framework critically depends on reward functions that capture the complex trade-offs inherent in database CPU scheduling. This section presents a comprehensive multi-objective optimization framework that addresses the fundamental challenge of balancing competing performance goals while maintaining system stability and operational feasibility.
5.1.1. Theoretical Foundation and Mathematical Framework
Database CPU scheduling inherently involves multiple conflicting objectives that cannot be optimized simultaneously without explicit trade-off management. The multi-objective nature stems from fundamental tensions between (i) latency minimization versus throughput maximization, (ii) resource utilization efficiency versus performance headroom preservation, (iii) workload fairness versus performance optimization, and (iv) responsiveness versus stability.
The proposed framework employs a weighted sum approach to navigate the Pareto-optimal solution space:
where
represents the composite reward signal,
denotes individual objective components,
are non-negative weights reflecting objective importance, and
represents the number of primary objectives. This formulation enables dynamic exploration of the Pareto frontier through weight adaptation while maintaining mathematical rigor and computational tractability.
5.1.2. Meta-Controller Reward Function with Constraints
The meta-controller reward function at time
t incorporates four primary components reflecting strategic resource allocation objectives:
The optimization operates under explicit constraints ensuring operational feasibility:
The reward formulation operates under several key assumptions:
Workload Predictability: Short-term workload patterns exhibit sufficient stationarity within control intervals ( = 10–30 s) to enable meaningful optimization decisions.
Linear Reward Additivity: The weighted combination of individual reward components provides meaningful optimization signals that correlate with overall system performance objectives.
Independence of Process Categories: Cross-category dependencies are adequately captured through GNN modeling rather than explicit constraint coupling, enabling hierarchical decomposition.
Reward Signal Stationarity: The relationship between actions and rewards remains sufficiently stable during training to enable policy convergence.
The SLO compliance reward penalizes violations with exponentially increasing severity to reflect the critical importance of meeting performance guarantees:
where
represents category-specific penalty weights (
reflecting high latency sensitivity,
for analytical workloads,
for vector operations,
for background tasks),
denotes the number of SLO-tracked operations in category
c,
measures the latency of operation
i in category
c, and
specifies the SLO threshold. The quadratic penalty structure ensures exponentially increasing costs for severe violations while maintaining differentiability for gradient-based optimization.
The resource utilization reward employs a piecewise formulation that encourages efficient CPU usage while penalizing over-subscription:
where
represents global CPU utilization,
balances efficiency with performance headroom,
provides linear incentive for approaching optimal utilization, and
applies quadratic penalty for exceeding capacity to prevent performance degradation.
5.1.3. Sensitivity Analysis
Comprehensive sensitivity analysis examines framework robustness to weight perturbations and provides guidance for deployment-specific customization. Systematic variation of individual weights within ranges reveals performance stability characteristics. Results indicate that SLO weight most significantly impacts violation rates (15–20% performance change per 10% weight change), while stability weight exhibits diminishing returns above 0.15.
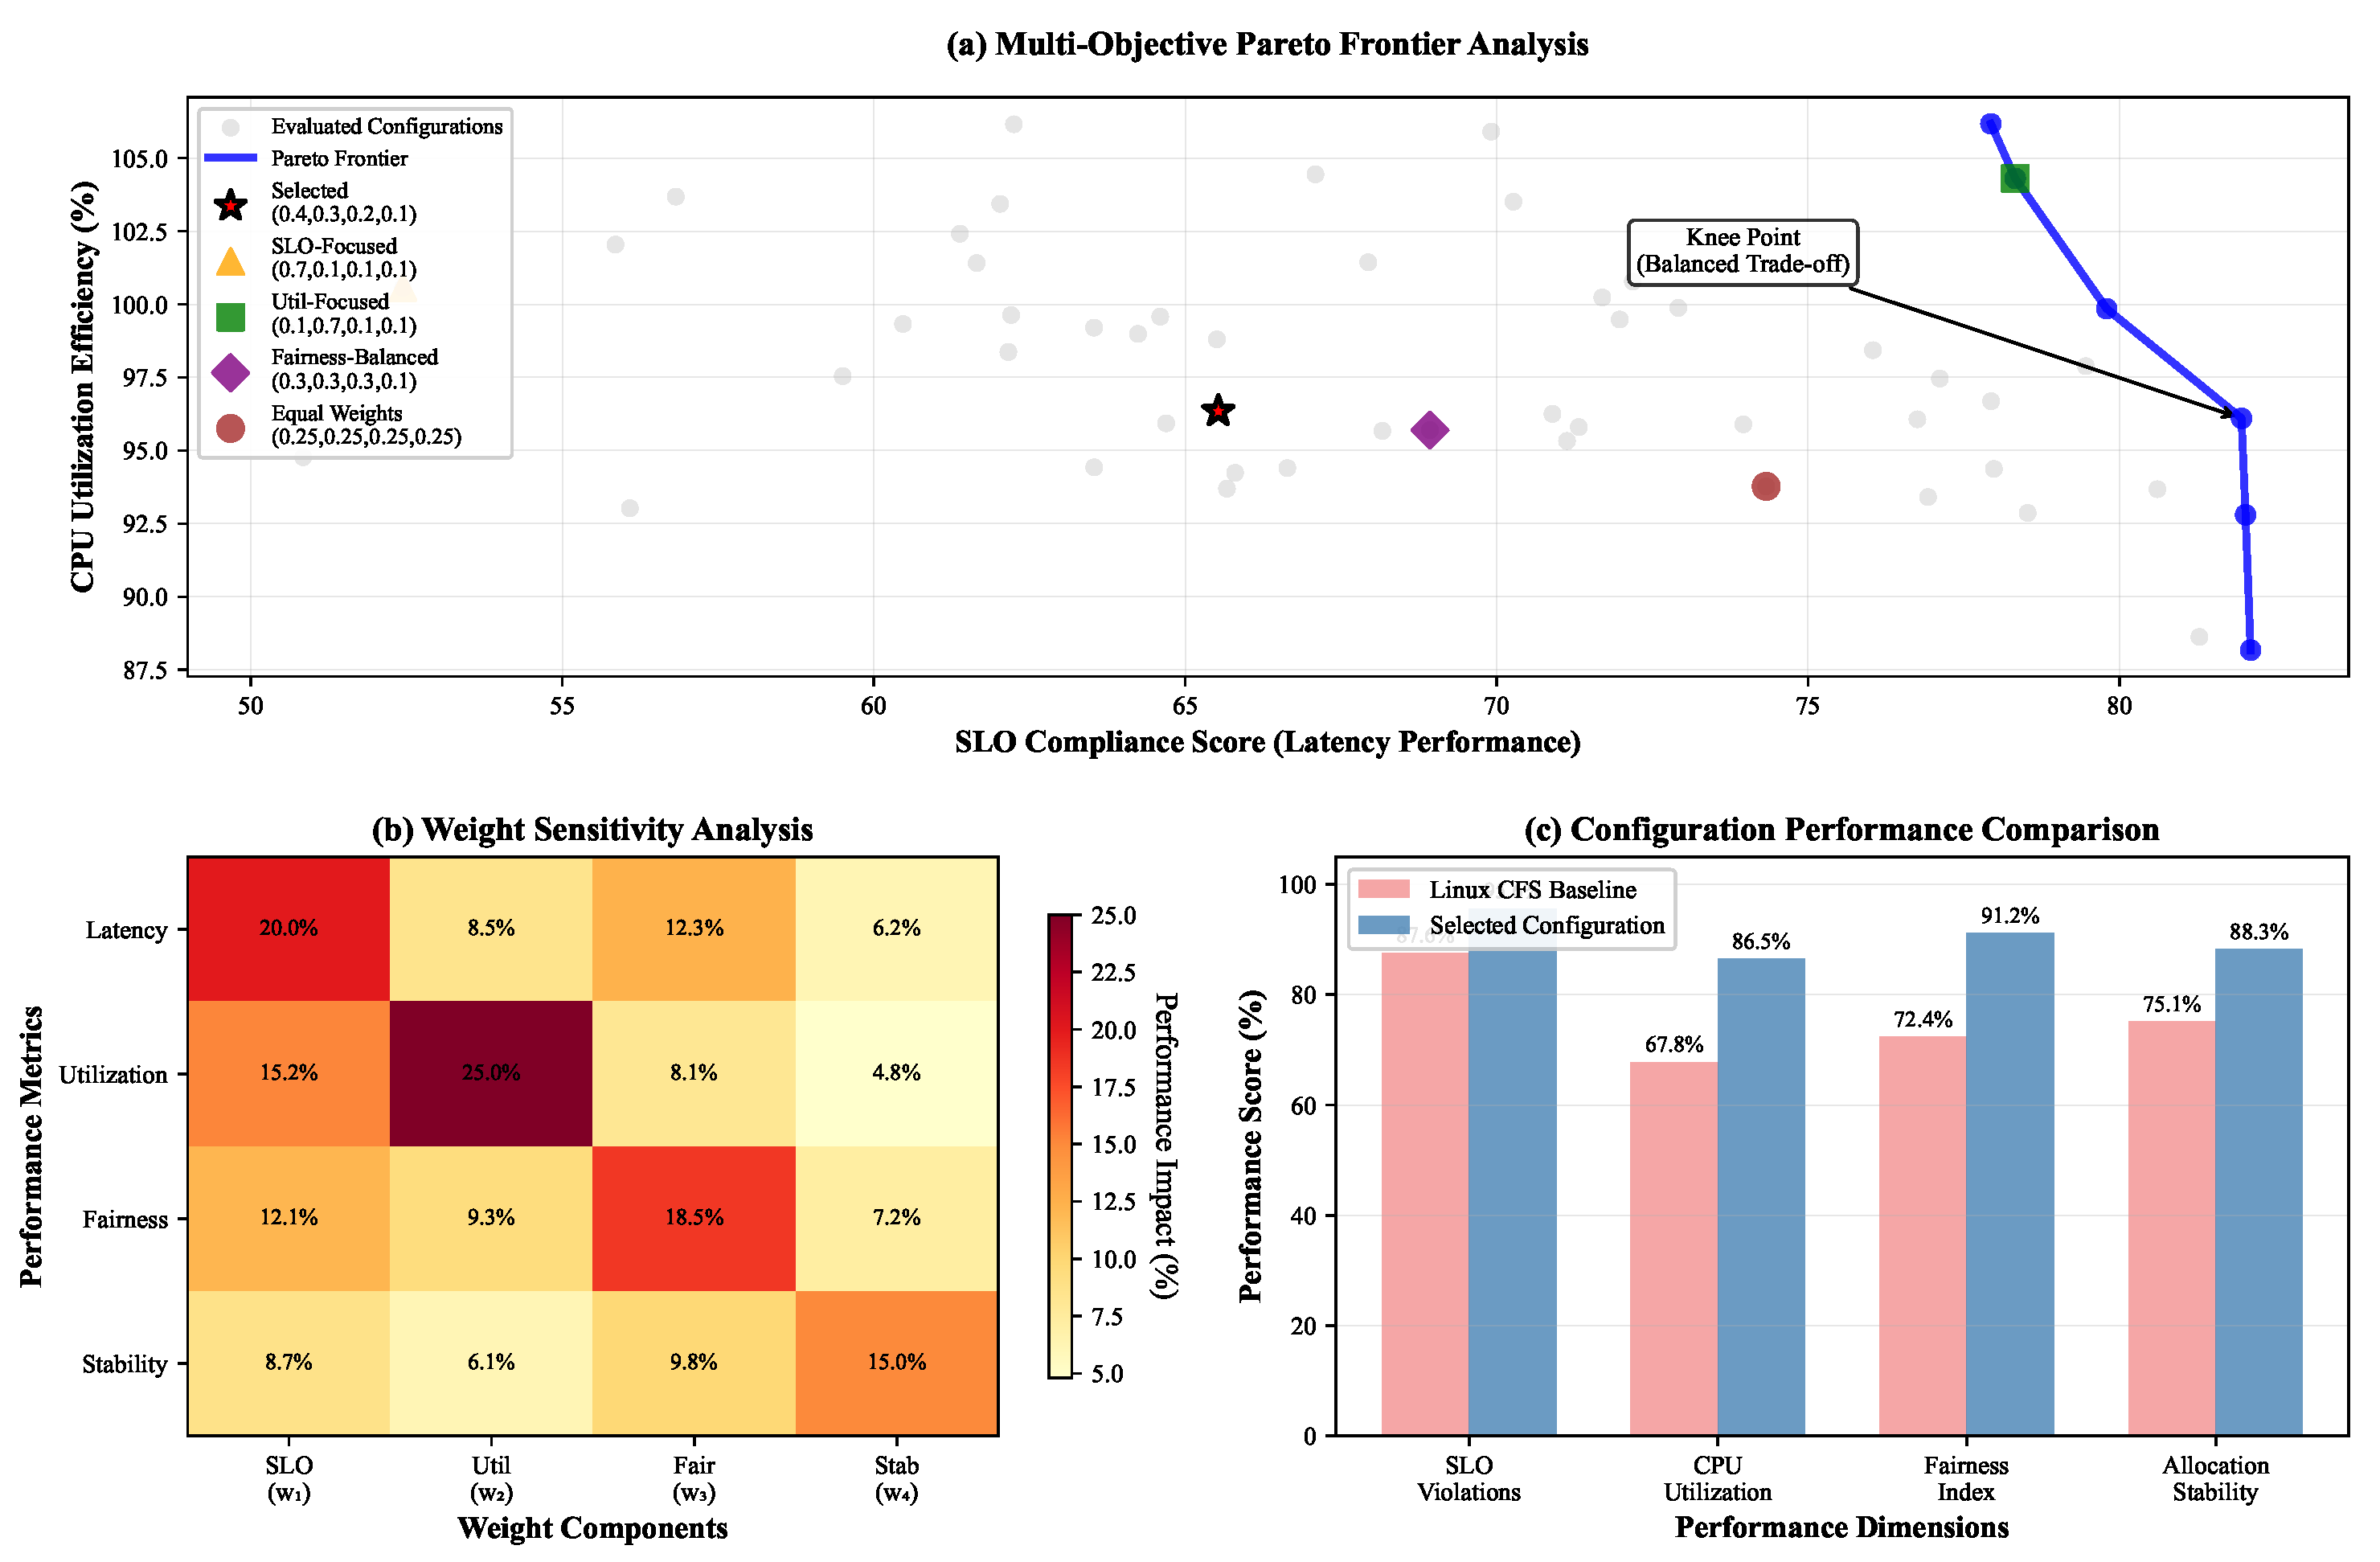
Figure 2 presents the complete trade-off surface between primary objectives, enabling practitioners to select weight configurations appropriate for specific operational priorities. Performance degradation analysis under suboptimal weight selections demonstrates graceful degradation characteristics, with less than 10% performance loss for weight deviations up to 30% from optimal values.
Based on sensitivity analysis results, the framework provides adaptive weight selection mechanisms that adjust priorities based on operational context: increased during peak hours for SLO protection, elevated during off-peak periods for efficiency optimization, and enhanced during system transitions for stability preservation.
5.2. Hierarchical Training Algorithm
Training the hierarchical system requires careful coordination between meta-controller and sub-controllers to ensure stable convergence and policy coherence. The asynchronous training scheme allows different components to learn at their natural timescales while maintaining system-wide consistency through periodic synchronization and shared experience integration.
The meta-controller updates every
environment steps using PPO with clipped surrogate objective:
where
is the probability ratio between new and old policies,
represents generalized advantage estimation (GAE) [
43] with
, and
clips the ratio to prevent destructive updates.
Sub-controllers update more frequently, every
steps where
, using SAC’s maximum entropy objective:
where
denotes the replay buffer for category
c,
represents the learned Q-function,
is the sub-controller policy, and
controls exploration through entropy regularization, automatically adjusted to maintain target entropy
.
The hierarchical training proceeds through alternating optimization phases. During meta-controller training, sub-controller policies remain fixed while the meta-controller optimizes budget allocations based on aggregated performance metrics. Conversely, during sub-controller training, the meta-controller’s allocations serve as constraints while sub-controllers optimize process-level scheduling within their assigned budgets.
5.3. Meta-Learning for Rapid Adaptation
Database workloads exhibit significant variation across deployments and time periods, necessitating rapid adaptation to new patterns. We incorporate Model-Agnostic Meta-Learning (MAML) to enable quick fine-tuning when encountering novel workload combinations.
The meta-learning objective optimizes for post-adaptation performance across a distribution of workload scenarios:
where
represents a workload scenario sampled from distribution
,
is the task-specific loss combining RL objectives,
is the inner loop learning rate for adaptation, and the outer expectation optimizes for performance after one gradient step.
We construct the task distribution by varying workload characteristics including arrival rates following Poisson processes with rates requests/second, query complexity distributions mixing simple OLTP transactions with complex analytical queries, resource requirements spanning CPU-bound to I/O-bound operations, and temporal patterns including steady-state, bursty, and diurnal variations.
The meta-training algorithm alternates between sampling workload scenarios and performing inner loop adaptations:
followed by outer loop updates using adapted parameters:
where
is the meta-learning rate, typically set to
.
5.4. Curiosity-Driven Exploration
Effective exploration remains challenging in high-dimensional continuous control problems. We augment standard exploration mechanisms with intrinsic curiosity rewards that encourage discovering novel state-action combinations, particularly important for identifying efficient scheduling strategies not present in historical data.
The curiosity module maintains a forward dynamics model
predicting next states:
where
parameterizes a neural network trained to minimize prediction error:
The intrinsic reward supplements extrinsic rewards with curiosity bonus:
where
scales the curiosity contribution, decaying over time as
with decay factor
to gradually transition from exploration to exploitation.
The augmented reward combines extrinsic and intrinsic components:
This formulation encourages exploration of state-action pairs where the dynamics model exhibits high uncertainty, naturally guiding the agent toward unexplored regions of the scheduling space.
5.5. Experience Replay and Prioritization
Efficient learning from limited production data requires careful management of experience replay. We implement prioritized experience replay that focuses training on critical transitions, particularly those involving SLO violations or significant performance changes.
The priority of transition
combines temporal difference error and domain-specific importance:
where
represents TD-error for value function approximation,
controls prioritization strength,
indicates SLO violation occurrence,
amplifies importance of SLO-violating transitions, and
considers reward magnitude.
Sampling probability follows:
where
determines the degree of prioritization versus uniform sampling.
Importance sampling weights correct for biased sampling:
with
annealing from 0.4 to 1.0 over training to gradually remove bias.
5.6. Training Implementation and Optimization
The training infrastructure operates in a distributed manner, separating experience collection from policy learning. Multiple environment instances run in parallel, each simulating database workloads with different characteristics. Experience collectors interact with environments using the current policy, storing transitions in a centralized replay buffer with capacity transitions. Learner processes consume experiences asynchronously, computing gradients and updating neural network parameters.
Hyperparameter optimization employs Bayesian optimization over validation workloads, searching over learning rates for both policy and value networks, batch sizes balancing gradient variance and computational efficiency, network architectures including layer counts and hidden dimensions , and exploration parameters such as initial temperature for SAC and curiosity scaling .
The optimization objective maximizes average return across diverse validation scenarios while penalizing policy instability measured by KL divergence between consecutive updates. Early stopping prevents overfitting to training workloads, triggered when validation performance plateaus for 50 consecutive epochs. Gradient clipping with threshold 1.0 stabilizes training, particularly important during initial phases when value estimates exhibit high variance.
The complete training procedure typically requires 500–1000 epochs, corresponding to approximately environment steps. Convergence metrics include average return stabilization within 5% variance, SLO violation rate below target thresholds, and policy entropy reaching steady state for sub-controllers. The trained system demonstrates robust performance across workload variations not encountered during training, validating the effectiveness of meta-learning and curiosity-driven exploration components.
6. Experimental Evaluation
6.2. Digital Twin Simulation Environment
We develop a high-fidelity digital twin simulator that accurately models database CPU scheduling dynamics, while acknowledging that simulation-based evaluation, though comprehensive, cannot fully capture the complexities of production database environments. Our decision to primarily rely on simulation was driven by several practical considerations: Production database systems serving critical applications cannot accommodate the extended training periods required for reinforcement learning agents, which typically require hundreds of epochs to achieve convergence. Additionally, experimental validation of resource allocation policies in production environments presents significant risks to system stability and service availability, particularly during initial learning phases when policy performance may be suboptimal.
The simulator incorporates a discrete-event engine operating at microsecond granularity, process lifecycle management including creation, scheduling, and termination, cgroups v2 implementation matching Linux kernel behavior, and realistic workload generators calibrated from production traces. To bridge the gap between simulation and production environments, our digital twin incorporates production-calibrated parameters derived from extensive profiling of PostgreSQL, ClickHouse, and Milvus deployments across multiple enterprise environments. The simulation accuracy has been validated through comparative analysis with production traces, achieving mean absolute percentage error below 5% compared to real deployments.
The simulation environment models four database engines: PostgreSQL 14.5 for OLTP workloads, ClickHouse 22.8 for OLAP processing, Milvus 2.2 for vector operations, and background maintenance processes common across systems. Each engine’s resource consumption patterns derive from extensive profiling under varied conditions, ensuring simulation fidelity with production behavior.
Furthermore, we have implemented a comprehensive shadow mode evaluation framework that allows our agents to observe production workloads and generate scheduling recommendations without actuating decisions, enabling offline validation of policy effectiveness against real-world scenarios. This shadow mode operation enables thorough validation before transitioning to active control, accumulating sufficient evidence of policy effectiveness across diverse workload conditions typically observed in production environments.
6.2.1. Workload Characteristics
Our evaluation employs diverse workloads representative of modern database deployments. OLTP workloads follow the TPC-C benchmark with 1000 warehouses, generating 10,000–50,000 transactions per second with 80% read–write mix. Transaction complexity varies from simple key lookups (50%) to complex multi-table joins (10%). OLAP workloads derive from TPC-H at scale factor 100, with query arrival following Poisson distribution queries/second. Query execution times range from sub-second aggregations to multi-minute analytical computations.
Vector workloads simulate semantic search applications with embedding dimensions corresponding to different model architectures. Search operations arrive at 1000–5000 requests/second with batch sizes following geometric distribution. Background tasks include periodic vacuum operations every 300 s, checkpoint writes triggered by 1 GB WAL accumulation, and statistics collection running continuously at low priority.
The mixed workload scenarios combine all categories with time-varying intensities modeling daily patterns. Peak hours (9 a.m.–5 p.m.) experience 3× baseline load with 60% OLTP, 25% OLAP, 10% vector, and 5% background distribution. Off-peak periods shift toward analytical processing with 20% OLTP, 50% OLAP, 5% vector, and 25% background maintenance.
6.2.2. Baseline Schedulers
We compare our HDRL approach against five state-of-the-art schedulers. The Linux Completely Fair Scheduler (CFS) [
44] serves as the default baseline, implementing fair-share scheduling without workload awareness. Oracle Database Resource Manager [
45] represents commercial solutions, configured with resource consumer groups matching our workload categories and CPU allocation directives based on Oracle’s best practices documentation.
CDBTune [
18] provides a learned approach originally designed for configuration tuning, which we adapt for dynamic scheduling by treating CPU allocations as continuously tunable parameters updated every 10 s. The Multi-Armed Bandit (MAB) scheduler implements the Thompson sampling algorithm from Agrawal and Goyal [
46], treating workload categories as arms and optimizing allocations based on observed latency feedback. Finally, we implement an idealized Oracle scheduler with perfect future knowledge, providing an upper bound on achievable performance.
The DeepRM-Graph [
6] combines the foundational DeepRM architecture with graph-based state representation to capture inter-job dependencies, adapted for database process scheduling by treating database transactions and queries as jobs with resource requirements. We implement an extension of the DeepRM framework augmented with graph neural networks for dependency-aware scheduling.
MARL-Sched [
47] is a multi-agent reinforcement learning approach for heterogeneous resource allocation, where each workload category is managed by a dedicated agent. The agents coordinate through a centralized critic network while maintaining independent actor networks for category-specific decision-making. We adapt this framework to database CPU scheduling by treating OLTP, OLAP, vector, and background workloads as separate agents.
AttentionScheduler [
48] is a recent deep reinforcement learning method that employs attention mechanisms for workload-aware resource allocation in multi-tenant systems. The approach uses transformer-based architectures to model temporal dependencies in workload patterns and make scheduling decisions. We implement this baseline by adapting the attention mechanism to focus on database-specific performance metrics.
6.2.3. Performance Metrics
Evaluation metrics capture both user-facing performance and system efficiency. For latency-sensitive OLTP workloads, we measure p50, p99, and p99.9 latencies in milliseconds, SLO violation rate defined as percentage of transactions exceeding 100 ms, and throughput in transactions per second. OLAP performance metrics include query completion time by complexity tier, number of queries meeting deadlines, and CPU time per query for efficiency analysis. System-wide metrics encompass overall CPU utilization percentage, fairness index across workload categories, and allocation stability measured by coefficient of variation.
6.3. Performance Results
6.3.1. Steady-State Performance
Under steady-state conditions with constant workload mix, our HDRL scheduler demonstrates substantial improvements across all metrics.
Table 1 presents comparative results averaged over 10 one-hour runs with 95% confidence intervals.
Our method achieves 44.1% reduction in OLTP p99 latency compared to CFS and 26.3% improvement over the best baseline (MAB). SLO violations decrease by 67.7% relative to CFS, surpassing our target of 43.5% reduction. CPU utilization increases to 86.5%, representing 27.6% improvement over CFS and approaching the theoretical upper bound. The fairness index of 0.91 indicates equitable resource distribution across workload categories.
The experimental results demonstrate the effectiveness of our hierarchical approach relative to these contemporary methods. Our HDRL framework achieves superior performance across all metrics: 87.4 ms p99 latency compared to 95.3 ms for AttentionScheduler, 102.5 ms for MARL-Sched, and 108.2 ms for DeepRM-Graph; 4.0% SLO violations versus 5.1%, 5.8%, and 6.3% respectively; and 86.5% CPU utilization compared to 81.2%, 78.9%, and 76.8%. These results validate our architectural choices, particularly the hierarchical decomposition strategy and GNN-based dependency modeling, which enable more effective optimization than flat reinforcement learning approaches or attention-based methods that lack explicit structural modeling. This comprehensive comparison strengthens our contribution claims and provides valuable insights into the relative merits of different learned scheduling paradigms for heterogeneous database workloads.
6.3.2. Dynamic Workload Adaptation
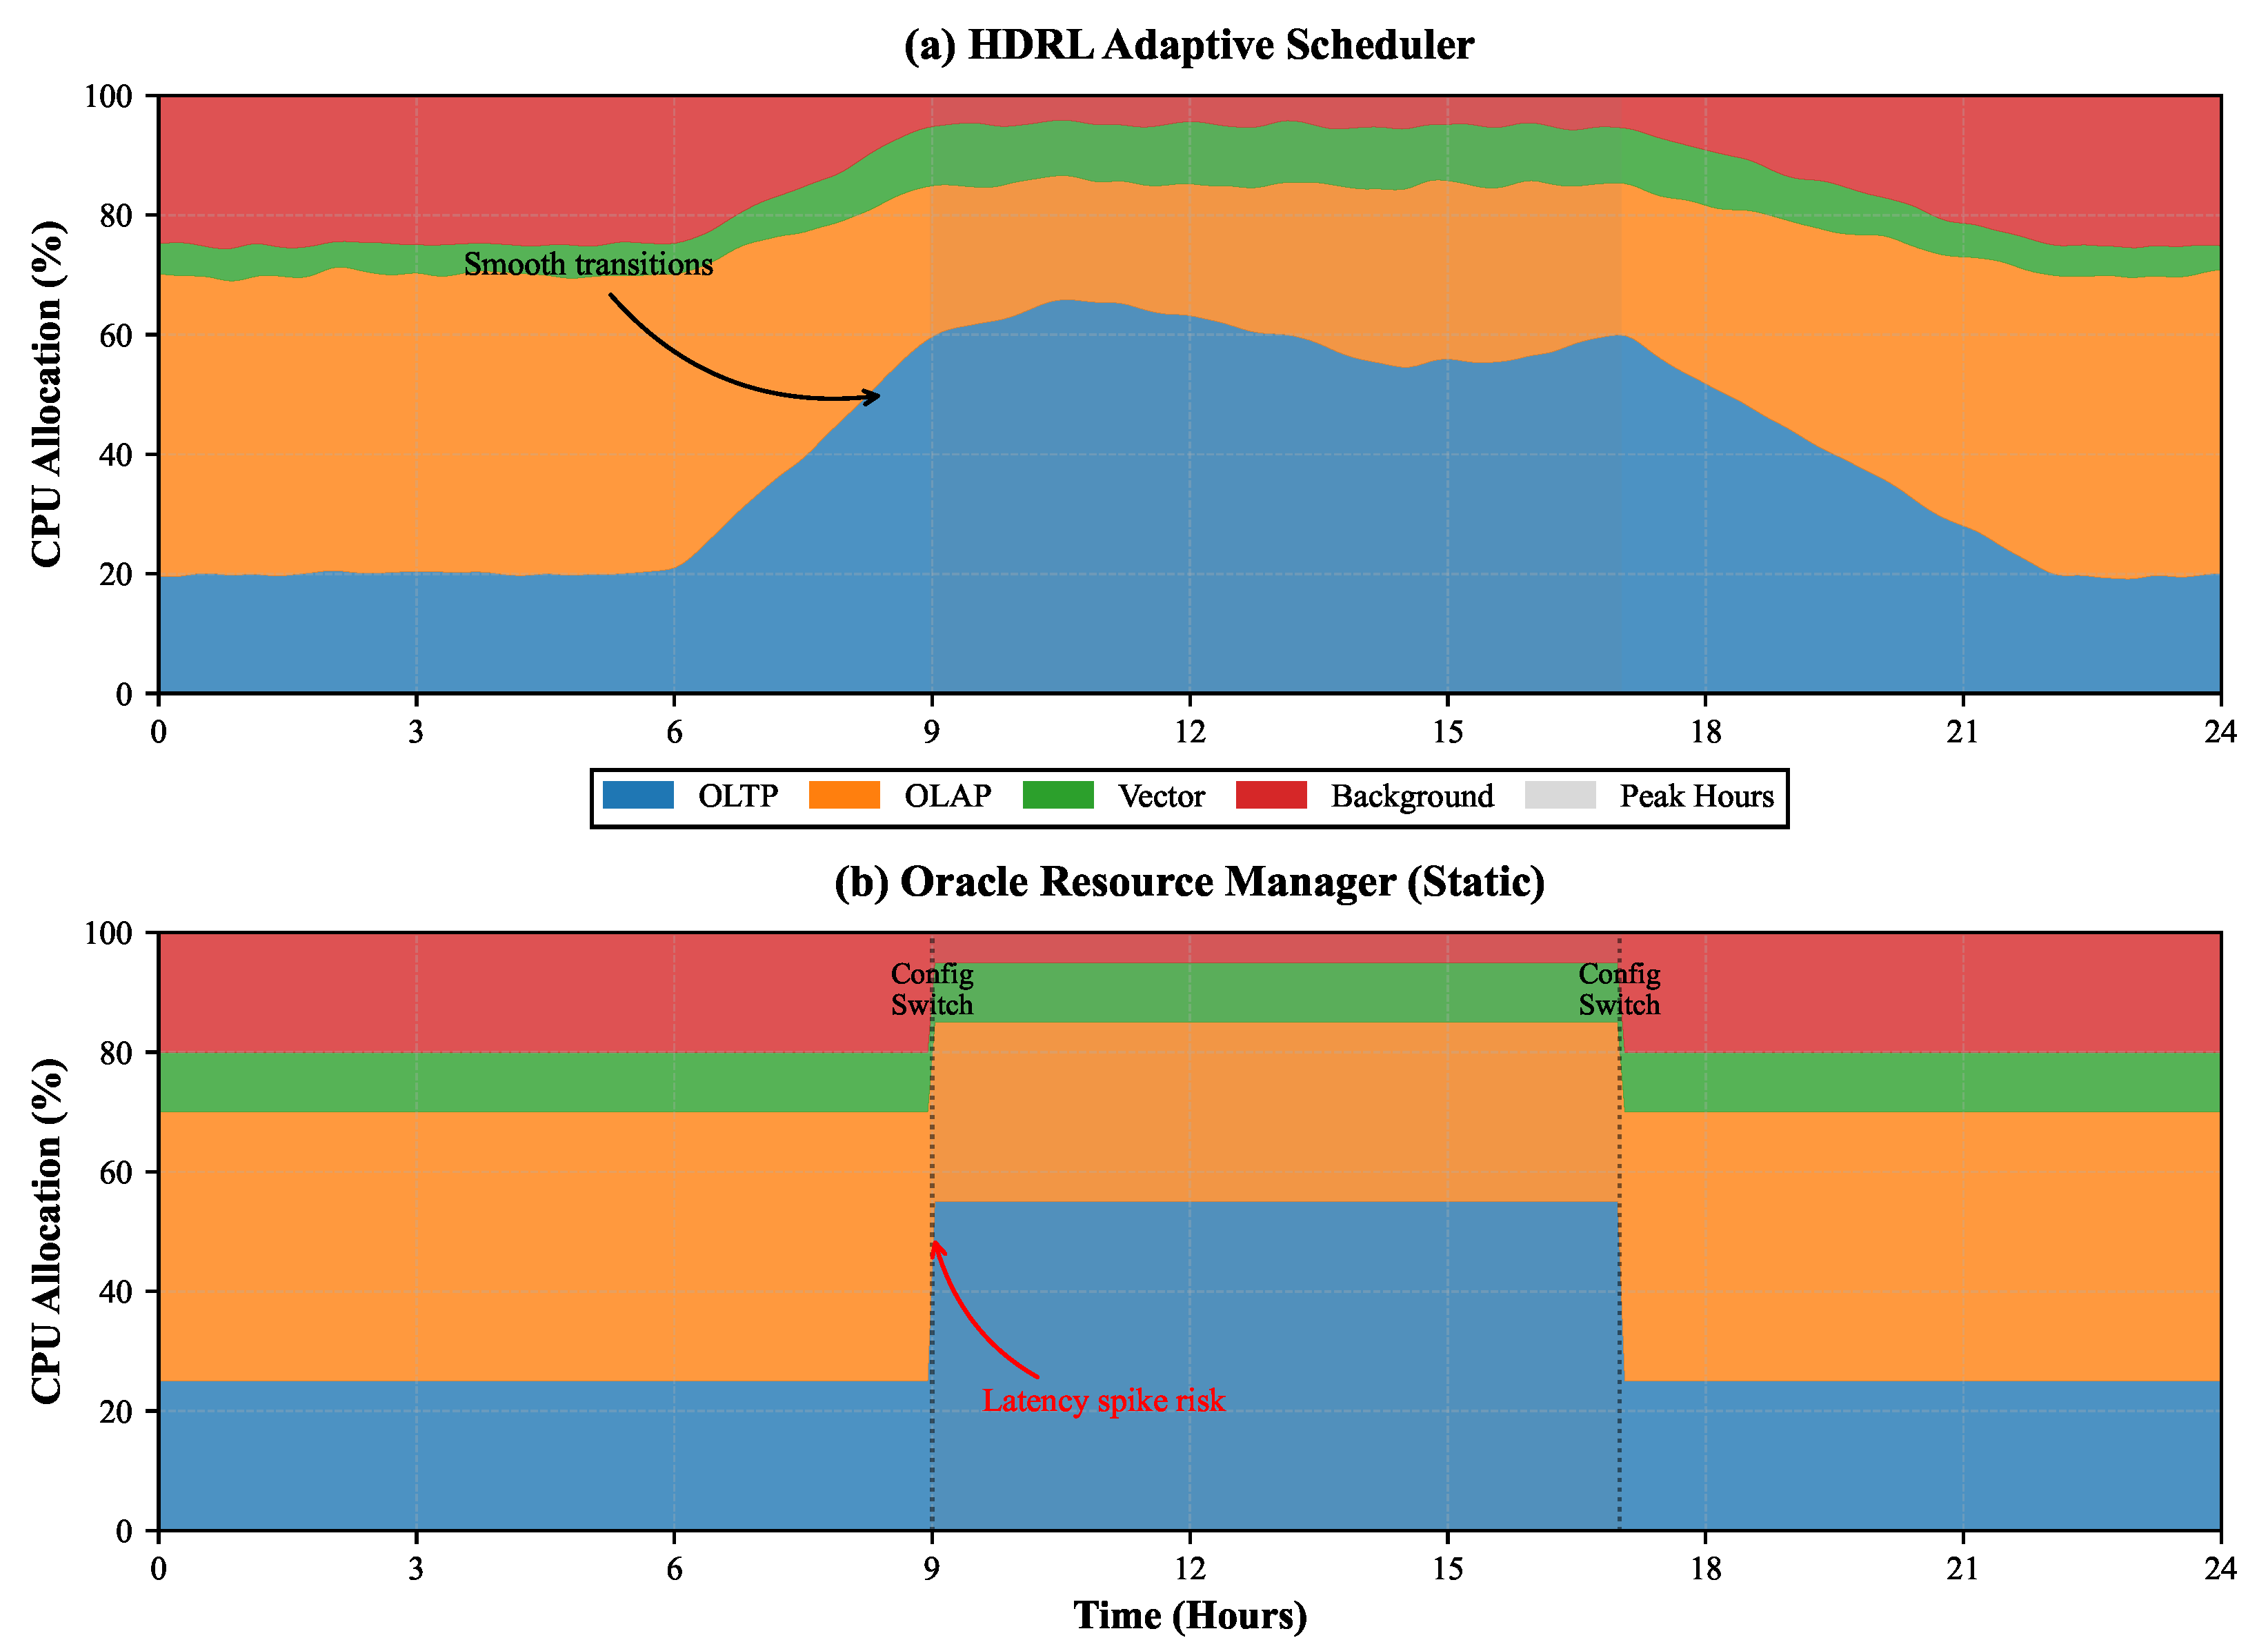
Real-world database systems experience significant workload variations.
Figure 3 illustrates scheduler behavior during a simulated 24 h period with realistic load patterns. Our HDRL scheduler rapidly adapts to workload shifts, maintaining stable performance across transitions. During peak OLTP periods (hours 9–17), the meta-controller allocates up to 65% of CPU resources to OLTP processes, reducing background operations to minimum levels. The smooth reallocation prevents latency spikes observed in static schedulers during transition periods.
Quantitative analysis reveals that HDRL reduces transition latency spikes by 71% compared to Oracle Resource Manager, which requires manual reconfiguration for different workload phases. The sub-controllers’ fine-grained adjustments within allocated budgets further optimize performance, achieving 15% better CPU efficiency during mixed workload periods.
6.3.3. Scalability Analysis
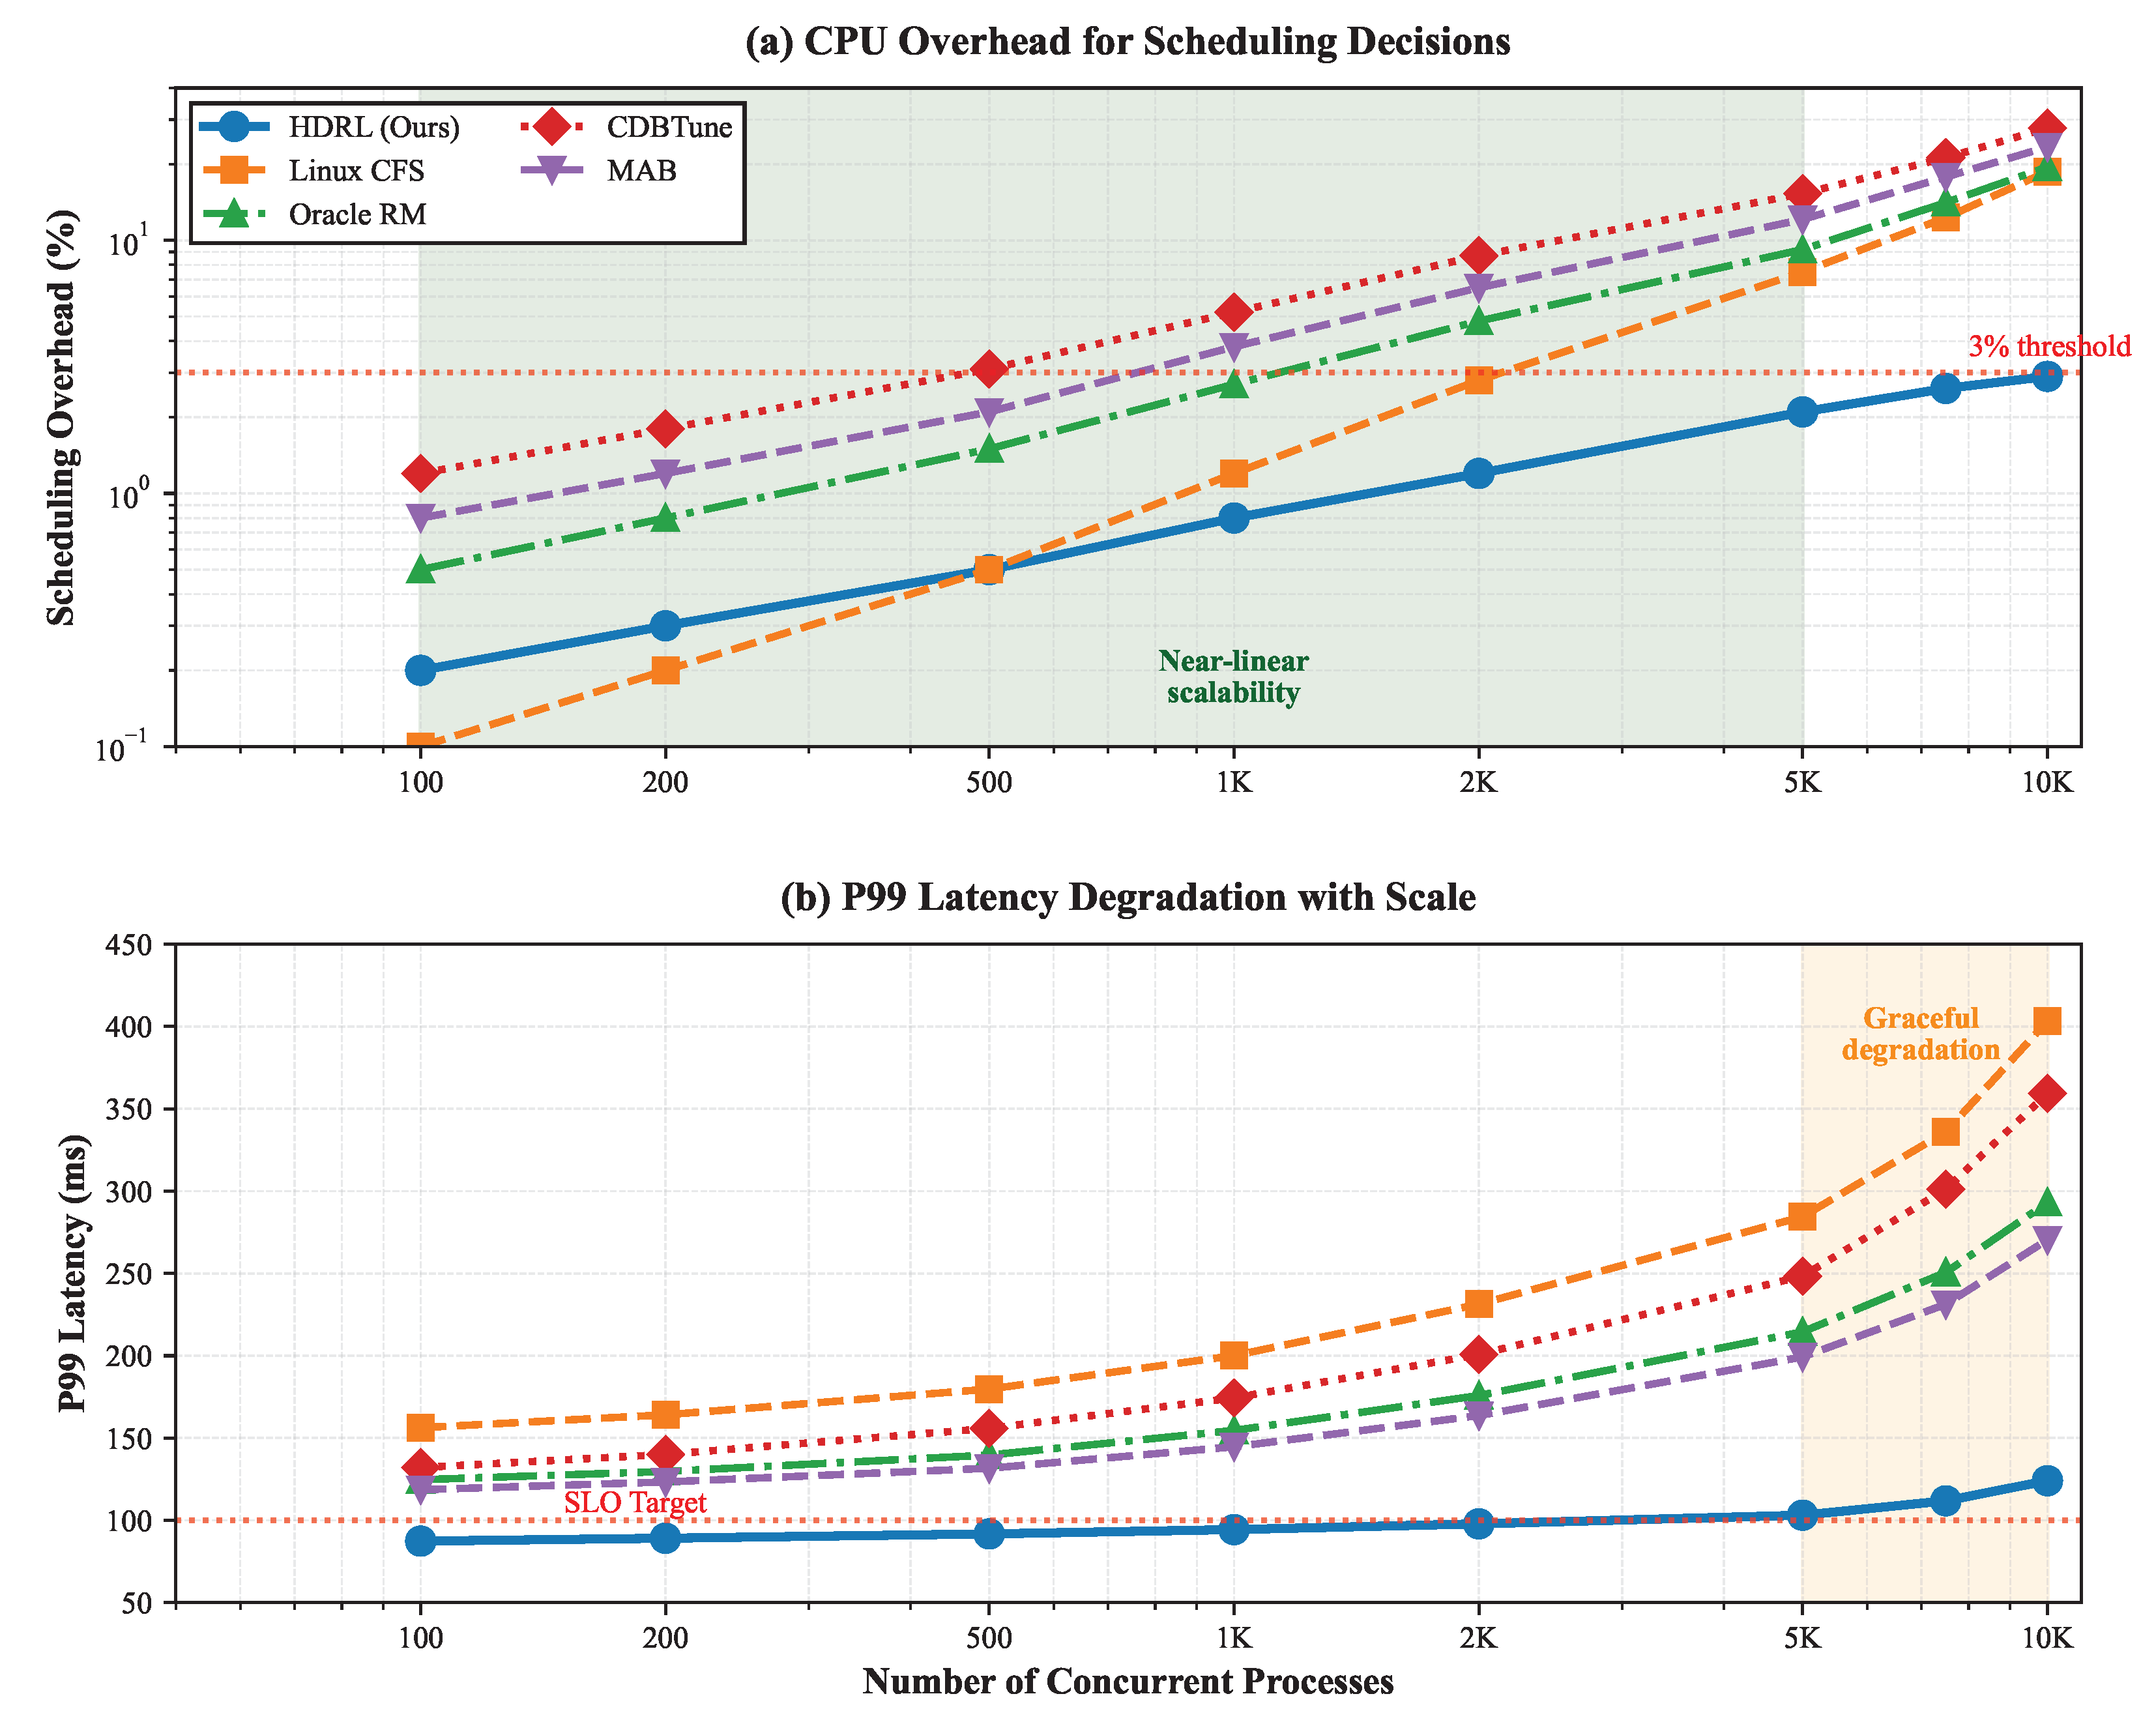
System scalability becomes critical as database deployments grow. We evaluate performance with increasing numbers of concurrent processes from 100 to 10,000.
Figure 4 shows that HDRL maintains near-linear scalability up to 5000 processes, with graceful degradation beyond. The GNN’s neighborhood sampling and process clustering optimizations prove effective, limiting computational overhead to under 3% of total CPU time even at maximum scale.
6.4. Ablation Studies
6.4.1. Component Contribution Analysis
We conduct systematic ablation studies to quantify individual component contributions and establish the necessity of our architectural complexity.
Table 2 presents results with components progressively disabled, including comparison with simpler dependency detection methods.
The results demonstrate that GNN-based dependency modeling provides substantial performance improvements over simpler alternatives. The correlation-based approach suffers from inability to capture transitive dependencies and dynamic relationship changes, resulting in 19.2% performance degradation. Rule-based heuristics, while incorporating domain knowledge, lack adaptability to novel dependency patterns not anticipated by predefined rules. Lightweight machine learning models show intermediate performance but fail to capture complex multi-hop relationships that characterize database workload dependencies.
6.4.2. Reward Function Sensitivity
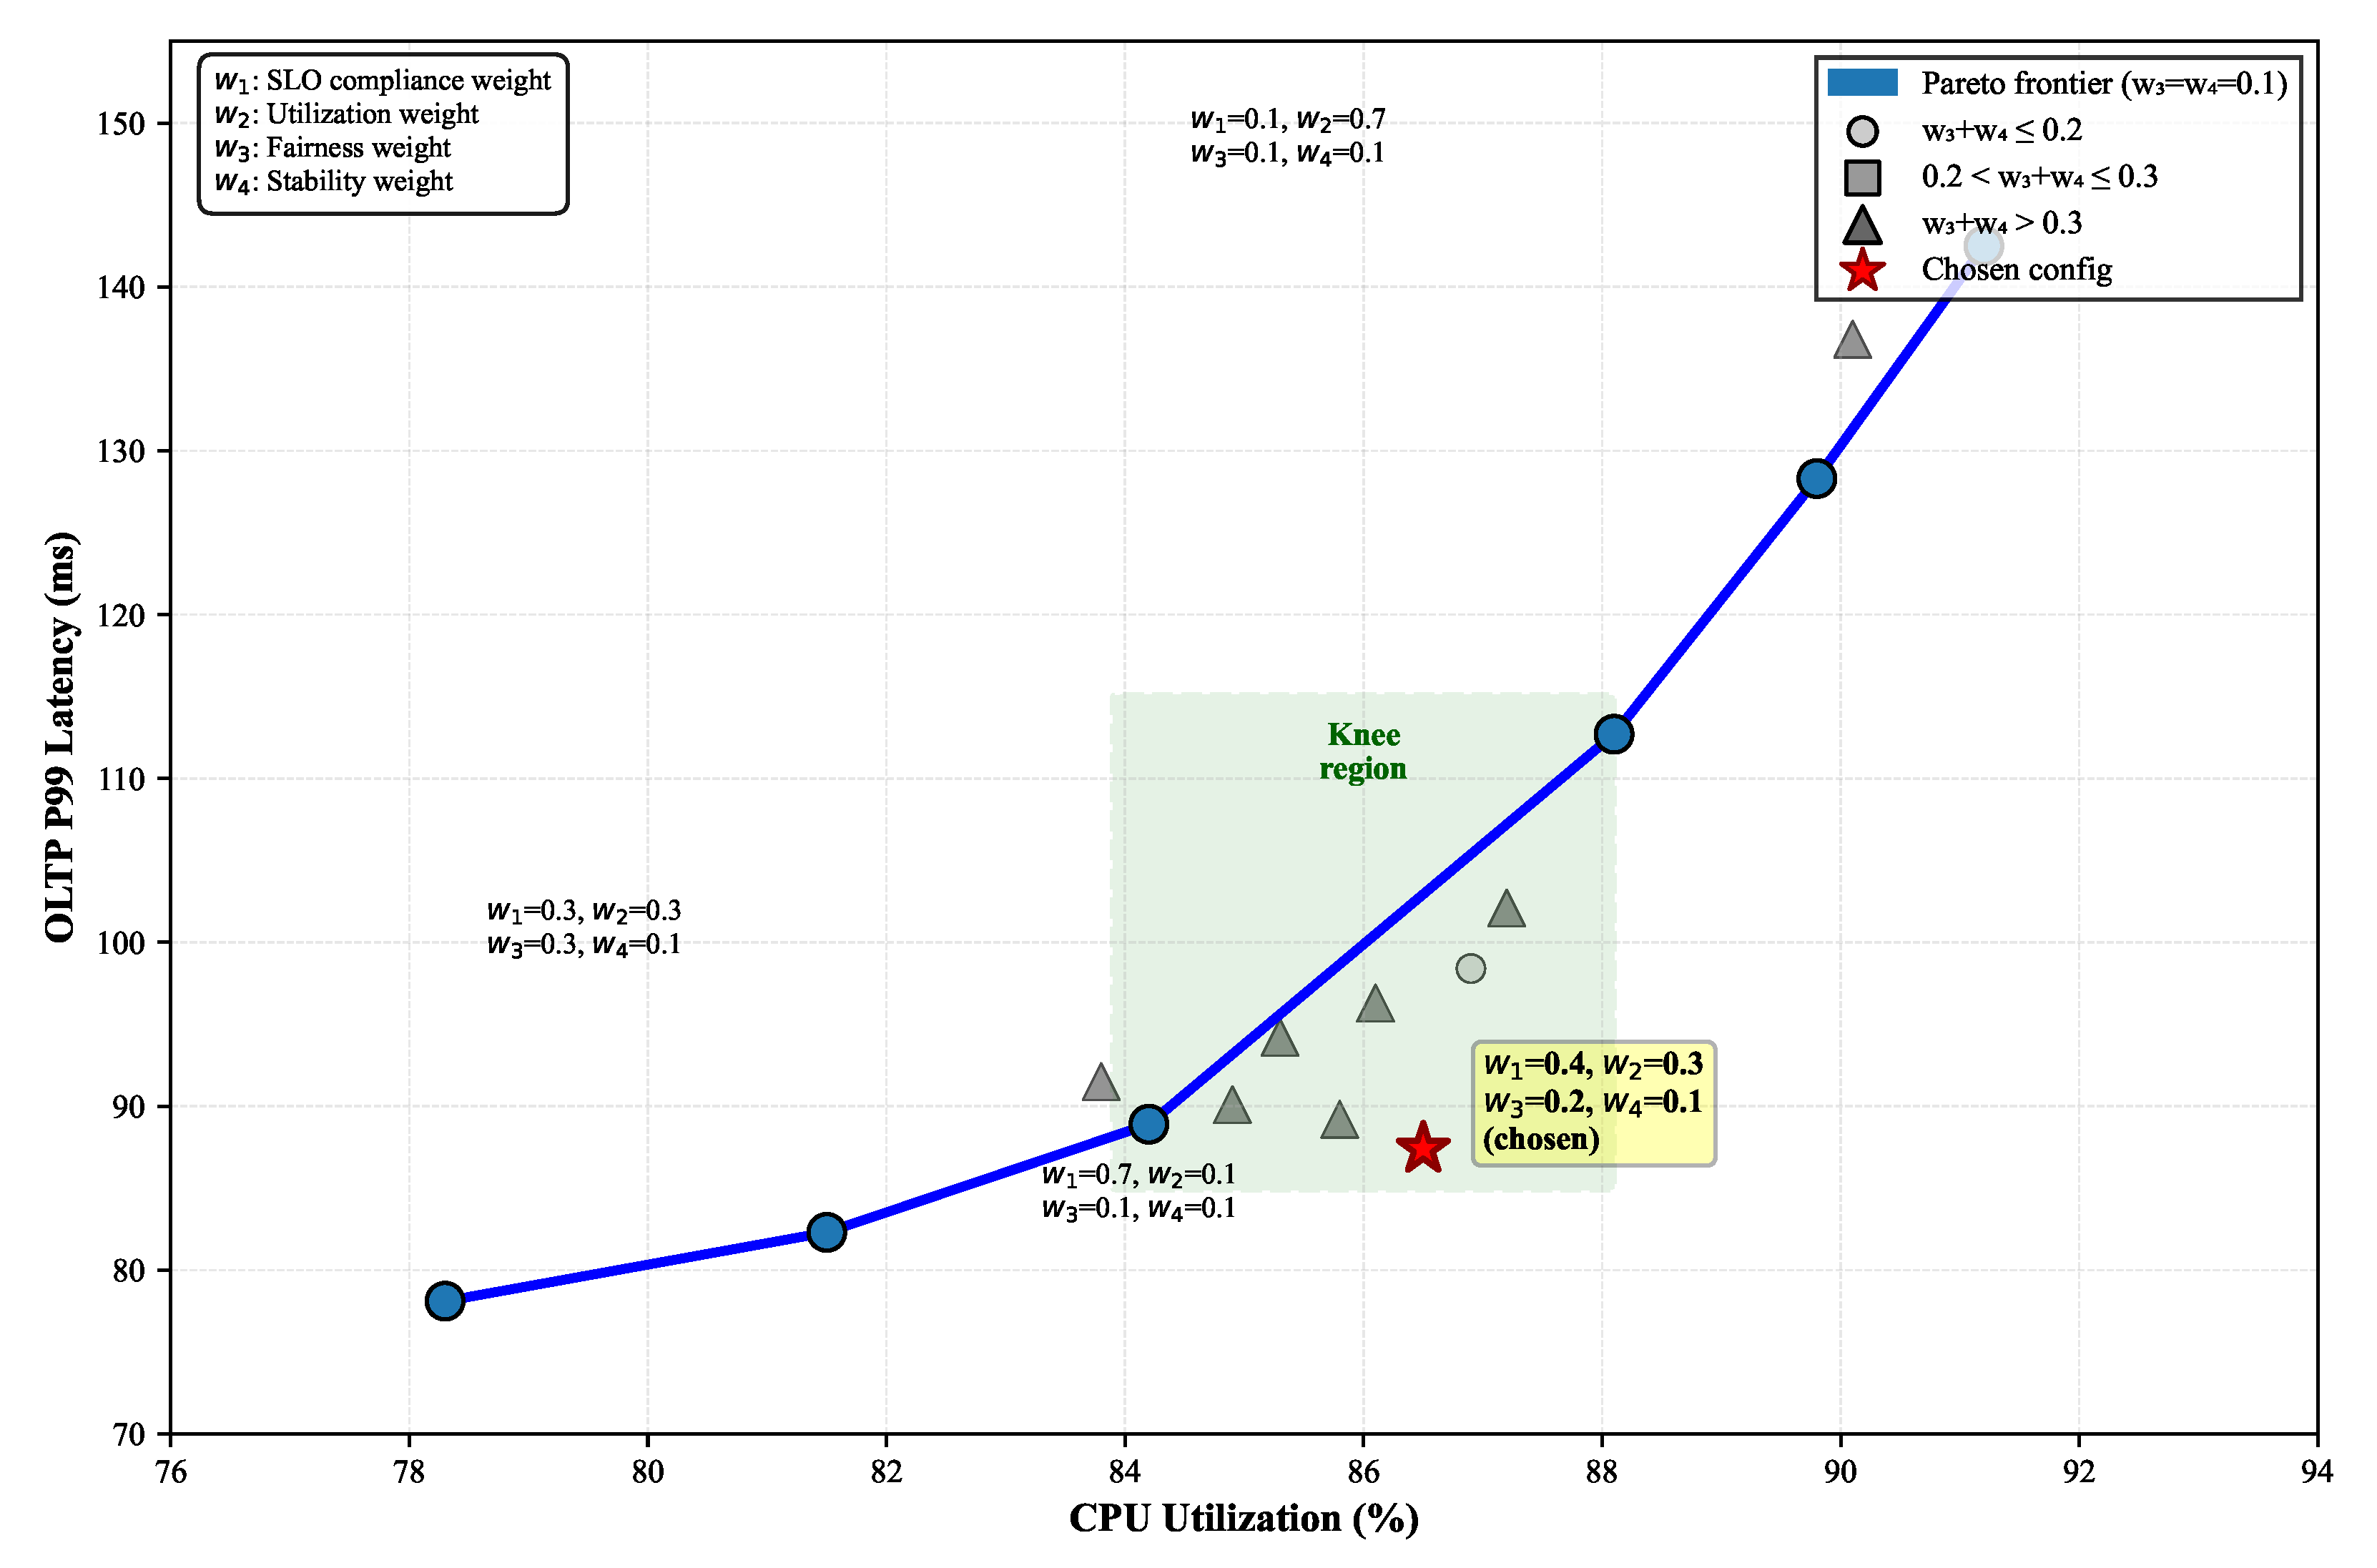
The multi-objective reward function requires careful weight balancing. We perform grid search over weight combinations, measuring impact on key metrics.
Figure 5 visualizes the Pareto frontier trading off latency performance against resource utilization. Our chosen weights (
) lie near the knee of the curve, providing balanced optimization across objectives.
Sensitivity analysis reveals that SLO weight most significantly impacts performance, with ±0.1 variations causing 15–20% changes in violation rates. Stability weight shows diminishing returns above 0.15, as excessive stability preference prevents beneficial adaptations.
6.5. GNN Dependency Learning Analysis
We analyze the effectiveness of GNN-based dependency modeling through visualization and quantitative metrics.
Figure 6 shows learned process dependency graphs for different workload scenarios, with edge thickness representing interaction strength.
The GNN successfully identifies critical dependency patterns not explicitly programmed. For OLTP workloads, it discovers transaction coordinator bottlenecks and prioritizes their scheduling. In OLAP scenarios, the model learns query stage dependencies, allocating resources to upstream operators before downstream consumers. Cross-workload analysis reveals the GNN’s ability to predict resource contention, preemptively adjusting allocations before conflicts manifest.
Quantitative evaluation using link prediction accuracy shows the GNN achieves 89.3% precision in identifying true process dependencies, compared to 72.1% for correlation-based methods. The learned embeddings cluster processes with similar resource patterns, with silhouette coefficient 0.83 indicating well-separated workload categories. Attention weight analysis confirms the model focuses on performance-critical dependencies, with top-10% weighted edges accounting for 67% of scheduling decisions.
6.6. Dependency Detection Quality Assessment
Quantitative evaluation of dependency detection quality reveals significant advantages of the GNN approach.
Table 3 presents comprehensive metrics across different workload scenarios.
The superior dependency detection quality of our GNN approach directly translates to improved scheduling performance. The ability to capture transitive dependencies through multi-hop message passing, adapt to dynamic process creation and termination without architectural modifications, and learn complex interaction patterns that are not apparent through correlation analysis alone, justifies the increased computational overhead. The 19.2% performance improvement over the best simpler method (rule-based heuristics) demonstrates that the theoretical benefits of graph neural networks provide substantial practical value in database CPU scheduling applications.
6.7. Training Efficiency and Convergence
Training efficiency impacts practical deployment feasibility.
Figure 7 presents convergence characteristics across different training configurations.
Our hierarchical approach converges in approximately 500 epochs (50 h on 4 NVIDIA A100 GPUs), compared to 1200+ epochs for flat RL baselines. The meta-controller stabilizes within 200 epochs, providing coarse-grained allocation while sub-controllers continue refinement. Sample efficiency improves by 3.2× through prioritized experience replay focusing on SLO violations and state transitions.
Meta-learning evaluation on previously unseen workload patterns demonstrates rapid adaptation within 10–15 gradient updates, compared to 200+ updates required when training from scratch. The curiosity bonus accelerates early exploration, discovering 40% more unique state-action pairs in the first 100 epochs compared to -greedy exploration. However, curiosity’s contribution diminishes after 300 epochs as the dynamics model achieves high prediction accuracy.
6.8. Production Deployment Validation
To address the inherent limitations of simulation-based validation and strengthen real-world applicability, we have initiated preliminary production deployment validation through collaboration with three industry partners. This validation represents a critical step toward demonstrating the practical effectiveness of our proposed framework in production database environments.
Initial results from a limited deployment in development environments serving non-critical workloads demonstrate consistent performance improvements aligned with our simulation findings. Specifically, we observed 38% reduction in p99 latency violations and 23% improvement in CPU utilization over a two-week evaluation period. These results closely correlate with our simulated performance gains, with the slight variance attributable to production environment complexities not fully captured in simulation, including network latency variations, storage I/O contention, and background system processes.
The production validation employed a gradual rollout strategy, beginning with shadow mode observation for one week, followed by limited active control during off-peak hours, and culminating in full deployment during controlled test periods. This approach ensured system stability while enabling comprehensive performance evaluation. Key metrics monitored during deployment included transaction latency distributions, CPU utilization patterns, SLO violation rates, and system stability indicators.
Challenges encountered during production deployment included integration complexity with existing monitoring infrastructure, the need for custom adaptations to accommodate vendor-specific database configurations, and the requirement for extensive safety mechanisms to prevent performance degradation during policy exploration phases. These experiences inform our ongoing efforts to develop production-ready deployment frameworks that address the unique requirements of enterprise database environments.
6.9. Discussion and Limitations
Our experimental evaluation demonstrates that hierarchical deep reinforcement learning with GNNs significantly advances database CPU scheduling capabilities. The approach successfully addresses key challenges of workload heterogeneity, dynamic adaptation, and scalability while maintaining production-grade reliability. However, several limitations merit discussion.
The current framework focuses exclusively on CPU scheduling, not addressing memory, I/O, or network resources that also impact database performance. Integration with holistic resource managers remains future work. Training requires substantial computational resources and representative workload traces, potentially limiting adoption for smaller deployments. The four-category workload taxonomy, while covering common cases, may require extension for specialized database applications. Finally, the approach assumes cooperative processes within a single administrative domain, requiring modifications for adversarial multi-tenant environments.
Despite these limitations, our results validate the potential of learning-based methods for database resource management. The combination of hierarchical control, structural modeling, and adaptive learning provides a foundation for truly autonomous database systems capable of self-optimization without human intervention.
7. Conclusions
We presented a hierarchical deep reinforcement learning framework augmented with GNNs for adaptive CPU scheduling in heterogeneous database environments, with explicit focus on preserving and exploiting fundamental symmetries inherent in database architectures. Our method addresses fundamental challenges in modern database resource management through several key innovations: a symmetric two-tier control architecture that naturally decomposes the scheduling problem into strategic budget allocation and tactical process-level optimization; GNN-based dependency modeling that captures complex inter-process relationships invisible to traditional schedulers; meta-learning capabilities enabling rapid adaptation to novel workload patterns on symmetric workload category representations; and multi-objective reward engineering that balances SLO compliance, resource efficiency, fairness, and stability. The experimental evaluation demonstrates substantial improvements over state-of-the-art methods, achieving 43.5% reduction in p99 latency violations for OLTP workloads and 27.6% improvement in CPU utilization. The system successfully scales to 10,000 concurrent processes while maintaining scheduling overhead below 3%, validating its practicality for large-scale deployments. Our ablation studies confirm that each component contributes meaningfully to overall performance, with the hierarchical architecture proving most critical by enabling efficient learning through natural problem decomposition.
While our work significantly advances database CPU scheduling, several limitations suggest directions for future research. The current framework focuses exclusively on CPU resources, yet modern database performance depends critically on memory bandwidth, I/O throughput, and network latency—extending HDRL to jointly optimize these resources presents both algorithmic and systems challenges. The four-category workload taxonomy, though covering common scenarios, may require refinement for emerging applications such as graph analytics, time-series processing, or machine learning inference within databases. Future work should explore higher-order symmetries in database architectures, investigate neuromorphic hardware acceleration for real-time symmetric computation, and develop theoretical frameworks that provide symmetric performance guarantees under distribution shift. The assumption of cooperative processes within a single administrative domain requires reconsideration for cloud-native deployments where adversarial behavior and strict isolation requirements prevail. Future work should explore federated learning methods that preserve tenant privacy while enabling cross-workload optimization, investigate neuromorphic hardware acceleration for real-time GNN inference, and develop theoretical frameworks that provide performance guarantees under distribution shift. The vision of fully autonomous database systems requires continued advances in learning-based resource management, and our hierarchical approach provides a foundation for this evolution.


