Abstract
In continuous casting, fewer strand operations are sometimes required to match production schedules. However, the study of flow behavior and temperature distribution under fewer strand casting conditions remains insufficiently systematic, especially with regard to the grade casting process, which has not yet been explored. This study presents an innovative investigation of the grade transition process in a symmetrical 12-strand tundish under fewer strand casting conditions. Seven operational cases were analyzed: standard casting (the normal symmetric Case 0), individual closure of strands 1–6 (the asymmetric Cases 1–6), and simultaneous closure of strands 1–2 (the asymmetric Case 7). Notably, strand closures in Cases 5 and 6 significantly impair flow characteristics in their respective strands. The impact area temperature reaches approximately 1844 K (new heat) after 30 min of continuous casting. However, Case 6 exhibits persistent low-temperature regions near strands 5 and 6. The average transition billet lengths for Cases 0 to 7 are 72.41 m, 70.16 m, 70.30 m, 71.68 m, 72.95 m, 72.12 m, 76.35 m, and 65.45 m, respectively. Based on a comprehensive evaluation of flow dynamics, temperature uniformity, and transition billet length, Case 1 emerges as the most favorable single-strand closure strategy. Operational recommendations suggest avoiding strand closure patterns implemented in Cases 5 and 6 during reduced strand casting operations.
1. Introduction
Molten steel flows from the ladle, through the ladle shroud, into the tundish, and finally enters the mold—a process extensively studied by metallurgists and commonly referred to as tundish metallurgy [1,2,3]. At present, extensive research primarily focuses on single-strand [4] or double-strand [5,6] tundishes. By optimizing internal flow control devices [7,8,9,10], applying tundish gas injection technology [11,12,13,14], and improving the structure of ladle shroud [15,16], the aim is to reduce the turbulent kinetic energy of molten steel. This approach enhances flow patterns, prolongs residence time [17,18,19], homogenizes temperature distribution across strands, and improves inclusion removal efficiency [20,21,22,23,24,25]. During unsteady casting processes, efforts are primarily directed at optimizing casting flow rate, tundish level, and turbulence inhibitors to reduce slag entrapment [26,27] and re-oxidation [28,29].
The symmetrical double six-strand tundish consists of a single ladle connected to two ladle shrouds [27,30,31], each inserted into two independent six-strand tundishes. The inlet area (impact area) is offset to one side of the tundish, forming a biased flow casting pattern [32,33,34]. This type of tundish is mainly used for small billet production. In practice, due to constraints on the annual production capacity and casting rhythm, one or two strands in a symmetrical double six-strand tundish are often shut off for fewer strand casting [35]. In multi-heat sequence continuous casting operations, the symmetrical double six-strand tundish bridges molten steel from the preceding and following heats, enabling a continuous casting process. However, if there are compositional differences between the two heats, a segment of billet with inconsistent composition—meeting neither the previous nor the next heat’s specifications—may form during the transition. This segment is referred to as a transition billet [36].
Researchers have investigated the effects of fewer strand casting on molten steel flow, temperature distribution, and inclusion removal in tundishes. In terms of steel flow, C. Bruch and P. Valentin [37] conducted numerical simulations on strand closure in a six-strand tundish and found that the streamlines around the stopper rod were significantly sparser compared to normal conditions. T. Merder [38] also studied a six-strand tundish and reported that when outlets far from the ladle shroud were closed, the dead zone volume increased markedly; however, for outlets near the ladle shroud, flow characteristics in a 12-strand tundish improved after strand closure, concluding that closure near the strand resulted in better flow behavior. In terms of temperature field, A. Braun et al. [39] performed a simulations of a two-strand tundish and showed that closing one strand caused the return flow point to shift closer to the ladle shroud, leading to significant temperature drops in the tundish. S. K. Mishra et al. [40] found that two asymmetrically close strands in a six-strand tundish could cause a maximum strand temperature difference of up to 10 °C. In terms of inclusion removal, L. Zhang et al. [41] simulated inclusion behavior in a four-strand tundish and found that strand closure not only enhanced the surface removal of inclusions, but also led to notable temperature drops. P. Zhao et al. [42] modeled inclusion behavior after outlet closure in a six-strand tundish and noted that closing one or two strands, especially those closer to the impact zone, improved flow characteristics and increased inclusion removal rates. X. Wang et al. [35] investigated inclusion removal under fewer strand casting conditions and found that shutting down strands in a six-strand tundish negatively affected the removal of inclusions sized 30–70 μm. In terms of flow control device optimization, L. Zhong et al. [43] optimized baffles by introducing rectangular openings, showing that closing the central strand extended the response time of other strands and reduced the dead zone volume. C. Yao et al. [44] replaced a V-shaped baffle with a U-shaped one, improving the tundish flow field after strand closure. The V-shaped baffle produced a 5 K temperature difference between the two sides of the tundish. J. Song and J. Fan et al. [45,46] compared different flow control setups for a four-strand tundish under fewer strand operation and found that the U-shaped baffle provided better consistency across strands due to its interconnecting structure, compared to the double-baffle configuration.
Regarding transition billets, they are typically either scrapped or downgraded, leading to economic losses. To address this, researchers have widely studied methods to reduce the length of transition billets and accurately predict their start and end positions. These approaches include optimizing tundish operating practices, improving flow control devices and internal structures, analyzing temperature differences between successive heats, and developing mathematical prediction models. In terms of operational practices during grade transition, A. Diener et al. [36] were the first to study the transition casting of different steel grades in the tundish in 1990. They found that reducing the amount of residual steel in the tundish could effectively shorten the length of the transition billet. Later, M.C. Tsai and M.J. Green [47] carried out numerical simulations of grade transitions in a 30-ton single-strand slab caster tundish and discovered that increasing the casting speed and lowering the tundish level could reduce the transition time. M.T. Burns et al. [48] conducted full-scale physical water model experiments of single-strand tundishes and found that, in addition to confirming the relationship between residual steel and transition billet length, transitioning from narrow to wide specification resulted in shorter transition billets. Regarding flow control device optimization, H.S. Chen and R.D. Pehlke [49] used numerical simulations to compare the effects of baffles and dam-weir combinations in double-strand tundish during grade transition. They concluded that baffles were not beneficial for reducing transition billet length. T.J. Piccone et al. [50] conducted industrial trials and water model experiments on a 45-ton single-strand tundish and demonstrated that tundishes equipped with turbulence inhibitors and dams performed better than traditional designs with perforated baffles. S. Kant et al. [51] explored the effect of dam placement on transition billet length through water modeling of a six-strand tundish and found that positioning the dam near the inlet area reduced the transition length. J. Guarneros et al. [52] found that an inhibitor, a baffle, and vortex killer yields a smaller amount of intermixed liquid. S. Chakraborty et al. [53] designed a step-shaped tundish bottom that maintained steel cleanliness while achieving a high liquid level with reduced transition billet. D. Xu et al. [54] elevated the tundish bottom (trapezoidal: higher in the middle, lower at the strands) and optimized the turbulence inhibitor structure, which helped reduce steel level fluctuations, increased plug flow ratio, and decreased the mixing between old and new steel, thereby lowering the transition billet volume. During grade transitions, the temperature difference between the new and residual steel in the tundish results in thermal buoyancy, which affects flow behavior. L.C. Amorim et al. [55] studied this in six-strand tundishes and found that hotter new steel created thermal buoyancy when poured into colder residual steel, altering the flow field. The temperature difference between steel grades significantly influenced mixing behavior. A. Cwudziński [56] performed both water model experiments and numerical simulations on a double-strand tundish and observed that due to density differences at varying temperatures, high-temperature steel layered above the colder, denser residual steel during grade transitions. In recent years, S. Song et al. [57,58] have conducted extensive studies on transition casting of different steel grades. In [57], multi-physics coupling models were used to simulate the transition process in a four-strand tundish. It was found that although reducing the casting speed lowered centerline segregation, it also increased the transition billet length from 10.88 m to 12.41 m. Furthermore, by studying the entire process from the ladle shroud to the solidification end, it was discovered that pouring low-density, high-solute steel into high-density, low-solute steel resulted in a 24.70 m transition billet, whereas the reverse case produced a 33.44 m billet.
To ensure flow consistency across strands and meet the requirements of large-scale production, the tundish is typically designed with symmetrically arranged ladle shrouds [23,24,33,34,35,36,37]. T. Merder [38] found that closing a single outlet leads to an asymmetric nozzle configuration, resulting in increased dead zone volume and reduced strand consistency. S. K. Mishra et al. [40] reported that closing two symmetrically located strands yields better performance than asymmetric closure, with the maximum temperature difference at the outlets increasing by up to 10 °C in the asymmetric case. These findings indicate that fewer strand operation causes asymmetry in the tundish nozzle layout, which deteriorates flow characteristics and temperature uniformity.
Numerous studies have been conducted on fewer strand casting and grade transition processes, primarily focusing on single-strand, double-strand, as well as four-strand and six-strand tundishes. However, these two phenomena are quite common in the production process of a symmetrical double six-strand tundish. At present, research on fewer strand operation and grade transition casting in a symmetrical double six-strand tundish under asymmetric casting conditions remains limited. Moreover, the impact of fewer strand casting on the grade transition process has not yet been reported, and the molten steel flow patterns, temperature distribution, and transition billet length under such conditions are still unclear.
Therefore, this study takes the symmetrical double six-strand tundish as the research object and establishes a numerical model of grade transition casting under fewer strand operation. Using the normal casting condition as a reference, the effects of various strand closure cases on flow field, temperature field, and the start and end positions of the transition billet are compared. The goal is to propose a reasonable strand closure strategy to optimize grade transition casting during the continuous casting process and reduce the length of the transition billet.
2. Materials and Methods
2.1. Geometric Model
A full-scale 1:1 geometric model was established based on a symmetrical double six-strand tundish (capacity: 50 t) from a steel plant as shown in Figure 1. The ladle shroud is located on one side of the tundish, and the strands are numbered from 1 to 6 from the inlet area (impact area) toward the short wall of the tundish. The symmetrical double six-strand tundish is used for casting 150 × 150 mm square billets, with a casting speed of 2.8 m/min and a steel throughput of 2.56 t/min. The tundish liquid level is 820 mm, and the insertion depth of the ladle shroud is 300 mm. The center-to-center spacing between adjacent strands is 1200 mm, and each strand has a length of 710 mm and a diameter of 25 mm.
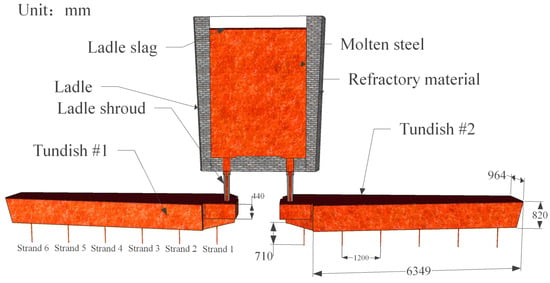
Figure 1.
A 12-strand tundish-ladle system.
2.2. Model Assumptions
The following assumptions are made for the 3D mathematical model of the tundish [45]:
- The molten steel is assumed to be an incompressible Newtonian fluid, with only the flow and temperature changes in the molten steel in the tundish considered;
- The Realizable k-ε Two-Layer (RKE-2L) turbulence model is used to describe the turbulence phenomena within the tundish;
- The influence of the slag layer on the molten steel flow and heat transfer in the tundish is neglected;
- Chemical reactions in the tundish are not considered;
- Changes in the tundish liquid level are not considered.
2.3. Control Equations
According to Patankar [59], the continuity and momentum equations are unified into a single form. The flow of molten steel inside the tundish is described by the unified differential Equation (1) as follows:
where ρ is the density, kg/m3; φ represents the solved variables such as velocity, concentration, turbulent kinetic energy, and turbulent dissipation rate; u is the velocity vector, m/s; t is time, s; Γϕ,eff is the effective diffusion coefficient of the solved variable, m2/s; and Sφ is the source term.
2.4. Tracer Transport Model
The tracer transport model adopts a passive scalar approach. The passive scalar is a virtual tracer without physical properties, which is transported passively along with the molten steel flow. In the numerical simulation, the governing equation for passive scalar transport is solved, as shown in Equation (2) [45,60,61]:
where ω represents the volume fraction of the tracer within the computational domain—that is, the proportion of each grid cell volume occupied by the tracer. A value of ω = 1 indicates that the grid cell is completely filled with the tracer. Deff denotes the effective diffusion coefficient of the passive scalar, m2/s.
In the pulsed tracer injection scenario, the tracer is introduced by setting the concentration ω = 1 in the injection region while maintaining ω = 0 elsewhere. The injection occurs with a time interval of 1 s. After the injection is completed, the tracer concentration ω at the inlet region is reset to 0. By tracking the transport of the tracer through the tundish, the variation of ω at the strands is monitored to obtain the residence time distribution (RTD) curves, which reflect the flow characteristics within the tundish.
During grade transition casting, compositional differences between consecutive heats can produce a billet segment with inconsistent properties that meets neither the preceding nor subsequent heat’s specifications. This segment is called a ‘Transition Billet’. Continuous tracer injection simulates the compositional shift between the previous and new heats. The initial tracer concentration ω in the tundish is set to 0. After t = 0, the tracer concentration ω in the inlet region is set to 1. As casting progresses, the tracer concentration within the tundish gradually increases from 0 to 1. The concentration variation at each strand is monitored, where the strand tracer concentration ω represents the proportion of the concentration difference between the previous and the new heats during the grade transition process, as shown in Equation (3):
where wO, wN, and wP represent the mass fractions of a given element at the strand, in the new heat, and in the previous heat, respectively.
2.5. Heat Transfer Model
The influence of temperature variation on molten steel density is considered using the Boussinesq model. The relationship between density and temperature is given by the following Equation (4):
where ρst is the molten steel density, kg/m3; β is the thermal expansion coefficient β = 9.72 × 10⁻⁵ K−1; and ΔT is the instantaneous temperature difference, °C.
2.6. Mesh Generation
The geometric model of the tundish was meshed using a polyhedral mesh generator [62]. The mesh was locally refined in the inlet area, as shown in Figure 2. The total number of mesh elements was 662,278.
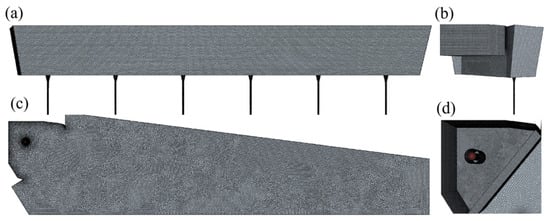
Figure 2.
Mesh division of tundish with impact pad. (a) Front view; (b) left view; (c) top view; (d) impact pad.
2.7. Boundary Conditions
The boundary conditions were defined as follows: solid surfaces were treated as no-slip, rough walls with a roughness height of 0.00027. The inlet was defined as a velocity inlet. The boundary conditions of the numerical simulation in this study are similar to those used in our previous work [27]. In combination with actual production conditions, the detailed computational parameters and boundary conditions are determined, as shown in Table 1. The turbulence kinetic energy (k) and turbulence dissipation rate (ε) at the inlet were calculated as follows:
where I is the turbulence intensity, I = 0.02; v is the inlet velocity; Cμ is the model constant, Cμ = 0.09; L is the characteristic length, L = 0.07 D; and D represents the diameter of the ladle shroud.

Table 1.
Numerical simulation parameters and wall boundary conditions.
2.8. Solution Procedure
The governing equations were solved using Simcenter STAR-CCM+ V2021.3 [63], a software based on the finite volume method. The Realizable k-ε Two-Layer (RKE-2L) model was used to iteratively compute the steady-state flow field. The results from the steady-state simulation were then used as the initial condition for the transient simulation. Pressure–velocity coupling was solved using the semi-implicit method for pressure-linked equations (SIMPLE) algorithm. The convergence criterion required the residuals of all variables to fall below 1 × 10⁻⁴. For the transient simulation, the time step was gradually increased: the initial time step was 0.002 s, with a growth factor of less than 1.25, and the maximum time step was set to 1 s, with 20 iterations per time step.
In terms of the temperature field, the simulation modeled the continuous casting process where higher-temperature molten steel from the new heat (1844 K) was poured into the tundish containing lower-temperature molten steel from the previous heat (1793 K). The study did not account for the temperature drop of molten steel in either heat. The temperature calculation process was as follows: the initial temperature of the tundish was set to 1793 K, and wall heat flux boundary conditions were applied. The simulation iterated until all residuals dropped below 1 × 10⁻⁴, at which point the steady-state wall temperature distribution was obtained. This steady-state result served as the initial condition for the transient simulation, during which 1844 K molten steel was continuously poured into the tundish over time.
3. Results and Analysis
3.1. Computational Fluid Dynamic (CFD) Model Verification and Validation
Figure 3 presents a comparison between PIV measurements and CFD-predicted velocity vectors. As shown in Figure 3a, a strong counterclockwise vortex is observed across all liquid heights between the ladle shroud and the right wall, while a clockwise vortex appears at the lower region on the left side of the ladle shroud. The velocity vector directions in the CFD results, shown in Figure 3b, are in good agreement with the PIV measurements, confirming the reliability of the CFD model for simulating the flow field in the 12-strand tundish.
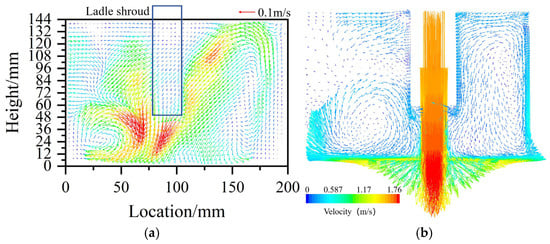
Figure 3.
Velocity vectors at the tundish inlet longitudinal section. (a) PIV measurement; (b) CFD simulation.
3.2. Influence of Fewer Strand Casting in Tundish on Transition Billet
3.2.1. Research Plan for Fewer Strand Casting
The normal symmetric Case 0 serves as the control group, in which all 12 strands are fully open and the casting process proceeds symmetrically, representing the ideal symmetric casting condition. In contrast, the reduced-flow casting scenarios focus on the effects of shutting down a single strand—thus disrupting the symmetry—on the molten steel flow characteristics, temperature distribution within the tundish, and the resulting transition billet length. Additionally, for the case of shutting down two strands, strands 1 and 2 are closed, following actual production conditions in the plant. The specific research cases are shown in Table 2.
Table 2.
Research plan for fewer strand casting.
3.2.2. Tundish Flow Field
The streamlines of the tundish flow field for each case are shown in Figure 4. The tundish can be divided into different regions. The inlet region exhibits substantially elevated molten steel velocities (>0.1 m/s), surpassing other flow domains by an order of magnitude. A small and a large recirculation zone are formed near strand 1 and between strands 2 and 3, with velocities around 0.05 m/s. Under both the ideal symmetric condition and the symmetry-breaking scenarios, the flow patterns in the inlet region and near strands 1–3 remain largely consistent. The main flow stream passes through strands 3 and 4, forming an upward flow between strands 4 and 6. In Case 2 (strand 2 closed), the molten steel has a relatively low velocity between strands 4 and 5, falling below 0.02 m/s, as shown in Figure 4e. In Case 6 (strand 6 closed), the upward flow between strands 5 and 6 disappears, as shown in Figure 4g.
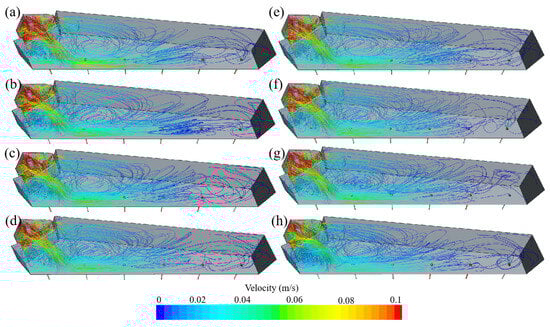
Figure 4.
Streamline of the tundish for each case. (a) Case 0; (b–g) Cases 1–6; (h) Case 7.
According to the definition of slow-flow region (dead zone) in the tundish by F. He et al. [64], the slow-flow region inside the tundish is visualized. The slow-flow regions for each case are shown in Figure 5, where the molten steel flow velocity is ≤0.0025 m/s. The volume and percentage of the slow-flow regions in each case are shown in Figure 6. In the normal symmetric Case 0, the volume of the slow-flow region is 0.878 m3, accounting for 12.2% of the total tundish volume. Under fewer strand casting conditions, all scenarios lead to an expansion of the slow-flow region within the tundish, thereby disrupting the ideal symmetric flow pattern observed in the normal symmetric Case 0. In the asymmetric Cases 1 to 6, the volume of the slow-flow region gradually increases from 1.135 m3 to 1.731 m3, with the percentage of the total tundish volume rising from 15.76% to 24.04%. According to the flow streamlines in the tundish shown in Figure 3, strands 1 to 4 are located within the main flow region of the tundish. Therefore, closing strands 1 and 2 or strands 3 and 4 has a similar effect on the volume of the slow-flow region. As a result, the differences in the slow-flow region volume between Case 1 and Case 2, as well as between Case 3 and Case 4, are minimal. In the asymmetric Cases 5 and 6, the slow-flow region occupies more than 20% of the tundish volume, making these conditions more detrimental to the molten steel flow compared to other cases. In the asymmetric Case 7, the volume of the slow-flow region is 1.398 m3, accounting for 19.42% of the total tundish volume.
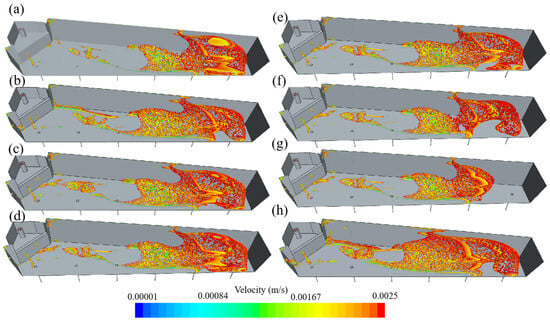
Figure 5.
Slow-flow regions in the tundish for each case. (a) Case 0; (b–g) Cases 1–6; (h) Case 7.
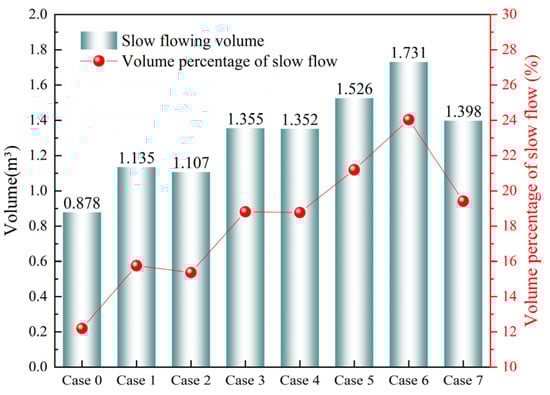
Figure 6.
Slow-flow volume and percentage in the tundish for each case.
3.2.3. Residence Time Distribution (RTD) Curves for Each Case Under Fewer Strands Operation
The RTD curves for each strand provide further insights into the fluidity and consistency of the tundish. This study systematically investigates the influence of different strand closures on the tundish flow field by comparing the normal symmetric Case 0 (all strands open) with the asymmetric fewer strand operation cases (Cases 1–7). The RTD curves of different strands under each case are presented in Figure 7, Figure 8, Figure 9, Figure 10, Figure 11, Figure 12, Figure 13 and Figure 14. The flow characteristic parameters for each strand, calculated based on the RTD curves, are summarized in Table 3 for clarity.
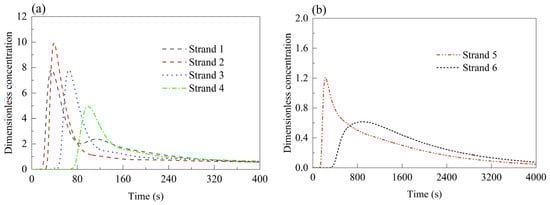
Figure 7.
RTD curves of each strand in Case 0 (all strands open). (a) Strands 1–4; (b) strands 5 and 6.
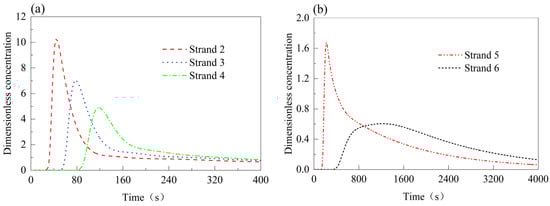
Figure 8.
RTD curves of each strand in Case 1 (strand 1 closed). (a) Strands 2–4; (b) strands 5 and 6.
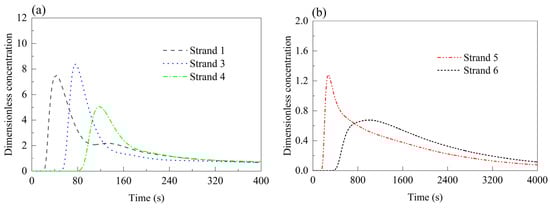
Figure 9.
RTD curves of each strand in Case 2 (strand 2 closed). (a) Strands 1, 3, and 4; (b) strands 5 and 6.
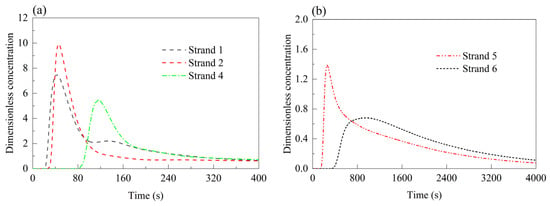
Figure 10.
RTD curves of each strand in Case 3 (strand 3 closed). (a) Strands 1, 2, and 4; (b) strands 5 and 6.
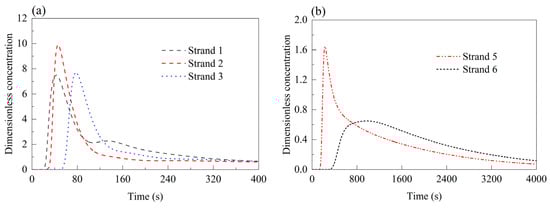
Figure 11.
RTD curves of each strand in Case 4 (strand 4 closed). (a) Strands 1, 2, and 3; (b) strands 5 and 6.
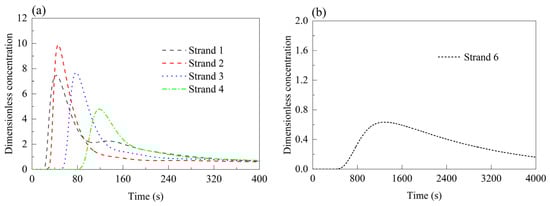
Figure 12.
RTD curves of each strand in Case 5 (strand 5 closed). (a) Strands 1–4; (b) strand 6.
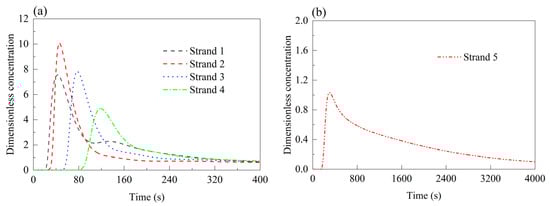
Figure 13.
RTD curves of each strand in Case 6 (strand 6 closed). (a) Strands 1–4; (b) strand 5.
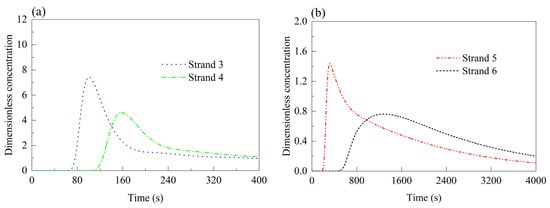
Figure 14.
RTD curves of each strand in Case 7 (strands 1 and 2 closed). (a) Strands 3 and 4; (b) strands 5 and 6.
Table 3.
Flow characteristic parameters of each case.
In the normal symmetric Case 0 (Figure 7), the minimum response times of strand 1 to strand 6 are 16.7 s, 23.3 s, 43.0 s, 68.3 s, 130 s, and 339.5 s, respectively. The peak times follow a similar increasing trend, recorded as 34.7 s, 39.0 s, 65.1 s, 98.8 s, 226.7 s, and 888.8 s. The peak concentration reaches its maximum at strand 2 (9.93), with strand 1 at 7.85, and then decreases gradually to 0.62 at strand 6. The average residence times increase steadily from 200.4 s (strand 1) to 1063.9 s (strand 6). The tundish forms a biased flow casting pattern, with the impact zone equipped with a triangle-like impact pad. As a result, molten steel flows directly toward the area near strand 2 through the open section of the impact pad, leading to the highest peak concentration at strand 2.
In the asymmetric Case 1 (Figure 8), strands 2–4 exhibit slightly longer response and peak times compared to the normal symmetric Case 0, while their peak concentrations decline. Strand 5 shows an earlier peak time than in the normal symmetric Case 0, with a higher peak concentration of 1.68, indicating enhanced fluidity. For strand 6, the peak time extends significantly to 1177.5 s, and the average residence times at strands 5 and 6 increase by approximately 315 s and 250 s, reaching 971.5 s and 1314.3 s, respectively.
Under the asymmetric Case 2 (Figure 9), the flow patterns of strands 1, 3, and 4 remain similar to the asymmetric Case 1, with a slight increase in peak concentration at strand 3. Strand 5, however, experiences an increase in response time to 154.8 s and a sharp rise in peak concentration time to 272.9 s, while its peak concentration drops to 1.28. A sharply rising and falling RTD curve indicates a short-circuit flow at the outlet, while a gradually increasing (sinusoidal) RTD curve suggests slow flow from the outlet. The delayed peak concentration time and the reduced peak concentration at strand 5 indicate a decrease in molten steel flow velocity. These flow characteristics demonstrate that the closure of strand 2 in Case 2 has an adverse effect on strand 5. At strand 6, the peak time decreases slightly to 958.5 s compared to the asymmetric Case 1, and its average residence time increases by 280 s relative to the normal symmetric Case 0.
In the asymmetric Cases 3 and 4 (Figure 10 and Figure 11), the minimum response times of strands 1–5 are consistently extended. The minimum response time at strand 6 is 368.5 s in the asymmetric Case 3—29 s longer than in the normal symmetric Case 0—and 338.5 s in Case 4, slightly shorter than in the normal symmetric Case 0. Peak concentration times at strands 5 and 6 are 258.2 s and 909.8 s in Case 3, and 230.6 s and 947.3 s in the asymmetric Case 4. The peak concentration at strand 5 increases to 1.39 and 1.64 in the asymmetric Cases 3 and 4, respectively, while strand 4 reaches 5.47 in the asymmetric Case 3. Other strands show peak concentrations comparable to the normal symmetric Case 0. Overall, the average residence times in these two cases are notably higher than in the normal symmetric Case 0.
The asymmetric Cases 5 and 6 (Figure 12 and Figure 13) exhibit nearly identical trends. The minimum response times of strands 1–4 range from 20 s to 80 s, and their peak concentration times fall within 40 s to 120 s—both metrics slightly extended from the normal symmetric Case 0. Peak concentrations at strands 1–4 remain similar to those in the normal symmetric Case 0, with strand 2 registering the highest values: 9.91 in the asymmetric Case 5 and 10.02 in the asymmetric Case 6. In Case 5, the minimum response time and peak time at strand 6 are 484.9 s and 1246 s—up by 148.4 s and 357.2 s compared to the normal symmetric Case 0. In the asymmetric Case 6, strand 5 shows response and peak times of 158 s and 298 s, respectively, rising by 28 s and 71.3 s. These observations suggest that closing strands 5 and 6 exerts minimal influence on strands 1–4 but significantly affects flow behavior at the closed or adjacent strands.
Finally, the asymmetric Case 7 (Figure 14) reveals that the minimum response times for strands 4–6 are 64.4 s, 105.2 s, 191.4 s, and 503 s, while their peak concentration times are extended to 100.9 s, 157.9 s, 320 s, and 1245.9 s, respectively. Notably, the peak concentrations at strands 5 and 6 increase to 1.44 and 0.76 compared to the normal symmetric Case 0, indicating altered flow patterns under this closure configuration.
J. Zhang et al. [65] focused only on the flow field and flow behavior under fewer strand casting conditions, which aligns with the perspective of this study. However, they did not investigate the temperature field or the transition billet length under such conditions. This work builds on their findings and extends the analysis to these aspects, contributing to the novelty of the study.
3.3. Temperature Variations in Different Cases of Fewer Strand Casting
When casting a new heat in the tundish, the temperature of the new heat is often higher than that of the present heat in the tundish. When the higher-temperature new heat is cast into the lower-temperature present heat in the tundish, the temperature fields of the tundish under different cases are shown in Figure 15. As shown in Figure 15a, at 120 s after casting the new heat, the impact zone of the tundish and the surface near strand 1 exhibit higher temperatures, ranging from 1797 K to 1820 K. Strands 2–4 are in the temperature transition zone, with a free surface temperature between 1701 K and 1773 K. Strands 5 and 6 experience severe temperature drops on the free surface, forming a low-temperature region. In the asymmetric Case 2, the low-temperature region near strands 5 and 6 is significantly reduced compared to the normal symmetric Case 0. In Case 6, the low-temperature region near strands 5 and 6 tends to expand. In Case 7, after closing strands 1 and 2, the free surface temperature near strands 5 and 6 in the far-flow region is higher than in other cases. At 30 min of casting, as shown in Figure 15b, the overall tundish temperature increases, ranging from 1773 K to 1844 K from the far-flow region to the tundish impact zone, with the impact zone temperature nearly reaching the new heat temperature. In the normal symmetric Case 0, the high-temperature region is significantly larger than in other asymmetric cases. In the asymmetric Case 6, there is still a low-temperature region near the edge strands 5 and 6.
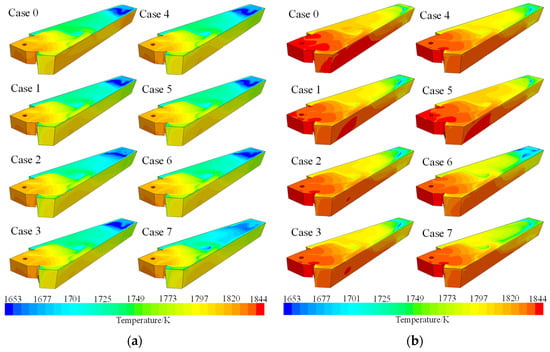
Figure 15.
Tundish temperature distribution. (a) Casting for 2 min; (b) casting for 30 min.
When the higher-temperature new heat is cast into the tundish containing the lower-temperature present heat, the outlet temperature variation curves of the tundish for each case are shown in Figure 16. As shown in Figure 16, in the normal symmetric Case 0, the time at which the temperature starts to rise gradually increases from strand 1 to strand 6. The temperature rise at strand 1 is the most significant, while the temperature curves for strands 2–4 are nearly identical. The temperature rise at strands 5 and 6 is relatively slow. The trends of temperature variation in fewer strand casting cases (Cases 1–7) are generally consistent with Case 0, except that the temperature rise at strand 6 in Case 5 is significantly lower than in other cases.
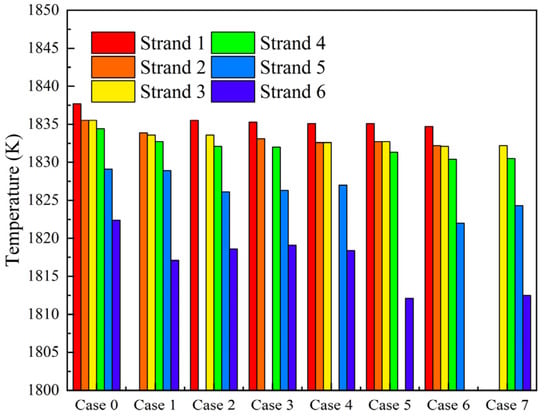
Figure 16.
Temperatures at different strands for each case at 1800 s of casting.
As shown in Figure 16, at 1800 s of casting in Case 0, the temperatures at strands 1–6 are 1837.7 K, 1835.5 K, 1835.5 K, 1834.4 K, 1829.1 K, and 1822.4 K, respectively, with a temperature difference of 15.3 K between strand 1 and strand 6. In the asymmetric Case 1, the temperatures at strands 2–4 are 1833.9 K, 1833.6 K, and 1832.7 K, respectively, which are 1.6–1.9 K lower than those in the normal symmetric Case 0. The temperature at strand 5 is 1828.9 K, nearly identical to the normal symmetric Case 0, while the temperature at strand 6 is 1817.1 K, showing a significant decrease of 5.3 K compared to the normal symmetric Case 0. In the asymmetric Cases 2–4, the temperatures at all strands are lower than in the normal symmetric Case 0, with strands 1–5 decreasing by 2–3 K and strand 6 decreasing by 3–4 K. In the asymmetric Cases 5 and 6, the temperatures at strands 1–4 are 2–4 K lower than in the normal symmetric Case 0, while the temperatures at strand 6 in the asymmetric Case 5 and strand 5 in the asymmetric Case 6 decrease by 10.3 K and 7.1 K, respectively. Closing strands 5 and 6 significantly reduces their corresponding temperatures. In the asymmetric Case 7, the temperatures at strands 3–4 decrease by 3–5 K compared to the normal symmetric Case 0, and the temperature at strand 6 decreases by 9.9 K.
Under normal symmetric casting conditions (Case 0), the molten steel temperature shows a decreasing trend from strand 1 to strand 6, indicating that the high-temperature new steel preferentially flows toward strand 1 near the inlet, while strand 6, located farther away, experiences a delayed temperature rise. This suggests significant flow non-uniformity within the tundish. Under asymmetric casting conditions (Cases 1–7), the temperature at each strand decreases compared to the normal casting case, with varying degrees of reduction. Overall, the temperature drop caused by fewer strand casting is closely related to the position of the strand.
3.4. Transition Billet Calculation Results
In the process of grade transition casting, the variation curves of the new heat concentration difference ratio over time for each case, along with the grade transition criteria (0.2–0.8) boundaries, are shown in Figure 17. Overall, the concentration difference ratio of the new heat over time exhibits a rapid change at strand 1, reaching the grade transition boundary first. The curves for strands 2 to 4 show a relatively consistent growth trend, whereas strands 5 and 6 display significant differences, with a noticeable delay in growth. Strand 6, in particular, shows a greater lag compared to strand 5.
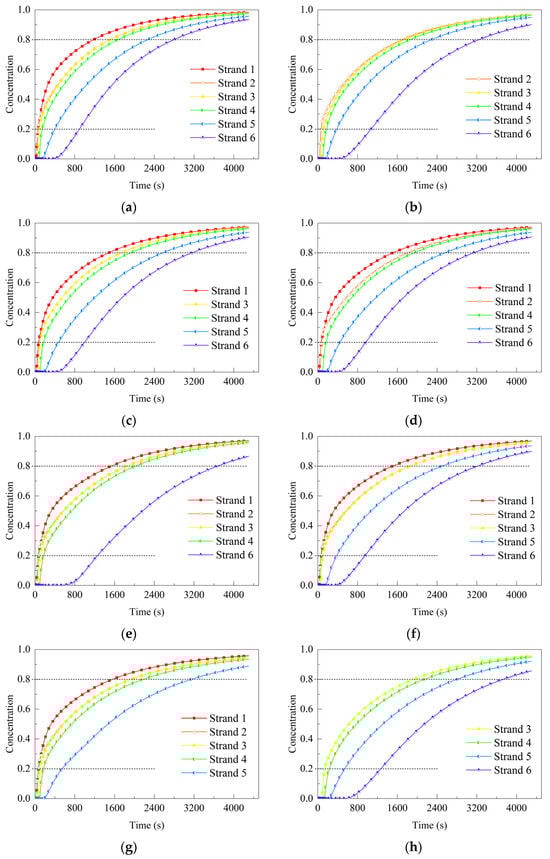
Figure 17.
Concentration variation curves over time for each case: (a) Case 0; (b–g) Cases 1–6; (h) Case 7.
The starting positions of the transition billets for different strands (with ω = 20%), representing the length conforming to the present heat, are shown in Figure 18, with detailed data in Table 4. Overall, whether in the normal symmetric state or the asymmetric state, strands 1–4 exhibit shorter billet lengths conforming to the present heat, all less than 10 m. In contrast, strands 5 and 6 have significantly longer billet lengths conforming to the present heat, with strand 5 around 20 m and strand 6 exceeding 35 m. For strand 1, the normal symmetric Case 0 has the shortest billet length conforming to the present heat at 2.82 m, while the asymmetric Cases 2–6 show similar lengths of around 2.88–2.89 m. For strand 2, the billet lengths are relatively close across all cases, ranging from 2.71 m to 2.79 m. Across all cases, strands 1 and 2 exhibit nearly identical billet lengths, with strand 2 being slightly shorter. For strand 3, the billet length conforming to the present heat increases to around 4 m, with the asymmetric Case 2 being the shortest at 4.02 m. Strand 4 sees a further increase to approximately 6–7 m, with the normal symmetric Case 0 being the shortest at 5.29 m. Strand 5 shows a significant increase in billet length compared to strands 1–4, with the shortest being the asymmetric Case 1 (14.82 m) and the longest being the asymmetric Case 6 (21.89 m). Strand 6 has the longest billet length conforming to the present heat, with Case 0 at 41.69 m. Cases 2, 3, and 4 have noticeably shorter lengths at 37.57 m and 37.71 m. The asymmetric Case 5 exhibits a substantial increase compared to the normal symmetric Case 0, reaching 49.47 m. This indicates that during grade transition casting, closing strands 2–4 reduces the billet length conforming to the present heat for strand 6, whereas closing strand 5 significantly increases it.
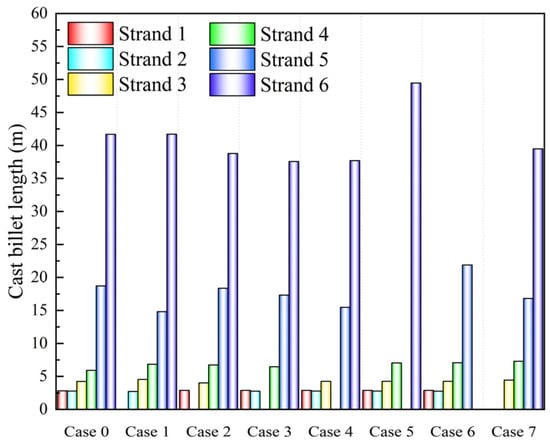
Figure 18.
Transition billet starting positions for each case (ω = 20%).
Table 4.
Transition billet starting positions (m) for each case.
In actual production, a steel plant designates the first 30 m of each strand’s billet during grade transition casting as belonging to the present heat. However, based on the computational results, the billet lengths for strands 1–5 at the 20% concentration difference threshold are significantly shorter than 30 m, whereas strand 6 exceeds 30 m. This suggests that using a uniform 30 m criterion is unreasonable. From the analysis above, different criteria should be applied to different strands: 3 m for strands 1 and 2, 5 m for strand 3, 8 m for strand 4, 22 m for strand 5, and 50 m for strand 6. Additionally, adjustments should be made according to different low-flow operation cases.
The transition billet lengths for different strands in each case (ω = 20–80%) are shown in Figure 19, and the specific data are provided in Table 5. The average transition billet lengths for each case are shown in Figure 20. In the normal symmetric Case 0, the transition billet length for strand 1 is 52.13 m, and the lengths for strands 2, 3, and 4 are between 66–72 m, while the lengths for strands 5 and 6 are close to 88 m, with an average transition billet length of 72.41 m. Overall, the transition billets for strands 5 and 6 are too long. In the asymmetric Case 1, the transition billet lengths for strands 2, 3, and 4 range from 63 to 65 m, while the lengths for strands 5 and 6 are 74.16 m and 84.41 m, respectively, with an average transition billet length of 70.16 m. Compared to the normal symmetric Case 0, the transition billet length for strand 5 is reduced by 13.01 m. In the asymmetric Case 2, the transition billet length for strand 1 is 54.60 m, which is an increase of 2.47 m compared to the normal symmetric Case 0. The lengths for strands 3 and 4 are reduced by 2.96 m and 4.0 m, respectively. The length for strand 5 is lower than in the normal symmetric Case 0 but increased by 7.47 m compared to the asymmetric Case 1. The average transition billet length between the strands in the asymmetric Case 2 is 70.30 m, slightly higher than in the asymmetric Case 1. In the asymmetric Case 3, the transition billet length for strand 1 is 55.89 m, which is an increase of 3.76 m compared to the normal symmetric Case 0. In addition, the transition billet lengths for strands 2 to 6 are all smaller than in the normal symmetric Case 0, with reductions ranging from 0.56 m to 5.21 m. The average transition billet length for all strands in the asymmetric Case 3 is 71.68 m.
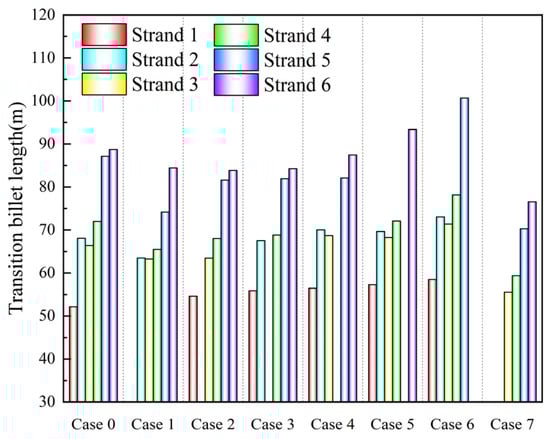
Figure 19.
Transition billet lengths (m) for each case.
Table 5.
Transition billet lengths and average lengths (m) for each case.
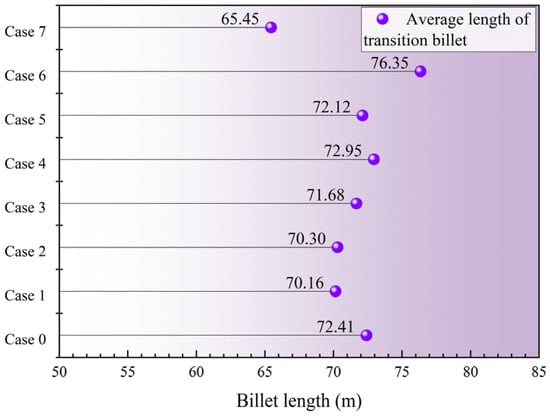
Figure 20.
Average length of transition billet for each case.
The calculation results show that fewer strands by closing strands 1 to 3 help to some extent in reducing the transition billet length. This is because by closing the upstream strands (strands 1 to 3), the rapid outflow of new heat from these strands is avoided, allowing for the concentration of new heat to be transferred more effectively to the downstream strands (strands 4 to 6), thus increasing the growth of molten steel concentration at these strands.
In the asymmetric Case 4, the transition billet lengths for strands 1 to 3 are 56.45 m, 70.03 m, and 68.69 m, respectively, all of which are longer than in the normal symmetric Case 0, with increases ranging from 2 to 4 m. The transition billet lengths for strands 5 and 6 are 82.13 m and 87.47 m, respectively, which are shorter than in the normal symmetric Case 0, with reductions of 5.04 m and 1.23 m. The average transition billet length for all strands in the asymmetric Case 4 is 72.95 m. In the asymmetric Case 5, compared to the normal symmetric Case 0, the transition billet lengths for all strands are longer. Specifically, the lengths for strands 1 and 6 are 57.25 m and 93.37 m, respectively, which represent increases of 5.12 m and 4.67 m compared to the normal symmetric Case 0. The increase for strands 2 to 4 is smaller. The average transition billet length for all strands in the asymmetric Case 5 is 72.12 m. In the asymmetric Case 6, compared to the normal symmetric Case 0, the average transition billet lengths for all strands have significantly increased. The lengths for strands 1 to 4 are 58.48 m, 73.02 m, 71.42 m, and 78.14 m, respectively, with increases from 5 to 6 m compared to strand 1. Notably, the transition billet length for strand 5 is 100.69 m, which is an increase of 13.52 m compared to strand 1. The average transition billet length for all strands in the asymmetric Case 6 is 76.35 m. The fewer strands operation that closes strands 4 to 6 increases the transition billet lengths for other strands. This is because, compared to the inlet area, the downstream strands (strands 4 to 6) are farther away, and closing these strands reduces the overall molten steel flow velocity, increasing the slow-flow volume, as shown in Figure 19. Therefore, the case that closes strands 4 to 6 is not beneficial for reducing transition billet lengths, with the asymmetric Case 6 showing a significant increase in transition billet length.
In the asymmetric Case 7, the transition billet lengths for strands 2 to 6 are 55.55 m, 59.38 m, 70.29 m, and 76.59 m, respectively, all of which are reduced by 10–16 m compared to the normal symmetric Case 0. The average transition billet length for the asymmetric Case 7 is 64.45 m, which is significantly lower than that of the normal symmetric Case 0 and the single-strand closing the asymmetric Cases 1 to 6.
Regarding the endpoint of the transition billet, the company determines the endpoint of the transition billet when 100 t of new heat is casting, as shown in Figure 21, which depicts the concentration difference ratio at the tundish exit for different strands when casting 100 t in each case. Specific values are provided in Table 6. Overall, when casting 100 t, the concentration difference ratio for strands 1–6 shows a gradual decrease across all cases, and none of them reach the determination standard of 80%. In the normal symmetric Case 0, the concentration difference ratio for strand 1 is 79.16%, which is the closest to 80%; the concentration difference ratio for strands 2 and 3 is around 70%; while the concentration difference ratios for strands 5 and 6 are significantly lower, at 52.81% and 31.69%, respectively, clearly not meeting the 80% standard. In the asymmetric Case 1, the concentration difference ratios for strands 2–4 are all above 70%, and the ratio for strand 5 increases compared to the normal symmetric Case 0 to 61.3%, while strand 6 is at 31.7%. In the normal symmetric Case 2, the concentration difference ratios for all strands are basically the same as in the normal symmetric Case 0, with the ratio for strand 6 increasing to 35.44%, but still far from the 80% standard. In the asymmetric Case 3, the concentration difference ratio for strand 1 is 77.56%, slightly lower than in the normal symmetric Case 0, but the ratios for the other strands have increased, with the ratio for strand 6 reaching 36.77%. In the asymmetric Case 4, the concentration difference ratios for strands 1–3 are 77.43%, 71.35%, and 71.28%, slightly lower than in the normal symmetric Case 0, while the ratios for strands 5 and 6 are 57.81% and 35.87%, respectively, showing increases of 5% and 4.18% compared to the normal symmetric Case 0. The operation of closing strands 1–4 in the asymmetric Cases 1–4 can promote the concentration difference ratios for the downstream strands 5 and 6, increasing their concentration difference ratios. In the asymmetric Cases 5 and 6, compared to the normal symmetric Case 0, the concentration difference ratios for all strands have decreased, especially for strand 6 in the asymmetric Case 5, which is at 23.17%, and for strand 6 in the asymmetric Case 6, which is at 46.17%. This significant decrease indicates that closing the downstream strands 5 and 6 has a negative impact on the molten steel flow.
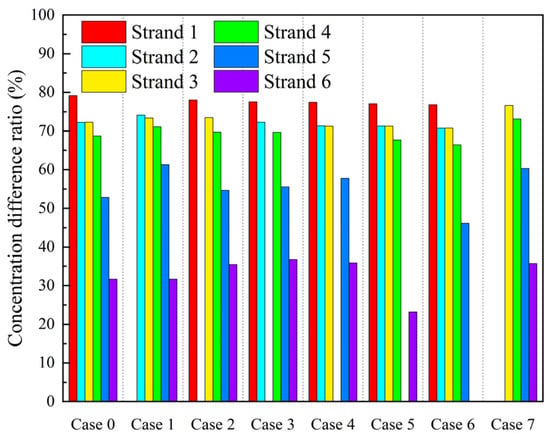
Figure 21.
Concentration difference ratio for casting 100 t.
Table 6.
Concentration for each strand when casting 100 t.
In the asymmetric Case 7, the concentration difference ratios for strands 4–6 are 76.59%, 73.11%, 60.31%, and 35.68%, respectively, which are all higher compared to other cases, but still fall short of 80%.
When the concentration difference ratio for each strand reaches 80%, the amount of steel casting is shown in Figure 22, with specific values provided in Table 7. In the normal symmetric Case 0, strand 1 reaches an 80% concentration difference ratio when casting 104.152 t of new heat, which marks the endpoint of mixed pouring for grade transition casting. Strands 2–4 require casting 134.244 t, 133.925 t, and 147.715 t, respectively, to reach the 80% concentration difference ratio. Given that the steel ladle capacity is 150 t, strands 2–4 can only meet the standard for the new steel grade after casting one full ladle of steel. For strands 5 and 6, 200.698 t and 247.135 t of new heat are required, far exceeding the capacity of a single ladle.
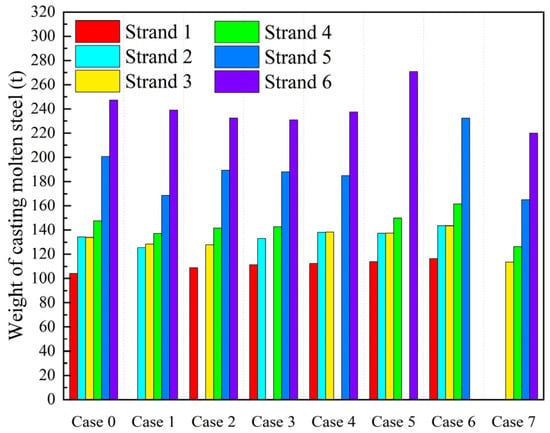
Figure 22.
Weight of casting molten steel when the concentration difference ratio reaches 80%.
Table 7.
Weight of casting molten steel when the concentration difference ratio reaches 80%.
In the asymmetric Case 1, strands 2–4 reach the next steel grade standard when casting 125.454 t, 128.477 t, and 137.101 t, respectively, while strands 5 and 6 need 168.648 t and 239.042 t of new heat. Compared to the normal symmetric Case 0, the required casting weight for each strand in the asymmetric Case 1 is reduced, with strand 5 showing a significant reduction of 32.05 t. In the asymmetric Case 2, strand 1 requires casting 108.951 t of new heat, which is an increase of 4.499 t compared to strand 1 in the normal symmetric Case 0. Strands 3–6 require casting 127.887 t, 141.671 t, 189.508 t, and 232.408 t, respectively. Compared to the normal symmetric Case 0, the casting weight for strands 3–6 is reduced by 6–14 t. In the asymmetric Case 3, compared to the normal symmetric Case 0, the casting weight for all strands except strand 1 is reduced, with strands 5 and 6 showing significant reductions of 15.516 t and 16.275 t, respectively. In the asymmetric Case 4, the required casting weights for strands 1–3 are 112.468 t, 137.987 t, and 138.282 t, which are increases of 3–8 t compared to the normal symmetric Case 0. The required casting weights for strands 5 and 6 are 185.014 t and 237.274 t, which are reductions of 15.684 t and 9.861 t, respectively, compared to the normal symmetric Case 0. In the asymmetric Cases 5 and 6, compared to the normal symmetric Case 0, the required casting weight for all strands increases. In the asymmetric Case 5, strands 1–4 require 2–10 t more, and strand 6 requires 270.739 t, which is an increase of 23.6 t. In Case 6, strands 1–4 require 9–14 t more, and strand 5 requires 232.334 t, an increase of approximately 31.6 t.
In Case 7, compared to the normal symmetric Case 0 and the single-strand closing cases (Cases 1–6), the required casting weight for all strands significantly decreases. For strands 3–6, the required casting weights are 113.690 t, 126.368 t, 165.110 t, and 220.010 t, respectively. Compared to the normal symmetric Case 0, the required casting weights for strands 3–6 are reduced by 20.235 t, 21.347 t, 35.588 t, and 27.125 t, respectively.
Overall, the weight of casting molten steel required to reach a concentration difference ratio of 80% for different strands in each case exceeds 100 t, and even surpasses 200 t (for strands 5 and 6). Therefore, using 100 t of casting as the endpoint criterion for the grade transition casting process is insufficient. A new determination basis should be established for each strand. According to calculations, in the asymmetric Cases 1–3, strand 1 can meet the new steel grade requirements with around 110 t of casting, strand 2 and strand 3 can meet the new steel grade requirements with 125 t–135 t, and strand 4 can meet the new steel grade requirements with 137 t–147 t. However, strands 5 and 6 cannot meet the new steel grade determination standard within the 150 t capacity of a single ladle. Strands 5 and 6 will need 168 t–200 t and 230 t–250 t of casting molten steel, respectively, to meet the new steel grade requirements. At the same time, in the low-flow operation process, it is advisable to avoid using the asymmetric Cases 5 and 6, which close strands 5 and 6. For low-flow operations, a single-strand closure can involve strand 1 or strand 2. In the asymmetric Case 7, closing two strands (strands 1 and 2) can significantly reduce the length of the mixed billet during the grade transition casting process and reduce the amount of new steel required for the new steel grade conversion in the next steel pour.
4. Conclusions
- (1)
- In Cases 1–6, the volume of the slow-flow region in the tundish gradually increases from 1.135 m3 to 1.731 m3. In Case 7, the slow-flow region volume is 1.398 m3. The fewer strand casting operations disrupt the symmetric flow pattern observed in the baseline Case 0, thereby enlarging the slow-flow region in the tundish.
- (2)
- Cases 5 and 6 have minimal impact on the minimum response time, peak concentration time, and peak concentration at strands 1–4. However, they exert significantly negative effects on strands 5 and 6, indicating impaired consistency in steel flow.
- (3)
- At 2 min, both symmetric and asymmetric cases show a sharp surface temperature drop near strands 5 and 6. By 30 min, the tundish temperature rises from the far end to the impact zone (1773–1844 K), aligning with the new steel temperature at the impact zone. In asymmetric Case 6, low-temperature zones near strands 5 and 6 remain. Fewer strand operations disrupt the temperature seen in symmetric Case 0, with strand 6 in Case 5 showing a notably slower temperature rise.
- (4)
- In Cases 1–3, the closure of near strands (1–3) prevents the premature outflow of new steel, allowing its concentration to be more effectively transferred to the far strands (4–6), thereby enhancing the new steel concentration at those locations. As a result, these cases contribute to reducing the transition billet length to some extent. However, they also significantly enlarge the slow-flow region, which in turn prolongs the transition billet.
- (5)
- Considering flow behavior, temperature distribution, and transition billet length comprehensively, Case 1 is recommended under fewer strand casting conditions. In contrast, Cases 5 and 6 should be avoided due to their adverse impacts.
Author Contributions
Conceptualization, C.C. and W.L.; methodology, C.C., Z.R. and J.S.; software, Z.R., J.S. and T.W.; validation, H.W. and M.G.; formal analysis, Z.R., J.S., Z.G. and H.W.; investigation, Z.R., J.S. and C.C.; resources, J.W. and Y.S.; data curation, Z.R., J.S., Z.G. and M.G.; writing—original draft preparation, Z.R., J.S. and T.W.; writing—review and editing, C.C., J.W. and Y.S.; visualization, M.G., T.W., H.W. and Z.G.; supervision, W.L. and J.W.; project administration, W.L. and Y.S.; funding acquisition, C.C. All authors have read and agreed to the published version of the manuscript.
Funding
The authors are grateful to the financial support of the Applied Fundamental Research Programs of Shanxi Province (202403021222046), and Graduate Innovation Project of Shanxi Province (2024KY277).
Data Availability Statement
Data are contained within the article.
Conflicts of Interest
The authors declare no conflicts of interest.
References
- Heaslip, L.J.; Mclean, A. Tundish metallurgy-considerations pertaining to tundish performance and metallurgical treatment during continuous casting. In Proceedings of the 39th Electric Furnace Conference, Houston, TX, USA, 8–11 December 1981. [Google Scholar]
- Szekely, J.; Ilegbusi, O.J. The Physical and Mathematical Modeling of Tundish Operations; Springer: New York, NY, USA, 1989; pp. 34–52. [Google Scholar]
- Sahai, Y. Tundish Technology for Clean Steel Production; World Scientific Publisher: Singapore, 2007; pp. 8–12. [Google Scholar]
- Geng, M.J.; Wang, T.Y.; Chen, C. Assessment of the volume effect and application of an improved tracer in physical model of a single-strand bare tundish. Metall. Mater. Trans. B 2024, 55, 4121–4131. [Google Scholar] [CrossRef]
- Ding, C.Y.; Lei, H.; Zhang, H.; Xiao, Y.Y.; Zhao, Y.; Zou, Z.S. New understanding on relationship between rtd curve and inclusion behavior in the tundish. Metall. Mater. Trans. B 2024, 55, 2224–2239. [Google Scholar] [CrossRef]
- Lv, A.; Ding, G.Q.; Luo, X.D. Influence of elevation angle of tundish filter on removal rate of impurity in molten steel. Sci. Rep. 2025, 15, 782. [Google Scholar] [CrossRef] [PubMed]
- Chen, C.; Cheng, G.G.; Yang, H.K.; Hou, Z.B. Physical modeling of fluid flow characteristics in a delta shaped, four-strand continuous casting tundish with different flow control devices. Adv. Mater. Res. 2011, 284, 1071–1079. [Google Scholar] [CrossRef]
- Li, Q.H.; Qin, B.M.; Zhang, J.S.; Dong, H.B.; Li, M.; Tao, B.; Mao, X.P.; Liu, Q. Design improvement of four-strand continuous-casting tundish using physical and numerical simulation. Materials 2023, 16, 849. [Google Scholar] [CrossRef] [PubMed]
- Wang, J.H.; Fang, Q.; Huang, L.; Zhao, P.; Xie, X.Q.; Zhang, H. Three-phase flow in a single-strand tundish during start-up operation using top-swirling turbulence inhibitor. Metall. Mater. Trans. B 2023, 54, 635–649. [Google Scholar] [CrossRef]
- Chen, X.Q.; Bai, Y.; Feng, W.W.; Xiao, H.; Tang, H.Y.; Wang, P.; Zhang, J.Q. Structural optimisation of three-strand asymmetric tundish for super large round bloom continuous casting. Ironmak. Steelmak. 2024, 51, 441–459. [Google Scholar] [CrossRef]
- Qin, X.F.; Cheng, C.G.; Li, Y.; Wu, W.L.; Chen, H.; Zhao, C.F.; Jin, Y. Numerical simulation on gas–liquid multiphase flow behavior under coupling effects of annular gas curtain and swirling flow at tundish upper nozzle. J. Iron Steel Res. Int. 2024, 31, 2693–2709. [Google Scholar] [CrossRef]
- Li, Y.; Li, Y.; Cheng, C.G.; Liu, J.G.; Wu, W.L.; Chen, D.L. Theory of movement behavior of argon bubbles in upper nozzle of tundish during argon blowing process. Metall. Mater. Trans. B 2023, 54, 3568–3578. [Google Scholar] [CrossRef]
- Qin, B.M.; Zhang, J.S.; Yang, C.H.; Yang, S.F.; Liu, Q. Study on influencing factors and their combined effects on multiphase behavior in tundish pouring zone. Metall. Mater. Trans. B 2025, 56, 1176–1191. [Google Scholar] [CrossRef]
- Wang, T.Y.; Wang, J.; Chen, C.; Chen, L.; Geng, M.J.; Song, J.T.; Fan, J.P.; Lin, W.M. Physical and numerical study on right side and front side gas blowing at walls in a single-strand tundish. Steel Res. Int. 2024, 95, 2400037. [Google Scholar] [CrossRef]
- Chang, S.; Song, H.; Liu, Z.; Zou, Z.S.; Shao, L.; Li, B.K. Experimental study on bubble entrainment by a free fall jet in an argon-filled continuous casting tundish. Steel Res. Int. 2022, 94, 2200287. [Google Scholar] [CrossRef]
- Zhang, J.S.; Qin, B.M.; Liu, Y.H.; Li, Q.H.; Zuo, X.T.; Wang, C.; Yang, S.F.; Liu, Q. Multiphase flow inside a four-strand continuous casting tundish using three types of ladle shrouds. J. Iron Steel Res. Int. 2023, 30, 1171–1181. [Google Scholar] [CrossRef]
- Wu, D.; Liu, J.D.; Wu, D.L.; Zhou, P. A computational fluid dynamics and support vector regression combined method for predicting the flow performance of the five-strand tundish. Steel Res. Int. 2024, 95, 2400231. [Google Scholar] [CrossRef]
- Merten, D.C.; Hütt, M.T.; Uygun, Y. Effect of slab width on choice of appropriate casting speed in steel production. J. Iron Steel Res. Int. 2022, 29, 71–79. [Google Scholar] [CrossRef]
- Yue, Q.; Li, Y.; Wang, Z.M.; Sun, B.C.; Wang, X.Z. Analysis model of internal residence time distribution for fluid flow in a multi-strand continuous casting tundish. J. Iron Steel Res. Int. 2024, 31, 2186–2195. [Google Scholar] [CrossRef]
- Li, Y.H.; Hu, X.; Wang, L.Y.; Zhang, H.X.; He, Y.B.; Zhang, W.J.; Hua, C.J. Numerical and experimental studies on the effects of molten steel viscosity on fluid flow, inclusion motion, and temperature distribution in a tundish. Phys. Fluids 2024, 36, 073102. [Google Scholar] [CrossRef]
- Zhang, Z.X.; Qu, T.P.; Wang, D.Y.; Li, X.L.; Fan, L.; Zhou, X.Z. Non-uniform thermal transfer of molten steel and its effect on inclusion particles removal behavior in continuous casting tundish. Metals 2025, 15, 170. [Google Scholar] [CrossRef]
- Yao, C.; Wang, M.; Zhu, H.H.; Xing, L.D.; Bao, Y.P. Mathematical study of realistic removal rates of non-metallic inclusions in continuous casting tundish using optimized criterion. Metall. Mater. Trans. B 2023, 54, 1144–1158. [Google Scholar] [CrossRef]
- Quan, Q.; Zhang, Z.X.; Qu, T.P.; Li, X.L.; Tian, J.; Wang, D.Y. Physical and numerical investigation on fluid flow and inclusion removal behavior in a single-strand tundish. J. Iron Steel Res. Int. 2023, 30, 1182–1198. [Google Scholar] [CrossRef]
- Sun, Y.P.; Duan, H.J.; Zhang, L.F. A boundary layer model for capture of inclusions by steel–slag interface in a turbulent flow. J. Iron Steel Res. Int. 2023, 30, 1101–1108. [Google Scholar] [CrossRef]
- Xie, Q.H.; Ni, P.Y.; Li, Y. A model study on collision-coalescence, transport, and removal behavior of non-metallic inclusions in a single-strand tundish. Metall. Mater. Trans. B 2024, 55, 2783–2804. [Google Scholar] [CrossRef]
- Liu, Z.Q.; Yao, Y.C.; Wang, N.; Yang, J.; Xu, G.D.; Li, B.K. Physical and numerical simulations on the unsteady three-phase flow in a continuous casting tundish during ladle changeover process. Metall. Mater. Trans. B 2025, 56, 1982–1993. [Google Scholar] [CrossRef]
- Song, J.T.; Chen, C.; Guo, Z.J.; Geng, M.J.; Rong, Z.R.; Wang, T.Y.; Wang, J.; E, D.Y.; Fan, J.P.; Sun, Y.H. Analysis of flow field, temperature, and inclusion evolution in a 12-strand tundish during ladle changeover process. Metall. Mater. Trans. B 2025, 56, 2700–2714. [Google Scholar] [CrossRef]
- Chen, H.L.; Liu, Z.T.; Li, F.C.; Lyu, B.; Chen, W.; Zhang, L.F. Numerical simulation on multiphase flow and slag entrainment during casting start of a slab continuous casting tundish. Metall. Mater. Trans. B 2023, 54, 2048–2065. [Google Scholar] [CrossRef]
- Wang, J.C.; Liu, Z.T.; Chen, W.; Chen, H.L.; Zhang, L.F. Numerical simulation on the multiphase flow and reoxidation of the molten steel in a two-strand tundish during ladle change. Int. J. Miner. Metall. Mater. 2024, 31, 1540–1553. [Google Scholar] [CrossRef]
- Zhao, S.; Lu, Z.Y.; Zhang, Z.; Ma, Z.Y.; Cao, Y.B.; Tang, H.Y. Formation factors of confluence vortex in double nozzle ladle at end of teeming. Iron Steel 2024, 59, 71–79. [Google Scholar] [CrossRef]
- Zhang, J.S.; Yang, S.F.; Chen, Y.F.; Chen, Z.X.; Zhao, J.W.; Li, J.S.; Jiang, Z.Y. Comparison of multiphase flow in a continuous casting tundish using two types of industrialized ladle shrouds. J. Miner. Met. Mater. Soc. 2018, 70, 2886–2892. [Google Scholar] [CrossRef]
- Liu, J.; Zhou, P.; Zuo, X.; Wu, D.; Wu, D. Optimization of the liquid steel flow behavior in the tundish through water model experiment, numerical simulation and industrial trial. Metals 2022, 12, 1480. [Google Scholar] [CrossRef]
- Wu, D.; Wu, D.L.; Liu, B.; Zhou, P.; Liu, J.D. A method of reducing trace deviation of the flow field in the model experiment: An example of a tundish. Metall. Mater. Trans. B 2024, 55, 2515–2524. [Google Scholar] [CrossRef]
- Wang, J.; Liu, W.; Yang, S.; Zuo, X.T.; Zhao, L.; Li, J.S. Effect of tundish impact zone optimization on inclusion removal in steel: Industrial and simulation studies. Metall. Mater. Trans. B 2024, 55, 808–820. [Google Scholar] [CrossRef]
- Wang, X.; Wang, S.; Hu, H.; Xie, X.; Wu, C.; Chen, D.; Long, M. Flow behavior of liquid steel in fewer strands casting of six-strand bloom tundish. Metals 2023, 13, 706. [Google Scholar] [CrossRef]
- Diener, A.; Görl, E.; Pluschkell, W.; Sardemann, K. Vermischungsvorgänge beim stranggießen. Steel Res. 1990, 61, 449–454. [Google Scholar] [CrossRef]
- Bruch, C.; Valentin, P. Mathematical modelling of fluid flow in a continuous casting tundish with regard to extraordinary casting conditions. Steel Res. Int. 2004, 75, 659–665. [Google Scholar] [CrossRef]
- Merder, T. Numerical investigation of the hydrodynamic conditions in a multi-strand CC tundish with closed outlets. Arch. Metall. Mater. 2014, 59, 887–892. [Google Scholar] [CrossRef]
- Braun, A.; Warzecha, M.; Pfeifer, H. Numerical and physical modeling of steel flow in a two-strand tundish for different casting conditions. Metall. Mater. Trans. B 2010, 41, 549–559. [Google Scholar] [CrossRef]
- Mishra, S.K.; Jha, P.K.; Sharma, S.C.; Ajmani, S.K. Effect of blockage of outlet nozzle on fluid flow and heat transfer in continuously cast multistrand billet caster tundish. Can. Metall. Q. 2012, 51, 170–183. [Google Scholar] [CrossRef]
- Zhang, L.F. Fluid flow, heat transfer and inclusion motion in a four-strand billet continuous casting tundish. Steel Res. Int. 2005, 76, 784–796. [Google Scholar] [CrossRef]
- Zhao, P.; Zhang, H.; Fang, Q.; Wang, J.H.; Wu, G.L.; Ni, H.W. Numerical study on strand-blocking operation of a six-strand square billet tundish. J. Iron Steel Res. Int. 2022, 34, 438–450. [Google Scholar] [CrossRef]
- Zhong, L.C.; Wang, M.A.; Chen, B.Y.; Wang, C.R.; Zhu, Y.X. Flow control in six-strand billet continuous casting tundish with different configurations. J. Iron Steel Res. Int. 2010, 17, 7–12. [Google Scholar] [CrossRef]
- Yao, C.; Wang, M.; Pan, M.; Bao, Y.P. Optimization of large capacity six-strand tundish with flow channel for adapting situation of fewer strands casting. J. Iron Steel Res. Int. 2021, 28, 1114–1124. [Google Scholar] [CrossRef]
- Song, J.T.; Luo, Y.Z.; Li, Y.Q.; Guo, Z.J.; Wang, T.Y.; Geng, M.J.; Lin, W.M.; Fan, J.P.; Chen, C. Comparison of fluid flow and tracer dispersion in four-strand tundish under fewer strand casting and sudden blockage of strand conditions. Metals 2024, 14, 571. [Google Scholar] [CrossRef]
- Fan, J.P.; Li, Y.Q.; Chen, C.; Ouyang, X.; Wang, T.Y.; Lin, W.M. Effect of uniform and non-uniform increasing casting flow rate on dispersion and outflow percentage of tracers in four strand tundishes under strand blockage conditions. Metals 2022, 12, 1016. [Google Scholar] [CrossRef]
- Tsai, M.C.; Green, M.J. A three-dimensional concurrent numerical simulation of molten steel behavior and chemical transition at inland steel’s no. 2 caster tundish. In Proceedings of the Steelmaking Conference Proceedings, Paris, French, 4–5 December 1991. [Google Scholar]
- Burns, M.; Schade, J.; Brown, W.A.; Minor, K. Transition model for armco steel’s ashland slab caster. Iron Steelmak. 1992, 19, 35–39. Available online: https://api.semanticscholar.org/CorpusID:115002623 (accessed on 10 April 2025).
- Chen, H.S.; Pehlke, R.D. Mathematical modeling of tundish operation and flow control to reduce transition slabs. Metall. Mater. Trans. B 1996, 27, 745–756. [Google Scholar] [CrossRef]
- Piccone, T.J.; Sinha, A.K.; Madden, M. Intermix trials at Gary No. 2 Caster using different tundish configurations. In Proceedings of the 84th Steelmaking Conference, Baltimore, MD, USA, 25–28 March 2001. [Google Scholar]
- Kant, S.; Jha, P.K.; Kumar, P. Investigation of effect of dam on intermixing during ladle changeover in six strand billet caster tundish. Ironmak. Steelmak. 2011, 38, 391–397. [Google Scholar] [CrossRef]
- Guarneros, J.D.; Morales, R.; Gutierrez, E. Optimized fluid flow control system for a tundish used in frequent steel grade change operations. Steel Res. Int. 2023, 94, 2200809. [Google Scholar] [CrossRef]
- Chakraborty, S.; Hirose, T.; Jones, B. Transition reduction and simultaneous maintenance of steel quality in Granite City tundishes. In Proceedings of the 82nd Steelmaking Conference, Chicago, IL, USA, 21–24 March 1999. [Google Scholar]
- Xu, D.; Rogler, J.P.; Heaslip, L.J.; Dorricott, J.D.; Foss, R. Dynamic flow behavior in the tundish: Optimization of grade transitions. In Proceedings of the 60th Electric Furnace Conference, San Antonio, TX, USA, 10–13 November 2002. [Google Scholar]
- Amorim, L.C.; Silva, C.A.; Resende, A.D.; Silva, I.A.; Oliveira, M.J.M. A study of intermix in a six-strand billet caster. Metall. Mater. Trans. A 2018, 49, 6308–6324. [Google Scholar] [CrossRef]
- Cwudziński, A.; Pieprzyca, J.; Merder, T. Numerical and physical modeling of liquid steel asymmetric behavior during non-isothermal conditions in a two-strand slab tundish-“Butterfly Effect”. Materials 2023, 16, 6920. [Google Scholar] [CrossRef]
- Song, S.; Sun, Y.; Chen, C. Numerical simulation of macro-segregation phenomena in transition blooms with various carbon contents. Metals 2024, 14, 263. [Google Scholar] [CrossRef]
- Song, S.C.; Sun, Y.H.; Zhou, W.H.; Yang, J.; Yang, W.Z. The effect of steel grade casting sequence on the length of transition bloom. Metall. Mater. Trans. B 2024, 55, 1795–1811. [Google Scholar] [CrossRef]
- Patankar, S.V. Numerical Heat Transfer and Fluid Flow; Hemispere Publishing Corporation: New York, NY, USA, 1980; p. 16. [Google Scholar]
- Wang, J.H.; Ni, P.Y.; Chen, C.; Ersson, M.; Li, Y. Effect of gas blowing nozzle angle on multiphase flow and mass transfer during RH refining process. Int. J. Min. Met. Mater. 2023, 30, 844–856. [Google Scholar] [CrossRef]
- Ouyang, X.; Lin, W.M.; Luo, Y.Z.; Zhang, Y.X.; Fan, J.P.; Chen, C.; Cheng, G.G. Effect of salt tracer dosages on the mixing process in water model of single snorkel refining furnace. Metals 2022, 12, 1948. [Google Scholar] [CrossRef]
- Zhang, J.S.; Liu, Y.H.; Qin, B.M.; Li, D.Y.; Yang, S.F.; Liu, Q. A structured mesh generation tool for cfd simulations in process metallurgy. Metall. Mater. Trans. B 2023, 54, 481–486. [Google Scholar] [CrossRef]
- Siemens, P.L.M. STAR-CCM + User Guide, version 16.06; Siemens PLM Software Inc.: Munich, Germany, 2021.
- He, F.; Wang, H.J.; Zhu, Z.H. Numerical investigation of effect of casting speed on flow characteristics of molten steel in multistrand tundish. Iron Steel Inst. Jpn. Int. 2019, 59, 1250–1258. [Google Scholar] [CrossRef]
- Zhang, J.S.; Li, J.S.; Yang, S.F. Optimization of fluid flow in a twelve-strand continuous casting tundish with two strands closed. Metal. Int. 2014, 19, 10–13. [Google Scholar]
Disclaimer/Publisher’s Note: The statements, opinions and data contained in all publications are solely those of the individual author(s) and contributor(s) and not of MDPI and/or the editor(s). MDPI and/or the editor(s) disclaim responsibility for any injury to people or property resulting from any ideas, methods, instructions or products referred to in the content. |
© 2025 by the authors. Licensee MDPI, Basel, Switzerland. This article is an open access article distributed under the terms and conditions of the Creative Commons Attribution (CC BY) license (https://creativecommons.org/licenses/by/4.0/).