Abstract
Excavation unloading in deep rock masses involves a transition from symmetric states of energy storage to asymmetric energy dissipation, in which variations in intermediate principal stress () play a critical role. To investigate these symmetry-breaking mechanisms, controlled-rate true triaxial unloading experiments were performed on sandstone using a miniature creep-coupled testing system. During unloading of at 0.1–0.3 MPa/s, the evolution of elastic, dissipated, and plastic energies was quantitatively evaluated. The results reveal pronounced asymmetric energy responses governed by both and the unloading rate. Dissipated energy dominates the entire unloading process, while elastic energy exhibits a non-monotonic trend with increasing —first rising due to enhanced confinement and then decreasing as premature failure occurs. Higher unloading rates significantly accelerate total, elastic, and dissipated energy conversion and intensify post-peak brittleness. A new metric, plastically released energy, is proposed to quantify the asymmetric energy release from peak to residual state after failure. Its dependence on is strongly non-monotonic, increasing under moderate but decreasing when is sufficiently high to trigger failure during unloading. This behavior captures the essential symmetry-breaking transition between elastic energy accumulation and irreversible plastic dissipation. These findings demonstrate that true triaxial unloading induces energy evolution patterns far from symmetry, controlled jointly by and unloading kinetics. The established correlations between , unloading rate, and plastically released energy enrich the theoretical framework of energy-based symmetry in rock mechanics and offer insights for evaluating excavation-induced instability in deep underground engineering.
1. Introduction
With the depletion of shallow resources and the growing demand for underground space, deep resource extraction and large-scale underground engineering have become central research topics in civil and geotechnical engineering [1]. Compared with shallow projects, deep underground environments are characterized by high geostress, strong anisotropy, and complex mechanical–thermal–hydraulic coupling, which significantly increase the difficulty of predicting and controlling rock mass behavior (Figure 1). During excavation, the surrounding rock inevitably undergoes unloading accompanied by drastic stress redistribution [2]. When the released energy exceeds the rock mass’s capacity for storage and dissipation, sudden instability phenomena—such as spalling, collapse, and rock burst—may occur [3,4,5], highlighting the urgent need for a deeper understanding of energy-driven failure in deep rock masses [6].
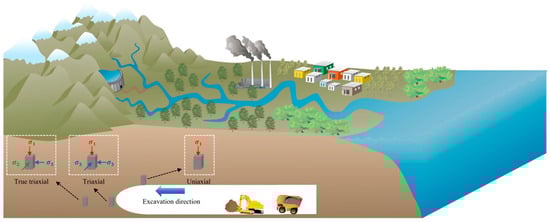
Figure 1.
Schematic diagram of actual project excavation.
From an energy perspective, rock deformation and failure involve energy input, accumulation, dissipation, and release. Numerous studies have explored energy evolution under various loading and unloading conditions. Xu et al. [7] reported nonlinear changes in energy input, elastic storage, and dissipation in cyclic-loaded sandstone under different confining pressures. Zhang et al. [8] demonstrated that loading rate strongly influences dissipated energy, fractal damage, and acoustic-emission precursors in true triaxial tests. Although these findings are valuable, most existing frameworks still rely on elastic assumptions, and systematic studies addressing elastoplastic energy evolution during realistic unloading remain limited. In particular, the coupled influence of intermediate principal stress () and excavation-induced unloading rate on energy conversion and plastic energy release is not yet fully understood—an essential gap for energy-based instability evaluation.
Previous studies indicate that moderating the unloading rate or reducing excavation area can effectively mitigate excavation-induced instability by regulating energy input and release [9]. However, most existing work has focused on idealized elastic unloading paths [10,11,12], while research on energy evolution under elastoplastic unloading remains insufficient [13,14,15,16]. In particular, the roles of energy conversion rate, plastic energy release, and their interactions as intrinsic indicators of rock failure have not been fully clarified. Moreover, the combined influence of unloading rate and intermediate principal stress on energy accumulation, dissipation, and release—and their contribution to instability—remains insufficiently understood [17]. Existing studies primarily examine strength and deformation responses under different unloading rates. For example, Peng et al. [18] showed that sandstone strength decreases exponentially with increasing unloading rate; Li et al. [19] found that extending unloading duration reduces dynamic effects during early excavation; Liu et al. [20] reported that high unloading rates increase total and recoverable strain; Chen et al. [21] observed that rapid unloading accelerates crack propagation in sandstone. While these findings provide important mechanical insights, they largely remain at the stress–strain level, and systematic investigations of the underlying energy-evolution mechanisms are still lacking.
Addressing this gap, Zhao et al. and Xu et al. [22,23] further investigated the influence of unloading rate on rock failure modes, reporting that, with increasing unloading rate, the dominant failure mechanism transitions from a tensile–shear hybrid mode to tensile failure, accompanied by a significant proliferation of microcracks. Jiang et al. [24] demonstrated that high-speed unloading promotes dynamic rock burst phenomena, typically manifested by rock ejection and brittle tensile responses. Duan et al. [25] through numerical simulations, highlighted the strong coupling effects of initial confining pressure and unloading rate on failure patterns. Wang et al. [26] revealed that higher unloading rates lead to lower residual stresses in rock masses. These studies collectively establish that unloading rate plays a decisive role in shaping failure modes and post-failure responses. Nevertheless, their focus has primarily remained at the level of macroscopic failure characterization, without sufficiently uncovering the intrinsic role of energy accumulation, conversion, and release in governing the failure process.
In parallel, researchers have increasingly examined the laws of energy conservation and transfer during unloading-induced rock failure [27,28,29,30]. For instance, Zhao et al. [31] investigated the effects of loading and unloading rates on sandstone and reported that higher unloading rates reduce elastic strain energy storage, promote crack initiation, and alter the damage threshold during failure evolution. Si et al. [32] focusing on rock burst mechanisms under three-dimensional initial stress, demonstrated that unloading produces a pronounced a strength-weakening effect in granite, with the unloading rate and confining pressure jointly controlling stored elastic energy, stress drop, and the transition from shear–tension to tensile failure. Wang et al. [33] further showed that, under fatigue–loading–confining–stress–unloading (FL-CSU) conditions, the unloading rate significantly governs the partitioning between elastic energy and dissipated energy; CT reconstruction revealed that fracture geometry and crack propagation patterns depend strongly on the unloading rate. Gao et al. [34] extended the analysis to deep-seated rocks under varied loading/unloading rates, proposing calculation methods for elastic strain energy and dissipated energy applicable to true triaxial stress conditions, thus offering a framework for quantifying energy evolution. Liu et al. [35] further refined these approaches, pointing out limitations of traditional elastic-theory-based calculations, and proposed energy difference integration methods that more accurately capture energy partitioning across different unloading stages. However, despite these advances, the coupled σ2–unloading rate effect on elastoplastic energy evolution—and its role in triggering instability—has not been systematically clarified. This constitutes the key research gap addressed in this study.
In summary, this study not only fills the gap regarding the coupled effects of σ2 and unloading rate on energy evolution but also introduces an energy symmetry framework to describe unloading-induced failure. The present study enriches the theoretical framework of rock energy mechanics under complex stress paths and provides a basis for developing energy-based early-warning indices, critical thresholds, and risk-control strategies for deep underground engineering.
From a physical symmetry perspective, the energy evolution of rocks during unloading can be regarded as a reversible–irreversible transition between symmetric energy-storage and energy-dissipation states. The true triaxial stress path provides a unique setting for examining stress-path symmetry and its coupling with energy conversion mechanisms. Once this symmetry is disturbed—whether by excessive or rapid unloading—the system shifts from a stable elastic regime to an unstable fractured state. Therefore, this work not only investigates mechanical coupling between intermediate principal stress and unloading rate but also interprets the failure process within an energy symmetry framework, consistent with the interdisciplinary scope of Symmetry.
2. Test Methods
2.1. Sample Preparation and Test Equipment
Red sandstone with homogeneous texture and without visible joints or fissures was selected as the testing material. All specimens were fabricated through precision grinding to ensure high machining quality. The non-parallelism of the loading ends was controlled within ±0.02 mm, the non-perpendicularity between adjacent faces within ±0.03 mm, and the dimensional tolerance of the nominal size (25 mm × 25 mm × 50 mm) within ±0.05 mm. These strict tolerances ensured minimal geometric deviation among specimens and flat, high-quality end surfaces suitable for true triaxial loading.
Prior to machining, each sandstone block underwent ultrasonic screening using a portable P-wave velocity tester. Multiple measurements were taken for each block, and blocks whose average velocity deviated by more than ±3–5% from the batch mean were rejected. This procedure effectively eliminated samples with internal heterogeneity or hidden defects, ensuring that the final specimens possessed consistent physical properties and were mechanically comparable across all test groups.
The specimen size of 25 mm × 25 mm × 50 mm was selected to match the internal space constraints of the miniature true triaxial chamber while maintaining the standard 1:1:2 aspect ratio commonly used in rock mechanics testing. Although downsized, the stress path, boundary conditions, and unloading mechanism remain unchanged. The reduced dimensions also improve loading stability and enhance the precision of deformation and energy-response measurements.
All experiments were carried out using the ZTTS-887 True Triaxial Creep-Coupled Testing System (Figure 2 and Figure 3). This system supports a wide range of rock mechanical tests, including uniaxial loading, conventional triaxial loading, true triaxial loading, creep, high-temperature tests, cyclic loading–unloading, and complex disturbance simulations. The original control interface is in Chinese; therefore, the key operational modules have been annotated in English in Figure 4 for clarity. The apparatus can apply stresses up to 800 MPa in both the maximum and intermediate principal stress directions and up to 70 MPa in the minimum principal stress direction, with a pore pressure subsystem capable of generating up to 70 MPa. All loading and data acquisition procedures are managed through an integrated computerized platform, ensuring stable control and fully automatic recording of stress, strain, and deformation throughout the tests.
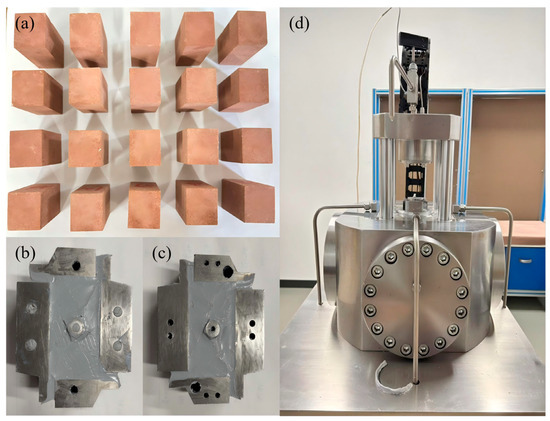
Figure 2.
Schematic diagram of rock samples and equipment. (a) Rock specimen; (b) front side of the mold; (c) back side of the mold; (d) true triaxial test system.
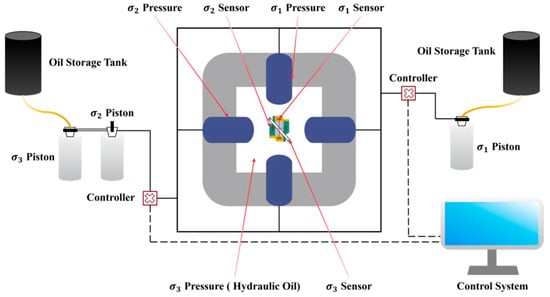
Figure 3.
System diagram.
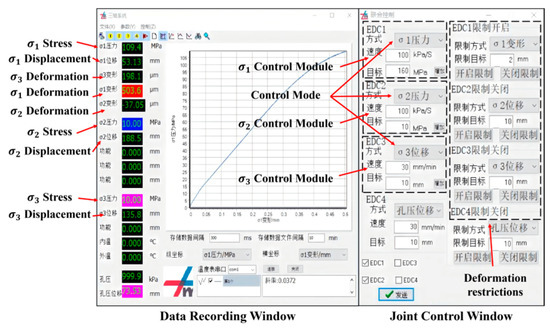
Figure 4.
Control system (original interface in Chinese; key labels annotated in English).
2.2. Test Principle and Process
The sandstone specimens were categorized into two groups while maintaining a constant minimum principal stress of 10 MPa. Group 1 was used for true triaxial compression tests under varying intermediate principal stresses, whereas Group 2 was subjected to true triaxial unloading tests with different unloading rates and intermediate principal stresses. The corresponding stress paths are illustrated in Figure 5, and the detailed test parameters are listed in Table 1.
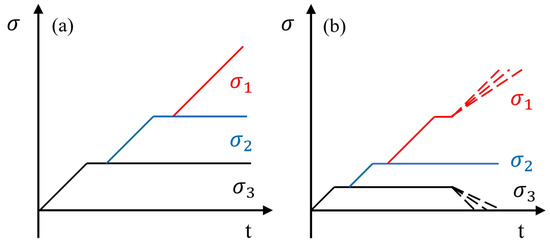
Figure 5.
Test stress path diagram. (a) True triaxial compression test; (b) true triaxial unloading test.

Table 1.
Test scheme.
To ensure a stable true-triaxial stress state with adequate lateral confinement, the minimum principal stress was fixed at 10 MPa. This stress level is representative of the typical in situ minimum horizontal stress encountered in hard rock masses at moderate burial depths and therefore provides a realistic initial stress condition for the unloading simulations.
The testing procedures were conducted as described here.
- (1)
- Preparation and sensor calibration:
Prior to testing, deformation sensors in the three principal directions were mounted onto the specimen, which was then positioned on the central pedestal of the pressure chamber. The sensor terminals were connected to the corresponding ports on the chamber top. Initial readings were monitored through the acquisition system and adjusted until the values stabilized around 0 mm. After the sensor cables were arranged, the chamber was sealed and filled with hydraulic oil. Under displacement control, the loading platens were slowly brought into contact with the specimen, and appropriate levels of the maximum and intermediate principal stresses were applied to complete the preloading stage.
- (2)
- True triaxial compression test:
A hydrostatic pressure of 10 MPa was first applied at 0.1 MPa/s and held constant. The maximum and intermediate principal stresses were then increased simultaneously at 0.1 MPa/s to predetermined levels (20 MPa, 30 MPa, 40 MPa) and stabilized. Finally, the maximum principal stress was increased at 0.1 MPa/s until specimen failure. The preloading stage was conducted under displacement control, whereas all subsequent loading procedures were performed under stress control.
- (3)
- True triaxial unloading test:
The specimen was first loaded hydrostatically to 10 MPa at 0.1 MPa/s and stabilized. The maximum and intermediate principal stresses were then increased simultaneously at 0.1 MPa/s to the preset values (20 MPa, 30 MPa, 40 MPa) and held constant. The maximum principal stress was subsequently increased at 0.1 MPa/s to 80% of the peak value. Finally, unloading was carried out at the designated rates (0.1 MPa/s, 0.2 MPa/s, 0.3 MPa/s) while maintaining the prescribed loading–unloading sequence.
Due to the strict geometric constraints of the miniature true triaxial apparatus and the difficulty of preparing multiple cubic sandstone specimens with identical dimensions and material uniformity, one specimen was tested for each loading–unloading condition. Prior to machining, all sandstone blocks were screened using density measurements and P-wave velocity testing, and only those within a preset tolerance range (±3–5%) were selected. This ensured that the specimens used in the tests possessed adequate homogeneity despite the single-sample grouping.
3. Test Results and Analysis
3.1. True Triaxial Compression Test
The typical stress–strain responses of sandstone under true triaxial compression are shown in Figure 6. Overall, the curves exhibit four characteristic stages: (1) linear elastic stage, during which pre-existing microcracks undergo progressive closure and the specimen responds elastically; (2) nonlinear crack initiation and stable propagation stage, where tensile and shear microcracks begin to nucleate and extend while remaining constrained by the surrounding rock matrix; (3) peak strength stage, characterized by rapid microcrack coalescence and the formation of dominant fracture paths; and (4) post-peak softening stage, during which unstable crack propagation leads to macroscopic failure and significant stress degradation.
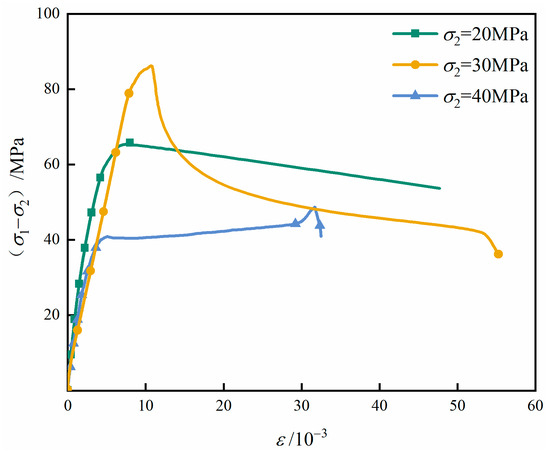
Figure 6.
Stress–strain curve of sandstone under true triaxial compression.
The peak strength of sandstone exhibits a non-monotonic response to increasing intermediate principal stress (), first rising and then declining. At relatively low , the additional lateral confinement enhances the restraint on lateral strain, suppresses the initiation of new microcracks, and promotes the closure of pre-existing flaws. This collectively increases the load-bearing capacity of the rock. However, as continues to increase, it facilitates the development of cracks oriented parallel to its loading direction. Once exceeds a critical confinement level, the restraining effect is replaced by a destabilizing influence, and the accelerated propagation of these cracks leads to a reduction in peak strength. This transition from a strengthening to a weakening role is consistent with previous true triaxial studies, which have highlighted the nonlinear and dual control of on rock mechanical behavior.
The corresponding failure morphologies of sandstone under different levels are shown in Figure 7. At low , the specimens develop a clearly defined single shear plane, and failure is primarily governed by shear slip along a preferred orientation. As increases, the failure pattern gradually evolves into multiple intersecting shear planes, accompanied by a noticeable increase in the inclination angle of the dominant fracture surface. This change occurs because a higher imposes greater normal confinement on planes parallel to the -axis, inhibiting both tensile opening and shear displacement along these planes. Consequently, the failure mode is redirected toward shear planes oriented at steeper angles that can overcome the enhanced lateral restraint. This -induced reorientation of shear fractures aligns well with previously reported true triaxial failure characteristics of brittle rocks.
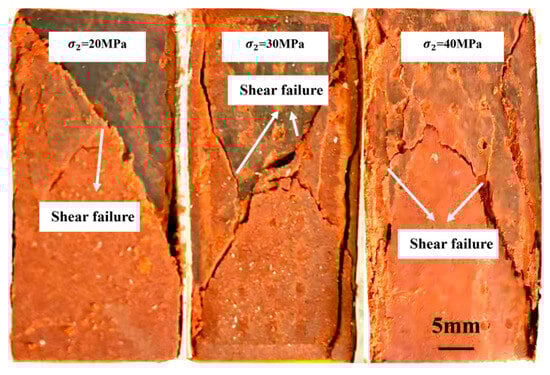
Figure 7.
Damage pattern of sandstone under true triaxial compression.
Moreover, at elevated levels, axial-splitting-type tensile cracks become increasingly pronounced on planes parallel to the -axis. As continues to rise, the dominant shear fractures gradually rotate toward orientations nearly perpendicular to the minimum principal stress , while still maintaining a general alignment with the direction. This evolution reflects a transition from a predominantly shear-controlled failure mode to a mixed shear–tensile mode, in which the interplay between enhanced lateral confinement and tensile splitting dictates the final fracture geometry.
3.2. True Triaxial Unloading Test
3.2.1. Energy Calculation Method
The failure of rock under complex stress states is fundamentally a process of instability driven by energy redistribution. Unlike conventional strength or deformation indicators, which capture only the macroscopic manifestations of instability, an energy-based analysis provides a more intrinsic description of failure by quantifying the evolution of energy storage, conversion, dissipation, and release within the rock mass. This perspective enables identification of the internal mechanisms that govern the transition from stable deformation to catastrophic instability.
This energy evolution analysis is conducted under the assumption that no heat exchange occurs between the interior and exterior of the pressure chamber, allowing the test to be treated as a thermodynamically closed system. Under this condition, the total input energy density supplied by external loading is partitioned into two components: an irreversible portion converted into dissipation energy density, and a reversible portion stored as elastic strain energy density within the specimen [36]. The total input energy and elastic strain energy can therefore be expressed as follows:
where is the total energy density (MJ/m−3); is the dissipated energy density (MJ/m−3); is the elastic strain energy density (MJ/m−3); , , and are the maximum, intermediate and minimum principal stresses (MPa), respectively; E and represent the elastic modulus and Poisson’s ratio, respectively, and can be obtained from the elastic stage of the stress–strain curves during loading. The specific numerical values obtained from Figure 8 are presented in Table 2.
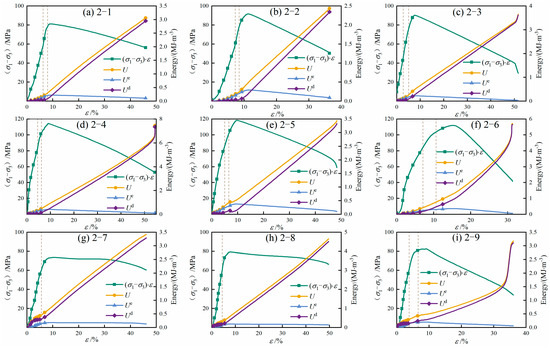
Figure 8.
Stress–strain–energy evolution curve of sandstone under true triaxial unloading.
Table 2.
Elastic modulus and Poisson’s ratio.
To streamline the analysis, the work performed by the initial hydrostatic preload is treated as a constant, entirely stored as recoverable elastic strain energy. The corresponding energy density under hydrostatic stress can be obtained directly from linear elastic theory:
To provide a quantitative basis for the concept of energy symmetry discussed in this study, the energy evolution during unloading can be expressed using an energy difference function:
where is the elastic strain energy and is the dissipated energy.
When 0, the system is dominated by elastic energy storage, corresponding to a symmetric and reversible mechanical state. When 0, the system reaches a critical point at which energy storage and dissipation are balanced, indicating the onset of instability. When 0, dissipated energy dominates and symmetry is broken, leading to irreversible deformation and failure. This framework is consistent with the observed transitions in elastic–plastic energy partitioning under different levels and unloading rates, and provides a quantitative measure for identifying the symmetry-breaking point associated with rock instability.
3.2.2. Characteristics of Energy Evolution Under Different Unloading Rates
Based on the aforementioned calculation method, the stress–strain curves and corresponding energy evolution curves of sandstone under different intermediate principal stresses and unloading rates are shown in Figure 8. Because the energy components are obtained directly through integration of the stress–strain curves, the variations in elastic and dissipated energy exhibit a clear correspondence with the deformation characteristics presented in Figure 8. This ensures internal consistency between the experimental mechanical response and the derived energy evolution. The results reveal that the energy evolution of sandstone during true triaxial unloading displays distinct staged behavior, which can be broadly divided into five phases. It is also noteworthy that increasing σ2 delays the occurrence of the stress–strain peak, a trend that aligns with the enhanced accumulation of elastic energy during the loading process.
In the initial loading phase, pre-existing microcracks and pores within the sandstone are compressed, resulting in irreversible compaction deformation. During this stage, both the total input energy and dissipated energy increase slowly, whereas the storage of elastic energy remains limited. Because the mechanical response is dominated by microstructural compaction, the unloading rate exerts negligible influence on the energy distribution. As compaction diminishes and pore closure is completed, the deformation of the sandstone transitions into a predominantly elastic regime. Elastic strain energy accumulates rapidly and becomes the major component of the total input energy ( 0), while dissipated energy remains minimal. Under higher unloading rates, the rate of elastic energy accumulation is more pronounced, indicating that rapid unloading temporarily enhances the elastic energy storage capacity of the rock. With continued loading, new cracks begin to initiate and propagate in a stable manner. Plastic deformation becomes increasingly significant, causing the growth rate of elastic energy to slow, while dissipated energy starts to increase at an accelerated pace. In this stage, higher unloading rates produce substantially greater dissipated energy, reflecting more intense microstructural damage and plastic evolution. As microcracks become interconnected to form a more continuous fracture network, the energy evolution enters a critical transition stage. The accumulation of elastic energy nearly ceases, whereas dissipated energy rises sharply due to accelerated damage development and plastic deformation. The dominance of elastic energy is gradually replaced by dissipated energy ( 0). Higher unloading rates intensify this transition, promoting more rapid consumption of stored elastic energy and advancing the onset of mechanical instability. Once microcracks coalesce into macroscopic fracture planes, the load-bearing capacity of the sandstone decreases abruptly. The elastic energy accumulated during earlier stages is suddenly released, leading to brittle failure characteristics. At the same time, dissipated energy increases rapidly as irreversible processes—such as crack propagation, frictional sliding, and particle fragmentation—intensify. Under high unloading rates, this stage is marked by abrupt elastic energy release and pronounced dynamic failure, whereas under lower unloading rates, the release process is comparatively gradual.
As unloading progresses, sandstone undergoes a clear transition from elastic-dominated behavior to damage-dominated behavior, accompanied by a progressive rise in dissipated energy and a gradual reduction in elastic energy accumulation. Higher unloading rates further intensify this transition by accelerating microcrack interaction, promoting earlier coalescence, and inducing more abrupt elastic energy release. These observations illustrate that the failure process is fundamentally governed by the dynamic redistribution between stored elastic energy and dissipated plastic energy.
In summary, the energy evolution characteristics of sandstone under different unloading rates indicate that low unloading rates enable greater elastic energy storage prior to failure, delay the point at which dissipated energy becomes dominant, and lead to relatively more ductile failure behavior. In contrast, high unloading rates accelerate the conversion from elastic to dissipative energy, triggering earlier instability, more violent energy release, and brittle failure primarily governed by shear rupture. These findings demonstrate that unloading rate is a key parameter regulating the energetic balance of sandstone during true triaxial unloading. The revealed stage-dependent energy evolution patterns not only clarify the intrinsic mechanisms of unloading-induced instability but also provide practical indicators for early warning and risk assessment in deep underground excavation.
It is noteworthy that the dashed lines in Figure 8 delineate the unloading phases of the sandstone specimens, during which the failure responses of Groups 2-7 and 2-8 exhibit marked differences from those of the other groups. Consistent with the accelerated energy conversion observed at high unloading rates, failure in Groups 2-7 and 2-8 occurs directly during the unloading stage. In these cases, the substantial elastic energy stored prior to unloading is released abruptly once the instantaneous stress state exceeds the rock’s residual bearing capacity. Consequently, the stress–strain curves show no distinct yield plateau before the peak. Instead, the stress drops immediately after the peak and then stabilizes at a relatively high residual stress level. This behavior indicates that although the specimens lose their peak strength, part of their internal structure remains intact due to incomplete crack coalescence, allowing a portion of the load-bearing framework to be preserved.
In contrast, the specimens in the remaining groups fail after undergoing stress redistribution following the completion of unloading. During this process, stress concentration gradually develops near the exposed unloading surface. Failure is initiated once these localized stresses exceed the ultimate strength of the sandstone, marking a fundamentally different instability mechanism from the unloading-induced abrupt failures observed in Groups 2-7 and 2-8. This redistribution-controlled failure process is characterized by the emergence of a relatively pronounced yield plateau before the peak stress, reflecting progressive crack initiation and stable crack growth. After the peak, the stress drops sharply and reaches a comparatively low residual level, indicating that crack coalescence, internal structural collapse, and fracture connectivity are more complete. Such behavior demonstrates that when failure is governed by secondary stress redistribution rather than instantaneous elastic energy release, the resulting fracture pattern tends to be more pervasive and structurally destructive.
From a mechanical standpoint, these two distinct failure responses further demonstrate the coupled effects of intermediate principal stress and unloading rate. When the intermediate principal stress exceeds a critical threshold, the stabilizing confinement it provides is gradually transformed into a destabilizing influence, effectively lowering the rock’s ultimate load-bearing capacity and making premature failure during the unloading stage more likely. Conversely, increasing the unloading rate shortens the duration of the unloading process, leaving insufficient time for cracks to initiate, grow, and fully coalesce. This temporal mismatch between rapid external stress reduction and delayed internal fracture evolution suppresses the development of a complete fracture network. As a result, rapid unloading can artificially increase the apparent peak strength and modify the post-peak residual behavior, since the internal structural degradation lags behind the external stress adjustments.
To further quantify the influence of unloading rate on the energy evolution of sandstone, the concept of an energy conversion rate during the unloading stage is introduced. This parameter is defined as the ratio between the increment of total input energy accumulated throughout the unloading process and the corresponding unloading duration. It characterizes the dynamic efficiency of energy accumulation, dissipation, and release under varying stress paths and unloading conditions. By capturing the time-dependent features of energy transformation, the energy conversion rate provides an effective metric for evaluating how rapidly the internal energy state of the rock responds to external unloading, thereby offering a more refined indicator of instability tendencies under different unloading rates.
where , , and are the total energy conversion rate, the elastic energy conversion rate, and the dissipative energy conversion rate, respectively. This index provides a more direct and sensitive measure of how unloading rate governs the redistribution between elastic energy storage and dissipated energy consumption, thereby offering a critical parameter for evaluating instability precursors in sandstone under true triaxial unloading conditions.
As shown in Figure 9, the energy conversion rates of sandstone under different unloading rates and intermediate principal stresses exhibit clear systematic trends. Consistent with the staged energy evolution discussed previously, both the total energy conversion rate and the dissipated energy conversion rate increase monotonically with rising intermediate principal stress (). This is because higher enhances lateral confinement, delays the onset of plastic deformation, and allows greater energy accumulation during the pre-failure stage, thereby increasing the amount of energy transformed per unit time during unloading. In contrast, the elastic energy conversion rate displays a non-monotonic pattern—first increasing and then decreasing—as continues to rise. At moderate levels, enhanced confinement suppresses early crack growth, enabling the sandstone to store elastic energy more efficiently. However, when becomes excessively high, localized tensile splitting and shear–tensile coupling reduces the proportion of energy stored elastically, causing the elastic conversion rate to decline. This trend further illustrates that fundamentally governs the partitioning of elastic and dissipated energy during the unloading process.
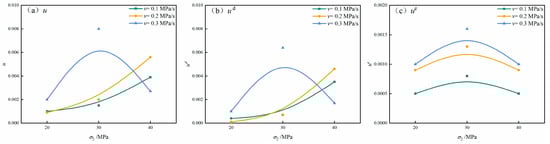
Figure 9.
Energy conversion rate curve for sandstone. (a) —the total energy conversion rate; (b) —the elastic energy conversion rate; (c) —the dissipative energy conversion rate.
This behavior can be interpreted from the perspective of crack constraint and energy partitioning. At moderate levels of intermediate principal stress (), lateral deformation is effectively restricted, suppressing the initiation and stable propagation of microcracks. This confinement enhances the capacity of the sandstone to accumulate elastic strain energy, leading to an increase in the elastic energy conversion rate. However, as continues to rise, crack propagation becomes increasingly oriented along planes parallel to the direction. Such directional cracking weakens the rock’s ability to store elastic energy and consequently reduces the elastic energy conversion rate. Meanwhile, elevated intensifies stress concentration along the unloading direction (), promoting rapid crack nucleation and coalescence near the unloading surface. This shift in fracture behavior further enhances dissipative processes and accelerates energy release during unloading.
In addition, the unloading rate has a pronounced regulatory effect on energy evolution. Under the same conditions, higher unloading rates consistently correspond to greater total, elastic, and dissipated energy conversion rates. At lower unloading rates, the sandstone has sufficient time to release elastic energy progressively through plastic deformation mechanisms such as stable microcrack propagation, grain boundary sliding, and localized inelastic deformation. This gradual energy redistribution reduces the instantaneous elastic energy conversion rate. In contrast, at higher unloading rates, the accumulation of elastic energy exceeds the rate at which microcracks can nucleate and evolve. This imbalance results in an elevated elastic energy conversion rate and lowers the threshold for crack initiation. As a consequence, numerous microcracks rapidly nucleate, extend, and eventually coalesce into macroscopic fracture surfaces. This process is accompanied by substantial dissipated energy release, reflected in forms such as acoustic emission activity, frictional heating, and the formation of new fracture surface energy.
In summary, comparative analysis of Figure 9 indicates that the dissipated energy conversion rate is the dominant contributor to the total energy conversion rate during unloading. In the stage of unstable crack propagation, microcracks transition rapidly from stable initiation to abrupt coalescence. During this transition, elastic energy accumulation stagnates, whereas dissipated energy rises sharply and surpasses elastic energy as the governing component. The predominance of dissipated energy reflects the irreversible processes of crack extension, plastic deformation, grain boundary sliding, and intergranular friction. It is worth noting that, for = 40 MPa, the specimens unloaded at 0.1 MPa/s and 0.2 MPa/s experienced abrupt failure during the unloading phase, in contrast to specimens under lower where failure typically occurred after unloading was completed. Under such a high intermediate principal stress, the confinement applied by is substantial; once begins to decrease, a steep tensile stress gradient develops along the unloading surface, promoting instantaneous crack coalescence and brittle collapse. Consequently, the accumulation and release of elastic energy occur nearly simultaneously, producing an actual drop in the energy-related curves prior to the completion of unloading. Importantly, this non-monotonic behavior is controlled by the intrinsic failure mechanism rather than by curve smoothing or interpolation. Even without smoothing, the energy curves would exhibit the same downward trend because the decline arises from sudden brittle failure under high . Therefore, the non-monotonic features observed in Figure 9 represent a mechanically meaningful response of sandstone subjected to high and rapid unloading, rather than an artefact of data processing.
From an engineering standpoint, the stage-dependent shift toward dissipated-energy dominance provides a fundamental mechanistic basis for interpreting the onset of dynamic rock mass instability. Once dissipated energy exceeds elastic energy and begins to accelerate, the sandstone rapidly loses its capacity to store and release elastic energy in a controlled manner, indicating that the system has entered a critical state of irreversible damage. This transition marks the imminent occurrence of brittle failure. Accordingly, tracking the relative evolution of elastic and dissipated energy offers a robust theoretical framework for early warning of excavation-induced instability and for defining critical energy thresholds applicable to deep underground engineering.
3.2.3. Disaster Criteria Based on the Energy Principle
Building upon the above analysis of unloading-induced energy evolution, the essence of dynamic disasters in engineering rock masses can be understood as the instantaneous release of accumulated elastic potential energy during excavation and unloading. When the amount of stored elastic energy exceeds the bearing capacity of the surrounding rock, it is rapidly transformed into kinetic energy, resulting in intense fracturing, fragmentation, or even rock burst-like phenomena. From an energy perspective, the total input energy accumulated before the peak stress can be decomposed into two major components (Figure 10): (1) fracture propagation and dissipation energy, representing irreversible energy consumption associated with microcrack initiation, propagation, frictional sliding, and intergranular damage; (2) elastic potential energy, the recoverable portion stored within the rock matrix during loading. Within the elastic potential energy, part of the energy is consumed progressively through plastic deformation, while the remaining portion continues to accumulate as elastic strain energy until peak strength is reached. Once the peak is exceeded, this residual elastic energy is released abruptly. It is precisely this sudden release of previously stored elastic energy that governs the intensity and severity of dynamic rock instability events.
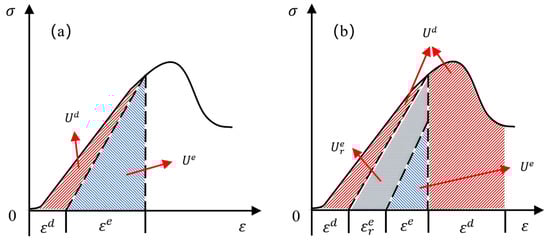
Figure 10.
Energy evolution process. (a) Energy evolution at the peak; (b) energy evolution after the peak.
Although a similar instantaneous release of elastic strain energy was captured during the unloading stage in this study, the observed behavior does not satisfy the criteria of a true dynamic rock burst: no violent ejection of fragments or strong impact sound occurred. Instead, the failure is more accurately classified as a burst-like brittle collapse, characterized by rapid structural breakdown and intense fragmentation induced by steep stress gradients under high σ2. This failure mechanism shares certain features with rock burst—such as abruptness and brittleness—but lacks the pronounced dynamic impact and kinetic energy typically associated with genuine rock burst events.
To quantitatively evaluate the failure severity of sandstone under different unloading rates and intermediate principal stresses, this study introduces the concept of plastically released energy. Plastically released energy () occurs exclusively in the post-peak failure stage and is defined as the difference between the maximum elastic energy ( accumulated before the peak and the residual elastic energy remaining () after failure:
where , , and are the differences between the elastic strain at the peak point of the rock in the , , and directions and the remaining elastic strain after the peak.
Taking the strain in the direction of the large principal stress as an example, the formulas for different strains are as follows:
where is the total strain in the direction of the maximum principal stress when the stress–strain curve reaches the peak point; is the maximum elastic strain energy accumulated in the rock before damage.
The magnitude of reflects the potential severity of instantaneous strain-energy release during unloading. A larger value indicates that a greater amount of elastic energy remains stored in the rock immediately before failure, implying a higher likelihood of sudden, violent instability; in contrast, a smaller value corresponds to a more stable failure mode dominated by progressive crack development and gradual energy dissipation. From an engineering standpoint, therefore provides a quantitative index for assessing the propensity of unloading-induced dynamic failure. By examining the evolution of under different unloading rates and intermediate principal stress levels, a critical energy threshold for triggering burst-like or violent failure can be identified. This approach not only deepens the mechanistic understanding of energy-controlled rock instability but also offers a practical theoretical basis for predicting and issuing early warnings for dynamic hazards in deep underground engineering.
Figure 11 illustrates the evolution of plastic release energy () for sandstone under various unloading conditions. Most specimens exhibit a characteristic “rapid surge–sharp drop” pattern, whereas only Groups 2-7 and 2-8 show a continuous increase in throughout the failure process. This divergence directly corresponds to the fundamental difference in failure mechanisms. For Groups 2-7 and 2-8, the sustained increase in reflects a failure process involving substantial deformation and gradual plastic energy release. The rock undergoes progressive crack development and accumulates a significant amount of plastic work prior to final collapse, indicating a comparatively ductile failure mode. For the remaining groups, is concentrated within a narrow deformation interval and is released almost instantaneously at the moment of failure. Such behavior is indicative of brittle instability, where the stored elastic energy is rapidly converted into fracture surface energy and, in part, kinetic energy. From the perspective of engineering disaster mechanisms, the latter failure mode—characterized by abrupt and concentrated plastic energy release—poses considerably greater hazard potential. Sudden energy outbursts are more likely to trigger violent fragmentation or burst-like behaviors, making these conditions critical indicators for dynamic instability in deep excavation environments.
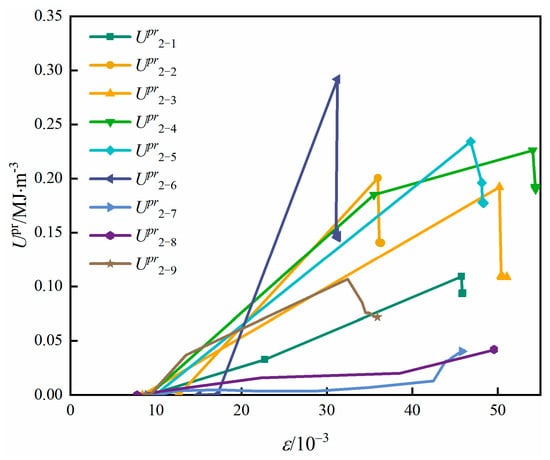
Figure 11.
Released plastic energy evolution curve of sandstone.
In addition, when excavation-induced unloading does not cause immediate failure and subsequent loading is required to trigger collapse, the plastic release energy is generally lower than that observed in cases of direct unloading-induced failure. This difference arises because excavation and unloading create newly exposed free surfaces, resulting in significant stress redistribution and concentration near the excavation boundary. During the unloading process, the testing system continues to input external work, thereby further increasing the stored elastic energy within the specimen. Once failure is initiated, the combined effects of elevated stress concentration and enhanced elastic energy storage lead to a larger portion of energy being transformed into kinetic energy. Consequently, the ensuing rupture becomes more violent, producing a more brittle and dynamic failure response compared with cases involving gradual, ductile deformation.
Figure 12 further illustrates the relationship between the energy storage limit and the plastic release energy. Several key features can be identified. As the unloading rate increases, the development of internal cracks becomes progressively insufficient. The externally supplied energy can no longer be effectively transformed into recoverable elastic strain; instead, a larger proportion is continuously converted into plastic strain. As a result, the value of increases steadily with increasing unloading rate. At low unloading rates, the rock has adequate time for stress redistribution and microcrack propagation, allowing energy to be dissipated gradually. Thus, only a small portion of elastic energy is released in a catastrophic manner. In contrast, high unloading rates promote abrupt crack coalescence, leaving insufficient time for stable plastic deformation. The stored elastic energy is therefore released directly through rapid fracture formation, leading to a sharp increase in .
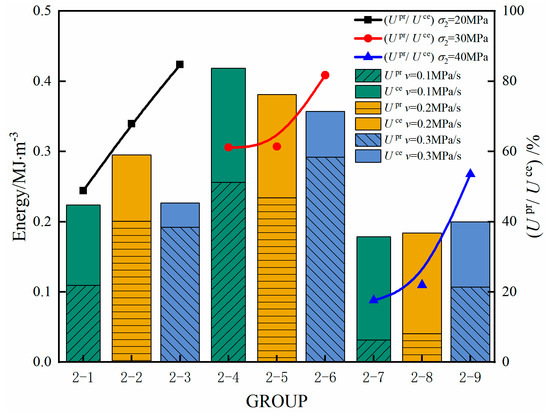
Figure 12.
Curve of the relationship between energy storage limit and plastic release energy.
The value of first increases and then decreases as the intermediate principal stress rises, a trend that aligns with the corresponding variation in sandstone strength. At moderate , the enhanced lateral confinement promotes elastic energy accumulation, thereby increasing the energy storage limit and consequently elevating the potential magnitude of . However, when becomes excessively high, crack propagation along planes parallel to the -direction is accelerated, weakening the rock and reducing both the energy storage limit and the resulting .
Fundamentally, is governed by the elastic energy storage limit, . A higher storage limit corresponds to a greater potential for abrupt and catastrophic energy release once the stability threshold is exceeded. Therefore, a combined assessment of both the storage limit and provides a more robust and comprehensive indicator for evaluating the risk of dynamic failure.
In summary, the evolution of exhibits pronounced sensitivity to both unloading rate and intermediate principal stress. The combination of high unloading rates and moderate levels of produces the largest values of , corresponding to the most critical and hazardous mechanical conditions. From an engineering standpoint, this indicates that rapid excavation or fast unloading in deep rock masses subjected to moderate lateral confinement poses the highest likelihood of dynamic failure phenomena such as violent spalling or rock burst-like events. These findings emphasize the necessity of carefully regulating unloading rates and optimizing excavation sequences in underground engineering to minimize abrupt energy release and enhance operational safety.
The severity of rock failure is controlled not only by the amount of elastic energy accumulated prior to reaching peak stress but also by the rate at which this energy is released during the failure process. A higher conversion rate of typically corresponds to more abrupt, violent, and potentially catastrophic instability. To further quantify this behavior, Figure 13 illustrates the evolution curves of the plastic release energy conversion rate for sandstone subjected to different unloading rates and intermediate principal stresses.
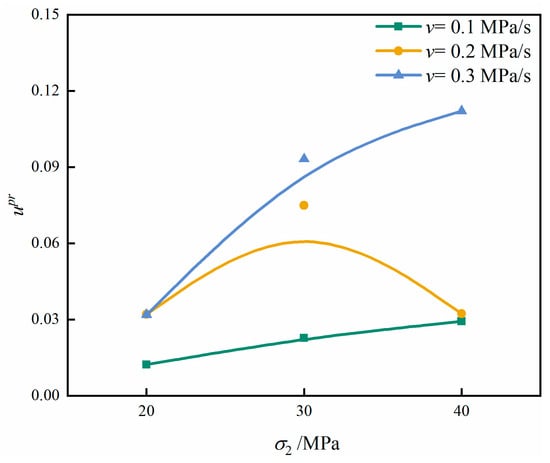
Figure 13.
Released plastic energy conversion rate curve of sandstone.
Under identical intermediate principal stresses, the conversion rate of increases consistently with the unloading rate. This trend demonstrates that higher unloading rates induce more abrupt energy release and correspondingly more intense failure responses. At relatively low unloading rates, the rock has sufficient time for internal stress redistribution and progressive plastic deformation, allowing part of the elastic energy to dissipate in a stable and gradual manner. In contrast, rapid unloading causes elastic energy to accumulate at a rate that exceeds the capacity of the rock to dissipate it through microcrack propagation or grain boundary sliding. As a result, the release of energy during failure becomes sudden and highly concentrated, leading to elevated conversion rates and more violent rupture behavior.
At a constant unloading rate, the conversion rate of generally increases with rising intermediate principal stress. This reflects the dual influence of : on one hand, higher lateral confinement facilitates greater accumulation of elastic strain energy, while on the other hand, once instability initiates, the enhanced confinement accelerates the rate at which this stored energy is released. However, when reaches 40 MPa, a noticeable divergence emerges among the test groups. The conversion rates of Groups 2-7 and 2-8 are nearly identical and markedly lower than that of Group 2-9.
The divergence between Groups 2-7/2-8 and Group 2-9 stems from their fundamentally different failure mechanisms. Groups 2-7 and 2-8 undergo an elastic energy release–type failure, in which the rapid unloading leaves insufficient time for the rock to redistribute stresses or develop stable plastic deformation. As a result, elastic energy is discharged almost instantaneously, and the associated plastic strain is concentrated within an extremely short duration. In contrast, the failure of Group 2-9 is more progressive. Prior to collapse, stress redistribution occurs near the exposed unloading surface, enabling the rock to accumulate substantial plastic deformation. The presence of a distinct yield plateau further promotes the development of plastic strain, leading to a substantially higher conversion rate of during failure.
These findings further demonstrate that the conversion rate of serves as a more direct indicator of failure intensity than the absolute magnitude of energy itself. The non-monotonic behavior observed for = 40 MPa in Figure 13 arises from the same mechanism identified in Figure 9: specimens subjected to unloading rates of 0.1 and 0.2 MPa/s failed abruptly during the unloading stage, causing instantaneous elastic energy release and an early transition in both and . Consequently, the slight decrease in is an intrinsic reflection of unloading-induced brittle failure, rather than an artifact of curve smoothing or numerical processing. From an engineering perspective, conditions that couple high unloading rates with moderate-to-high intermediate principal stresses represent the most hazardous scenario, as they significantly increase the likelihood of violent dynamic phenomena such as spalling or rock burst-like failure. Therefore, regulating excavation rate, optimizing the stress path, and preventing abrupt unloading are essential strategies to reduce catastrophic energy release in deep rock mass engineering.
3.2.4. Characterization of Rock Damage
Figure 14 displays the macroscopic failure characteristics of sandstone under varying intermediate principal stresses and unloading rates. Overall, the specimens exhibit mixed tensile–shear failure; however, the specific manifestations differ markedly depending on the stress path and unloading conditions.
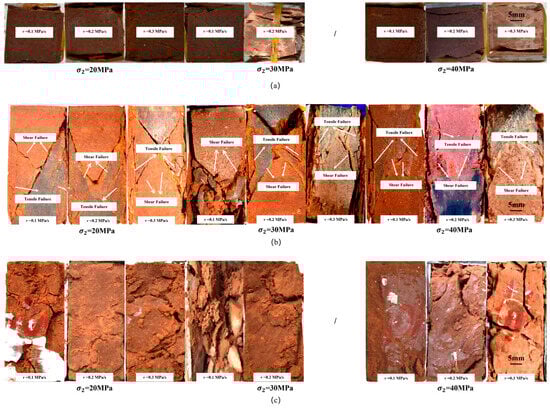
Figure 14.
Damage pattern of sandstone under true triaxial unloading. (a) Stress surfaces; (b) stress surfaces; (c) stress surfaces. Due to the high degree of fragmentation of sandstone in Group 2-6, it is not possible to present the failure images of all stress faces. The failure modes of Group 2-7 and Group 2-8 correspond to burst-like brittle failure rather than dynamic rock burst.
At relatively low , the specimens undergo severe fragmentation, and some stress planes fail to retain complete fracture features. In this regime, the moderate confinement provided by suppresses crack propagation perpendicular to its loading direction, whereas the unloading surface facilitates the development of numerous tensile cracks. These tensile cracks tend to concentrate near the free surface, leading to pronounced fragmentation in that region. Notably, this failure process temporarily enhances the sandstone’s energy storage limit and apparent load-bearing capacity by mobilizing additional elastic energy prior to collapse. As increases further, crack propagation parallel to the intermediate principal stress direction becomes more prominent. This drives the formation of oblique shear planes away from the unloading surface. Once peak strength is exceeded, the specimens fail in the form of relatively intact blocks with reduced fragmentation, signifying a transition from tensile–shear dominated breakup to more localized shear-dominated failure.
Unlike the other groups, Groups 2-7 and 2-8 exhibit failure mechanisms dominated by tensile crack propagation. The resulting fractures develop nearly parallel to the unloading surface and are accompanied by spalling-type tensile fragments. This behavior reflects a clear transition toward unloading-induced tensile failure, in which stress redistribution near the newly formed free surface generates pronounced tensile stress gradients that promote rapid crack opening and localized detachment.
At low unloading rates, sandstone specimens have sufficient time for the development of plastic deformation mechanisms such as microcrack sliding and grain boundary adjustment. These processes inhibit excessive crack branching, resulting in lower crack density and a more stable failure evolution. As the unloading rate increases, however, the release of stress on the minimum principal stress plane becomes increasingly abrupt, generating steep tensile stress gradients. These gradients drive the rapid propagation of tensile cracks perpendicular to the unloading direction, forming dense crack networks. Yet, because the timeframe for damage evolution is significantly constrained, the specimen reaches failure before these cracks can fully develop, leading to an apparent increase in peak strength—effectively an “overestimation” of the rock’s true load-bearing capacity. During this accelerated failure process, energy release becomes highly concentrated, producing a sharp drop in residual strength once instability is triggered.
These observations indicate that rock failure under unloading is governed not only by the magnitude of the intermediate principal stress () but also by the unloading rate. Moderate strengthens lateral confinement yet simultaneously promotes the initiation of tensile cracks near free surfaces, thereby increasing the likelihood of severe fragmentation. In contrast, high unloading rates intensify stress gradients and favor abrupt tensile crack propagation, significantly elevating the risk of dynamic failure phenomena such as spalling or rock burst. Therefore, effective control of both and unloading rate is essential for mitigating unloading-induced instability and ensuring the safety of deep underground excavation.
4. Discussion
The test results demonstrate that energy evolution in sandstone under true triaxial unloading is jointly governed by the intermediate principal stress and the unloading rate. Their interaction shows that unloading-induced instability is essentially a symmetry-breaking process in the energy domain, during which the balance between elastic energy storage and dissipative energy consumption collapses and irreversible deformation becomes dominant.
The increase in enhances the overall intensity of energy conversion and dissipation, but elastic energy storage does not increase monotonically. At moderate , the enhanced lateral confinement suppresses early tensile cracking and delays damage accumulation, promoting a temporary balance between energy storage and dissipation. This protective regime represents a quasi-symmetric state in which the two energy components evolve in coordination. Once exceeds a critical threshold, this balance deteriorates: crack deflection, shear-band interaction, and accelerated stiffness loss lead to a rapid increase in dissipated energy, marking a shift into a dissipation-dominated regime. This transition corresponds to a collapse of energy symmetry, where the system moves from coordinated to irreversible energy evolution, ultimately controlling failure onset.
Unloading rate further modulates the dynamic coupling between energy storage, release, and dissipation. Rapid unloading compresses the time available for microcrack propagation and frictional adjustment, causing elastic energy to accumulate before peak stress. When internal defect density reaches a critical level, elastic energy is suddenly converted into plastic release energy, triggering abrupt deformation and brittle rupture. The apparent increase in pre-peak strength at high unloading rates is therefore not a sign of enhanced stability, but a temporary elastic dominance preceding a sharp symmetry-breaking event. Quantitative comparisons reinforce this mechanism: at = 40 MPa, plastic release energy increases by more than 200% with unloading rate, indicating rapid crack coalescence and accelerated instability.
The combined action of and unloading rate governs not only the magnitude of stored energy but also the timing and sequence of instability. Moderate delays symmetry-breaking, whereas rapid unloading advances it. Their strong coupling determines whether the system undergoes gradual degradation or sudden catastrophic release.
Failure mode classification based on energy evolution, two distinct failure modes are identified: (1) elastic energy release type—rapid elastic accumulation followed by sudden conversion into plastic release energy near peak stress, and associated with brittle failure, high residual stress, and limited precursory deformation; (2) stress concentration type—characterized by a yield plateau and progressive plastic energy growth, which corresponds to distributed cracking, gradual stress redistribution, and wider fractured zones. These modes correspond closely to observed fracture patterns: higher increases shear–compression damage near the unloading surface, whereas high unloading rates promote tensile cracking and abrupt rupture. Thus, energy evolution provides a quantitative basis for classifying failure modes and predicting instability.
The findings indicate that neither increasing nor accelerating unloading should be assumed to enhance stability. Once the system enters the transition zone, both parameters may instead intensify fracture-driven instability. Controlled stress release—via staged excavation, slow unloading, and pre-reinforcement—is therefore essential to delay symmetry-breaking and mitigate dynamic hazards such as spalling or rock burst.
To strengthen generalizability, future studies should integrate true triaxial tests with in situ monitoring and high-resolution CT imaging to capture crack networks during unloading. Numerical simulations under equivalent stress paths can reproduce energy evolution patterns and help identify critical thresholds for symmetry-breaking and failure mode transitions.
5. Conclusions
This study employed a miniature true triaxial-creep-coupled testing system to investigate the coupled effects of intermediate principal stress and unloading rate on the energy evolution and failure behavior of sandstone. The results reveal clear symmetry-breaking characteristics in the transformation between elastic energy storage and dissipative energy release during unloading. The main conclusions are as follows:
- (1)
- Intermediate principal stress exerts a dual, non-monotonic influence on sandstone strength and fracture geometry. Strength increases at moderate due to enhanced lateral confinement and delayed crack initiation, but decreases once exceeds a threshold. Correspondingly, dominant fracture planes rotate toward the direction, reflecting changes in shear localization and crack propagation. This “protective–destabilizing” transition highlights the symmetry-breaking nature of energy evolution under varying .
- (2)
- Dissipated energy governs the unloading process, while elastic and plastic energy components are strongly rate-dependent. Total and dissipated energy conversion rates increase monotonically with , whereas elastic energy conversion first rises and then declines. Higher unloading rates significantly amplify the rates of energy accumulation and dissipation, demonstrating a temporal mismatch between stress redistribution and crack evolution—an important mechanism driving instability.
- (3)
- Plastic energy release provides a sensitive indicator of impending failure mode. With increasing unloading rate, plastic release energy grows continuously, leading to abrupt and concentrated energy discharge. In contrast, its relationship with is non-monotonic, first increasing and then decreasing beyond a critical level. These trends confirm that plastic energy release can be used to quantitatively distinguish elastic energy–release type failures from stress–concentration dominated failures.
- (4)
- Sandstone predominantly exhibits tensile–shear composite failure, modified by σ2 and unloading rate. Higher promotes microcrack proliferation and enhances fragmentation near the unloading surface, whereas rapid unloading accelerates tensile cracking and brittle collapse. These findings emphasize that both stress path and loading rate play decisive roles in regulating the final failure mode.
- (5)
- Unloading rate exerts a quantitatively significant, instability-controlled effect on energy release. Faster unloading triggers earlier crack initiation, reduces peak elastic energy, and drastically increases plastic release energy—by up to 241% under high . Thus, unloading kinetics governs not only the magnitude of energy release but also the timing and intensity of failure.
Overall, the results show that neither elevated nor rapid unloading unconditionally improves stability. Instead, critical thresholds and transition zones exist where the symmetry between energy storage and energy dissipation is broken, leading to sudden failure. These insights support the adoption of controlled or staged unloading, pre-reinforcement, and real-time energy monitoring in deep underground engineering. The demonstrated energy-based symmetry–breaking framework provides a unified physical understanding of rock instability under true triaxial unloading.
Author Contributions
Conceptualization, X.Z., W.Y. and J.Y.; Methodology, X.Z., W.Y. and J.Y.; Software, J.Y.; Validation, X.Z., W.Y. and J.Y.; Formal analysis, Z.Y. and E.F.; Investigation, J.Y.; Resources, X.Z. and W.Y.; Data curation, Z.Y. and E.F.; Writing—original draft, Z.Y.; Writing—review and editing, Z.Y.; Visualization, Z.Y. and E.F.; Supervision, X.Z. and W.Y.; Project administration, X.Z. and W.Y.; Funding acquisition, X.Z. and W.Y. All authors have read and agreed to the published version of the manuscript.
Funding
This work is supported by the National Natural Science Foundation of China (42077254); Natural Science Foundation of Xiamen (3502Z202372047).
Data Availability Statement
The original contributions presented in this study are included in the article. Further inquiries can be directed to the corresponding author.
Conflicts of Interest
The authors declare that the research was conducted in the absence of any commercial or financial relationships that could be construed as potential conflicts of interest.
References
- He, M.; Wang, Q. Rock dynamics in deep mining. Int. J. Min. Sci. Technol. 2023, 33, 1065–1082. [Google Scholar] [CrossRef]
- Feng, X.; Xu, H.; Yang, C.; Zhang, X.; Gao, Y. Influence of Loading and Unloading Stress Paths on the Deformation and Failure Features of Jinping Marble Under True Triaxial Compression. Rock Mech. Rock Eng. 2020, 53, 3287–3301. [Google Scholar] [CrossRef]
- Li, X.; Cao, W.; Zhou, Z.; Zou, Y. Influence of stress path on excavation unloading response. Tunn. Undergr. Space Technol. 2014, 42, 237–246. [Google Scholar] [CrossRef]
- Xie, H.; Lu, J.; Li, C.; Li, M.; Gao, M. Experimental study on the mechanical and failure behaviors of deep rock subjected to true triaxial stress: A review. Int. J. Min. Sci. Technol. 2022, 32, 915–950. [Google Scholar] [CrossRef]
- Maneepong, P.; Leelasukseree, C.; Pipatpongsa, T.; Sangkhaphan, P.; Maneewat, T.; Chaiwan, A. Rock slope stability and hydromechanical coupling evaluation on the relay ramp-controlled failure mechanism in Mae Moh Mine, Thailand. Int. J. Rock Mech. Min. Sci. 2025, 191, 19. [Google Scholar] [CrossRef]
- Zhang, A.; Xie, H.; Zhang, R.; Gao, M.; Xie, J.; Jia, Z.; Ren, L.; Zhang, Z. Mechanical properties and energy characteristics of coal at different depths under cyclic triaxial loading and unloading. Int. J. Rock Mech. Min. Sci. 2023, 161, 18. [Google Scholar] [CrossRef]
- Xu, D.; Zhang, P.; Yan, W.; Zhang, X.; Dong, Y.; Niu, H. Mechanical Properties and Energy of Sandstone Under Cyclic Loading in Evolutionary Pattern Experimental Studies. Arch. Min. Sci. 2023, 68, 351–370. [Google Scholar] [CrossRef]
- Zhang, Q.; Meng, X.; Zhao, G.; Liu, C.; Liu, Z.; Wu, X. Energy dissipation and damage mechanism of rocks under true triaxial graded perturbations. Soil Dyn. Earthq. Eng. 2025, 190, 12. [Google Scholar] [CrossRef]
- Gao, M.; Xie, J.; Gao, Y.; Wang, W.; Li, C.; Yang, B.; Liu, J.; Xie, H. Mechanical behavior of coal under different mining rates: A case study from laboratory experiments to field testing. Int. J. Min. Sci. Technol. 2021, 31, 825–841. [Google Scholar] [CrossRef]
- Feldman, E.; Kalugina, N. Supercritical growth of gas-filled cracks in gas-bearing coal/rock seams during compressive stress unloading. Philos. Mag. 2025, 13, 813–825. [Google Scholar] [CrossRef]
- Gautam, P.; Dwivedi, R. Effect of Loading Rate on the Progressive Damage and Crack Classification of Granite Based on Acoustic Emission Technique. Arab. J. Sci. Eng. 2024, 49, 839–861. [Google Scholar] [CrossRef]
- Walton, G.; Gaines, S. Evaluation of stress path and load rate effects on rock strength using compression testing data for Stanstead Granite. Int. J. Rock Mech. Min. Sci. 2023, 169, 13. [Google Scholar] [CrossRef]
- Zheng, K.; Shi, C.; Lou, Y.; Jia, C.; Lei, M.; Yang, Y. A computational method for tunnel energy evolution in strain-softening rock mass during excavation unloading based on triaxial stress paths. Comput. Geotech. 2024, 169, 16. [Google Scholar] [CrossRef]
- Lu, J.; Yin, G.; Gao, H.; Li, X.; Zhang, D.; Deng, B.; Wu, M.; Li, M. True Triaxial Experimental Study of Disturbed Compound Dynamic Disaster in Deep Underground Coal Mine. Rock Mech. Rock Eng. 2020, 53, 2347–2364. [Google Scholar] [CrossRef]
- Miao, S.; Liu, Z.; Zhao, X.; Ma, L.; Zheng, Y.; Xia, D. Plastic and damage energy dissipation characteristics and damage evolution of Beishan granite under triaxial cyclic loading. Int. J. Rock Mech. Min. Sci. 2024, 174, 18. [Google Scholar] [CrossRef]
- Zhou, S.; Li, S.; Zhao, J.; Zhao, Y.; Jiang, Q. Temperature-dependent hardening and constitutive modelling of frozen rocks: Insights into plastic energy dissipation. Comput. Geotech. 2025, 184, 19. [Google Scholar] [CrossRef]
- Su, L.; Roshan, H. Mechanisms of strain rate-dependent response of naturally fractured coal. Int. J. Coal Geol. 2025, 300, 24. [Google Scholar] [CrossRef]
- Peng, Y.; Dongdong, P.; Ju, L.; Zhiguo, H.; Wensong, X.; Zhongsi, D. Experiment on deformation and failure characteristics of sandstone at different unloading rates. Alex. Eng. J. 2023, 75, 209–219. [Google Scholar] [CrossRef]
- Li, X.; Gong, F.; Tao, M.; Dong, L.; Du, K.; Ma, C.; Zhou, Z.; Yin, T. Failure mechanism and coupled static-dynamic loading theory in deep hard rock mining: A review. J. Rock Mech. Geotech. Eng. 2017, 9, 767–782. [Google Scholar] [CrossRef]
- Liu, Z.; Cao, P.; Zhao, Q.; Cao, R.; Wang, F. Deformation and damage properties of rock-like materials subjected to multi-level loading-unloading cycles. J. Rock Mech. Geotech. Eng. 2023, 15, 1768–1776. [Google Scholar] [CrossRef]
- Chen, Y.; Zuo, J.; Li, Z.; Dou, R. Experimental investigation on the crack propagation behaviors of sandstone under different loading and unloading conditions. Int. J. Rock Mech. Min. Sci. 2020, 130, 10. [Google Scholar] [CrossRef]
- Zhao, Y.; Bi, J.; Wang, C.; Liu, P. Effect of Unloading Rate on the Mechanical Behavior and Fracture Characteristics of Sandstones Under Complex Triaxial Stress Conditions. Rock Mech. Rock Eng. 2021, 54, 4851–4866. [Google Scholar] [CrossRef]
- Xu, H.; Feng, X.; Yang, C.; Zhang, X.; Zhou, Y.; Wang, Z. Influence of initial stresses and unloading rates on the deformation and failure mechanism of Jinping marble under true triaxial compression. Int. J. Rock Mech. Min. Sci. 2019, 117, 90–104. [Google Scholar] [CrossRef]
- Jiang, Q.; Zhang, M.; Yan, F.; Su, G.; Feng, X.; Xu, D.; Feng, G. Effect of initial minimum principal stress and unloading rate on the spalling and rockburst of marble: A true triaxial experiment investigation. Bull. Eng. Geol. Environ. 2021, 80, 1617–1634. [Google Scholar] [CrossRef]
- Duan, K.; Ji, Y.; Wu, W.; Kwok, C. Unloading-induced failure of brittle rock and implications for excavation induced strain burst. Tunn. Undergr. Space Technol. 2019, 84, 495–506. [Google Scholar] [CrossRef]
- Wang, Y.; Du, W.; Zhang, D.; Yu, B. Effect of Loading and Unloading Rates on Sandstone Deformation and Dilatancy under True Triaxial Condition. Sustainability 2023, 15, 5105. [Google Scholar] [CrossRef]
- Pan, C.; Liu, C.; Zhao, G.; Yuan, W.; Wang, X.; Meng, X. Fractal Characteristics and Energy Evolution Analysis of Rocks under True Triaxial Unloading Conditions. Fractal Fract. 2024, 8, 387. [Google Scholar] [CrossRef]
- Meng, Q.; Liu, J.; Pu, H.; Huang, B.; Zhang, Z.; Wu, J. Effects of cyclic loading and unloading rates on the energy evolution of rocks with different lithology. Geomech. Energy Environ. 2023, 34, 19. [Google Scholar] [CrossRef]
- Song, Z.; Konietzky, H.; Wu, Y.; Du, K.; Cai, X. Mechanical behaviour of medium-grained sandstones exposed to differential cyclic loading with distinct loading and unloading rates. J. Rock Mech. Geotech. Eng. 2022, 14, 1849–1871. [Google Scholar] [CrossRef]
- Xue, Y.; Ranjith, P.; Gao, F.; Zhang, D.; Cheng, H.; Chong, Z.; Hou, P. Mechanical behaviour and permeability evolution of gas-containing coal from unloading confining pressure tests. J. Nat. Gas Sci. Eng. 2017, 40, 336–346. [Google Scholar] [CrossRef]
- Zhao, H.; Song, Z.; Zhang, D.; Liu, C.; Yu, B. True triaxial experimental study on mechanical characteristics and energy evolution of sandstone under various loading and unloading rates. Geomech. Geophys. Geo-Energy Geo-Resour. 2021, 7, 17. [Google Scholar] [CrossRef]
- Si, X.; Gong, F. Strength-weakening effect and shear-tension failure mode transformation mechanism of rockburst for fine-grained granite under triaxial unloading compression. Int. J. Rock Mech. Min. Sci. 2020, 131, 15. [Google Scholar] [CrossRef]
- Wang, Y.; Liu, D.; Han, J.; Li, C.; Liu, H. Effect of fatigue loading-confining stress unloading rate on marble mechanical behaviors: An insight into fracture evolution analyses. J. Rock Mech. Geotech. Eng. 2020, 12, 1249–1262. [Google Scholar] [CrossRef]
- Gao, H.; Xie, H.; Zhang, R.; Zhang, Z.; Gao, M.; Lu, J.; Wu, M.; Li, Y.; Xie, H. Effect of True Triaxial Loading and Unloading Rates on the Mechanical Properties of Deep Rock. Rock Mech. Rock Eng. 2025, 58, 9047–9071. [Google Scholar] [CrossRef]
- Liu, Z.; Zhao, G.; Meng, X.; Gu, Q. Calculation method and evolution rule of the strain energy density of sandstone under true triaxial compression. Sci. Rep. 2024, 14, 17. [Google Scholar] [CrossRef]
- Peng, R.; Ju, Y.; Wang, J.; Xie, H.; Gao, F.; Mao, L. Energy Dissipation and Release During Coal Failure Under Conventional Triaxial Compression. Rock Mech. Rock Eng. 2015, 48, 509–526. [Google Scholar] [CrossRef]


Disclaimer/Publisher’s Note: The statements, opinions and data contained in all publications are solely those of the individual author(s) and contributor(s) and not of MDPI and/or the editor(s). MDPI and/or the editor(s) disclaim responsibility for any injury to people or property resulting from any ideas, methods, instructions or products referred to in the content. |
© 2025 by the authors. Licensee MDPI, Basel, Switzerland. This article is an open access article distributed under the terms and conditions of the Creative Commons Attribution (CC BY) license (https://creativecommons.org/licenses/by/4.0/).