Abstract
Subway stations are enclosed spaces with high passenger density and complex evacuation conditions. Fires in such environments can escalate rapidly and cause severe consequences. This study proposes a dynamic risk assessment model grounded in dual symmetries. The first symmetry is a balanced “Human–Machine–Environment–Management” analytical structure. The second is a coherent model transformation from a Fault Tree (FT) to a Bayesian Network (BN). Shuanggang Station on Nanchang Metro Line 1 serves as a case study. This work establishes a comprehensive evaluation system based on 4 first-level indicators of man–machine–environment–management, 9 secondary indicators, and 27 tertiary indicators. FT analysis identified 117 minimal cuts and 14 minimal paths, pinpointing core risk nodes such as flammable materials and oxidizers, electrical equipment overheating, and fire management deficiencies. The model was then symmetrically converted into a BN using GeNle Academic 4.1 software to support dynamic probability inference. The results show that prevention measures at Shuanggang Station reduce the fire occurrence probability from 0.000249 to 0.00007 (a 71.9% reduction). The probability importance of rescue escape routes is 0.00223. This indicates that the accessibility of rescue routes constitutes a highly sensitive hazard. The symmetric framework and modeling approach offer a scientific basis for targeted fire prevention, control, and evacuation management in the Nanchang Metro and similar stations. The findings support improvements in the safety and resilience of metro operations.
1. Introduction
By the end of 2024, China’s urban rail transit network reached a total length of 10,900 km, with annual passenger volume exceeding 32.24 billion trips (averaging approximately 88.21 million trips per day). As the lifeline of cities, its efficiency and convenience conceal multiple risks. Industry research indicates that fires account for 65% of subway safety incidents, representing the most frequent and severe disasters in underground spaces [1,2,3,4,5]. Notable cases include the 1987 King’s Cross Station fire in London (32 fatalities) and the 2003 Daegu subway arson attack in South Korea (198 fatalities) [6,7]. Since China’s subway operations began, over 150 fires have occurred, with more than 70% stemming from electrical faults, equipment aging, and human factors [8]. Recent studies confirm that major subway fires continue to occur globally, reflecting persistent safety hazards and deficiencies in emergency management and technical support [3,8,9,10].
Systematic research on subway fires has gradually formed a multidimensional research framework since the 1990s, driven by typical accidents such as the New York subway derailment fire in the United States and the Daegu subway fire in South Korea. In terms of risk assessment and decision-making methods, scholars are committed to integrating multivariate technologies to enhance the assessment accuracy. Yan and Wang [11] enhanced the objectivity of the evaluation process by coupling the Interval Analytic Hierarchy Process (IAHP) with the fuzzy evaluation method. Li et al. [12] constructed a probabilistic model for scenario evolution based on the Bayesian Network, realizing a quantitative analysis of key elements of the fires. Ju et al. [13] performed a quantitative analysis of the key elements of fires based on the combination weighting of game theory and Technique for Order Preference by Similarity to an Ideal Solution (TOPSIS) method to balance the subjective and objective evaluation bias.
The severe consequences of a fire in the subway are mainly caused by structural damage due to high temperatures, panic-induced stampedes, delays in rescue by firefighters due to difficulty in finding their way, and secondary accidents that further hinder the evacuation of people. Lin et al. [14] conducted an experiment at the New Taipei Fire Department, using a self-assessment survey containing 13 factors to analyze firefighters’ profiles and evaluate the relationship between these factors and navigation time in complex environments. Aghaei et al. [15] proposed a safety decision-making method combining Fuzzy Fault Tree (FFT) and numerical simulation, while Li and Rong [16] and Khakzad et al. [17] constructed a dynamic probabilistic iterative mechanism through Bayesian Network and Bowtie model, which achieves the prior information correction and serialized data training. In addition, Lin et al. [18] analyzed the disaster mechanism based on mutation theory, Yan et al. [19] used system dynamics to analyze the influencing factors, and Zhang et al. [20] optimized the simulation of evacuation paths by combining with the Improved Social Force Model, which significantly improved the simulation accuracy of emergency response.
In terms of modeling, scholars have used different theories and methods to study the dynamic characteristics of subway fires. Wu et al. [21] identified core risks from 38 factors by constructing a dynamic Bayesian Network model. Lin et al. [18] applied mutation theory to analyze the dynamic process of subway fires, exploring the causes of subway fires from the fire triangle and the four elements of accidents. Wu et al. [8] developed a comprehensive model based on Bayesian Networks (BN) and the Delphi method. This Bayesian Network model enables quantitative assessment of factors influencing fire causes, fire prevention measures, and fire consequences [22,23]. Yan et al. [19] constructed a simulation model of a subway fire accident based on system dynamics, considering the impact of people, equipment, environment, and emergency management on the occurrence, spread, and control of fires.
This study advances subway fire-risk assessment by integrating Fault Tree (FT) causal analysis with BN dynamic inference to address gaps in passenger-related and model-updating research. FT identifies causal chains, while BN enables bidirectional, scenario-based risk updating. A dual-symmetric framework is proposed, maintaining structural equivalence between FT and BN within a balanced Human–Machine–Environment–Management (HMEM) system. A high-granularity indicator set capturing passenger psychology and behavior is developed, and a dynamic BN model is constructed for multi-scenario risk evaluation. Using Nanchang’s Line 1 and Shuanggang Station as a case study, localized parameter adjustments and GeNle simulations demonstrate regional sensitivity and validate the model’s adaptability.
2. Methodology and Modeling
2.1. Fault Tree Analysis
2.1.1. Evaluation System Construction
Based on the four-dimensional framework of HMEM, an assessment system with 4 primary indicators, 9 secondary indicators and 27 tertiary indicators was established (Table 1). Table 1 is compiled from the statistics and qualitative findings reported in previous studies on subway and tunnel fire incidents [2,3,4,5,6,7,8,9,10,11,12,13,15,16,17,18,19,20], combined with national fire incident reports and metro design codes.

Table 1.
Statistics on key causes of subway fire accidents.
In this paper, 27 factors are represented in symbols, as shown in Table 2 below. Figure 1 shows the subway fire FT model. The structure of the fault tree is derived from the causes of subway fire accidents summarized in Table 1 and the requirements of Chinese metro design and fire safety codes.
Table 2.
Fault tree incident descriptions and symbols.
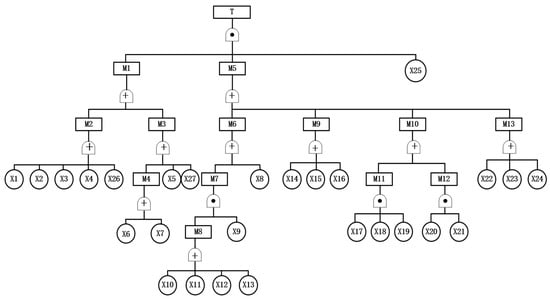
Figure 1.
Subway fire fault tree model.
2.1.2. Fault Tree Qualitative Analysis
- (1)
- Minimum cut set
Based on the fault tree in Figure 1 and the logic gate relationship, the minimum cut sets obtained using Boolean algebra [24] are as follows:
For x1:
{x1,x8,x25},{x1,x9,x10,x25},{x1,x9,x11,x25},{x1,x9,x12,x25},{x1,x9,x13,x25},{x1,x14,x25},{x1,x15,x25},{x1,x16,x25},{x1,x17,x18,x19,x25},{x1,x20,x21,x25},{x1,x22,x25},{x1,x23,x25},{x1,x24,x25}.
Similarly, replace x1 with x2,x3,x4,x5,x6,x7,x26,x27 in sequence to obtain 117 minimum cut sets:
{xi,x8,x25},{xi,x9,x10,x25},{xi,x9,x11,x25},{xi,x9,x12,x25},{xi,x9,x13,x25},{xi,x14,x25},{xi,x15,x25},{xi,x16,x25},{xi,x17,x18,x19,x25},{xi,x20,x21,x25},{xi,x22,x25},{xi,x23,x25},{xi,x24,x25},(i = 1,2,……,7,26,27).
It can be known that there are 117 pathways that cause subway fire accidents; the fewer the number of basic events contained in each pathway, the higher the degree of danger and the more likely subway fire accidents are to occur.
- (2)
- Structural Importance Analysis
The structural importance ranking can be obtained from the analysis as:
I(x25) > I(x1) = I(x2) = I(x3) = I(x4) = I(x5) = I(x6) = I(x7) = I(x26) = I(x27) > I(x8) = I(x14) = I(x15) = I(x16) = I(x22) = I(x23) = I(x24) > I(x9) > I(x20) = I(x21) > I(x17) = I(x18) = I(x19) > I(x10) = I(x11) = I(x12) = I(x13).
By analyzing the structural importance ranking, it is shown that combustibles and oxidants are necessary conditions for the occurrence of fire, the lack of fire cannot occur, x1-x7,x26,x27 are the fundamental factor affecting fire accidents. These factors are the direct cause of fire, any one of them may directly cause a fire, which is the core of the source of factors. x8,x14-x16,x22-x24 are the importance of the intermediate level. These factors seriously affect the fire accidents after the occurrence of rescue efficiency and personnel evacuation effect, which is the key factor affecting the consequences of the fire. x9 is the key to the early detection of fire, if the function is ineffective, it will lead to delays in the discovery of the fire and miss the best time to fight it. x10-x13 and x20-x21 are the key link between firefighting and personnel self-protection; its failure will weaken firefighting ability and the personnel self-help effect, therefore aggravating the hazards of the accident. x17-x19 belong to the human organization and management factors, although the importance of them is relatively low, they affect the orderliness of emergency response and have a certain role in fire control.
2.1.3. Fault Tree Quantitative Analysis
- (1)
- Top-event occurrence probability
The probability calculation formula of the top event T is shown as [25]:
where denotes the j th minimum cut set, denotes the probability of the ith basic event in the minimum cut set occurring at time t. If there is an intersection in the minimum cut set, the probability formula of the compatible event is used to calculate, and the non-intersection and processing are performed. The calculation formula is shown as [25]:
A panel of eight experts was invited to provide probabilistic judgments for the basic events, including four senior safety managers from Nanchang Metro Line 1 (each with more than ten years of operational experience) and four professors specializing in fire safety and transportation engineering. To capture the epistemic uncertainty and to systematically transform linguistic terms (e.g., ‘low’, ‘medium’, ‘high’) into numerical values, triangular fuzzy numbers were employed. The fuzzy evaluations of individual experts were aggregated and then defuzzified to obtain the prior probabilities of the basic events. In the BN structure, statistical independence between all variables is not assumed; rather, the dependencies are explicitly described by the directed arcs. This structural representation, together with the expert aggregation process, helps reduce the impact of individual bias. The correspondence between each natural language variable and triangular fuzzy number is shown in Table S1 in the Supplementary Materials. The summary table of expert evaluations is shown in Table S2.
To eliminate the extreme values in the expert scoring data, this paper uses the Interquartile Range (IQR) in statistics. Firstly, for each event of the triangular fuzzy number of parameters (ai, bi, ci), collect all experts’ scoring values, compile them into independent datasets, and then rank the results. Secondly, determine the first quartile (Q1), located in the dataset 25% position of the value, if the dataset has n data Q1 position is , the corresponding value after rounding. Thirdly, determine the third quartile (Q3), values located at the 75% position of the dataset at position; calculation of the IQR, ; to determine the range of extreme values, lower limit:, upper limit:. Data outside this range are eliminated.
The remaining valid scores are then averaged to obtain the aggregated fuzzy number :
where is the number of mutually independent basic events. Then adopt the central method:
- (2)
- Probability importance analysis
Probability importance reflects the sensitivity of the increase or decrease in basic events to the probability of top events and is a key transition factor in calculating the other importance coefficients [25]. The calculation equation is shown as:
where represents the probability importance of the ith event, represents the probability of the top event, and represents the unreliability of the top event.
The results calculated using Equation (5) are shown in the probability importance degree of Table 3.
Table 3.
Key probability parameters of basic events.
The order of the probability importance of each basic event is shown as:
x1 = x6 = x7 = x27 > x8 > x25 > x9 > x14 > x5 > x13 > x10 = x11 = x12 = x15 = x16 = x19 > x4 > x18 > x2 = x3 > x17 = x20 > x26 > x21
= x22 = x23 = x24.
Table 3 indicates that the probability importance of train accidents, arson, explosions, and surrounding fires spreading to the subway are all 0.0821, ranking first. An increase in the probability of these four basic events occurring would significantly raise the probability of the fire occurring. The table also indicates that the probability importance of electrical equipment overheating is 0.00781. The probability importance of these four basic events is 100 times that of electrical equipment overheating. This demonstrates that these four basic events exert a greater influence on the probability of the top event occurring than electrical equipment overheating does. Consequently, they should be prioritized for attention and control in risk prevention.
- (3)
- Critical importance analysis
Critical importance is the sensitivity of the system failure probability to a subsequent change in the failure rate of the ith basic event in the system and the magnitude of the probability of occurrence of that basic event itself [26]. The calculation equation is shown as:
where represents the critical importance coefficient of the ith basic event xi. The results calculated through Equations (3)–(6) are shown in the critical importance of Table 3.
Critical importance reflects the significance of a fundamental event from both sensitivity and its own occurrence probability. According to the critical importance of Table 3, the critical importance of x25 is 0.99. Its critical importance is the highest, significantly impacting the probability of the top event, indicating that improving this event yields the most pronounced effect in reducing the top event’s occurrence probability. The critical importance of Table 3 further indicates that x9 has a critical importance of 0.308, suggesting that enhancing the reliability of detection and alarm systems can also effectively mitigate risk.
2.2. Bayesian Network Analysis
2.2.1. Basic Theory of Bayesian Network
The Bayesian Network in this study is built by mapping the FT events into BN nodes and arcs, so that the causal structure of subway fire risk is preserved. The conditional probability tables for each node are defined based on expert elicitation and triangular fuzzy numbers, enabling dynamic inference of the probability of a subway fire accident under different combinations of basic events.
Bayesian Networks are based on probability theory. For key concepts and formulas involved, please refer to File S3 of Supplementary Materials. Bayes theorem is given as follows [27]:
To build a Bayesian Network model, it is first necessary to clarify the causal relationships between nodes. Various approaches and methods can be used to optimize and update the influence status of nodes in the evaluation system. On this basis, the Bayesian Network topology is constructed, and the conditional probability tables between nodes are quantified, thereby completing the model construction. Figure 2 is an example of a Bayesian Network model.
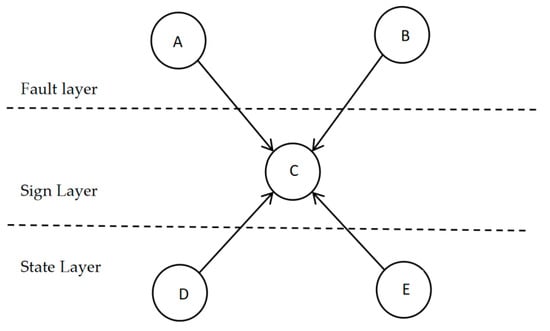
Figure 2.
Example of a Bayesian Network model.
2.2.2. Mapping Relationship Construction
- (1)
- The mapping relationship from fault tree to Bayesian Network
From the perspective of systems and safety engineering, the idea of modeling symmetry or balance has been extensively explored in the reliability analysis of balanced systems. In such systems, components are arranged in symmetric positions and the system state is evaluated based on the degree of balance among functionally equivalent units [28,29]. Recently, Liu et al. [30] proposed a deep-reinforcement-learning-based maintenance optimization scheme for multi-unit balanced systems, further highlighting that explicitly modeling structural symmetry can improve decision-making efficiency and robustness. Inspired by these balanced-system frameworks, the symmetric fault tree and dynamic Bayesian Network structure proposed in this paper treats redundant or functionally similar subway subsystems in a mirrored manner, enabling more consistent risk propagation and inference across parallel branches of the safety system. There is a correspondence between the events and logic gates of the fault tree and the nodes and linkage strengths of the Bayesian Network, and by utilizing the mapping linkage between the two, the fault tree can be converted into a Bayesian Network to accurately calculate the probability distribution of the subway fire failure. The mapping relationship between fault trees and Bayesian Networks is shown in Table 4.
Table 4.
Mapping relationships.
- (2)
- The mapping of logic gates to interlocks strength
According to the logic of the AND gate structure, the conditional probability distribution can be derived:
According to the OR-gate structure logic, a conditional probability distribution can be obtained:
2.3. Subway Fire Accident Modeling Based on GeNle Software
GeNle software is a widely used tool in the fields of uncertainty inference, risk analysis and reliability assessment, which is mainly used for modeling and analysis of Bayesian Networks and influence diagrams [31]. It provides a graphical interface that facilitates the construction of complex probabilistic models, the setting of dependencies between nodes, and probabilistic inference and prediction. The Bayesian Network was implemented and analyzed using GeNIe Academic 4.1, which provides exact inference based on the junction tree algorithm and built-in sensitivity analysis tools. The network structure was manually defined according to the fault tree, and the conditional probability tables were input based on the expert-derived probabilities. The Bayesian Network obtained from the fault tree mapping is shown in Figure 3.
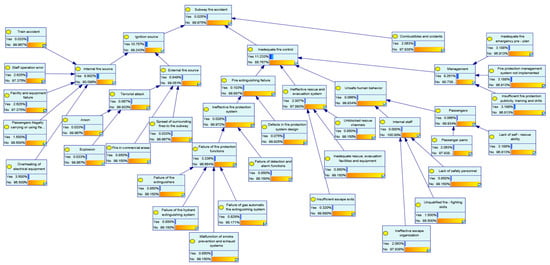
Figure 3.
Bayesian Network model of subway fire accident after inputting prior probabilities.
- (1)
- Determine the prior probability of the root node
The prior probability of the root node of the Bayesian Network is shown in Table 5.
Table 5.
Prior probability of root node in Bayesian Network.
- (2)
- Determine the conditional probability table of non-root nodes
The conditional probability table of non-root nodes can be obtained. Through the fault tree model in Figure 1, in the case of nodes and as ‘or’, ‘and’ relationships, the corresponding conditional probabilities can refer to Table 6 and Table 7. The conditional probability table of other nodes can also be obtained in a similar way.
Table 6.
Conditional probability table of node M9.
Table 7.
Conditional probability table of node M11.
3. Results and Discussion
3.1. Analysis of Bayesian Network Model of Subway Fire Accident
Under the condition of “subway fire accident” leaf node occurrence, the maximum possible explanation can be found out using the diagnostic function of GeNle software; the diagnostic results are shown in Figure 4. The occurrence probabilities of “inadequate fire control”, “ignition source”, and “internal fire source” are relatively high, at 0.112, 0.108, and 0.099, respectively, making them key factors in the prevention and control of subway fire accidents. These factors should be given priority attention, such as strengthening control over ignition sources and enhancing fire prevention and control capabilities. “Insufficient fire publicity, training and drills”, “fire management system is not implemented”, “fire emergency plan is not in place” and other management-related factors also have a certain probability. It is necessary to strengthen fire management, implement the system, and strengthen the training and rehearsal. “Electrical equipment overheating”, “employee operating errors”, “facilities and equipment failure” and other factors related to equipment and personnel operation, may also cause accidents. It is necessary to strengthen equipment maintenance management and employee operational standard training.
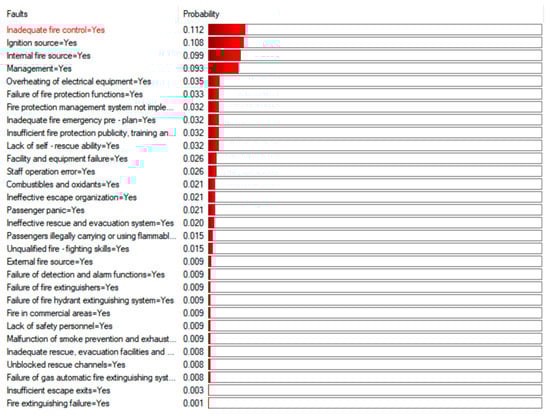
Figure 4.
Diagnostic results.
- (1)
- Posterior probability analysis
Posterior probabilistic inference is the probability obtained by recalculating the likelihood of an event based on certain known conditions. Under certain known conditions recalculating the probability of the event allows us to more accurately grasp the possibility of the event, to provide a more reliable basis for decision-making. Using past experience analysis or statistical data, the prior probability of a subway fire accident is found to be 0.000249, which is similar to the 0.000246 calculated by the fault tree, indicating that the established model is feasible. Using the BN probability update method [25], the target node probability is set to 100%, and finally the posteriori probability of the root node is obtained. Figure 5 shows the Bayesian Network of posterior probability of subway fire accident. According to Figure 5, the root node posterior probability is obtained as shown in Table 8.
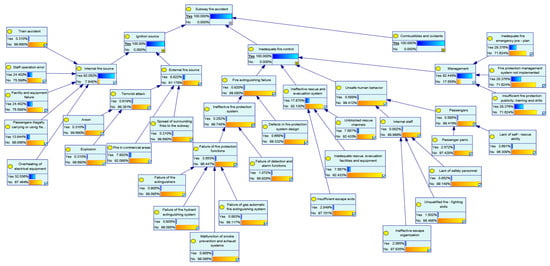
Figure 5.
Bayesian Network model of subway fire accident after inputting posterior probabilities.
Table 8.
Posterior probability of root nodes.
As shown in Table 8, the factors can be mainly divided into the following categories:
Significantly increased category: x25, indicates that when the subway fire accident is determined to occur, this factor is very likely to exist, highlighting its key position in the cause of the fire, and mismanagement is likely to be an important cause of the fire. x22. x23, x24, indicate that the actual impact of these management factors in the event of a fire increases, suggesting that daily management needs to attach great importance to fire prevention, system implementation, and plan improvement. x26, indicates that overheating of electrical equipment is more likely to occur in a fire scenario and that inspection and maintenance of electrical equipment should be strengthened.
Moderate growth: x2, x3, mean that staff operations and the condition of facilities and equipment play a more negative role in the event of a fire, and that staff training and equipment maintenance should be strengthened. x4, indicates that the likelihood of passengers violating the law has increased, and that security inspections and safety education need to be strengthened.
Relatively small growth categories: x1, x6, x7, x19, x27, are not main factors.
- (2)
- Sensitivity analysis
Sensitivity analysis in GeNle software helps to determine which variables have the greatest impact on the output results of the model, so as to better understand the behavior of the model and make decisions. In this paper, GeNle software is used to analyze and evaluate the sensitivity of subway fires, and the results are shown in Figure 6.
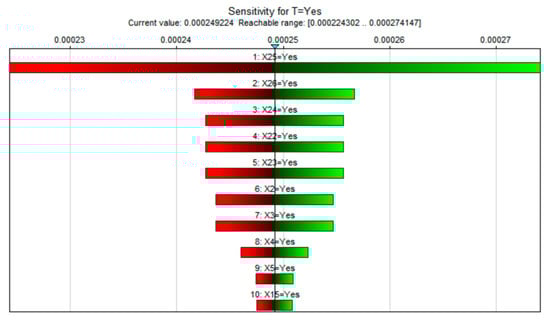
Figure 6.
Sensitivity analysis results of subway fire.
From Figure 6 the degree of influence on the target result is sorted from large to small, x25 > x26 > x24 > x22 > x23 > x2 > x3 > x4 > x5 > x15.
To better demonstrate sensitivity analysis, quantitative indicators based on variance were added, and their stability was verified under different scenarios. Building on the Tornado analysis in GeNIe, we approximated the posterior probability of the top event (subway fire accident) as a linear function of each basic event parameter. For each parameter, the Tornado diagram provides the admissible parameter range and the derivative, which we used to construct a local linear response model. Assuming each parameter follows a uniform distribution within its allowable range, we estimated the variance contribution of each parameter to the probability of the top event and defined a normalized variance-based sensitivity index. The results are reported in Table 9.
Table 9.
Variance sensitivity analysis index for subway fires.
Through the variance sensitivity analysis in Table 9, the ranking of each indicator is as follows: x25 > x26 > x2 = x3 > x23 = x22 = x24 > x4 > x5 > x15. The following are detailed suggestions for the prevention and control of subway fire accidents based on the general model. The diagnostic results of the general Bayesian Network indicate that x25 (combustible materials) exerts the strongest influence on the top event. Measures should therefore focus on the compartments that contribute most to the posterior probability of x25, including stores and equipment rooms. In these areas, allowable quantities of combustibles should be strictly limited, non-combustible materials should be preferred along evacuation corridors, and inspection intervals should reflect the contribution of these spaces to the node probability.
x26 (electrical overheating) appears in multiple minimal cut sets, indicating its central role in ignition. Technical staff should therefore conduct risk-based inspections that prioritize transformers, distribution boxes and other components identified by the model as high-impact. In these locations, load planning and temperature monitoring should be strengthened to reduce the likelihood of x26 entering a failure state.
For x2 and x3, strengthen employee training to advance professional competence and safety awareness. Implement role-specific procedures, regular skill assessments, and full lifecycle management of facilities and equipment, with scheduled maintenance and performance testing of fire-protection, electrical, ventilation, and other critical systems to ensure optimal reliability.
For the management-related nodes x22, x23 and x24, fire safety education, system implementation, and emergency plan refinement should be prioritized for the organizational units corresponding to these nodes. Emergency drills should simulate fire locations with higher probabilities and should be used to update the plan dynamically.
x4 is closely linked to the ignition-source branch of the network. Therefore, security screening should be strengthened at access points that the model identifies as higher risk, accompanied by clear warnings and enforcement to reduce the likelihood of x4.
For x5, the model shows that commercial areas connected to dense passenger flows create higher downstream risk. Therefore, inspections, electrical safety measures and early-warning devices should be prioritized in these specific commercial zones.
For x15, which represents evacuation path failures, the risk of casualties once a fire occurs is markedly increased. Therefore, measures should target the evacuation routes and facilities that appear on dominant evacuation paths in the model, ensuring unobstructed channels and adequate functioning of critical signage and lighting.
3.2. Fire Risk Assessment of Nanchang Shuanggang Subway Station
3.2.1. Adjust the Prior Probability of Basic Events
Nanchang Municipal Government has issued the “Nanchang Municipal Government’s List of Prohibited and Restricted Items on Public Transportation”, which has been officially implemented starting this year. After the implementation of the new regulations, security checking efforts and publicity and education to strengthen the passenger’s cognitive enhancement of the violation of the carrying behavior, the probability of violation should be reduced, at the same time the subway appeared to be combustible and oxidant probability should also be reduced.
Researching case studies of core cities in China can provide relevant specific data. After the implementation of the “Beijing Rail Transit Prohibited Items Catalog” in 2020, through the increase in intelligent security inspection equipment and the strengthening of publicity, the probability of passengers carrying flammable and explosive products in violation of the law was reduced from 0.012 to 0.004 (a decrease of 67%), leading to a reduction in the overall risk of combustibles and oxidizers from 0.018 to 0.009 (a decrease of 50%). The core drivers are security check coverage and public awareness enhancement [32]. Shanghai Metro implemented new regulations in 2021, combined with the “credit discipline” mechanism (violation records into the personal credit file), with a violation rate from 0.015 to 0.006 (a decrease of 60%) [33]. Nanchang subway concentrated on the destruction of more than 10,000 pieces of contraband (including flammable and explosive materials), as the historical violation base is high. The new regulation contains a combination of measures such as intelligent security check upgrade, high-frequency publicity, and violation penalties. The theory of planned behavior pointed out that comprehensive interventions can reduce the probability of risky behaviors by 40–70% [34]. At the same time, Shuangang Station is the terminal station, with a relatively controllable flow of passengers and a dense concentration of schools in the vicinity; the acceptance of the new regulation is higher for young passengers. Compared with the generic industry data, Shuanggang Station has achieved higher scores in recent safety audits, including full implementation of the fire management system, regular emergency drills, and upgraded fire detection equipment. To reflect this improved management and engineering level, a management correction factor was introduced. This factor was derived from the ratio between the station’s audit scores and the baseline requirements and was applied only to management-related and equipment-failure nodes. As a result, the corresponding basic event probabilities were moderately reduced. This correction is still an approximation, and future work should refine it using more detailed station-level failure statistics. Based on case analysis, behavioral theory, and the characteristics of Shuanggang Station, the prior probability of x4 will be reduced to 0.006.
The probability of the presence of combustibles and oxidizers is determined by a combination of multi-source factors. Passenger violations (such as lithium batteries, hairspray, alcohol, and other prohibited items) accounted for about 60–80% of the original model probability of 0.020625, in which the passenger violation of the items (0.015) accounted for 72.7%, and the other factors (0.005625) accounted for 27.3% of the total. Considering that the implementation of the new regulations, other prevention and control measures will also be strengthened, the above analysis should be reduced to 0.01. Shuanggang Station is equipped with an advanced automatic fire detection and alarm system, with a comprehensive hydrant system and an even distribution of sufficient fire extinguishers. Referring to the general rule of decreasing the failure rate after the reliability of the equipment has been improved (usually reduced by about half) [35], the probability adjustment for x9-x12 is reduced from 0.0085 to 0.00425. In engineering practice, good maintenance management can reduce the probability of equipment failure or imperfection by about 30–50% [35], so the probability of x15 is adjusted from 0.0085 to 0.005. Nanchang Metro Line 1 has built three major safety systems and established a “four-in-one” emergency drill mechanism. Beijing Metro has reduced the probability of similar human errors by about 50% after strengthening emergency drills [36], so x17 should be lowered to 0.01, and x18 lowered to 0.0075. This mechanism reduces the situation of “insufficient publicity, training and drills” through high-frequency and multi-scenario practical drills, with reference to engineering practice. Referring to the engineering practice, regular and standardized drills can reduce such risks by about 40%, x22-x24 reduce to 0.019. After researching and finding that there have been fire events around the station, such as a fire in the building of Xia Luo New Village next to Exit 4 of the station in 2018, as well as a fire in Junmin Friendship Road in 2022, in which the place of the accident was less than 200 m away from Shuangang Station. Although it did not spread to the subway station, there was a potential risk, so the probability of the occurrence of x27 has been appropriately increased to 0.0008 on the basis of the original 0.000333. The situation can be further adjusted by combining fire prevention and control measures (such as building fire spacing, fire separation zone setting, etc.) and long-term monitoring data in the area.
Based on the above adjustment principles, the adjusted prior probabilities of basic events are given in Table 10.
Table 10.
Prior probability of basic events of Shuanggang station.
3.2.2. Application and Calculation of Bayesian Network Model
- (1)
- Bayesian Network input and update
According to Table 10, the adjusted prior probability is inputted into the Bayesian Network, and the updated network diagram is shown in Figure 7. Based on the analysis of past experience or statistical data from Shuanggang Station, the probability of a fire accident occurring at Shuanggang Station is 0.00007, which is extremely low. It is reduced compared to the probability of the top event calculated by the generalized model, 0.000249, which indicates that the current preventive and control measures and the management formulated in this station are effective in reducing the risk.

Figure 7.
Bayesian Network model of fire accident in Shuanggang station.
- (2)
- Sensitivity analysis
Through the sensitivity analysis results of the Bayesian Network, we can determine the basic events that have the greatest impact on the fire accident that occurred at the Shuanggang station, as shown in Figure 8. According to Figure 8, the results can be ranked from largest to smallest impact on the target results as follows: x25 > x26 > x22 > x23 > x2 > x3 > x16 > x5 > x15.
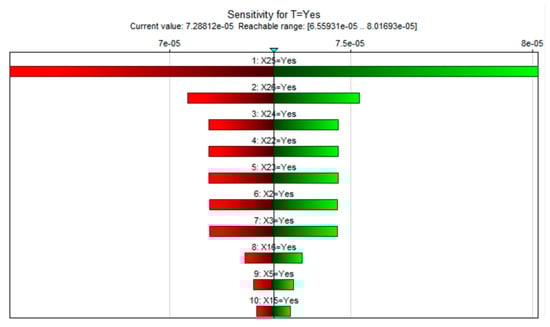
Figure 8.
Sensitivity analysis results for fire accident at Shuanggang Station.
Comparing the results with that of the generalized model (x25 > x26 > x24 > x22 > x23 > x2 > x3 > x4 > x5 > x15), the first seven influencing factors remain unchanged, which indicates that these factors have always occupied a central position in the causes of fire accidents in the Shuanggang Station. Their influence on fire accidents is persistent and stable, which is the key object of daily fire management and risk prevention and control. In contrast, x4 no longer appears, indicating that the current subway management’s security check and publicity measures for passengers carrying illegal items have achieved some success, and the risk has been partially controlled.
To verify the stability of the sensitivity analysis, we also conducted a variance-based sensitivity analysis specifically for the subway fire at the specific Shuanggang Station. This scenario differs from the aforementioned general scenario in terms of passenger flow density, equipment status, and operational nodes. The results of the variance-based sensitivity analysis for the Shuanggang Station obtained through the aforementioned steps are presented in Table 11.
Table 11.
Variance sensitivity analysis indicators of Shuanggang Station.
By comparing the results of the variance analysis in Table 10 and Table 11, we can conclude that the ranking and contribution characteristics of sensitive factors are highly consistent and clearly dominant across the two operating scenarios: In the general scenario of a subway fire, x25 = Yes becomes the core sensitive factor with a normalized sensitivity index of 83.67%, and its output variance contribution (2.057 × 10⁻⁹) far exceeds that of other factors (the second-ranked x26 = Yes is only 0.79%), with the cumulative contribution of the top five factors reaching 86.60%. In the specific scenario of the Shuanggang Station fire accident, x25 = Yes still dominates with a normalized sensitivity index of 79.01%, while x22 = Yes, x23 = Yes, and x24 = Yes, due to the combined effects of parameter ranges and derivatives which jointly share the second rank with a normalized sensitivity index of 4.81%, and the cumulative contribution of the top five factors reaches 89.55%. The rankings of the top five basic events remain very similar across all scenarios, with Spearman rank correlation coefficients larger than 0.9 between scenarios. This demonstrates that the key drivers identified by the Bayesian Network are stable under different operating conditions and that the model conclusions are not sensitive to moderate changes in scenario assumptions.
By comparing the generic model, it can be found that x16 is a newly added influential factor, which shows that the influence of blocked rescue channel on fire accidents has increased after updating the analysis, which is related to the complexity of the transportation environment around Shuanggang Station. Shuanggang Station is located in the core area of Nanchang Jingkai District. The surrounding colleges, universities, and residential areas are densely populated, and the passenger flow is large, especially during the morning and evening peak hours when people are highly concentrated. At the same time, the research found that outside the three entrances and exits of the Shuanggang Station a large number of long-term accumulated, shared bicycles were present which were seriously affecting the passage of the public. If a fire accident occurs, obstructions at entrances and exits will hinder the timely response and effectiveness of fire rescue efforts, increasing the time people are trapped in the fire and the risk of casualties. This change suggests the need to re-examine the smoothness of the rescue channel of the Shuanggang Station, and to strengthen the management and optimization of the layout of the shared bicycle parking points at the entrances and exits.
3.3. Optimized Measures Based on Shuanggang Station-Specific BN Model
Due to the very low frequency of severe subway fires and the scarcity of detailed local incident data, it is difficult to perform strict statistical validation of the model. Instead, this study adopts a qualitative validation approach. The critical basic events highlighted by the FT and BN, such as combustibles and oxidants, electrical equipment heating, faults of smoke prevention and exhaust system, and deficiencies in fire management, are consistent with the key causes of recent metro and tunnel fire incidents reported in the literature and summarized in Table 1. This consistency supports the face validity and structural plausibility of the model.
The calculated probability of the top event subway fire accident under the current conditions is 0.00007. This value represents the residual risk when all modeled safety barriers are in place. It indicates a relatively low level of risk for Shuanggang Station compared with the assumed baseline but should not be interpreted as an exact prediction of the absolute fire frequency. A sensitivity test on the prior probabilities shows that, although the absolute value of the top event probability changes, the ranking of critical basic events remains stable. Therefore, the model is more suitable for relative risk assessment and prioritization of safety measures than for precise frequency prediction. Although the current probability of a fire occurring is extremely low, the relevant subway departments cannot relax their efforts and must continue to optimize all prevention and control measures.
The station-specific sensitivity analysis for Shuanggang Station indicates that several nodes have significantly higher local influence compared with the general model. The proposed measures therefore follow the station-level causal pathways and sensitivity indices.
For x25, targeted inspections of combustible materials at stations should focus specifically on areas with the highest local sensitivity, including commercial zones and equipment areas. For x26, the station should prioritize the electrical rooms with the greatest overheating contribution (especially those adjacent to commercial and equipment zones). Implement continuous temperature logging, localized alarm thresholds, and load redistribution. For x24, the station must refine emergency response plans based on the model’s identified primary causal chains. Calibrate command procedures, cross-departmental handover, and on-site coordination. For x22 and x23, the station should concentrate on the most sensitive departments and positions, implementing differentiated training and targeted supervision. For x2 and x3, the station must concentrate supervision and equipment maintenance on model-identified critical node positions and subsystem interfaces (e.g., passenger flow corridors, key equipment zones), aligning personnel management with actual station risk. For x5, the station should enhance fire safety at commercial outlets along high-risk passenger pathways by increasing warning devices and boosting inspection frequency. For x15, the station should enhance emergency equipment management and accessibility along primary evacuation routes by installing additional facilities, increasing redundancy in guidance systems, and raising inspection frequencies to ensure stable evacuation capacity.
The newly introduced node x16, representing obstruction of external rescue routes by shared bicycles, shows substantial local sensitivity. Management should therefore be directed toward the specific external corridors that serve as rescue access in the model. Regulatory measures, improved enterprise dispatching and public education should focus on these corridors to reduce the likelihood of obstruction.
4. Conclusions
In this study, a comprehensive fire risk assessment index system for metro systems was constructed. It spans four dimensions: personnel, equipment, management, and environment, comprising 9 secondary and 27 tertiary indicators. This “Human–Equipment–Management–Environment” framework itself represents a symmetrical and systematic perspective for holistic risk analysis, ensuring no key aspect is overlooked. A total of 117 minimum cut sets and 14 minimum path sets were obtained and then the structural importance, probability importance, and critical importance were analyzed to clarify the core causes of subway fires. The combined model uses the Fault Tree Analysis (FTA) to establish the causal structure and the Bayesian Network (BN) to dynamically update probabilities within it. This synergy maintains logical rigor and captures real-time risk fluctuations, significantly improving assessment accuracy and timeliness. Using prior probabilities and posterior updates, the model quantified the contribution of each factor to the overall fire risk. A subsequent sensitivity analysis identified the top 10 most influential factors.
Finally, taking Shuanggang Station as an example, considering its high passenger flow and complex surrounding environment, and combining it with the area’s fire history, after adjusting the basic event probabilities, it was found that the probability of a fire occurring at this station is 0.00007, indicating an extremely low risk. However, special attention should be paid to the management of combustible materials, maintenance of electrical equipment, and the accessibility of rescue routes. Through sensitivity analysis—compared with the general model—the impact of blocked rescue routes on fire response at this station was evaluated and targeted preventive measures were proposed, covering fire source control, equipment inspection, emergency drills, and rescue routes. Subway operators can prioritize intervention measures based on the results of the sensitivity analysis, providing practical safety management guidance. The prevention and control strategy derived from a dynamic model integrating FTA and BN dynamic probabilistic inference can be applied to most metro stations. In the future, the general model will be improved, and for more complex structures such as transfer hubs and deep-buried stations, a hierarchical Bayesian Network model will be developed, incorporating smoke diffusion simulations to enhance the model’s applicability, while fully considering dynamic factors such as equipment aging and seasonal passenger flow variations on real-time risk.
Supplementary Materials
The following supporting information can be downloaded at: https://www.mdpi.com/article/10.3390/sym17122090/s1, Table S1: Natural language variables and corresponding triangular fuzzy numbers; Table S2: Summary table of expert evaluations; File S3: Basic theory of Bayesian network.
Author Contributions
Conceptualization, X.L.; methodology, X.L. and Y.G.; software, Y.G.; validation, X.L. and G.W.; formal analysis, Y.G. and G.W.; investigation, Y.G.; resources, X.L.; data curation, X.L. and Y.G.; writing—original draft preparation, G.W. and Y.G.; writing—review and editing, X.L. and G.W.; visualization, Y.G. and G.W.; supervision, X.L.; project administration, X.L.; funding acquisition, X.L. All authors have read and agreed to the published version of the manuscript.
Funding
This research was funded by National Natural Science Foundation of China (grant number 52406135), Jiangxi Provincial Natural Science Foundation (grant number 20252BAC200324), China Postdoctoral Science Foundation (grant number 2024M750896), Early-Career Young Scientists and Technologists Project of Jiangxi Province (No. 20244BCE52141), and East China Jiaotong University Doctoral Research Start-up Project (grant number 676).
Data Availability Statement
Data is contained within the article or Supplementary Material.
Conflicts of Interest
The authors declare no conflicts of interest. The funders had no role in the design of the study; in the collection, analyses, or interpretation of data; in the writing of the manuscript; or in the decision to publish the results.
Abbreviations
| Abbreviation | Definition |
| BN | Bayesian Network |
| FT | Fault Tree |
| IAHP | Interval Analytic Hierarchy Process |
| FFT | Fuzzy Fault Tree |
| FTA | Fault Tree Analysis |
| IQR | Interquartile Range |
| HMEM | Human–Machine–Environment–Management |
References
- Liu, S.-C.; Peng, F.-L.; Qiao, Y.-K.; Zhang, J.-B. Evaluating disaster prevention benefits of underground space from the perspective of urban resilience. Int. J. Disaster Risk Reduct. 2021, 58, 102206. [Google Scholar] [CrossRef]
- Ge, S.; Shan, M.; Zhai, Z. Emergency Preparedness in China’s Urban Rail Transit System: A Systematic Review. Sustainability 2025, 17, 524. [Google Scholar] [CrossRef]
- Fridolf, K.; Nilsson, D.; Frantzich, H. Fire Evacuation in Underground Transportation Systems: A Review of Accidents and Empirical Research. Fire Technol. 2013, 49, 451–475. [Google Scholar] [CrossRef]
- Tu, J.; Peng, B.; Bai, L.; Zhang, Y. How do passengers’ psychological conditions and behavioral conditions change in metro fire evacuation: An online questionnaire-based experiment. Fire Saf. J. 2024, 150, 104281. [Google Scholar] [CrossRef]
- Chen, S.; Xu, Z.; Yin, Y.; Yu, Z.; Ying, H.; Wenbin, W.; Guanhong, H.; Wang, Y.; Zhao, J. An Experimental Study on the Fire Temperature Characteristic of Commuter Express Carriages with Multiple Side Doors in Tunnel of Urban Rail Transit. Fire Saf. J. 2025, 157, 104480. [Google Scholar] [CrossRef]
- Moodie, K. The King’s Cross fire: Damage assessment and overview of the technical investigation. Fire Saf. J. 1992, 18, 13–33. [Google Scholar] [CrossRef]
- Lee, M.; Hur, N. A detailed CFD simulation of the 2003 Daegu metro station fire. Int. J. Air-Cond. Refrig. 2012, 20, 1250014. [Google Scholar] [CrossRef]
- Wu, J.; Hu, Z.; Chen, J.; Li, Z. Risk Assessment of Underground Subway Stations to Fire Disasters Using Bayesian Network. Sustainability 2018, 10, 3810. [Google Scholar] [CrossRef]
- Shi, C.; Zhong, M.; Nong, X.; He, L.; Shi, J.; Feng, G. Modeling and safety strategy of passenger evacuation in a metro station in China. Saf. Sci. 2012, 50, 1319–1332. [Google Scholar] [CrossRef]
- Bjelland, H.; Gehandler, J.; Meacham, B.; Carvel, R.; Torero, J.L.; Ingason, H.; Njå, O. Tunnel fire safety management and systems thinking: Adapting engineering practice through regulations and education. Fire Saf. J. 2024, 146, 104140. [Google Scholar] [CrossRef]
- Yan, Z.; Wang, Y. Developing a Subway Fire Risk Assessment Model Based on Analysis Theory. Math. Probl. Eng. 2021, 2021, 5549952. [Google Scholar] [CrossRef]
- Li, X.; Yuan, J.; Zhang, L.; Yang, D. Risk assessment of subway station fire by using a Bayesian Network-based scenario evolution model. J. Civ. Eng. Manag. 2024, 30, 279–294. [Google Scholar] [CrossRef]
- Ju, W.; Wu, J.; Kang, Q.; Jiang, J.; Xing, Z. Fire Risk Assessment of Subway Stations Based on Combination Weighting of Game Theory and TOPSIS Method. Sustainability 2022, 14, 7275. [Google Scholar] [CrossRef]
- Lin, B.S.-M.; Lin, C.-Y.; Kung, C.-W.; Lin, Y.-J.; Chou, C.-C.; Chuang, Y.-J.; Hsiao, G.L.-K. Wayfinding of firefighters in dark and complex environments. Int. J. Environ. Res. Public Health 2021, 18, 8014. [Google Scholar] [CrossRef] [PubMed]
- Aghaei, P.; Asadollahfardi, G.; Katabi, A. Safety risk assessment in shopping center construction projects using Fuzzy Fault Tree Analysis method. Qual. Quant. 2022, 56, 43–59. [Google Scholar] [CrossRef]
- Li, Y.; Rong, W. Analysis of Subway Fire Accident Based on Bayesian Network; IOP Publishing: Bristol, UK, 2021; p. 012039. [Google Scholar] [CrossRef]
- Khakzad, N.; Khan, F.; Amyotte, P. Quantitative risk analysis of offshore drilling operations: A Bayesian approach. Saf. Sci. 2013, 57, 108–117. [Google Scholar] [CrossRef]
- Lin, X.; Song, S.; Zhai, H.; Yuan, P.; Chen, M. Using catastrophe theory to analyze subway fire accidents. Int. J. Syst. Assur. Eng. Manag. 2020, 11, 223–235. [Google Scholar] [CrossRef]
- Yan, W.; Wang, J.; Jiang, J. Subway Fire Cause Analysis Model Based on System Dynamics: A Preliminary Model Framework. Procedia Eng. 2016, 135, 431–438. [Google Scholar] [CrossRef]
- Zhang, J.; Zhu, J.; Dang, P.; Wu, J.; Zhou, Y.; Li, W.; Fu, L.; Guo, Y.; You, J. An improved social force model (ISFM)-based crowd evacuation simulation method in virtual reality with a subway fire as a case study. Int. J. Digit. Earth 2023, 16, 1186–1204. [Google Scholar] [CrossRef]
- Wu, J.; Fu, Q.; Chen, P.; Duan, M. Container Ship Fire Risk Assessment Based on Dynamic Bayesian Network Model. In Proceedings of the 2023 7th International Conference on Transportation Information and Safety (ICTIS), Xi’an, China, 4–6 August 2023; pp. 1969–1983. [Google Scholar] [CrossRef]
- Guan, W.; Zhang, C.; Dong, C.; Xia, Y. Ship fire and explosion accident statistical analysis based on fault tree and Bayesian Network. Fire Saf. J. 2025, 153, 104358. [Google Scholar] [CrossRef]
- Li, Y.; Sun, B.; Guo, T. A multi-source data-driven tunnel fire source localization methodology and system integrating Bayesian estimation and multi-golden eagle optimization. Fire Saf. J. 2025, 156, 104469. [Google Scholar] [CrossRef]
- Whitesitt, J.E. Boolean Algebra and Its Applications; Courier Corporation: North Chelmsford, MA, USA, 2012. [Google Scholar] [CrossRef]
- Berni, R. Quality and Reliability in Top-Event Estimation: Quantitative Fault Tree Analysis in Case of Dependent Events. Commun. Stat.-Theory Methods 2012, 41, 3138–3149. [Google Scholar] [CrossRef]
- Mi, J.; Beer, M.; Li, Y.-F.; Broggi, M.; Cheng, Y. Reliability and importance analysis of uncertain system with common cause failures based on survival signature. Reliab. Eng. Syst. Saf. 2020, 201, 106988. [Google Scholar] [CrossRef]
- Zhang, Y.X.; Lan, L.; Wang, X.H. Signal Measurement Error Analysis of the Bayesian Network of Mechanical Fault Detection. Adv. Mater. Res. 2014, 945–949, 2183–2186. [Google Scholar] [CrossRef]
- Wang, J.; Qiu, Q.; Wang, H.; Lin, C. Optimal condition-based preventive maintenance policy for balanced systems. Reliab. Eng. Syst. Saf. 2021, 211, 107606. [Google Scholar] [CrossRef]
- Li, X.; Cao, X.; Deng, J.; Li, X. Modeling and simulation of railway safety management with public supervision and dynamic incentives: A four-party evolutionary game and system dynamics approach. PLoS ONE 2025, 20, e0330100. [Google Scholar] [CrossRef]
- Liu, H.; Li, B.; Yao, F.; Hu, G.; Xie, L. Maintenance optimization of multi-unit balanced systems using deep reinforcement learning. Reliab. Eng. Syst. Saf. 2024, 244, 109921. [Google Scholar] [CrossRef]
- George, P.G.; Renjith, V.R. Evolution of Safety and Security Risk Assessment methodologies towards the use of Bayesian Networks in Process Industries. Process Saf. Environ. Prot. 2021, 149, 758–775. [Google Scholar] [CrossRef]
- Wang, Y.; Yuan, R.; Tong, X.; Bai, Z.; Hou, Y. Towards simulation optimization of subway station considering refined passenger behaviors. PLoS ONE 2024, 19, e0304081. [Google Scholar] [CrossRef] [PubMed]
- Wang, B.; Wu, C. Using an evidence-based safety approach to develop China’s road safety strategies. J. Glob. Health 2019, 9, 020602. [Google Scholar] [CrossRef]
- Wang, Y.; Sheng, K.; Niu, P.; Chu, C.; Li, M.; Jia, L. A comprehensive analysis method of urban rail transit operation accidents and safety management strategies based on text big data. Saf. Sci. 2024, 172, 106400. [Google Scholar] [CrossRef]
- Yeh, R.H.; Kao, K.-C.; Liang, C. Optimal preventive maintenance policy for leased equipment using failure rate reduction. Comput. Ind. Eng. 2009, 57, 304–309. [Google Scholar] [CrossRef]
- Ajzen, I. The theory of planned behavior. Organ. Behav. Hum. Decis. Process. 1991, 50, 179–211. [Google Scholar] [CrossRef]
Disclaimer/Publisher’s Note: The statements, opinions and data contained in all publications are solely those of the individual author(s) and contributor(s) and not of MDPI and/or the editor(s). MDPI and/or the editor(s) disclaim responsibility for any injury to people or property resulting from any ideas, methods, instructions or products referred to in the content. |
© 2025 by the authors. Licensee MDPI, Basel, Switzerland. This article is an open access article distributed under the terms and conditions of the Creative Commons Attribution (CC BY) license (https://creativecommons.org/licenses/by/4.0/).