Abstract
Rhythm disturbances during human exercise represent a critical challenge for both physiological monitoring and athlete safety. To address this, a structure-enhanced β-TCVAE framework was proposed that derives a Rhythm Disturbance Index (RDI) from multimodal wearable sensor signals. RDI demonstrated a strong correlation with bilateral imbalance (r = 0.838, R2 = 0.702) and achieved high discriminative performance (ROC-AUC = 0.823). Importantly, its weak and non-significant correlation with heart rate (r = 0.0569, p > 0.05) supported independence from cardiovascular load, underscoring its specificity to motor rhythm rather than systemic exertion. Analyses conducted on multimodal datasets further validated the robustness of this correlation, showing that RDI consistently aligns with disruptions in locomotor symmetry even after controlling for heart rate. This quantifiable coupling between rhythmic instability and symmetry loss positions RDI as a dual correlational indicator, sensitively reflecting both neuromuscular rhythm irregularities and axial imbalance. Such dual insight enables continuous and objective monitoring of locomotor quality, empowering coaches, clinicians, and sports scientists to tailor training strategies, optimize performance, and reduce the risk of injury. By integrating advanced variational reasoning with real-time wearable sensing, the proposed framework offers an evidence-based step forward in precision monitoring and risk assessment for athletes.
1. Introduction
Maintaining rhythmic coordination and bilateral symmetry in sports and physical activities is essential for optimal performance, as even minor disruptions in movement rhythm or symmetry can significantly reduce performance outcomes and increase the risk of injury. In competitive sports, precise rhythmic control and balanced movement symmetry form the foundation for efficient energy transfer, accurate movement execution, and effective injury prevention. Additionally, early detection of rhythmic disturbances and asymmetries can significantly facilitate proactive interventions that minimize the risk of performance decline or chronic injury development [1,2,3,4,5,6,7,8,9].
Detecting rhythmic abnormalities in human locomotion remains a major challenge, and traditional analytical methods are often neither precise nor transparent [10]. To address these limitations, this study proposes a structure-enhanced β-TCVAE, which improves the detection of rhythmic disorders [11]. It has been shown that the variability of the symmetry of the human structure is significantly elevated when there is a disturbance in the rhythm of movement, thus exacerbating the instability of the movement performance [12]. Quantitative correlation analysis demonstrates that the detected rhythmic disturbances are closely related to symmetry breaking in movement, indicating a strong concurrent association with movement symmetry loss.
Building on this relationship, it is essential to clarify the methodological and physiological parameters that underpin rhythm detection and its integration with symmetry analysis. The effectiveness of applying variational autoencoders (VAEs) to human motion largely depends on key modeling parameters such as the dimensionality of the latent space, the β weighting of the Kullback–Leibler divergence, and the reconstruction error. These parameters jointly determine the balance between representation capacity and generalization, ensuring that the model can capture subtle rhythm deviations while avoiding overfitting under limited conditions of size. Within rhythm-based detection models, stride-to-stride variability, temporal variance, and spectral entropy are widely recognized as fundamental indicators of locomotor stability, as they quantify both the regularity and the adaptability of cyclic movement patterns. More recent approaches extend these metrics by incorporating higher-order temporal dynamics, enabling more sensitive identification of transient rhythm disturbances. At the physiological level, wearable biosensors provide core measurable parameters, including tri-axial acceleration, angular velocity, and heart rate variability, which together reflect neuromotor coordination and autonomic regulation [13]. When integrated, these methodological and physiological parameters establish a coherent framework that supports the development of the Rhythm Disturbance Index (RDI) as a reliable and interpretable indicator of rhythmic instability and loss of symmetry. This foundation further motivates the optimization of VAE-based architectures to enhance both detection accuracy and physiological interpretability in sports science applications.
Compared with traditional methods, VAE can more robustly capture latent variable structures, improve anomaly detection performance, and adapt to cross-population applications [14]. Previous work demonstrated excellent generalization in detecting abnormal rhythm signals [15].
In subsequent years, variational autoencoder–based representation learning was extended from biomedical signals to core motor tasks such as motor-imagery classification and signal reconstruction, supporting its fundamental effectiveness for processing motion-related data; recent work shows that coupling a VAE backbone with channel-attention and multitask objectives (EEG/EMG reconstruction plus a feature-metric loss) improves representation quality and generalization in multimodal pipelines.
Recent advances in wearable human-motion sensors, including flexible/form-factor integration, self-powered architectures, and multimodal fusion, have markedly improved field deployability, signal fidelity, and long-term wearability [16,17].
These developments enable the on-body assessment of rhythmic instability and symmetry loss during real-world exercise, thereby motivating the representation-learning approach for quantifying interpretable imbalance [18].
Building on these advances, a structure-enhanced β-TCVAE optimized for complex locomotor actions with explicit constraints on latent space disentanglement and interpretability; on the dataset, this yields physiologically meaningful features that markedly improve detection of rhythmic instability concurrent with symmetry loss in human locomotion [19].
Although VAEs perform well, their latent variables remain lacking physiological validation; no work has yet linked these factors to cardiopulmonary rhythms or EMG activity. Sports training studies often involve small sample sizes and significant individual variability. Under these conditions, VAE models often overfit, which limits their ability to generalize [20]. In addition to these limitations, another key issue is the physiological interpretability of the latent representations. Whether these latent variables correspond to underlying physiological mechanisms in exercise remains a matter of controversy. Some researchers have argued that these latent variables only capture superficial physiological features and not the biology of human movement.
Rhythmic disturbances and bilateral asymmetry are challenging to capture with conventional symmetry metrics in exercise and are often confounded by heart rate fluctuations. Address this by formalizing a wearable-sensor Motion Imbalance Index (MII) via bilateral mirror error and by deriving an evidence-based, sensitivity-validated Rhythm Disturbance Index (RDI) computed from a structure-enhanced β-TCVAE (variational autoencoder) that imposes temporal/structural priors and disentangles physiologically interpretable latent factors. This VAE backbone jointly optimizes reconstruction and temporal coherence to amplify rhythm-sensitive features while reducing cardiovascular confounding. Then test the heart-rate–adjusted association between RDI and symmetry loss, yielding a transparent, reproducible, and field-deployable monitoring framework [21].
In view of these limitations, position this study to clarify where its novelty lies. The starting point is a structure-enhanced β-TCVAE that is trained on wearable, multimodal time series [22]. Unlike earlier VAE-style models, this model explicitly encourages temporal coherence in the latent space and discourages entangled representations, ensuring that small rhythmic disturbances are not smoothed out or mixed across channels. Additionally, treat acceleration, angular velocity, and heart rate signals not as separate inputs but as components of a single movement episode, and let the model derive a rhythm disturbance measure from that joint representation; this is the level at which feature-level integration occurs [23]. Finally, link the model’s output to observable movement phenomena—particularly bilateral asymmetry and center-of-gravity excursions—and demonstrate that the index is not merely a proxy for cardiovascular load, lending physiological meaning to the result rather than being a purely data-driven anomaly score.
To provide a clear overview of the proposed pipeline, we summarize the end-to-end framework from data acquisition to model validation, including the data input and preprocessing stage, the advanced β-VAE core architecture, the training and optimization strategy, and the evaluation/validation procedures Figure 1. As illustrated, raw IMU-derived biomechanical signals are first calibrated, normalized, and segmented using a sliding-window scheme to construct standardized train/validation sets, which are then fed into an encoder–latent space–decoder structure for representation learning and signal reconstruction under a β-regularized objective. The model is subsequently optimized with a unified loss and training strategy, and its effectiveness and robustness are assessed via multi-metric performance evaluation and cross-validation.
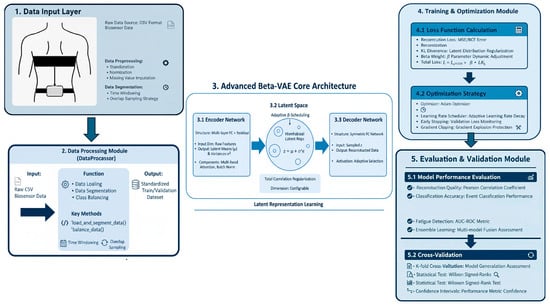
Figure 1.
This flowchart illustrates that wearable IMU and heart-rate signals are first synchronized, denoised, and normalized to ensure temporal alignment and signal consistency. The preprocessed data are then segmented into short, overlapping windows to capture local movement dynamics. From each window, basic time- and frequency domain descriptors are extracted and further modeled using a structure-enhanced β-TCVAE, which quantifies both reconstruction errors and latent dynamic variability. These standardized components are subsequently integrated into a composite Rhythm Disturbance Index (RDI), with thresholds determined from the training set to prevent information leakage. The resulting RDI layer enables simultaneous detection of rhythm and asymmetry disturbances, providing interpretable features for real-time monitoring and rehabilitation feedback. The schematic illustrates this left-to-right analytical pipeline—from sensor acquisition and preprocessing, through β-TCVAE modeling, to RDI computation and decision-making—highlighting the logical dependencies among all processing stages.
2. Materials and Methods
2.1. Research Framework
This study presents a framework for detecting rhythmic disturbances in motion using multimodal data collected from wearable sensors. The proposed generative model integrates a structured latent architecture and targeted feature refinement to analyze signals from accelerometers, gyroscopes, and heart rate monitors [24]. The proposed model also reliably recognizes subtle disturbances while providing measurable physiological interpretability.
In this study, a β-Total Correlation VAE (β-TCVAE) variant is presented that emphasizes disentangling latent factors by penalizing total correlation among dimensions, thus enhancing interpretability. The structured latent space enables the model to distinguish between rhythmic stability, symmetry deviation, and physiological variation. By integrating temporal and spectral constraints, the β-TCVAE effectively captures fine-grained rhythmic fluctuations and identifies early deviations indicative of motor control disturbance.
2.2. Data Availability and Description
Acquisition and signal chain: the hip IMU was configured at ~100 Hz (104 Hz setting) with accelerometer ranges of ±2/±4/±8/±16 g, gyroscope of ±125/±245/±500/±1000/±2000 dps, and magnetometer ±4/±8/±12/±16 gauss. To harmonize with heart-rate analysis and target macro-rhythmic symmetry (~1–4 Hz), inertial streams were anti-aliased (zero-phase low-pass, ~4–5 Hz) and decimated to 10 Hz; instantaneous heart rate derived from R–R intervals was resampled to 10 Hz for co-registration with the IMU. Quality control and windowing: segments with dropouts, clipping, belt slippage, or sync failure were excluded. All channels were processed using fixed 1 s windows (50% overlap) with robust z-normalization (median/MAD). Device model/serial, ranges, sampling settings, body side, and anatomical landmarks were logged to ensure reproducibility.
During the experimental trials, participants were instrumented with an integrated IMU unit and a chest-strap heart-rate monitor, and standardized sport-specific movement tasks were performed while synchronized kinematic and physiological signals were recorded Figure 2. As shown, the wearable sensors were positioned at the waist and chest to ensure stable attachment and consistent measurement throughout the protocol.
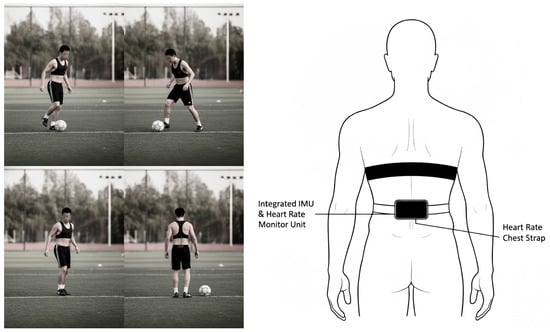
Figure 2.
A single Movesense Flash unit (Suunto/Movesense) was hip-mounted over the right iliac crest to record 9-axis inertial signals; a chest-worn heart-rate belt recorded single-lead ECG for HR and R–R intervals. Sensor axes were aligned to anatomical directions (X: right–left; Y: anterior–posterior; Z: superior–inferior), and the module was secured with the supplied clothing clip/surface mount to minimize slippage. Devices were powered on, passed self-checks, and shared a common time base; trial onset/offset and a brief tap cue were event-marked for synchronization, and device timestamps were exported for post hoc alignment.
This dataset captures real-time biosensor and motion data from 20 athletes, comprising 10 track and field athletes, 5 soccer players, and 5 basketball players. Data collection was informed, in part, by the CC0-licensed Intelligent Biosensor Dataset, which provided a public benchmark for sensor modalities and task design. The minority supplement was sourced from the CC0-licensed public Intelligent Biosensor Dataset and was reprocessed with the study’s pipeline to ensure cross-source comparability [25]. All of which are monitored using wearable sensor technologies. It contains physiological signals (heart rate) and inertial measurements (accelerometer and gyroscope data across three axes), collected during various athletic movements such as running, accelerating, jumping, and landing. Each data point is timestamped and associated with a unique athlete ID and a labeled motion event, serving as the target variable for motion classification tasks. The dataset integrates multimodal physiological and kinematic information, including heart rate, triaxial accelerometer, and MU signals, which were anti-aliased and downsampled to 10 Hz to match the 10 Hz instantaneous heart-rate series (R-R-derived). The raw recordings were first ordered chronologically to form a continuous multichannel time series. This time series was then segmented into fixed 1-s windows (10 samples per window) with 50% overlap to preserve temporal continuity. Within each window, all channels were z-score normalized before being supplied to the β-TCVAE and subsequent analyses. Each entry is annotated with one of six event labels (Accel, Jump Take-off, Landing, Sprint Mid, Start Run, Stop), allowing precise identification of movement states. All records are time-stamped and linked to unique athlete identifiers (A001–A020), supporting both individual- and group-level analyses across different sport disciplines.
2.3. Model Design
All signals sampled at 10 Hz are now processed using fixed 1 s windows (10 samples) with 50% overlap so that feature extraction, model training, and subsequent statistical analyses operate at the same temporal resolution. An 80/20 participant-stratified split defined the training and test sets. Each window was encoded by a two-layer bidirectional GRU–β-TCVAE (hidden = 64, latent = 16), whose loss combined mean-squared reconstruction error with a β-weighted KL term (β cosine-scheduled to 1, L2 = 10−4). For every window, a Rhythm Disturbance Index (RDI), with values ≤ 0 denoting normal rhythm, 0–1 mild, 1–2 moderate, and >2. Elevated RDI windows aligned with center-of-gravity excursions and bilateral symmetry loss. Raw biosensor data were sampled at 10 Hz from a triaxial accelerometer, gyroscope, and heart rate monitor. They were first segmented into fixed-length 1.0 s windows (i.e., 10 time points) with a 50% overlap to maintain temporal continuity. Each channel was individually z-normalized to reduce inter-sensor and inter-subject variability.
The dataset was then split into training (80%) and test (20%) subsets using a participant-stratified strategy to avoid subject leakage across folds and ensure that generalization performance is not biased by identity overlap. Each segmentation window is processed by a bi-layer bi-directional gated recurrent unit (BiGRU) encoder with 64 hidden units in each direction. The coded sequences are mapped into a 16-dimensional latent space from which the decoder attempts to reconstruct the original input using the mirrored GRU architecture.
The training objective was defined as the weighted sum of mean-squared reconstruction loss and a β-weighted Kullback–Leibler (KL) divergence term [26]. To mitigate posterior collapse and improve latent disentanglement, a cosine annealing schedule for the β parameter is used, gradually increasing its value from 0.0 to 1.0 throughout the training epochs. A small L2-regularization term was added to stabilize weight updates and promote generalization on limited sample sizes.
2.4. Experimental Design
Wearable IMU signals—bilateral tri-axial gyroscopes (Gyro_X/Y/Z) and vertical accelerometry (Acc_Z)—were sampled at 10 Hz and segmented into fixed 1 s windows with 50% overlap; analyses were conducted at the window level. Windows failing pre-specified quality control (sensor dropout, clipping, or sustained acceleration >3 g for ≥100 ms) were excluded. Each channel underwent 4th-order Butterworth low-pass filtering at 10 Hz and per-window z-score normalization. The structure-enhanced β-TCVAE for rhythmic time series utilizes a dilated 1D-BiGRU encoder with channel attention and a symmetric transposed convolutional decoder. The latent space (8–16 dimensions) is regularized for disentanglement via total correlation penalization. The training objective combined reconstruction fidelity and KL-divergence with β-annealing, temporal smoothness, and spectral consistency terms. Optimization used the Adam optimizer (initial learning rate 1 × 10⁻³), a batch size of 64, cosine learning-rate decay, and early stopping based on the validation loss. Derived measures included a window-level bilateral asymmetry metric computed. Optimization was performed with Adam (β1 = 0.9, β2 = 0.999, ε = 1 × 10⁻⁸; initial lr = 1 × 10⁻³ with cosine decay; weight decay = 1 × 10⁻⁴; gradient clipping = 1.0). This choice was made to ensure stable, sample-efficient training under small batches and non-stationary, noisy time-series gradients, where adaptive moment methods typically converge faster and require less from the complement of cosine similarity between normalized left signals and left-right-mirrored right signals (aggregated across paired gyroscope channels) and a set of rhythm-sensitive feature scores from the VAE consisting of reconstruction error, temporal deviation, spectral mismatch, latent regularity, and a physiology-alignment term; all measures were standardized before analysis. Pre-specified statistical analyses assessed associations between rhythm-sensitive feature scores and the asymmetry metric using Pearson correlation and heart-rate–adjusted partial correlation.
To ensure distributional comparability under occasional outliers, all biosensor time-series features were standardized using a robust z-score scheme. Each channel in each 1 s segment was centered by its median and scaled by the median absolute deviation (MAD), with MAD converted to a standard-deviation equivalent via the 1.4826 factor. For channels whose MAD was numerically unstable, the procedure reverted to a conventional standard deviation computed on the flattened dataset. This single normalization pass was applied identically to training, validation, and test data, and the resulting scaling parameters were saved so the exact transformation could be reapplied in later runs, thereby avoiding train–test inconsistencies.
To move beyond mere reconstruction error and to examine whether the β-TCVAE learned structured, physiologically meaningful factors, the latent space was evaluated using information-theoretic proxies related to the mutual information gap and disentanglement/completeness indices.
Latent means were first extracted on the validation split with the encoder frozen. For each latent dimension, its mutual information with the target labels was estimated using a non-parametric, classification-based estimator, which yielded a per-latent importance profile.
The mutual-information-gap proxy was then defined as the normalized difference between the two largest latent label mutual information values, capturing how strongly label-relevant information concentrates in a single factor. A Gini-like normalization over the same profile was used as a disentanglement score, while completeness was summarized by the cumulative mass of the five most informative latents, indicating how compactly label information was represented. All per-latent scores and aggregates were exported in machine-readable form to support reproducible reporting.
Model training followed a five-fold cross-validation protocol with early stopping and learning-rate scheduling. In each fold, the model was trained on four partitions and evaluated on the held-out partition, and performance indices (reconstruction loss components and auxiliary accuracy proxies) were aggregated across folds to report mean values, standard deviations, and confidence intervals, providing a more robust estimate of generalization than a single split. Standard diagnostic tests—such as checking the distribution of fold-wise scores and computing coefficients of variation—were additionally used to assess optimization stability and guard against overfitting. All hyperparameters and fold assignments were logged to enable exact replication of the validation workflow.
Finally, cadence- and stride-related variability were quantified directly from the segmented windows so that normal gait-speed changes would not be misinterpreted as rhythm disturbance. Cadence was estimated from the dominant spectral peak of vertical acceleration (Acc_Z) in the 0.5–5 Hz band using FFT-based analysis and converted to steps per minute. Stride-interval variability was computed as the coefficient of variation in peak-to-peak times obtained from robust peak detection on Acc_Z, with a zero-crossing fallback when peaks were ambiguous. Both global and label-stratified summaries were produced, parameterized by the known sampling rate to preserve the physical meaning of temporal intervals, and exported for subsequent statistical modeling.
2.5. RDI Score Composition
In this study, a hierarchical five-component Rhythm Disorder Index (RDI) was developed to comprehensively assess the temporal, frequency domain, latent space, and physiological characteristics of motor rhythms. The five sub-indices were first normalized by z-score and then weighted and summed:
The RDI comprises the following five normalized sub-indices, each contributing a specific perspective to rhythm assessment:
RDI_Reconstruction (30%): This component measures the reconstruction error of the VAE (Variational Autoencoder), indicating how well the observed motion pattern aligns with the learned latent representations. Higher errors typically indicate abnormal or distorted signal patterns.
RDI_Temporal (25%): This index quantifies the inverse of short-term variance stability of sensor signals within each sliding window. It serves as a surrogate for rhythm continuity and fluctuation consistency in time-domain kinematic signals.
RDI_Frequency (20%): Derived from spectral analysis, this component measures the instability in the center of mass of the power spectrum, indicating frequency drift or temporal oscillation irregularities.
RDI_Latent (15%): This feature captures the volatility of latent space embeddings learned by the VAE. It quantifies the degree of inconsistency or deviation from normative internal representations, which often precedes visible disruptions in motor rhythm.
RDI_Physiology (10%): It is a composite physiological descriptor derived primarily from heart rate signals, enriched by potential feature extraction via a variational autoencoder (VAE). Instead of relying on raw heart rate values or simple measures of variability (e.g., heart rate variability), the metric utilizes the characterization encoded by the variance autoencoder to capture nonlinear fluctuations in physiological state during exercise.
The linear integration of these five sub-indicators, weighted as above, yields a multidimensional RDI, where higher total scores indicate more significant rhythm disturbances and are highly correlated with the disruption of bilateral exercise symmetry.
The allocation of weights across the five sub-indices of the RDI—30% for reconstruction, 25% for temporal, 20% for frequency, 15% for latent, and 10% for physiological—was guided by both methodological reliability and clinical relevance. Reconstruction error was assigned the highest weight because it directly reflects the fidelity of movement representation and is widely considered the most robust indicator of overall model adequacy. Temporal features were prioritized second, as disruptions in rhythm and timing are central to gait and movement asymmetry assessment. Frequency domain features received a moderate weight, recognizing their importance in identifying periodicity and resonance phenomena while still acknowledging their greater susceptibility to measurement noise.
Latent space representations, although valuable for capturing complex nonlinear dynamics, were assigned a smaller proportion given their limited interpretability in clinical contexts. Physiological parameters were weighted least due to their relatively lower precision (±20–30%) compared to kinematic signals (±0.1°/s), and because they function more as supportive rather than primary indicators. Importantly, the descending distribution of 30, 25, 20, 15, and 10 was designed to avoid overemphasis on any single dimension while ensuring that the most clinically and methodologically reliable indices dominate the composite metric. This layered structure reflects a balance between theoretical importance, empirical robustness, and practical interpretability, thereby enhancing the scientific rigor and clinical utility of the RDI framework.
To assess how component weighting influences the index, a five-dimensional RDI weight vector was applied across four pre-specified strategies (Original, Equal, Literature-based, and Empirical), along with controlled perturbations, for sensitivity analysis. Outcomes included the composite RDI score and downstream performance (ROC-AUC, classification accuracy), alongside clinical correlation with reference measures and stability metrics that summarize variance under perturbation. Dataset composition and signal feature processing, the VAE architecture and training settings, and the evaluation protocol (cross-validation and resampling) were held constant for all comparisons. This design isolates the influence of weighting and perturbation while ensuring results are comparable and interpretable across schemes.
3. Results
3.1. ROC–AUC Performance
Subsequently, model performance was evaluated using receiver operating characteristic (ROC) analysis to characterize the sensitivity–specificity trade-off across competing methods, and ablation-based comparisons were conducted against representative baseline classifiers Figure 3. The area under the ROC curve (AUC) was reported as a threshold-independent summary metric to quantify overall discriminative ability.
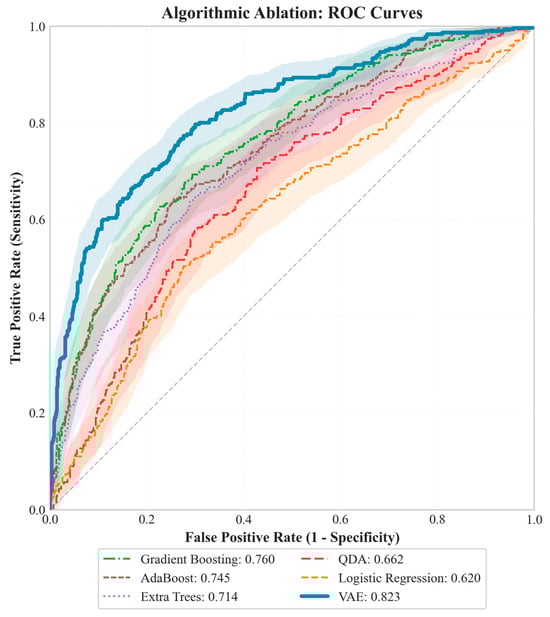
Figure 3.
A controlled ablation was conducted under identical preprocessing and label definition (imbalance ≥ T as the positive class), with performance evaluated on held-out folds. The structure-aware VAE achieved the highest discrimination (ROC–AUC = 0.823), outperforming Gradient Boosting (0.760), AdaBoost (0.745), Extra Trees (0.714), QDA (0.662), and Logistic Regression (0.662). Across the common operating range, the VAE maintained superior sensitivity at low false-positive rates, indicating better screening utility near practical thresholds. All ROC curves were computed on the same test split with matched class prevalence and a shared threshold grid, isolating the contribution of model architecture.
3.2. VAE Visualization for Disturbance Detection Analysis
Figure 4 presents an end-to-end evidence chain for VAE-based disturbance detection, where reconstruction-error trajectories enable thresholdable screening, latent projections demonstrate separable embeddings, and multi-channel heatmaps reveal synchronous cross-signal anomalies. Violin/time-band summaries quantify distributional shift relative to baseline, while spectra localize rhythmic/phase irregularities. Collectively, it demonstrates a robust, interpretable, and label-efficient pipeline suited for monitoring, risk assessment, and individualized feedback.
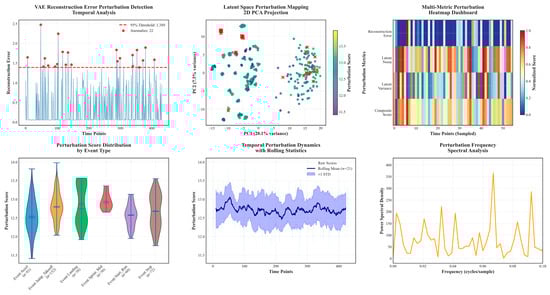
Figure 4.
The variational autoencoder (VAE) is used to detect and analyze rhythmic disturbances in exercise physiology data. Utilize selected datasets to demonstrate the model’s detection results. Evaluated the VAE using reconstructed error curves, latent space plots, multi-signal heatmaps, and dynamic statistics. Most of the samples stayed below the error threshold, while rhythmic abnormalities were evident in the error and latency plots. Heatmaps showed that the interference affected multiple signals simultaneously, while violin and spectral analyses revealed greater fractional variability and clear phase structure in motion. In conclusion, VAE reliably detects and characterizes multimodal rhythmic anomalies, supporting its use in monitoring, risk assessment, and personalized feedback.
3.3. RDI Association with Bilateral Symmetry Loss
Figure 5 synchronized traces show peaks in the Rhythm Disturbance Index (RDI; robust-standardized) co-occurring with rises in the Movement Imbalance Index, indicating concurrent co-variation within windows. The cross-sectional panel shows a positive association between RDI and imbalance, with a linear fit and a prediction band. The widening spread at higher RDI values indicates heteroscedasticity, motivating the use of prediction—rather than only confidence—intervals. No dominant leverage cluster or curvature is evident over the observed range.
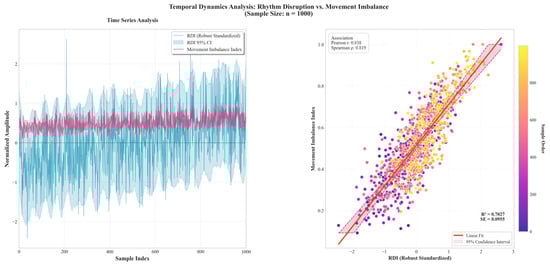
Figure 5.
Given the large sample size, 1000 RDI-imbalance paired windows from the full dataset were selected for visualization and statistical inspection. Time-series inspection revealed that peaks in the robustly standardized Rhythm Disturbance Index (RDI) typically coincide with increases in the Movement Imbalance Index within analysis windows. Cross-sectionally, RDI was strongly associated with imbalance (Pearson r = 0.8383; R2 = 0.7027) and maintained a robust monotonic relation (Spearman ρ = 0.8193). The classifier based on RDI achieved excellent discrimination, with a small residual standard error (SE = 0.0955), indicating a low typical prediction error on the scale of the outcome. The scatter displayed heteroscedasticity at higher RDI levels; accordingly, inference should rely on prediction bands and heteroscedasticity-robust or weighted estimators. No evident curvature or leverage clusters were observed over the sampled range. These concurrent associations support RDI as a sensitive quantitative indicator of symmetry disruption.
3.4. Decoupling of RDI and Heart Rate
Therefore, to achieve more accurate detection of rhythm-related anomalies, it is necessary to incorporate other physiological or biomechanical signals, such as accelerometer or gyroscope data [27]. As illustrated in Figure 6 these modalities are more sensitive to the temporal and kinematic characteristics that underlie rhythmic disruption. RDI focuses more on the stability and performance of the movement control system in terms of rhythmicity. This result supports the independent value of RDI as a heart rate-independent, complementary correlational indicator for monitoring motor status and identifying abnormalities.
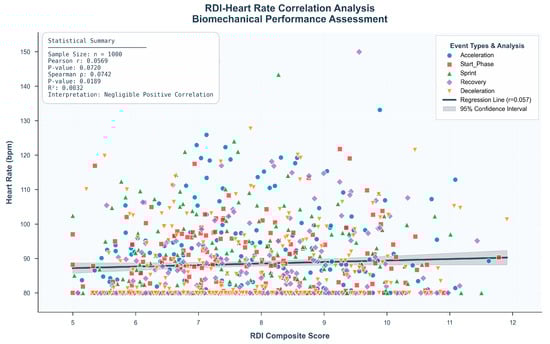
Figure 6.
This study evaluated the relationship between the Rhythm Disturbance Index (RDI) and traditional heart rate measures. A scatter plot analysis was performed on 1000 labeled samples to investigate the association between RDI and heart rate. As demonstrated in the upper right quadrant of Figure 6, a comprehensive correlation analysis was conducted to examine the association between heart rate and the composite rhythmic deviation index (RDI) across 1000 recorded events. The Pearson correlation coefficient was r = 0.0569, and the Spearman rank correlation was ρ = 0.0742 (p > 0.05), both indicating a statistically non-significant and weak relationship. The coefficient of determination (R2 = 0.0032) further supported that heart rate accounted for less than 1% of the variance in RDI values.
This figure demonstrates that the Rhythm Disturbance Index (RDI) remains largely independent of heart rate across different activities and participants. The regression line is nearly flat, and the overall correlation is weak and statistically non-significant (Pearson r = 0.0742, p > 0.05). The event-specific color patterns reveal no systematic increase in RDI with higher heart rates, indicating that cardiovascular load does not substantially influence rhythmic disturbance. Collectively, these results confirm the HR-independent nature of RDI and reduce concerns about heart rate acting as a confounding variable.
3.5. Inter-Individual RDI Differences
To further characterize inter-individual variability, athlete-level symmetry disturbance outcomes were summarized and visualized as both a disturbance profile and a clustering map Figure 7. As shown, substantial heterogeneity was observed across athletes in terms of disturbance magnitude and direction, suggesting distinct symmetry-control phenotypes rather than a uniform response pattern. This visualization facilitates the identification of high-risk individuals and provides an intuitive basis for subsequent subgroup comparisons and personalized monitoring.
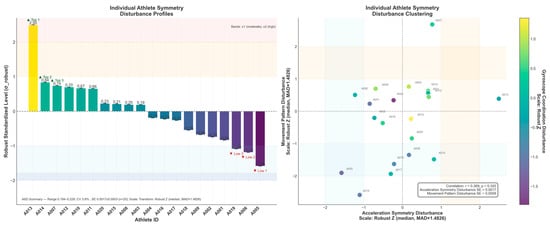
Figure 7.
This study employed a robust Z-standardization approach to visualize and stratify individual athletes’ symmetry and movement-pattern disturbances. The unidimensional profile revealed that athlete A013 reached the moderate deviation threshold (≥+1), indicating pronounced rhythmic instability, whereas athletes A005 and A019 exhibited high stability (<−1). The two-dimensional clustering analysis further illustrated heterogeneous disturbance patterns: A007, A003, A010, A012, and A004 occupied the “dual-high” quadrant, representing high-risk cases with concurrent symmetry and pattern deviations. In contrast, A013 showed elevated asymmetry yet stable movement patterns, suggesting a potential compensatory mechanism. Additionally, the overall correlation between symmetry and movement-pattern disturbances was weak and nonsignificant (r ≈ 0.369, p ≈ 0.320), indicating that these dimensions are not strongly coupled and should be evaluated independently. Given the low measurement variability (CV ≈ 3.8%; SE ≈ 10−3 scale), this multidimensional, robust, and standardized framework demonstrates high reliability and practical value for individualized risk identification, early warning monitoring, and precision-based training interventions in athletic performance management.
4. Discussion
The Rhythm Disruption Index (RDI) proposed in this study is a physiologically interpretable metric for quantifying subtle fluctuations in exercise rhythm. A notable observation is that there is no significant correlation between the RDI and traditional heart rate-based metrics, indicating that the RDI can capture neuromuscular dynamics and is largely independent of macro-level cardiovascular metrics. Unlike heart rate variability, which primarily reflects autonomic regulation of cardiac output [28], the RDI is more sensitive to micro-level sensorimotor perturbations and is strongly and positively correlated with loss of bilateral motor symmetry, indicating that it can flag asymmetrical imbalances as they begin to emerge in the locomotor system. sEMG can capture localized muscle fatigue and neuromuscular irregularities even when HR/HRV show minimal change, particularly in isometric or short-burst tasks [29]. As demonstrated, surface EMG (sEMG) signals could reliably detect localized muscle fatigue and neuromuscular irregularities that do not coincide with significant changes in HR or HRV, particularly during isometric contractions or sudden gait perturbations [30]. Heart-rate variability primarily indexes autonomic modulation and can be insensitive to rapid neuromotor adjustments during exercise; hence, cardiac metrics alone may underrepresent sensorimotor disruption [31]. highlighted the limitations of HRV in capturing rapid neuromotor adjustments under stress or fatigue, concluding that exclusive reliance on cardiac metrics may lead to an underestimation of physiological disruption during dynamic tasks [32].
The current study utilized only acceleration, gyroscope, and heart rate signals. Previous research [33]. has shown that incorporating physiologically rich signals, such as electromyography (EMG), can significantly enhance both the interpretability of rhythm anomaly detection and the accuracy of complex motion classification.
Kobsar et al. reviewed 82 studies and found 100 Hz to be the modal sampling rate for valid and reliable spatiotemporal gait outcomes, which is taken as the conventional benchmark [34]. Arvidsson et al. (2019) likewise noted in their clinical PA-measurement paper that “the acceleration signal related to human movement is primarily found below 10 Hz,” which explains why low-rate accelerometry remains informative for gross motor behavior [35,36]. On this basis, the use of 10 Hz is defensible for trunk-level rhythm and bilateral-coordination analysis, whose dominant content lies around 1–4 Hz; at the same time, explicitly acknowledge that high-frequency phenomena (impact peaks, very rapid segment rotations, and fine event timing) will be under-sampled and should not be interpreted as if the data had been collected at clinical gait-analysis rates.
At a 10 Hz working rate, the inertial stream effectively performs a first-stage temporal smoothing: it preserves the macroscopic locomotor envelope while attenuating high-frequency transients that are irrelevant to symmetry assessment. This reduction in fine-scale noise (e.g., minor muscle tremor or shoe–ground micro-slip) mitigates the “forest-for-the-trees” problem common with higher-rate recordings, enabling direct focus on the salient phases of the gait cycle (heel strike, mid-stance, toe-off). Computationally, the smoother, lower-bandwidth signal stabilizes detection of the fundamental cycle and key events, yielding simpler and more robust symmetry metrics that are less susceptible to spurious triggers from high-frequency fluctuations [37].
Although a 10 Hz sensor cannot capture the instantaneous details of rapid imbalance, it is fully capable of revealing the macro-level asymmetrical patterns of movement. This asymmetry is precisely the precursor or manifestation of many imbalances and pathological conditions.
Because symmetry is a relative and trend-based value, it does not depend on absolute high-speed sampling. It works by comparing the movement characteristics of the left and right sides of the body, or the front and rear directions, over one or more complete movement cycles.
Consistent with our symmetry-oriented, trunk-level focus, prior work has shown that the informative band of running dynamics lies predominantly below 10 Hz: vertical dynamic running load can be reconstructed from body motion restricted to 1–10 Hz (Van Nimmen et al., 2022) [38]. In treadmill running, a 10 Hz low-pass cutoff on sacral IMU data optimizes the association with peak vertical GRF and improves contact-time estimation (Day et al., 2021) [39]. Complementing these biomechanical results, a clinical HAR sampling-frequency study reported that downsampling to ~10 Hz maintains recognition accuracy while markedly reducing data volume, facilitating long-duration monitoring.
Additionally, integrating sEMG with IMU signals has been shown to improve sensitivity and reliability in fatigue detection [40] demonstrated that integrating surface EMG (sEMG) with inertial measurement units (IMUs) significantly improves model sensitivity and reliability in fatigue detection scenarios. The VAE-derived rhythm metric covaries with bilateral asymmetry and is largely insensitive to heart rate, suggesting it reflects neuromotor coordination rather than cardiovascular load. That said, the evidence is associational: a cross-sectional, windowed design with subject clustering may inflate precision; cadence/speed, task heterogeneity, and sensor placement can confound both rhythm and asymmetry; performance depends on architecture and preprocessing choices; and there is a lack of kinetic gold standards for criterion validity. To strengthen inference, future analyses should use subject-blocked cross-validation with cluster-robust standard errors, model cadence/speed, and device/session via covariates or mixed effects; report calibration and decision curves alongside AUC; and include ablations plus window/filter sensitivity checks. For generalizability and prognostic value, pursue multi-site external validation, domain adaptation with subject-specific thresholding, and longitudinal follow-up, ideally anchored to sEMG/force plate references. Pending these steps, the method is best positioned as a low-label, field-deployable screening and monitoring tool for risk stratification.
End-to-end execution was measured to include pre-training cross-validation initialization, the main training loop, and post-training analyses (latent space interpretability and cadence/stride variability computation), totaling ~8–12 min on CPU. On different hardware, wall-clock times were observed as ~3–6 min on a single NVIDIA GPU (e.g., 3090/4090) and ~4–8 min on Apple Silicon with MPS. Durations were governed primarily by data scale (~67 effective windows; 708 features; 1–2 batches/epoch), early stopping (triggered at epoch 47; 9.27 s/epoch; total 435.8 s/7.3 min recorded), and modest overhead from 5-fold CV. Post-training metrics added approximately 1–3 min. An upper bound without early stopping (full 200 epochs) was estimated at ~30–35 min (CPU), ~12–18 min (GPU), and ~15–22 min (MPS), excluding extreme data scales or I/O limitations.
Despite initial efforts to implement a lightweight model architecture, further hardware-level optimization is essential for practical deployment on wearable platforms. Drawing inspiration from such approaches, future studies could consider deploying the β-TCVAE model on embedded low-power hardware through techniques such as model pruning, quantization, and transfer learning. This would enable real-time, on-device anomaly detection in ecological sports settings [41,42].
5. Conclusions
This study introduces a structure-enhanced β-TCVAE framework that quantitatively captures rhythmic instability in human motion using multimodal wearable sensor data. Empirical analyses demonstrated that RDI is strongly associated with bilateral symmetry loss (r = 0.838, R2 = 0.702, AUC = 0.823), yet it is largely independent of cardiovascular parameters, such as heart rate (r ≈ 0.0569, p > 0.05). This decoupling highlights RDI’s specificity to neuromuscular coordination rather than systemic exertion, positioning it as a heart-rate-agnostic biomarker of motor rhythm integrity. Moreover, the individualized RDI profiles revealed heterogeneous disturbance patterns among athletes, enabling early detection of latent asymmetries and compensatory movement strategies. Collectively, these findings establish RDI as a reliable, interpretable, and wearable metric for real-time assessment of rhythmic and symmetry-related abnormalities. The proposed β-TCVAE framework enhances the sensitivity, robustness, and physiological transparency of rhythm analysis, thereby supporting precision monitoring, proactive injury prevention, and personalized training optimization. Future research should expand the dataset to include diverse populations and additional biosignals such as EMG and force plate data, enabling longitudinal validation and causal modeling of rhythm–symmetry dynamics. Ultimately, this framework represents a critical step toward integrated, AI-driven biomechanics linking neural rhythm, motion symmetry, and athletic performance in a unified computational paradigm.
Author Contributions
Conceptualization, Y.L.; data curation, J.L. (Jingsong Liu), X.C. and X.Z.; investigation, Y.L.; methodology, J.L. (Jingsong Liu); project administration, X.D.; resources, J.L. (Jie Liu); software, J.L. (Jingsong Liu); supervision, X.D.; visualization, J.L. (Jingsong Liu) and J.L. (Jie Liu); writing—original draft preparation, J.L. (Jingsong Liu) and Y.L.; writing—review and editing, X.D. All authors have read and agreed to the published version of the manuscript.
Funding
This research received no external funding.
Institutional Review Board Statement
This study was conducted as a minimal-risk, noninvasive observational investigation. Adults were fitted with triaxial accelerometers, gyroscopes, and a chest-worn heart-rate strap; no invasive procedures, device/pharmacologic interventions, radiation exposure, or biospecimen collection were performed. Written informed consent was obtained. The study was carried out in accordance with the Declaration of Helsinki and applicable privacy/data-protection regulations; all data were de-identified before storage and analyzed only in aggregate. Institutional Review Board approval/exempt determination was granted by Shandong Huayu Engineering College, and participant risk was deemed negligible.
Informed Consent Statement
Written informed consent was obtained from all participants before enrollment; consent for the use of de-identified images was also obtained.
Data Availability Statement
In part, the dataset was supplemented by the CC0-licensed public Intelligent Biosensor Dataset. Data from the experimental section may be obtained upon reasonable request to the corresponding author, subject to privacy or ethical restrictions.
Acknowledgments
The authors would like to acknowledge the reviewers for their valuable suggestions.
Conflicts of Interest
The authors declare no conflicts of interest.
Abbreviations
The following abbreviations are used in this manuscript:
| VAE | Variational Autoencoder |
| RDI | Rhythm Disturbance Index |
| HRV | Heart Rate Variability |
| EMG | Electromyography |
| GRU | Gated recurrent unit |
| MII | Movement Imbalance Index |
References
- Ardigò, L.P.; Ouergui, I.; Nobari, H.; Formenti, D. Some Insights Regarding Symmetry Relevance in Biomedicine. Symmetry 2022, 14, 2046. [Google Scholar] [CrossRef]
- Franco-García, J.M.; Rodal, M.; Gutiérrez-Horrillo, R.; Carlos-Vivas, J.; Pérez-Gómez, J.; Nobari, H.; Ardigò, L.P.; Gianikellis, K. Shoulder Kinematics and Symmetry at Different Load Intensities during Bench Press Exercise. Symmetry 2021, 13, 1859. [Google Scholar] [CrossRef]
- Trecroci, A.; Bongiovanni, T.; Cavaggioni, L.; Pasta, G.; Formenti, D.; Alberti, G. Agreement Between Dribble and Change of Direction Deficits to Assess Directional Asymmetry in Young Elite Football Players. Symmetry 2020, 12, 787. [Google Scholar] [CrossRef]
- Tucker, C.B.; Hanley, B. Gait Variability and Symmetry in World-Class Senior and Junior Race Walkers. J. Sports Sci. 2016, 35, 1739–1744. [Google Scholar] [CrossRef] [PubMed]
- Paterno, M.V.; Schmitt, L.C.; Ford, K.R.; Rauh, M.J.; Myer, G.D.; Huang, B.; Hewett, T.E. Biomechanical Measures during Landing and Postural Stability Predict Second Anterior Cruciate Ligament Injury after Anterior Cruciate Ligament Reconstruction and Return to Sport. Am. J. Sports Med. 2010, 38, 1968–1978. [Google Scholar] [CrossRef]
- Knapik, J.J.; Bauman, C.L.; Jones, B.H.; Harris, J.M.; Vaughan, L. Preseason Strength and Flexibility Imbalances Associated with Athletic Injuries in Female Collegiate Athletes. Am. J. Sports Med. 1991, 19, 76–81. [Google Scholar] [CrossRef]
- Exell, T.A.; Gittoes, M.J.R.; Irwin, G.; Kerwin, D.G. Gait Asymmetry: Composite Scores for Mechanical Analyses of Sprint Running. J. Biomech. 2012, 45, 1108–1111. [Google Scholar] [CrossRef]
- Morishige, Y.; Harato, K.; Kobayashi, S.; Niki, Y.; Matsumoto, M.; Nakamura, M.; Nagura, T. Difference in Leg Asymmetry between Female Collegiate Athletes and Recreational Athletes during Drop Vertical Jump. J. Orthop. Surg. Res. 2019, 14, 424. [Google Scholar] [CrossRef]
- Xu, D.; Quan, W.; Zhou, H.; Sun, D.; Baker, J.S.; Gu, Y. Explaining the Differences of Gait Patterns between High and Low-Mileage Runners with Machine Learning. Sci. Rep. 2022, 12, 2981. [Google Scholar] [CrossRef]
- Thill, M.; Konen, W.; Wang, H.; Bäck, T. Temporal Convolutional Autoencoder for Unsupervised Anomaly Detection in Time Series. Appl. Soft Comput. 2021, 112, 107751. [Google Scholar] [CrossRef]
- Kapsecker, M.; Möller, M.C.; Jonas, S.M. Disentangled Representational Learning for Anomaly Detection in Single-Lead Electrocardiogram Signals Using Variational Autoencoder. Comput. Biol. Med. 2025, 184, 109422. [Google Scholar] [CrossRef]
- Patel, P.; Enzastiga, D.; Casamento-Moran, A.; Christou, E.A.; Lodha, N. Increased Temporal Stride Variability Contributes to Impaired Gait Coordination after Stroke. Sci. Rep. 2022, 12, 12679. [Google Scholar] [CrossRef] [PubMed]
- Tao, W.; Liu, T.; Zheng, R.; Feng, H. Gait Analysis Using Wearable Sensors. Sensors 2012, 12, 2255–2283. [Google Scholar] [CrossRef]
- Zhang, S.; Li, Y.; Zhang, S.; Shahabi, F.; Xia, S.; Deng, Y.; Alshurafa, N. Deep Learning in Human Activity Recognition with Wearable Sensors: A Review on Advances. Sensors 2022, 22, 1476. [Google Scholar] [CrossRef] [PubMed]
- Staffini, A.; Svensson, T.; Chung, U.; Svensson, A.K. A Disentangled VAE-BiLSTM Model for Heart Rate Anomaly Detection. Bioengineering 2023, 10, 683. [Google Scholar] [CrossRef] [PubMed]
- Zhang, Q.; Li, Y.; Wang, X.; Zhang, X.; Liu, S.; Yuan, H.; Yang, X.; Li, D.; Jin, Z.; Zhang, Y.; et al. Flexible Piezoresistive Sensor with High Stability Based on GO@PDMS-PU Porous Structure. Symmetry 2025, 17, 773. [Google Scholar] [CrossRef]
- Zhu, P.; Niu, M.; Liang, S.; Yang, W.; Zhang, Y.; Chen, K.; Pan, Z.; Mao, Y. Non-Hand-Worn, Load-Free VR Hand Rehabilitation System Assisted by Deep Learning Based on Ionic Hydrogel. Nano Res. 2025, 18, 94907301. [Google Scholar] [CrossRef]
- Pham, D.; Le, T. Auto-Encoding Variational Bayes for Inferring Topics and Visualization. In Proceedings of the 28th International Conference on Computational Linguistics, Barcelona, Spain, 8–13 December 2020; International Committee on Computational Linguistics: Stroudsburg, PA, USA; pp. 5223–5234. [Google Scholar] [CrossRef]
- Cao, Y.; Gao, S.; Yu, H.; Zhao, Z.; Zang, D.; Wang, C. A Motor Imagery Classification Model Based on Hybrid Brain-Computer Interface and Multitask Learning of Electroencephalographic and Electromyographic Deep Features. Front. Physiol. 2024, 15, 1487809. [Google Scholar] [CrossRef]
- Konz, L.; Hill, A.; Banaei-Kashani, F. ST-DeepGait: A Spatiotemporal Deep Learning Model for Human Gait Recognition. Sensors 2022, 22, 8075. [Google Scholar] [CrossRef]
- Guo, J.; Fan, W.; Amayri, M.; Bouguila, N. Deep Clustering Analysis via Variational Autoencoder with Gamma Mixture Latent Embeddings. Neural Netw. 2025, 183, 106979. [Google Scholar] [CrossRef]
- Wang, Y.; Shan, G.; Li, H.; Wang, L. A Wearable-Sensor System with AI Technology for Real-Time Biomechanical Feedback Training in Hammer Throw. Sensors 2022, 23, 425. [Google Scholar] [CrossRef]
- Jiang, X.; Li, J.; Zhu, Z.; Liu, X.; Yuan, Y.; Chou, C.; Yan, S.; Dai, C.; Jia, F. MovePort: Multimodal Dataset of EMG, IMU, MoCap, and Insole Pressure for Analyzing Abnormal Movements and Postures in Rehabilitation Training. IEEE Trans. Neural Syst. Rehabil. Eng. 2024, 32, 2633–2643. [Google Scholar] [CrossRef] [PubMed]
- Mora, N.; Cocconcelli, F.; Matrella, G.; Ciampolini, P. Detection and Analysis of Heartbeats in Seismocardiogram Signals. Sensors 2020, 20, 1670. [Google Scholar] [CrossRef] [PubMed]
- Ziya07. Intelligent Biosensor Dataset [Data Set]. Kaggle; CC0 Public Domain. Available online: https://www.kaggle.com/datasets/ziya07/intelligent-biosensor-dataset (accessed on 26 November 2025).
- Wang, H.; Zhang, H. An Anomaly Detection Method for Multivariate Time Series Data Based on Variational Autoencoders and Association Discrepancy. Mathematics 2025, 13, 1209. [Google Scholar] [CrossRef]
- Romano, C.; Schena, E.; Formica, D.; Massaroni, C. Comparison between Chest-Worn Accelerometer and Gyroscope Performance for Heart Rate and Respiratory Rate Monitoring. Biosensors 2022, 12, 834. [Google Scholar] [CrossRef]
- Galperin, I.; Buzaglo, D.; Gazit, E.; Shimoni, N.; Tamir, R.; Regev, K.; Karni, A.; Hausdorff, J.M. Gait and Heart Rate: Do They Measure Trait or State Physical Fatigue in People with Multiple Sclerosis? J. Neurol. 2024, 271, 4462–4472. [Google Scholar] [CrossRef]
- Daniel, N.; Małachowski, J.; Sybilski, K.; Siemiaszko, D. Quantitative Assessment of Muscle Fatigue during Rowing Ergometer Exercise Using Wavelet Analysis of Surface Electromyography (sEMG). Front. Bioeng. Biotechnol. 2024, 12, 1344239. [Google Scholar] [CrossRef]
- Gronwald, T.; Hoos, O. Correlation Properties of Heart Rate Variability during Endurance Exercise: A Systematic Review. Ann. Noninvasive Electrocardiol. 2019, 25, e12697. [Google Scholar] [CrossRef]
- Hayano, J.; Yuda, E. Pitfalls of Assessment of Autonomic Function by Heart Rate Variability. J. Physiol. Anthropol. 2019, 38, 3. [Google Scholar] [CrossRef]
- Badoni, A.; Agarwal, K.; Pinkoski, A.; Samant, R.; DeLorey, D.; Vette, A. Muscle Fatigue Detection Using Near-Infrared Spectroscopy and Electromyography. Curr. Dir. Biomed. Eng. 2022, 8, 201–204. [Google Scholar] [CrossRef]
- Arzehgar, A.; Seyedhasani, S.N.; Ahmadi, F.B.; Bagheri Baravati, F.; Sadeghi Hesar, A.; Kachooei, A.R.; Aalaei, S. Sensor-Based Technologies for Motion Analysis in Sports Injuries: A Scoping Review. BMC Sports Sci. Med. Rehabil. 2025, 17, 15. [Google Scholar] [CrossRef] [PubMed]
- Kobsar, D.; Charlton, J.M.; Tse, C.T.F.; Esculier, J.-F.; Graffos, A.; Krowchuk, N.M.; Thatcher, D.; Hunt, M.A. Validity and reliability of wearable inertial sensors in healthy adult walking: A systematic review and meta-analysis. J. Neuroeng. Rehabil. 2020, 17, 62. [Google Scholar] [CrossRef] [PubMed]
- Yamane, T.; Kimura, M.; Morita, M. Effects of Sampling Frequency on Human Activity Recognition with Machine Learning Aiming at Clinical Applications. Sensors 2025, 25, 3780. [Google Scholar] [CrossRef] [PubMed]
- Arvidsson, D.; Fridolfsson, J.; Börjesson, M. Measurement of physical activity in clinical practice using accelerometers. J. Intern. Med. 2019, 286, 137–153. [Google Scholar] [CrossRef]
- Angelini, L.; Carpinella, I.; Cattaneo, D.; Ferrarin, M.; Gervasoni, E.; Sharrack, B.; Paling, D.; Nair, K.P.S.; Mazzà, C. Is a Wearable Sensor-Based Characterization of Gait Robust Enough to Overcome Differences Between Measurement Protocols? A Multi-Centric Pragmatic Study in Patients with Multiple Sclerosis. Sensors 2019, 20, 79. [Google Scholar] [CrossRef]
- Van Nimmen, K.; Vanwanseele, B.; Van den Broeck, P. Reconstruction of the Vertical Dynamic Running Load from the Registered Body Motion. Vibration 2022, 5, 464–482. [Google Scholar] [CrossRef]
- Day, E.M.; Alcantara, R.S.; McGeehan, M.A.; Grabowski, A.M.; Hahn, M.E. Low-pass filter cutoff frequency affects sacral-mounted inertial measurement unit estimations of peak vertical ground reaction force and contact time during treadmill running. J. Biomech. 2021, 119, 110323. [Google Scholar] [CrossRef]
- Wang, T.; Meng, J.; Zhou, X.; Liu, Y.; He, Z.; Han, Q.; Li, Q.; Yu, J.; Li, Z.; Liu, Y.; et al. Reconfigurable Neuromorphic Memristor Network for Ultralow-Power Smart Textile Electronics. Nat. Commun. 2022, 13, 7432. [Google Scholar] [CrossRef]
- De Luca, C.; Tincani, M.; Indiveri, G.; Donati, E. A Neuromorphic Multi-Scale Approach for Real-Time Heart Rate and State Detection. npj Unconv. Comput. 2025, 2, 6. [Google Scholar] [CrossRef]
- Choi, Y.; Jin, P.; Lee, S.; Song, Y.; Tay, R.Y.; Kim, G.; Yoo, J.; Han, H.; Yeom, J.; Cho, J.H.; et al. All-Printed Chip-Less Wearable Neuromorphic System for Multimodal Physicochemical Health Monitoring. Nat. Commun. 2025, 16, 5689. [Google Scholar] [CrossRef]
Disclaimer/Publisher’s Note: The statements, opinions and data contained in all publications are solely those of the individual author(s) and contributor(s) and not of MDPI and/or the editor(s). MDPI and/or the editor(s) disclaim responsibility for any injury to people or property resulting from any ideas, methods, instructions or products referred to in the content. |
© 2025 by the authors. Licensee MDPI, Basel, Switzerland. This article is an open access article distributed under the terms and conditions of the Creative Commons Attribution (CC BY) license (https://creativecommons.org/licenses/by/4.0/).