You are currently viewing a new version of our website. To view the old version click .
Symmetry
  • Article
  • Open Access

25 November 2025

Simulation of Beer Fermentation Combining CFD and Fermentation Reaction Models

,
,
,
,
and
1
Key Laboratory of Impact and Safety Engineering, Ministry of Education, Ningbo University, Ningbo 315211, China
2
China Resources Snow Breweries Co., Ltd., Beijing 518133, China
*
Author to whom correspondence should be addressed.
This article belongs to the Section Physics

Abstract

Beer fermentation is a critical process that directly influences product quality and flavor. However, traditional fermentation practices often rely on empirical methods, leading to prolonged production cycles and inconsistent product quality. This study presents a multiphysics-coupled simulation model that integrates computational fluid dynamics (CFD) with fermentation reaction kinetics to address challenges in temperature control and monitoring in large-scale fermenters. The model incorporates the Navier–Stokes equations for fluid flow, energy equations for heat transfer, fermentation kinetics for sugar metabolism, and a yeast cell proliferation model based on population balance theory. The model is validated through experiments at both lab scale (0.3 m3) and industrial scale (375 m3). Statistical analysis shows excellent agreement, with coefficients of determination (R2) for alcohol and sugar content reaching up to 0.99 and 0.96 at the lab scale, and 0.93 and 0.85 at the industrial scale, respectively. Key quantitative results from the industrial-scale validation demonstrate that the model accurately predicts the primary fermentation dynamics: within a 100 h period, alcohol concentration increased from 0% to approximately 6%, while sugar content decreased from 13 °P to 2 °P, closely matching experimental data. Crucially, the simulation captures a significant temperature overshoot at approximately 48 h, where the peak temperature at the top of the fermenter reached 16.01 °C (a 3 °C overshoot above process requirements). This pronounced vertical temperature gradient, arising from symmetry-breaking thermal conditions on the fermenter walls, was found to induce strong, asymmetric natural convection with flow velocities up to 13.2 mm·s−1, revealing spatial heterogeneities that are critical for optimizing fermenter design. At the lab scale, the simulation also accurately captures the observed quadratic temperature rise, further confirming the model’s robustness. This study provides a theoretical foundation for optimizing cooling jacket configurations and control strategies, ultimately improving fermentation efficiency and ensuring consistent product quality.

1. Introduction

The fermentation stage represents a pivotal process, exerting a profound influence on the final quality and flavor profile of beer []. In traditional beer brewing, fermentation predominantly depends on empirical knowledge and manual operations. This conventional methodology frequently leads to extended fermentation cycles, inconsistent product quality, and suboptimal production efficiency. With the continuous surge in global beer demand, these traditional approaches are no longer sufficient to meet the escalating requirements for both quantity and quality. To tackle these challenges, contemporary brewing technologies have come to the fore, encompassing continuous fermentation processes [] and high-gravity brewing with dilution [,]. These technological advancements have significantly bolstered the efficiency and consistency of beer production. They not only enable more precise control over the fermentation process but also contribute to enhanced product quality.
Over the past few decades, the beer production industry has witnessed a remarkable expansion, leading to a proportional increase in the volumes of fermenters. Medium-sized breweries commonly employ fermenters with capacities ranging from 30 to 300 m3. In contrast, larger breweries may utilize fermenters with capacities of up to 500 m3 [], and some of the largest brewing operations even deploy tanks with a capacity of as much as 1000 m3. Although these large-scale fermenters significantly enhance production capacity, they also pose new challenges in terms of temperature control and monitoring. To facilitate effective cleaning and sterilization, conical fermenters are generally designed without complex internal structures. This design feature, however, limits the installation of temperature measurement equipment, which is usually restricted to the tank wall. The fermentation system operates like a “black box”, where operators have to adjust cooling valves based solely on limited wall temperature data while observing subsequent changes in wall temperature. This information asymmetry often results in delayed responses and suboptimal control strategies. Furthermore, the cooling jackets used for regulating fermentation temperature need to be positioned at an appropriate distance from temperature sensors to avoid interference, further complicating the precise monitoring of temperature changes throughout the fermentation process. Research findings indicate that temperatures vary at different depths, including the wall surface, 0.5 m within the wall, and 1.0 m within the wall []. These variations are influenced by both the fermentation stage and the height within the fermenter. For instance, during the maturation phase, temperature differences on the cone wall can reach up to 10 °C. Radial temperature difference primarily due to the complex dynamic characteristics of industrial-scale fermentation systems, including significant thermal inertia, time delays, and nonlinearity [].
Despite recent advancements in control systems and simulation techniques, such as intelligent proportional–integral–derivative (PID) methods [,] and fuzzy control algorithms [], they struggle to effectively regulate these complex dynamic systems because they lack direct insight into the internal spatial conditions within the tank. Therefore, developing tools capable of providing comprehensive internal spatial information is essential for addressing these operational challenges, highlighting the urgent need for simulation methods in practical applications.
In this context, simulation has emerged as a crucial tool for deepening our understanding and optimizing these complex systems. Computational Fluid Dynamics (CFD) first found its footing in the aerospace sector, where it was applied to aircraft design for aerodynamic shape optimization and flight performance enhancement [,,]. It later extended to the turbomachinery domain, playing a key role in internal flow field analysis for turbines and related mechanical systems [,,]. Beyond these, CFD has been applied to biomedical hemodynamics [,,,] for analyzing cardiovascular flow dynamics and disease mechanisms, as well as environmental pollutant dispersion modeling [,,,] to predict the transport of contaminants in air and water. These applications across complex systems, involving fluid flow, heat transfer, mass transfer, chemical reactions, biochemical reactions, and multiphase flows, help people solve complex problems and understand phenomena.
Likewise, in the fields of bioprocessing and fermentation, the application of CFD has also deepened, addressing key challenges for specific fermentation subjects. For instance, in biogas fermentation, researchers utilize CFD to simulate and optimize the mixing of material fluids inside the reactor to improve gas production efficiency []. When producing biohydrogen from molasses, CFD is used to optimize the hydrodynamic characteristics of continuous stirred-tank reactors (CSTR) and horizontal reactors, thereby enhancing the hydrogen production rate [,]. For the cultivation of lactic acid bacteria, CFD can accurately predict the pH gradients formed within the fermenter due to metabolic acid production and the addition of alkali []. On a microscopic scale, CFD can even simulate the simultaneous extraction and fermentation process occurring in a single sugar beet cossette []. Furthermore, in large-scale aerobic fermentations such as those with S. cerevisiae, CFD combined with the Euler–Lagrange method is used to analyze the substrate concentration gradients experienced by microorganisms, providing a critical basis for designing scale-down experimental systems that can faithfully reflect industrial conditions []. However, in the critical industrial sector of alcoholic fermentation, while foundational CFD studies exist, key research gaps pertinent to different fermentation types remain. In the field of red wine fermentation, Zenteno et al. [] made an early attempt by simplifying the process into several “compartments,” yielding a low-resolution engineering model. A significant advancement was made by Miller et al. [], who developed a high-fidelity model coupling CFD and Finite Element Analysis (FEA). The focus of Miller’s work was to address the complexities of a multiphase (solid–liquid) system arising from the solid “cap” of grape skins and seeds. Their key contribution was the experimental determination of the cap’s thermal properties, enabling an accurate prediction of spatial distributions for temperature, biomass, and productivity in red wine fermentations.
While the work of Miller et al. provides a robust framework for multiphase alcoholic fermentations, industrial beer fermentation presents a distinct set of challenges that have not yet been adequately addressed. First, unlike the multiphase system of red wine, beer fermentation is a single-phase (liquid) process. The heterogeneity within it does not originate from a solid phase but is driven by thermal asymmetry induced by external cooling on very large-scale (often >300 m3) fermenters. Second, existing models for alcoholic fermentation, including that of Miller, have not integrated a detailed yeast population balance model that describes cell proliferation, division, and apoptosis—a biological process critical to the overall reaction kinetics.
Consequently, there remains a pressing need for a multiphysics model specifically tailored for industrial-scale beer fermentation that couples computational fluid dynamics (CFD), fermentation kinetics, and yeast population dynamics. From a practical engineering standpoint, the means for monitoring the internal state of fermenters in industrial production are extremely limited, relying primarily on a few temperature sensors located on the tank wall. This often leads to control strategies that are delayed and suboptimal. Consequently, there is an urgent need for a high-fidelity simulation tool capable of revealing the spatiotemporal distribution of key internal parameters (e.g., temperature, velocity, and species concentrations) to overcome the limitations of the “black box” operational paradigm.
To address the aforementioned research gaps, this study sets the following specific objectives:
  • To develop and establish a multiphysics model that couples computational fluid dynamics (CFD), fermentation kinetics, and yeast population dynamics to simulate the industrial-scale beer fermentation process.
  • To utilize the model to reveal the spatiotemporal distribution patterns of key parameters within industrial fermenters, such as temperature and velocity fields, as well as ethanol and sugar concentrations, thereby providing a theoretical basis for understanding the complex phenomena inside the “black box.”
  • To comprehensively validate the accuracy and reliability of the established model against experimental data from both lab-scale (0.3 m3) and industrial-scale (375 m3) fermenters, ensuring its effectiveness for practical applications.
To achieve the aforementioned objectives, it is essential to understand the complex physicochemical mechanisms within the fermenter. The intrinsic complexity of industrial-scale beer fermentation stems from a multiphysics coupling process driven by biochemical reactions. The mechanistic linkage is as follows: First, the sugar metabolism by yeast is an exothermic reaction that not only converts high-density sugars into lower-density ethanol but also generates a significant heat source within the wort. Second, the release of heat and the change in composition collectively lead to changes in the local density and viscosity of the wort. In the gravitational field of a large conical tank, these local density differences create buoyancy forces, which in turn drive large-scale natural convection. Finally, this natural convection is the primary mode of mass and energy mixing and transport within the tank. However, it interacts with the forced cooling from the tank walls and the continuous internal heat generation, ultimately leading to the formation of non-uniform spatial gradients of temperature, species concentration, and yeast population density. Evidently, a strongly nonlinear, bidirectional coupling exists between fluid flow, heat transfer, mass transfer, and yeast population dynamics. This provides a sound theoretical basis for developing a coupled flow-heat transfer-mass transfer-population model that can integrate these interactions.
In this study, a multiphysics coupled simulation model is proposed. It combined CFD with fermentation reaction kinetics, establishes a theoretical framework for fermentation reactions. This model incorporates fundamental equations, such as Navier–Stokes equations, energy transport equation, species transport equation, reaction equation, Michaelis-Menten kinetics equation, and population balance equation. The reliability of the model will be validated through lab-scale (0.3 m3) and industrial-scale (375 m3) experiments.
The relevance of this study to the journal Symmetry lies in its in-depth analysis of symmetry and symmetry-breaking phenomena within an industrial-scale beer fermentation process. Geometrically, the conical fermenter possesses axial symmetry. In an idealized scenario, the fermentation process—including temperature and species distribution—would also exhibit this symmetry, leading to a spatially uniform state.
However, our research demonstrates that the crucial process of thermal regulation introduces a fundamental break in this symmetry. The cooling jackets, located on the periphery of the tank, create asymmetric thermal boundary conditions. This thermal asymmetry is the primary driver of the complex dynamics observed. It induces non-uniform temperature gradients and density variations within the wort, which in turn give rise to buoyancy-driven natural convection. The resulting fluid motion is characterized by large-scale, asymmetric circulation patterns and vortices, as revealed by our CFD simulations.
Therefore, the core of our work is to model and understand how these deviations from a symmetric state govern the efficiency of heat transfer, the uniformity of the fermentation reaction, and ultimately, the quality of the final product. By studying the asymmetric temperature and flow fields that emerge from a symmetrically designed system, we provide a basis for optimizing control strategies to manage these effects. This focus on the transition from a symmetric system to a complex, asymmetric dynamic state makes our paper a compelling contribution to the scope of Symmetry.
The primary contributions and novelties of this work are summarized as follows:
  • Development of a Comprehensive Multiphysics Model: This study pioneers a model that, for the first time, couples Computational Fluid Dynamics (CFD) with fermentation kinetics and yeast population dynamics specifically for industrial-scale beer fermentation. This integrated approach provides a more holistic and accurate representation of the process than previously possible.
  • Validation Against Industrial-Scale Experimental Data: Unlike many simulation studies limited to lab-scale or theoretical validation, our model’s reliability is rigorously verified using data from both a 0.3 m3 pilot-scale and a 375 m3 industrial-scale fermenter, bridging the crucial gap between numerical simulation and real-world industrial practice.
  • Revelation of Internal Spatiotemporal Dynamics: The model provides an unprecedented high-fidelity visualization of the “black box,” revealing the complex, asymmetric spatiotemporal distributions of temperature, velocity, and species concentrations. This offers critical insights into the internal transport phenomena that are impossible to obtain from wall sensors alone.
  • A Theoretical Basis for Process Optimization: By elucidating the mechanisms behind spatial heterogeneity and symmetry-breaking driven by thermal control, this research provides a robust theoretical tool for optimizing control strategies, improving fermentation uniformity, and ultimately enhancing final product consistency and quality.

2. Mathematical and Numerical Modeling

The theoretical framework for simulating beer fermentation must account for the complex interplay of its underlying physicochemical mechanisms. The process is driven by the metabolism of sugars (monosaccharides, disaccharides, and trisaccharides) by yeast, which is an exothermic reaction that generates a significant internal heat source. This biochemical activity is highly temperature-dependent, with reaction rates and yeast proliferation kinetics following Arrhenius-type laws. The consumption of sugars occurs in a preferential sequence, influenced by inhibitory effects among the different types.
The heat released during fermentation, coupled with the conversion of higher-density sugars into lower-density ethanol, creates density gradients within the wort. In the gravitational field of a large-scale fermenter, these density differences induce buoyancy forces, driving large-scale natural convection. This fluid motion is the primary mode of transport for heat, substrates, and yeast cells, but it interacts with external cooling from the tank walls to create non-uniform spatial gradients. This establishes a strongly coupled, nonlinear system where fluid flow, heat transfer, reaction kinetics, and yeast population dynamics are interdependent. A comprehensive model is therefore necessary to capture these interactions. To accurately capture these complex interactions, the multiphysics coupled model for beer fermentation developed in this study integrates three core components: models for fluid flow and heat transfer, the reaction kinetics of fermentation, and yeast cell proliferation.

2.1. Flow and Heat Transfer

The flow of the fermentation broth is governed by the Navier–Stokes equations, and heat transfer processes are described by the energy equation. Notably, the density of the fermentation broth exhibits a temperature-dependent variation. In order to simplify the calculations while maintaining a high level of accuracy, this study applied the Boussinesq approximation. This approach effectively strikes a balance between computational efficiency and the precise representation of physical phenomena, making it especially well-suited for analyzing natural convection in liquid systems. By utilizing the Boussinesq approximation [], the Navier–Stokes equations can be treated as equations for an incompressible fluid. This treatment enables the incorporation of the natural convection driving force, which is induced by fluid density variations, into the body force term of the Navier–Stokes equations.
The control equations and energy equation [] are as follows:
u i x i = 0
u i t + u j u i x j = 1 ρ 0 p x i + ν 2 u i x j x j + g i α T T 0
u j T x j = Γ T 2 T x j x j + Q
where u i denotes the velocity component of the fermentation broth, x j represents the spatial coordinate, t signifies time, p indicates the pressure of the fermentation broth, T is the temperature of the fermentation broth, while T 0 symbolizes the reference temperature. Additionally, ρ 0 refers to the reference density of the fermentation broth, defined as its density at the reference temperature. The term ν represents the dynamic viscosity coefficient of the fermentation broth, g i denotes gravitational acceleration components in the i direction, and α stands for the thermal expansion coefficient of the fermentation broth, which reflects how much its density varies with changes in temperature. Furthermore, Γ T signifies the heat transfer coefficient and Q , captures external heat sources primarily stemming from heat released during the fermentation reaction.

2.2. Fermentation Reaction Kinetics

2.2.1. Heat Release from Fermentation Reaction

The external heat source Q in the energy equation presented in the previous section primarily originates from the heat released during fermentation reactions. This study examines the heat release associated with the fermentation reactions of monosaccharides, disaccharides, and trisaccharides, whose corresponding chemical reaction equations [] are as follows:
C 6 H 12 O 6 Yeast 2 C 2 H 5 O H + 2 C O 2 + Δ H 1
C 12 H 22 O 11 + H 2 O Yeast 4 C 2 H 5 O H + 4 C O 2 + Δ H 2
C 18 H 32 O 16 + 2 H 2 O Yeast 6 C 2 H 5 O H + 6 C O 2 + Δ H 3
In the equations provided above, Δ H 1 , Δ H 2 , Δ H 3 denote the heat released by each respective reaction, with values of 91.2 kJ·mol−1, 226.3 kJ·mol−1, and 361.3 kJ·mol−1 []. Consequently, the total external heat source in the energy equation can be expressed as:
Q = i r i Δ H i
where r i denotes the reaction rate.

2.2.2. Fermentation Reaction Rate

Based on the fundamental growth model proposed by Gee and Ramirez [], the fermentation reaction rate r i (where i = G, M, N) for various sugars (including glucose, maltose, and maltotriose) exhibits a direct proportionality to the yeast concentration c X . In this context, the subscripts G, M, and N represent glucose, maltose, and maltotriose, respectively. Accordingly, it can be expressed as:
r i = v i c X
where c X denotes the concentration of yeast. The specific fermentation rates, v i , are functions of substrate concentrations, modeled using Michaelis-Menten kinetics [,] as follows:
v G = k G × c G K G + c G
v M = k M × c M K M + c M × K G × c G K G + c G
v N = k N × c N K N + c N × K G × c G K G + c G × K M × c M K M + c M
where c G , c M , and c N represent the concentrations of three sugars; k G , k M , and k N denote the maximum fermentation reaction rates for these sugars; and K G , K M , and K N signify the Michaelis constants associated with these sugars. Furthermore, disaccharide fermentation is inhibited by monosaccharide concentration, while trisaccharide fermentation is subject to inhibition from both monosaccharide and disaccharide concentrations. Consequently, inhibition constants for monosaccharides and disaccharides are introduced as K G and K M , respectively. The maximum fermentation rate, Michaelis constant, and fermentation inhibition constant exhibit temperature dependency. Assuming that all three adhere to the indefinite integral form of the Arrhenius equation, these constants can be expressed as []:
k j = A j e E R T   j = G , M , N
K j = A H j e E H j R T
where A j , A H j , and A H j (for j = G, M, N) represent the corresponding frequency factors for k j , K j , and K j ; while E j , E H j , and E H j ' denote the activation energies. Here, R signifies the gas constant, and T stands for the absolute temperature.
The aforementioned fermentation reactions result in a decrease in sugar concentration accompanied by a concurrent increase in alcohol concentration. However, it is essential to adjust the alcohol production based on the yield coefficient. The overall reaction rate for alcohol can be expressed as follows:
r E = c X i Y E i v i
where Y E i denotes the reaction coefficient of alcohol with respect to each sugar. For instance, theoretically, 1 mole of glucose ferments to yield 2 moles of ethanol, thus Y E G = 2. However, in practical scenarios, there is a loss due to the formation of various flavor compounds; consequently, Y E G is typically observed to be 1.92. The definitions and values of the unknown parameters involved in Section 2.2.2 are detailed in Table 1.
Table 1. Parameter definitions and values 1.

2.3. Yeast Cell Proliferation

The rates of fermentation reactions are directly proportional to yeast concentration; therefore, modeling equations for yeast cell populations are essential. This study references the population balance model employed by Zhu et al. [,], which utilizes the population balance equation to characterize the cell mass distribution function n ( m ) . This function is defined as a variable dependent on cell growth, division, proliferation, and apoptosis. Here, n ( m ) denotes the distribution of the number of yeast cells per unit volume n in relation to the mass of individual yeast cells m . The formulation of the population balance equation [] is presented as follows:
n m t = m μ X n m λ m n m + 2 0 m λ m p ( m | m ) n m d m ω n m
The scale parameter of the breakage kernel γ = 400, and the death kernel constant ω = 2.75 × 10⁻⁶ s−1. This equation describes the change in the number of yeast cells ( n m t ) as the combined effect of cell growth ( m μ X n m ), cell division ( 2 0 m λ m p ( m | m ) n m d m λ m n m ), and apoptosis ( ω n m ). Each of these terms is discussed in detail in the subsequent Section 2.3.1, Section 2.3.2, Section 2.3.3 and Section 2.3.4

2.3.1. Cell Growth

The first term on the right side of the population balance equation represents cellular growth, which continuously increases the biomass of cells. The Monod equation [] can effectively describe the relationship between yeast growth and organic matter concentration. Assuming that yeast can simultaneously utilize glucose, maltose, and maltotriose as substrates for growth, the overall growth rate may be represented as the summation of individual contributions from each substrate. The corresponding equation [] is provided below:
μ X = i μ i i = G , M , N
where μ i can be expressed as:
μ i = Y X i v i T X T X + ( c X c X 0 ) 2
where Y X i denotes the reaction coefficient for yeast cell growth in response to each substrate, v i represents the species uptake rate, c X 0 signifies the initial concentration of yeast, and T X is defined as the yeast growth inhibition constant, with a value of 3.65 × 10⁵ mol2·m−6. The definitions and values of the unknown parameters involved in Section 2.3.1 are detailed in Table 2.
Table 2. Parameter definitions and values 2.

2.3.2. Cell Division

The second and third terms on the right side of the population balance equation account for cell division, which has two significant effects: firstly, it continuously diminishes the number of cells with mass m ; secondly, it consistently increases the count of cells with masses m and m m . The cumulative effect is an increase in the overall number of yeast cells while maintaining a constant total mass and reducing the average mass. Yeast cell proliferation occurs via budding, during which newly formed daughter cells must grow to attain the characteristic mass of their parent cell before initiating another budding cycle. The division intensity function λ m models the tendency of budding cells to divide as they approach a certain critical mass. The function is assumed to have the form []:
λ m = 0 m < m t + m o γ e ϵ ( m m d ) 2 m m t + m o , m d γ m m d
where m t represents the cell transition mass, m o denotes the additional mass that a mother cell must attain prior to division, m d signifies the division mass, both ϵ and γ are constants. Furthermore, due to the asymmetrical nature of budding products, the two resultant daughter cells exhibit differing masses. The newborn cell probability function p m , m describes the mass distribution of newborn cells resulting from cell division. This function is modeled as []:
p m , m = A exp [ β ( m m t ) 2 + A exp β m m + m t ) 2
The definitions and values of the unknown parameters involved in Section 2.3.2 are detailed in Table 3.
Table 3. Parameter definitions and values 3.

2.3.3. Cell Apoptosis

The fourth term on the right side of the population balance equation represents cell apoptosis, which continuously reduces the number of cells. For the sake of this analysis, it is assumed that the apoptosis probability, denoted as ω , remains constant within the brewing fermentation environment.

2.3.4. Yeast Concentration

Based on the definition of the cell mass distribution function [], the concentration of yeast can be derived by integrating the zero-order moment of this distribution function, as expressed below:
c X = 0 n m d m
Then, by integrating both sides of the population balance equation (Equation (16)) to the zero-order moment, we ultimately derive a kinetic expression for yeast concentration that accounts for cell growth, division, and apoptosis:
c X t = μ X c X + Π o c X ω c X
where Π o represents the average of the zero-order moment of n ( m ) , which is obtained by integrating from the zero-order yeast division function (Equation (19)). This can be expressed as:
Π 0 = 0 λ m n m d m + 2 0 0 m λ m p ( m | m ) n m d m d m 0 n m d m
Assuming that the distribution function of yeast cell numbers, denoted as n ( m ) , adheres to a log-normal distribution, it can be articulated as follows:
n m = N m σ 2 π exp ( ln m μ ) 2 2 σ 2
Through numerical solutions, the approximate range of Π o can be determined. In this study, it is established to be 1.75 × 10⁻⁶.

2.4. Species Concentration

The concentrations of the aforementioned species (including glucose, maltose, maltotriose, ethanol, yeast, etc.) are denoted as c i . The transport equation [] governing these concentrations, which is influenced by convection-diffusion and fermentation reactions occurring within the solution, is expressed as follows:
c i t + u j c i x j = Γ i 2 c i x j x j + r i
where Γ i represents the diffusion coefficient of the species.

2.5. Lab-Scale Calculation

In the lab-scale fermentation process, it is assumed that the solution is uniformly mixed throughout and that spatial effects within the system can be neglected. Under this simplification, the Navier–Stokes equations may be omitted, allowing for the energy equation and material concentration equation to be expressed as follows:
d T d t = Q r e + Q o u t
d c i d t = r i
where Q r e denotes the external heat source generated by the exothermic fermentation reaction, while Q o u t represents the cooling capacity during the lab-scale process. All other equations remain unaffected. The initial temperature T0, is set to 9.2 °C, with an initial ethanol concentration c E 0 = 0, an initial glucose concentration of c G 0 = 125 mol·m−3, an initial maltose concentration of c M 0 = 190 mol·m−3, and an initial maltotriose concentration of c N 0 = 27 mol·m−3. Additionally, the initial yeast concentration c X 0 is established at 12 × 106 cells/mL. Based on the temperature change curve observed after fermentation in lab-scale scheme one, Q o u t is calculated as Q o u t = d T d t . This expression is subsequently substituted into the energy equation for simulating temperature changes.

2.6. Industrial-Scale Simulation

Under industrial-scale conditions, the significant height difference in the fermenter leads to natural convection within the fermentation broth due to non-uniform cooling. This convection results in an uneven distribution of material concentrations, which subsequently causes variations in heat release rates from the fermentation reaction, thereby intensifying the natural convection phenomenon. Consequently, for accurate simulations of industrial-scale fermentation processes, it is crucial to comprehensively consider the convection-diffusion effects associated with energy and material concentrations, as well as the Navier–Stokes equations. In accordance with the experimental setup, the relevant initial conditions, boundary conditions, and mesh division settings are outlined as follows.

2.6.1. Initial Conditions

The experimental conditions are established with an initial temperature of 9.6 °C, and the velocity field is initialized to 0. The initial concentration of ethanol, denoted as c E 0 , is 0. The initial concentration of glucose, c G 0 , is 125 mol·m−3; the initial concentration of maltose, c M 0 , is 180 mol·m−3; the initial maltotriose concentration, c N 0 , is 25 mol·m−3. Additionally, the initial yeast concentration c X 0 is measured at 20 × 106 cells·mL−1.

2.6.2. Boundary Conditions

The process occurs within a closed vessel, meaning there are no inlets or outlets; the flow is driven entirely by internal buoyancy forces.
Velocity boundary conditions: The side walls and bottom of the fermenter are established as no-slip boundary conditions, indicating that the velocity of the fermentation broth at these boundaries is zero. Conversely, the top, representing the gas–liquid free surface, is defined as a symmetry boundary condition. This simplification is justified as the shear stress and heat flux at the free surface are considered negligible for this buoyancy-driven flow, which is mathematically equivalent to the zero-gradient and zero-normal-velocity conditions of a symmetry plane. This condition is applied only to the top boundary of the domain.
Temperature boundary conditions: The eight jackets are configured with convective temperature boundary conditions. When the measured wort temperatures at specific points T m have not yet reached specified control temperature E, convective temperature is set to represent the normal temperature of the coolant T n . Once this measured point reaches its threshold value, convective temperature transitions gradually to align with the temperature of the coolant T y (the value of T y is calculated using Equation (28)). This approach simulates a PID control method employed in actual fermentation processes.
To address the challenges posed by significant thermal inertia, nonlinearity, and hysteresis characteristics during beer fermentation processes, advanced PID control algorithms have been developed. These algorithms leverage techniques such as fuzzy control, fuzzy-PID composite control, and Smith predictor control. In this study, Boltzmann distribution functions are employed to simulate the input-output responses of these fuzzy control methodologies. Additionally, a threshold temperature parameter, Δ T c , is incorporated to characterize the inherent fuzziness within these control systems, as described below:
T y = T n T m i n 1 + e T m T c / Δ T c + T m i n
where T m represents the measured wort temperature, T y denotes the coolant temperature, T n is defined as the normal coolant temperature in a scenario where the cooling valve remains closed under actual environmental conditions, T m i n indicates the minimum coolant temperature of −4 °C, and T c refers to the specified control temperature, namely 13 °C.
Concentration boundary conditions: The wall and the upper section of the fermenter are both designated as no-flux boundary conditions.

2.6.3. Numerical Calculation Method

The simulations were performed using the commercial CFD software Ansys Fluent 2024 R2. The N-S equations, along with the energy and concentration equations, are solved utilizing the finite volume method. The pressure-velocity coupling is resolved through the pressure implicit with splitting of operators (PISO) algorithm. For spatial discretization, the gradient is computed using a least-squares cell-based method, pressure is discretized with a linear scheme, while momentum, turbulent kinetic energy, laminar kinetic energy, specific dissipation rate, and all user-defined scalar transport equations (for species concentrations) are discretized using a second-order upwind scheme. The resulting systems of linear equations were solved using an algebraic multigrid (AMG) solver.
For turbulence modeling, the unsteady Reynolds-averaged Navier–Stokes (URANS) approach is employed. The Reynolds number of the flow varies from approximately 0.1 to 300. The flow of the fermentation broth is in a laminar state during the initial stage of the fermentation reaction. As the reaction progresses, the temperature gradually increases and the flow velocity accelerates, causing the laminar flow to gradually transition towards turbulence. This creates eddies, which promote more uniform mixing of the reactants. Therefore, the k–kl-ω model was adopted, as it can effectively simulate low-Reynolds-number flows and the transition process.
Time discretization utilizes a bounded second-order implicit scheme. To ensure both numerical stability and temporal accuracy, an adaptive time-stepping method was employed. The time step was dynamically adjusted based on the Courant number, which is defined as:
C o = U Δ t Δ x 1
where C o denotes the Courant number, U represents the characteristic velocity, Δ x signifies the spatial discretization step, and Δ t indicates the time step. Throughout the simulation, the Courant number was maintained below a maximum value of 10. This adaptive approach resulted in an initial time step of 6 s, which decreased to approximately 1.2 s during the more dynamic phases of the reaction. Convergence at each time step was determined by two criteria: (1) the scaled residuals for all solved equations fell below 1 × 10⁻³, and (2) key integral quantities, such as the volume-averaged temperature, stabilized with variations of less than 5% over successive iterations.

2.6.4. Mesh Division

A hybrid mesh consisting of triangular and quadrilateral cells was employed, totaling 33,275 cells (22,615 triangles and 10,660 quadrilaterals). The mesh is refined at the junction of the cylindrical and conical sections, as well as at the bottom of the conical section, to adequately capture complex flow and heat transfer phenomena. The minimum orthogonal quality of the mesh was 0.125. A boundary layer mesh with 11 layers was developed along the walls, with a first-layer height of 3 mm and a growth rate of 1.1, ensuring that the first layer mesh complies with y + 10 . The results of the meshing process are presented in Figure 1.
Figure 1. Meshing results.

2.6.5. Mesh and Timestep Independence Study

To ensure the accuracy and reliability of the numerical results, mesh and time-step independence studies were conducted. These studies verify that the simulation outcomes are not significantly influenced by the chosen grid resolution or time-step size.
Grid Independence Study
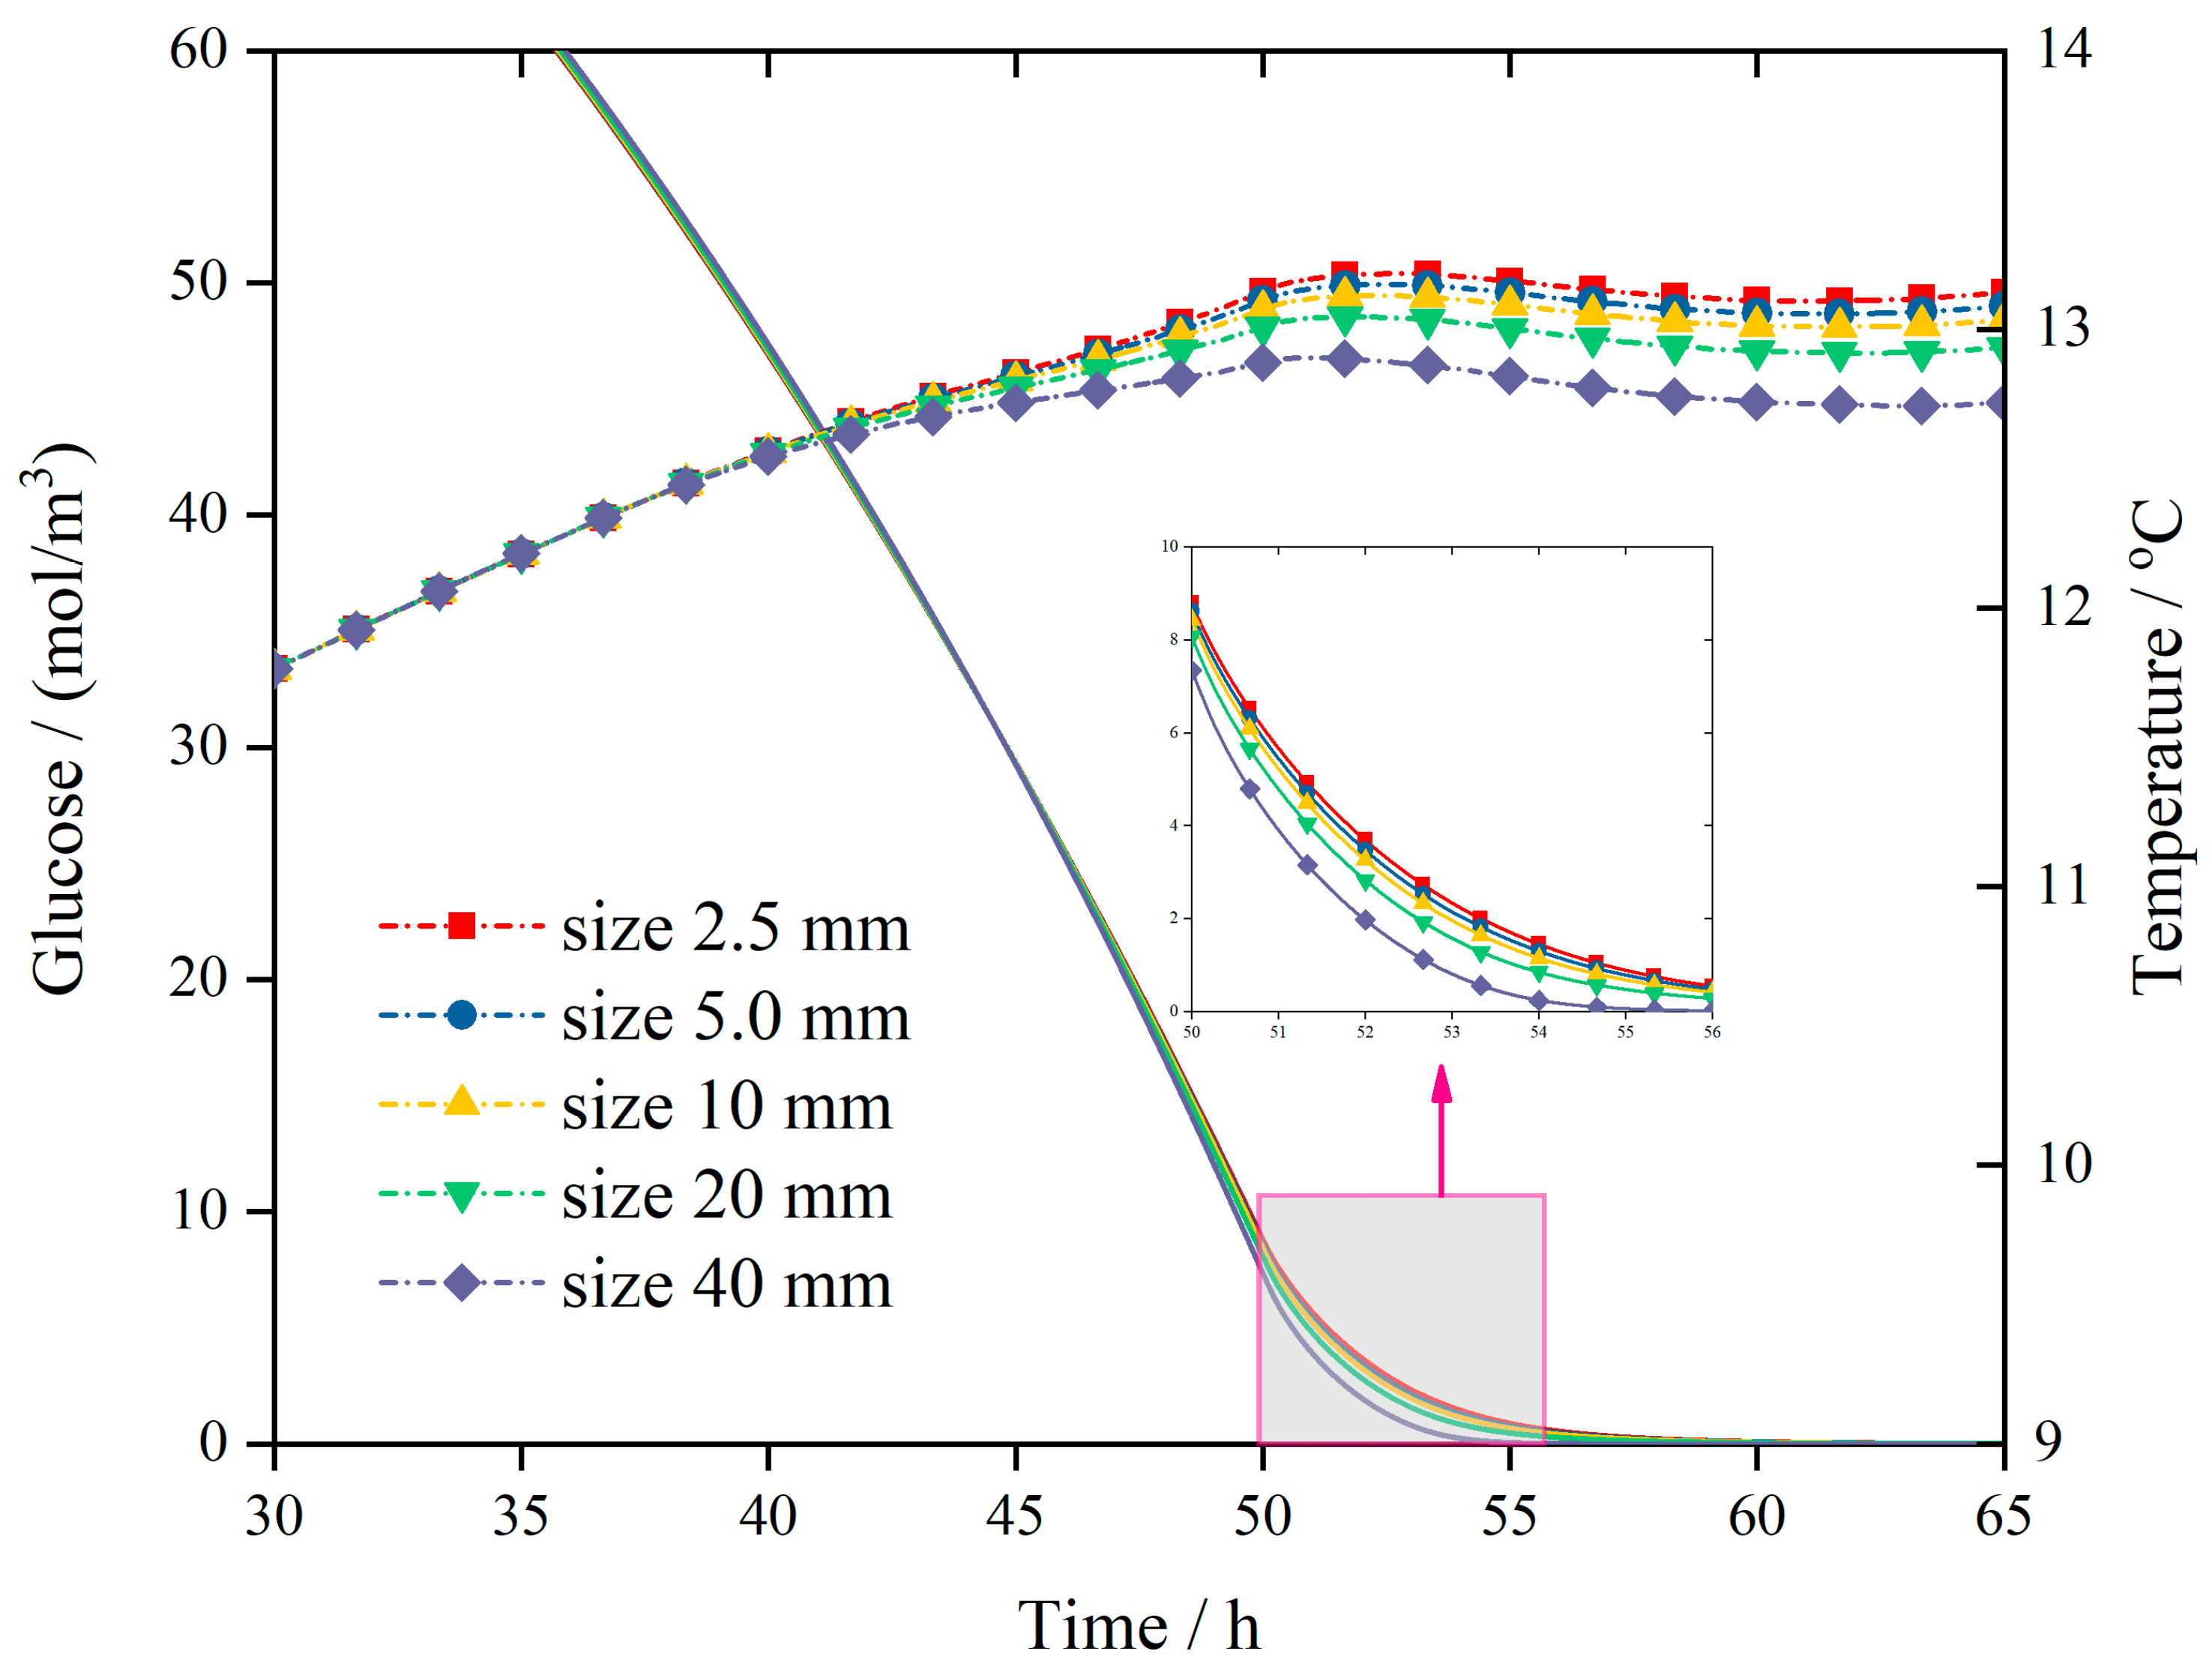
A grid independence study was performed to select an appropriate mesh density that balances computational accuracy and resource requirements. Five different hybrid meshes were generated for the industrial-scale fermenter, with the first-layer side length of the core triangular elements set to 2.5 mm, 5 mm, 10 mm, 20 mm, and 40 mm, respectively. The total cell counts for these meshes are detailed in Table 4.
Table 4. Mesh parameters for the grid independence study.
All five meshes were simulated under identical conditions: Tmax = 12 °C, ∆T = 0.5 °C, and a time step of 0.1 s, which ensured that the Courant number remained below 1 for the finer meshes. The resulting glucose concentration and temperature profiles over time are shown in Figure 2. The solid line in Figure 2 represents glucose concentration, and the dashed line stands for temperature. As fermentation progressed, after 48 h, the flow began to transition from laminar to turbulent. At this point, a finer mesh resulted in a higher calculated temperature and a faster decrease in glucose concentration. As shown in Figure 2, the discrepancies in the results began to diminish when the side length of the first-layer triangular elements was less than 10 mm. Therefore, to balance computational accuracy with resource requirements, a first-layer side length of 10 mm was selected for the triangular elements.
Figure 2. Temperature and glucose concentration profiles for different mesh sizes.
Boundary Layer Mesh Convergence
Since the transitional k–kl-ω turbulence model was employed, a mesh convergence study was conducted to ensure the near-wall mesh resolution met the model’s requirements, specifically regarding the wall y + value. Using the selected 10 mm core mesh, four different boundary layer configurations were tested by varying the first-layer height (0.75 mm, 1.5 mm, 3 mm, and 4.5 mm). The maximum wall y + values at 50 h into the simulation are presented in Table 5.
Table 5. Results of the boundary layer mesh study.
Based on these results, a first-layer height of 3 mm was chosen as it satisfies the wall y + requirement for the k–kl-ω model.
Time-Step Independence Study
A time-step independence study was performed to assess the influence of the temporal discretization on the results. Using the chosen grid (10 mm side length, 3 mm first-layer height), simulations were run with the maximum Courant number set to 0.25, 0.5, and 1.0. The time required for the glucose concentration to reach 0.5 mol/m3 was used as the key metric. Compared to the result for a Courant number of 0.25 (55.6 h), the errors for Courant numbers of 0.5 (54.9 h) and 1.0 (53.4 h) were 1.26% and 3.96%, respectively. This demonstrates that the chosen time-stepping method yields sufficiently independent results.

3. Experimental Methodology

3.1. Experimental Materials

After the theoretical model was established, two sets of lab-scale experiments and two sets of industrial-scale experiments were conducted to verify its accuracy. The instruments involved in the process of sampling and parameter measurement are shown in Table 6.
Table 6. Experimental instruments.

3.2. Lab-Scale Experiment

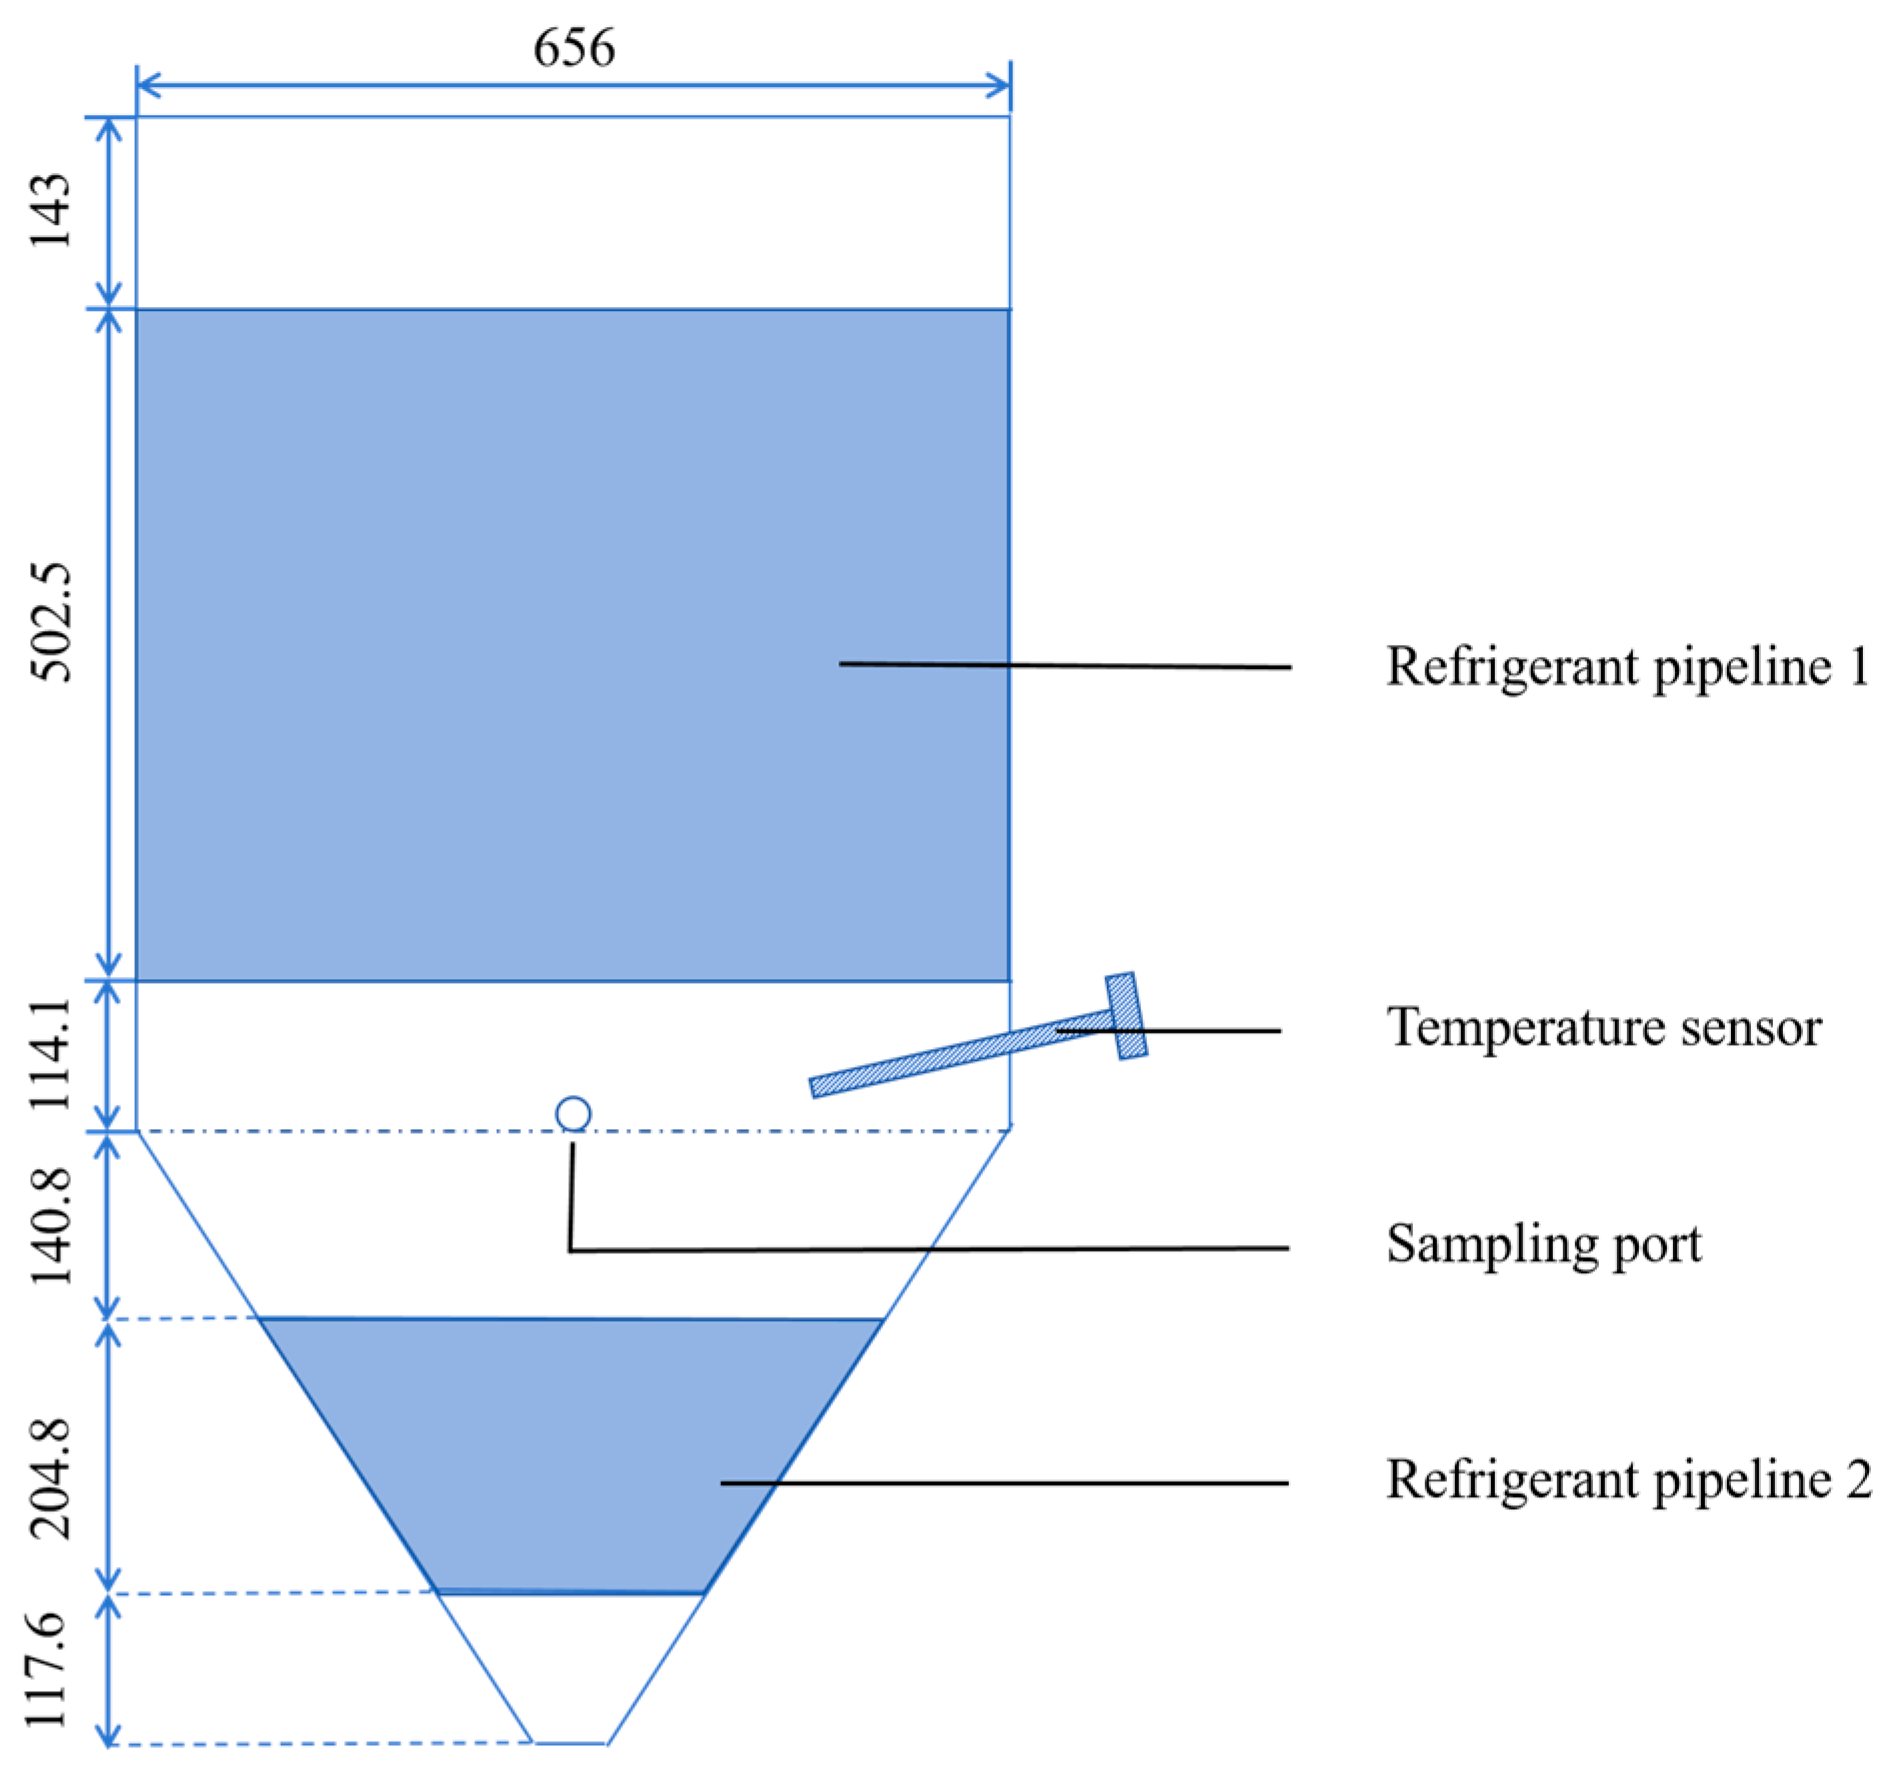
Based on the typical tank design utilized by beer manufacturers for lab-scale experiments, research employs a conical beer fermenter with an effective volume of 0.3 m3 and a height-to-diameter ratio of 1.5:1 (made in Harbin Hande Light Industrial & Pharmaceutical Equipment Co., Ltd., Harbin, China), the working volume of the fermenter is shown in Figure 3. The cone angle of the fermenter is 70°. The sampling port is located 20 mm above the junction of the cylinder and the cone. The temperature sensor is located 80 mm above the same junction and is inserted 150 mm into the tank at a 75° angle. The wort temperature (denoted as T m ) is measured by this temperature sensor. The tank body is insulated using a polyurethane filling layer, and alcohol serves as the coolant.
Figure 3. Geometric configuration of laboratory fermenter (working volume, headspace: 0.1 m3).
Given the relatively small volume of this type of tank, which has a liquid level height of approximately 1 m, the fermentation broth can be considered as a well-mixed liquid throughout the fermentation process. Thus, temperature and material concentration were deemed uniform in spatial distribution.
The experimental procedure commences with cooling the wort to 9.2 °C prior to adding yeast, marking the initiation of fermentation. During this phase, the coolant valve remains closed. Consequently, no active temperature control measures are implemented for the fermentation broth. Due to both insulation properties of the tank and the exothermic nature of fermentation reactions, there is a continuous increase in temperature within the fermentation broth. Every 2 h, researchers manually collected a 300 mL sample of fermentation broth from the fermenter’s sampling valve to measure yeast concentration, sugar content, and alcohol content, and recorded the corresponding fermentation time.
  • The retrieved fermentation broth sample must be immediately degassed to eliminate interference from dissolved carbon dioxide in subsequent measurements. After degassing, the sample is filtered using medium-speed qualitative filter paper. To prevent the loss of volatile components such as alcohol during the filtration process, the funnel must be covered with a watch glass. The initial approximate 100 mL of filtrate should be discarded (this step serves to rinse the filter paper and container), and the subsequent clarified filtrate is collected in a clean, dry sample bottle. To ensure the accuracy of the measurement results, the sample must be brought to a constant temperature of 20 °C before analysis.
  • First, the concentration of the yeast suspension was evaluated. If the concentration was too high, the suspension was diluted with a 0.9% saline solution to achieve an ideal cell count of 30 to 50 cells per medium square on the hemocytometer (Marienfeld). If the initial concentration was low, no dilution was performed. Next, a clean hemocytometer was prepared by placing a coverslip over the counting chamber. A small amount of the thoroughly mixed, pre-treated yeast suspension was drawn with a pipette and slowly introduced at the edge of the coverslip. The chamber was filled by capillary action, and care was taken to avoid overfilling or the formation of air bubbles. After loading, the hemocytometer was left undisturbed for 3–5 min to allow the cells to settle completely. The slide was then placed on the stage of a microscope (OLYMPUS, Model: CX31RBSF). The counting grid was first located under low-power magnification, after which the objective was switched to high-power for observation and counting. The total number of cells within five medium squares (typically the four corner squares and the central square) was tallied. To ensure data reliability, the counting procedure was repeated two to three times for each sample, and the average value was calculated. Finally, this average was substituted into the following formula to calculate the number of yeast cells per milliliter of the sample. D represents the number of yeast cells per milliliter of the sample (in cells/mL), A is the total number of cells in the 5 medium squares, and C represents the dilution factor.
D = 5 × 10 4 × A × C
The temperature of the fermentation broth is automatically monitored using Temperature sensor (Shanghai Instrument Factory, Model: pt100). Upon completion of fermentation, rather than immediately draining out the sample, it is allowed to stand for some time during which continuous monitoring recorded changes in temperature over time. This serves to calculate adiabatic capacity (i.e., heat loss) under natural conditions within that fermenter context.

3.3. Industrial-Scale Experiment

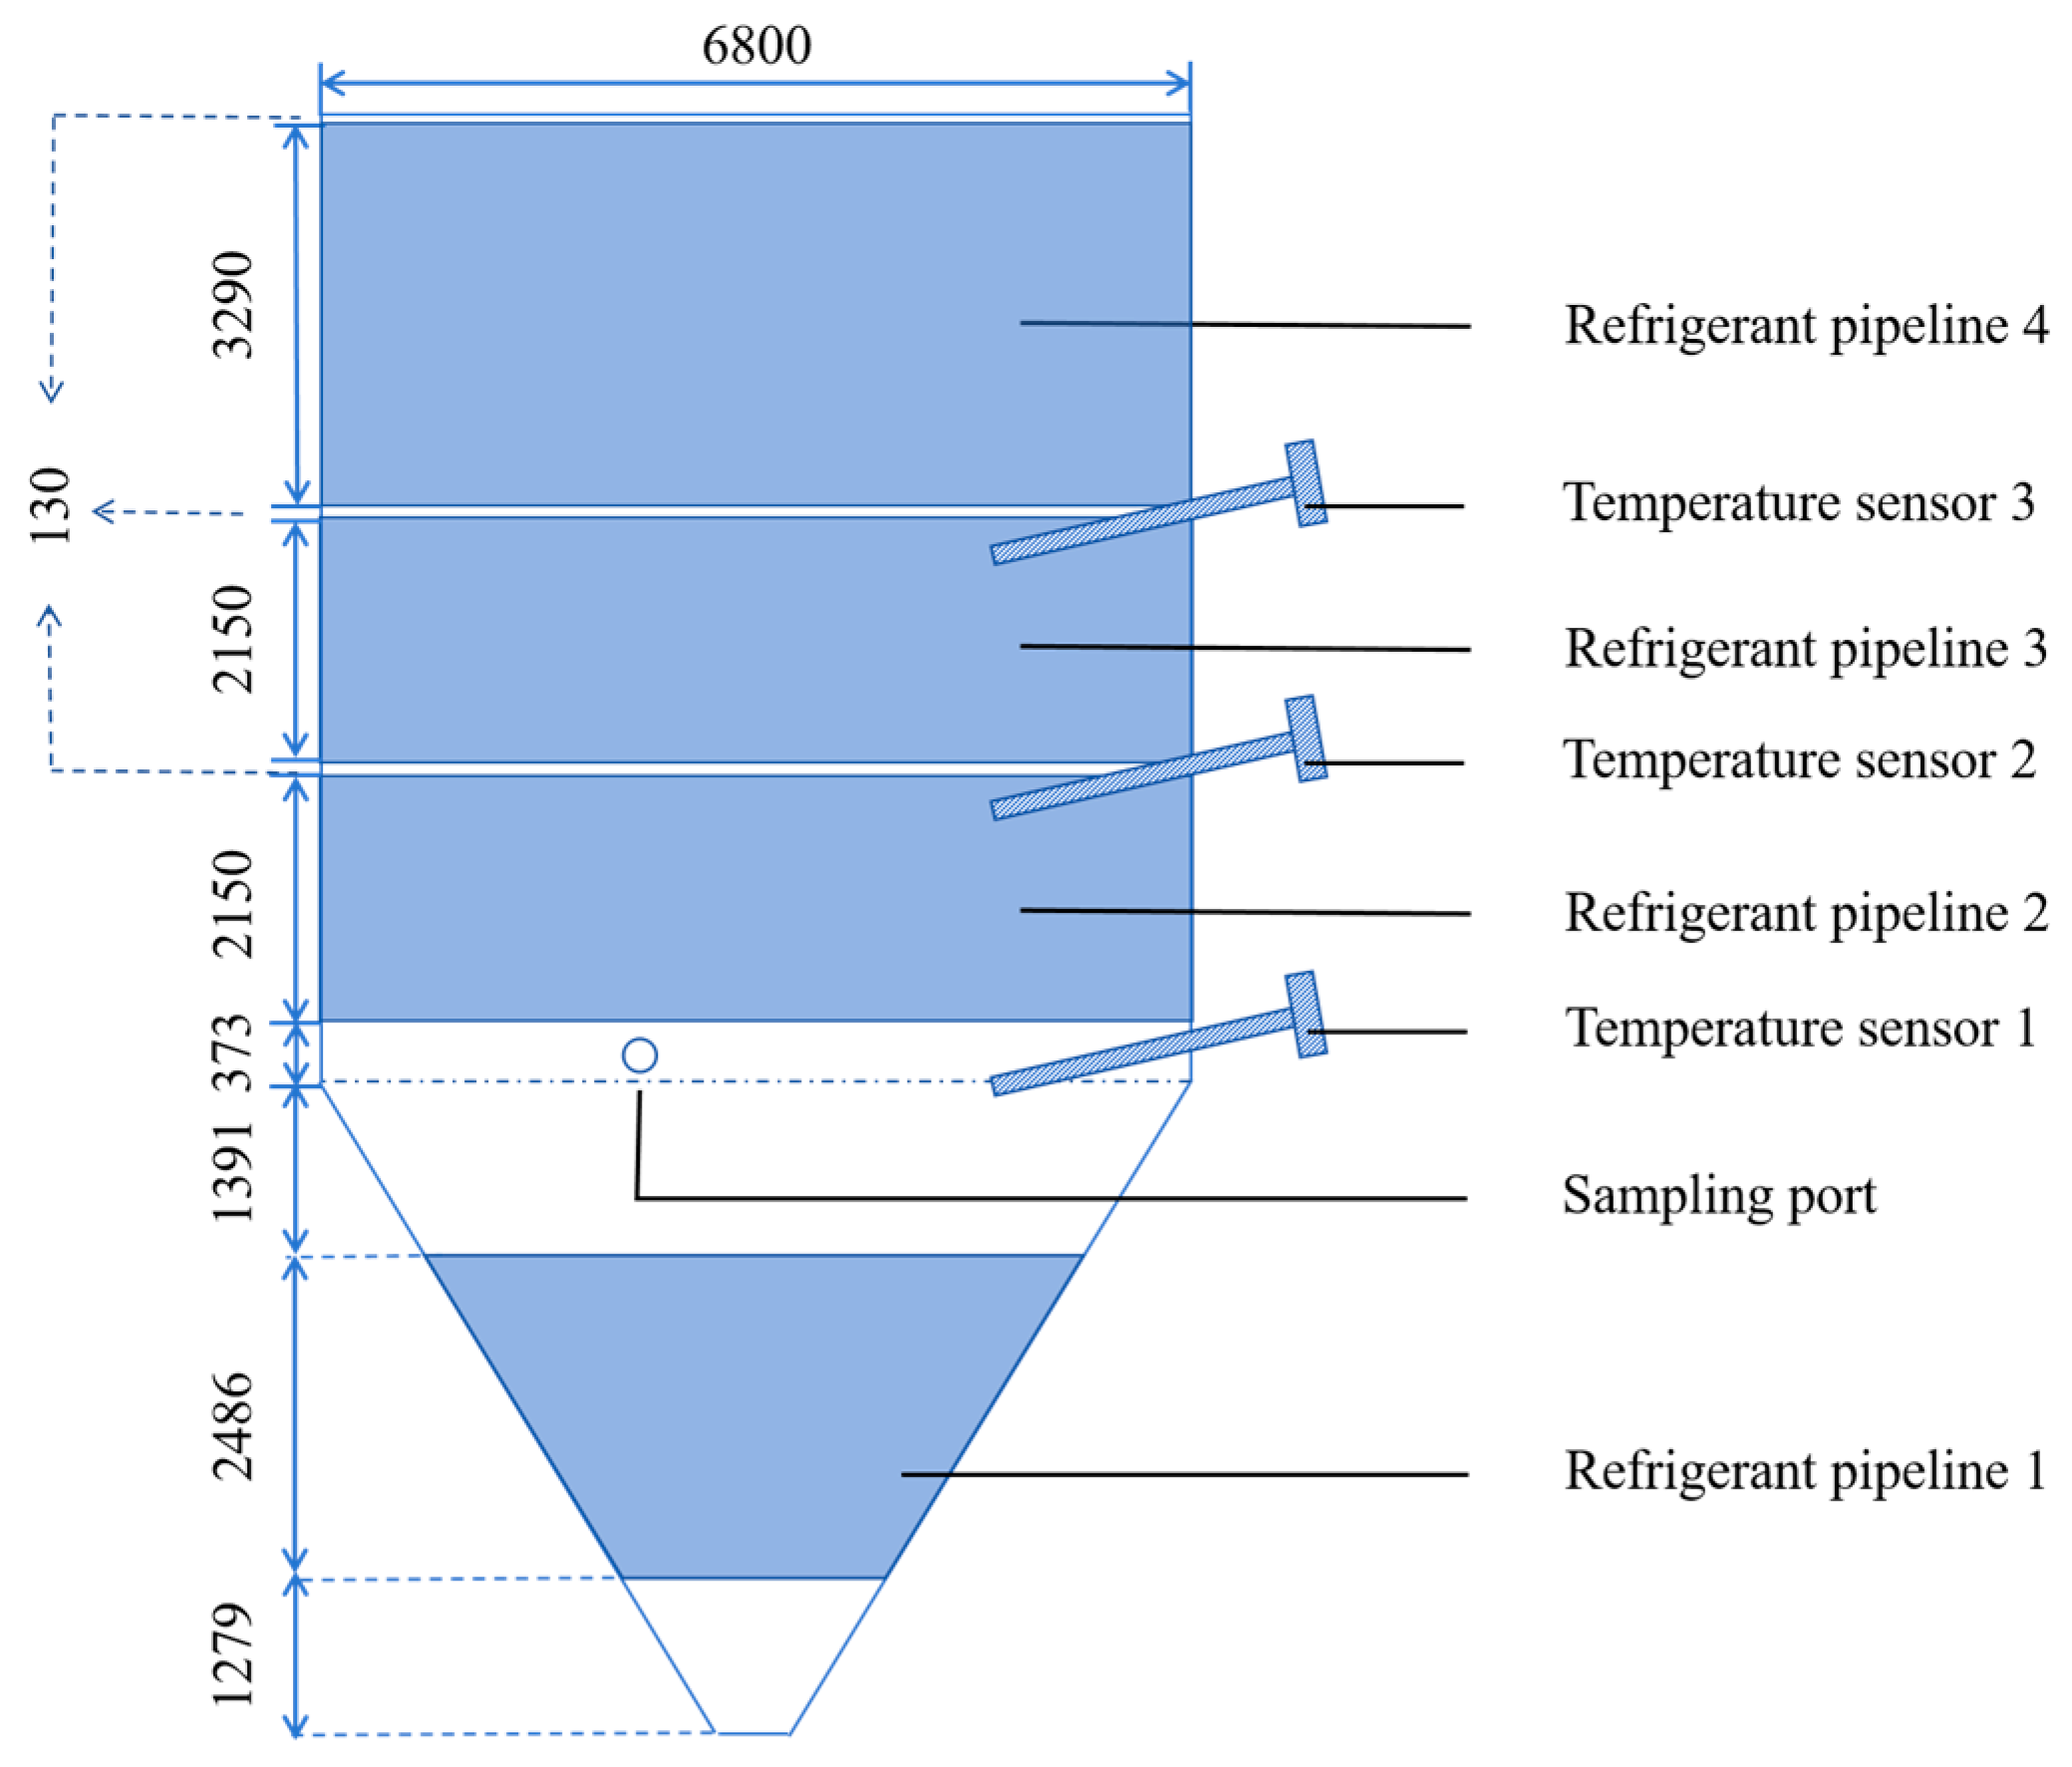
Given that a leading beer manufacturer predominantly utilizes 375 m3 fermenters (made in Wenzhou Dongfeng Chemical Machinery Co., Ltd., Wenzhou, China) in industrial production, research selects a conical beer fermenter with an effective volume of 375 m3 and a height-to-diameter ratio of 1.5:1. Figure 2 illustrates the geometric configuration of this industrial fermenter. The external insulation layer of the tank is constructed using 200 mm thick polyurethane. The body of the fermenter features a total of eight jackets, each regarded as an independent cooling heat exchange surface, controlled by four distinct refrigerant pipelines. Temperature sensors are installed between the inlet and outlet of each refrigerant pipeline, totaling three temperature sensors, to facilitate precise monitoring. In Figure 4, temperature sensor 2 and temperature sensor 3 are both placed in the middle of refrigerant pipelines. Temperature sensor 1 is located 200 mm above the junction of the cylinder and the cone. All temperature sensors are inserted 150 mm into the tank at a 75° angle. The sampling port is located 150 mm above the junction of the cylinder and the cone, at a horizontal distance of 1200 mm from the rotational symmetry axis of the fermenter.
Figure 4. Geometric configuration of industrial fermenter (working volume, headspace: 202 m3).
This industrial-scale experiment strictly followed actual production protocols. Prior to the start of the experiment, the fermentation vessel had undergone rigorous sterilization via CIP (cleaning-in-place) and SIP (sterilization-in-place) procedures. Wort from the brewhouse was rapidly cooled via a plate heat exchanger and aseptically oxygenated in-line before being transferred into the fermenter. Yeast pitching was also performed in-line during the transfer of the first wort batch. The entire filling process was completed in three batches until the predetermined volume was reached. Upon completion of the three transfers, a wort sample was immediately collected from the sampling port. This was done to determine three baseline parameters: initial yeast concentration, original gravity (°P), and alcohol content. After sampling, the PID temperature control program was immediately initiated by the central control system with a setpoint of 13 °C. By continuously monitoring the internal temperature, the program precisely regulates the coolant flow through the fermenter’s cooling jackets. This serves to constantly counteract the biological heat (an exothermic reaction) generated by yeast during fermentation, thereby ensuring the temperature is maintained precisely and stably within the required process range throughout the main fermentation stage.
Throughout the fermentation period, researchers conduct regular sampling to measure yeast concentration, sugar content, and alcohol content.

4. Results and Discussion

4.1. Lab-Scale Results

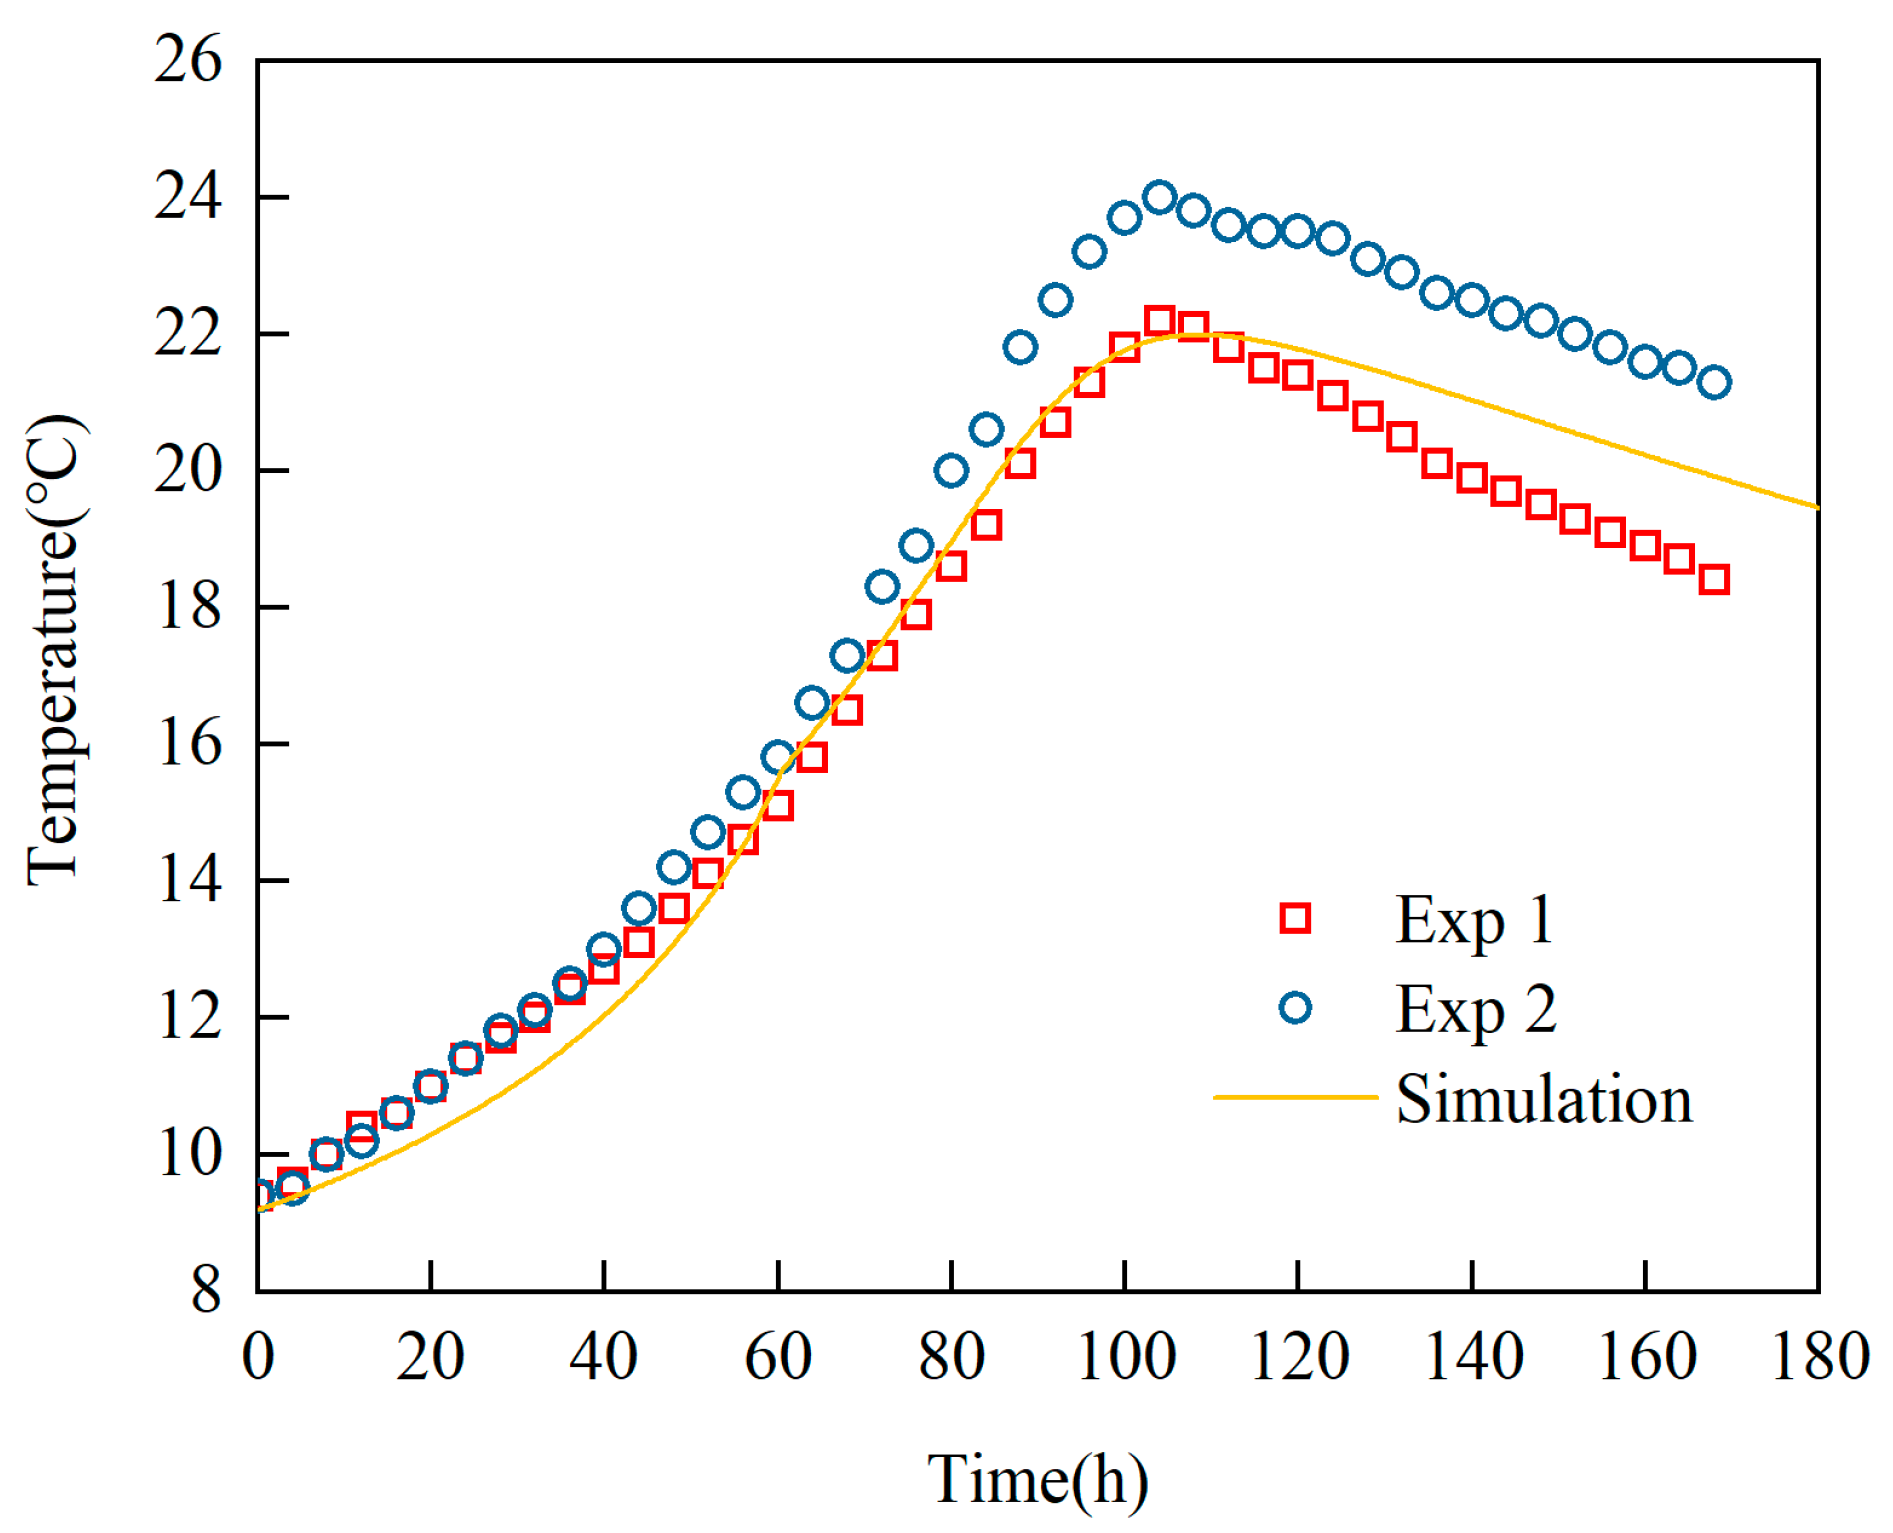
In the uncontrolled fermentation experiment, the entire experimental process can be broadly divided into two stages: the uncontrolled free fermentation stage and the static cooling stage following the conclusion of fermentation. The heat generated by the fermentation reaction causes a continuous increase in temperature within the fermenter. After the completion of fermentation, due to certain heat loss from the container, the temperature inside gradually decreases to room temperature, as illustrated in Figure 5. Since these two experiments were conducted at different times and under varying ambient temperatures (Exp 1: 21 October 2024, 16.4 °C; Exp 2: 6 July 2024, 20.5 °C), distinct static results were observed. By recording the data from the single temperature sensor in Figure 3, the average heat leakage of the fermentation system is calculated and applied to the simulation settings. A comparison between simulation results and experimental findings indicates that trends are generally consistent; however, a notable difference arises where an inflection point appears in the temperature rise curve during fermentation within simulations. This discrepancy is attributed to preferential consumption of glucose simulated processes leading to an abrupt depletion of glucose as a substrate during fermentation. In contrast, during actual experimentation, some maltose is hydrolyzed into glucose; thus, this inflection point does not manifest in real-time measurements.
Figure 5. Lab-scale fermentation temperature profile over time, comparing simulation results with single-point sensor measurements (Exp 1, Exp 2).
Furthermore, during the fermentation process, the temperature increase is observed to follow an approximately quadratic trend. This relationship can be explicitly expressed as:
T = a t 2 + b t + c
where a , b , and c are constants. The rate of temperature change is therefore the first derivative with respect to time, d T d t = 2 a t + b , which is a linear function of time. According to the system’s energy balance, the net heat generation rate is proportional to the rate of temperature change. Therefore, a linear rate of temperature change implies that the net heat generation rate also increases approximately linearly with time. Since the overall fermentation reaction rate is directly proportional to the heat generation rate, we can infer that the reaction rate itself increases approximately linearly during this phase.
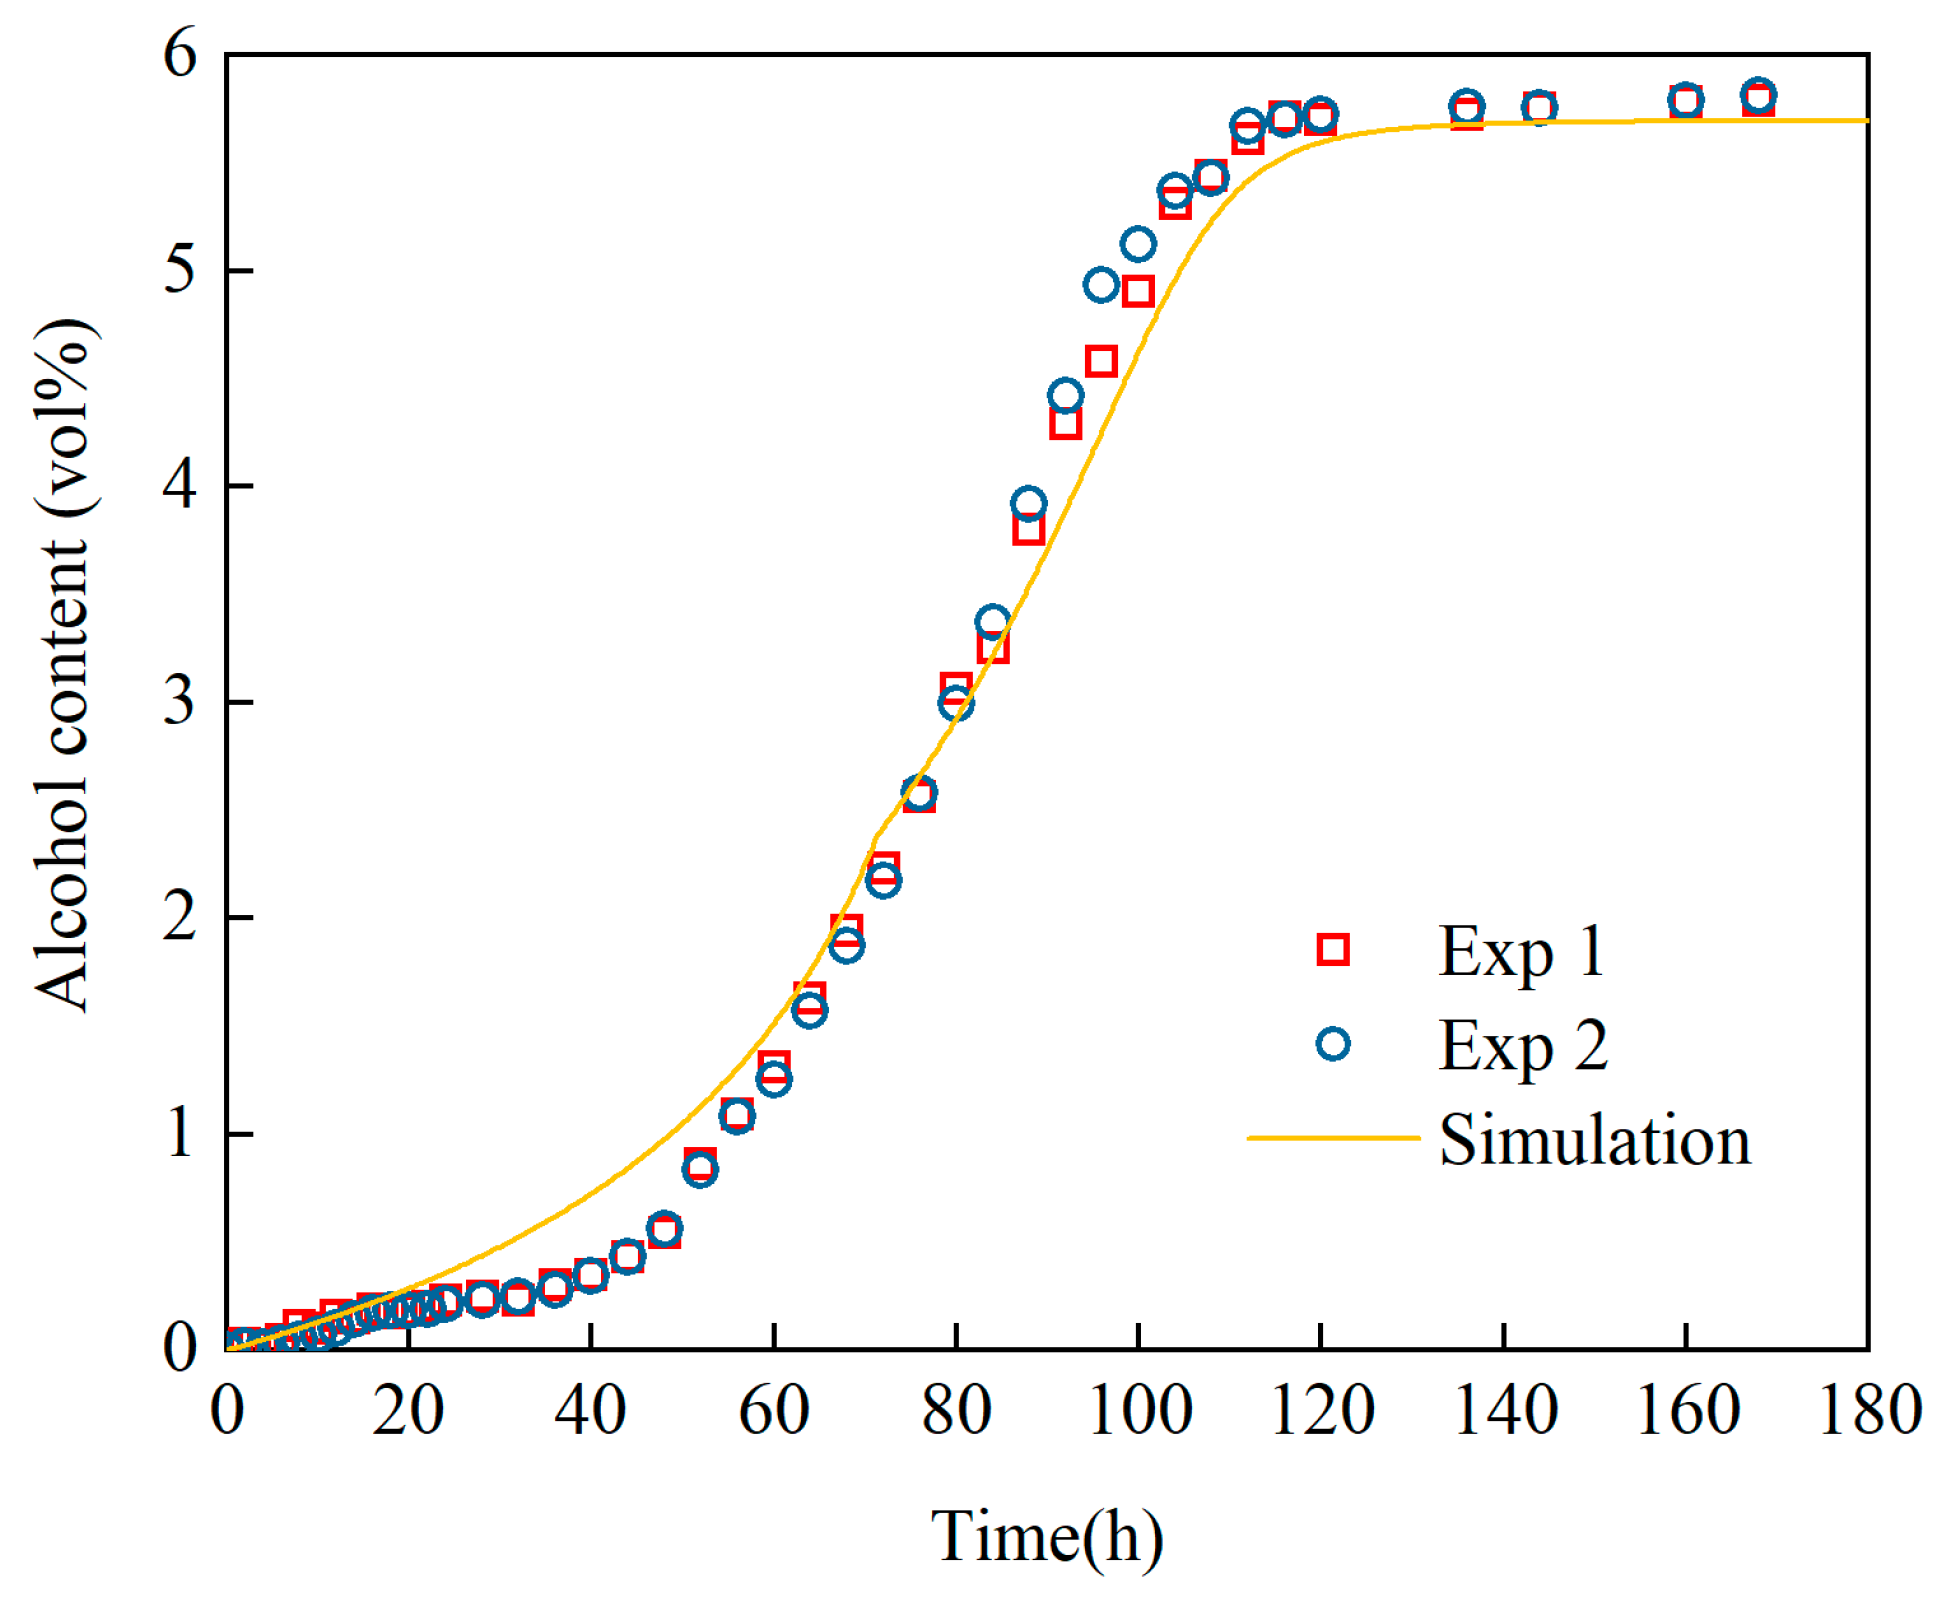
As depicted in Figure 6, the alcohol concentration during the fermentation reaction exhibits a smooth growth curve over time, characterized by an initial increase before leveling off until the completion of the fermentation process. Although analysis of the temperature curve indicates that the rate of fermentation is approximately linear, variations in alcohol concentration are influenced by the substrates involved in the reaction. Consequently, as the fermentation approaches its conclusion, alcohol yield gradually decreases and tends toward zero. The simulation curve similarly reflects this trend.
Figure 6. Lab-scale fermentation ethanol concentration profile, comparing simulation with measurements from single-point sampling.
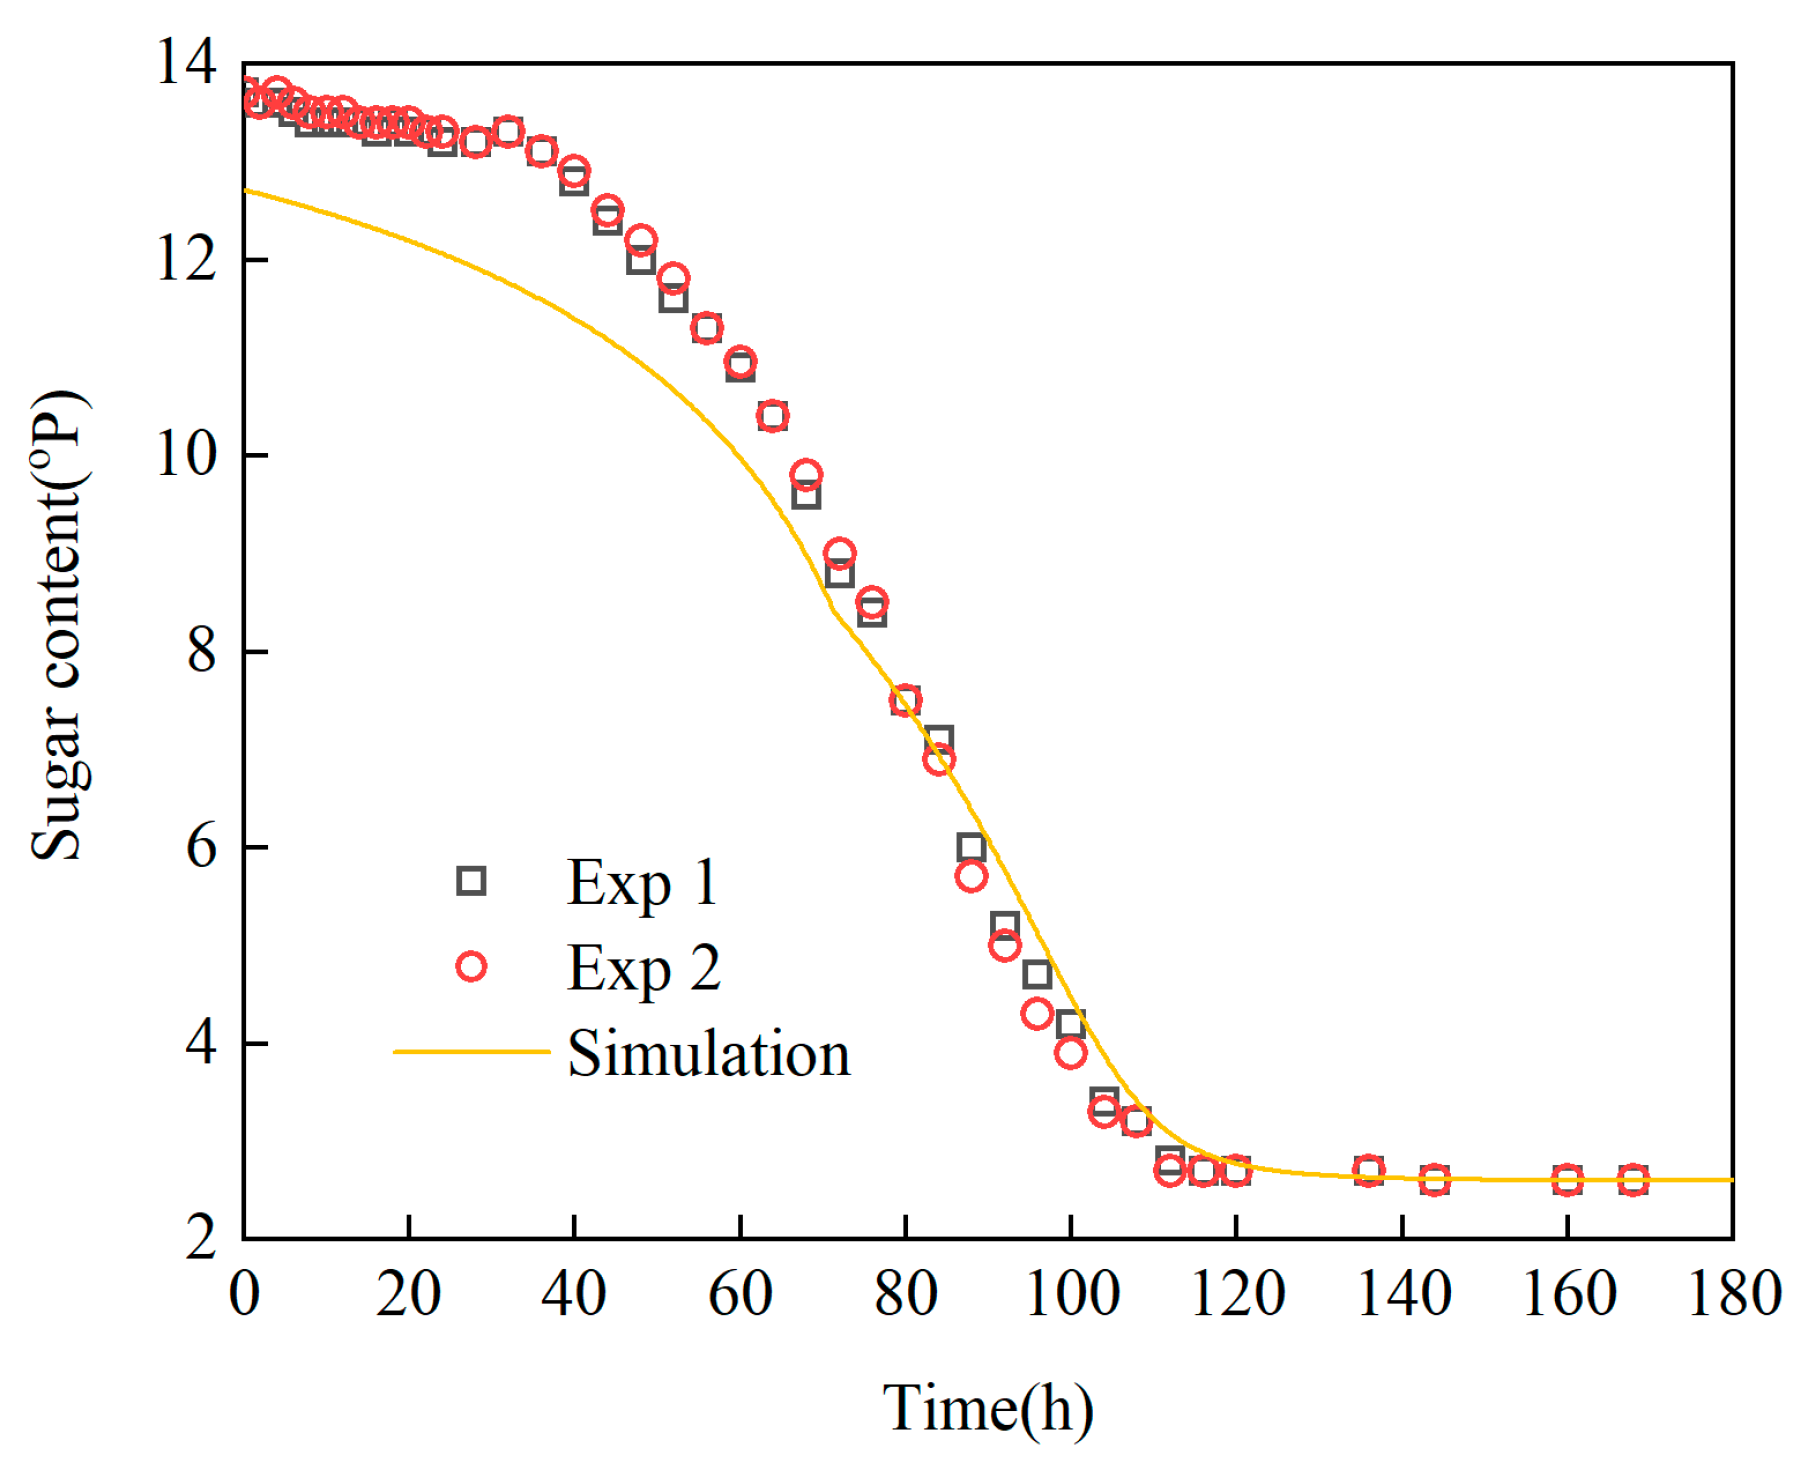
Figure 7 illustrates the trend of sugar content over time. Similar to alcohol concentration, sugar is a consumed substance during the fermentation process, and its curve exhibits an inverse relationship to that of alcohol. The simulation curve also approximately reflects this characteristic, displaying an inflection point in the figure that indicates the consumption of a specific sugar component, resulting in a sudden change in the sugar content conversion.
Figure 7. Lab-scale fermentation sugar content profile, comparing simulation with measurements from single-point sampling.
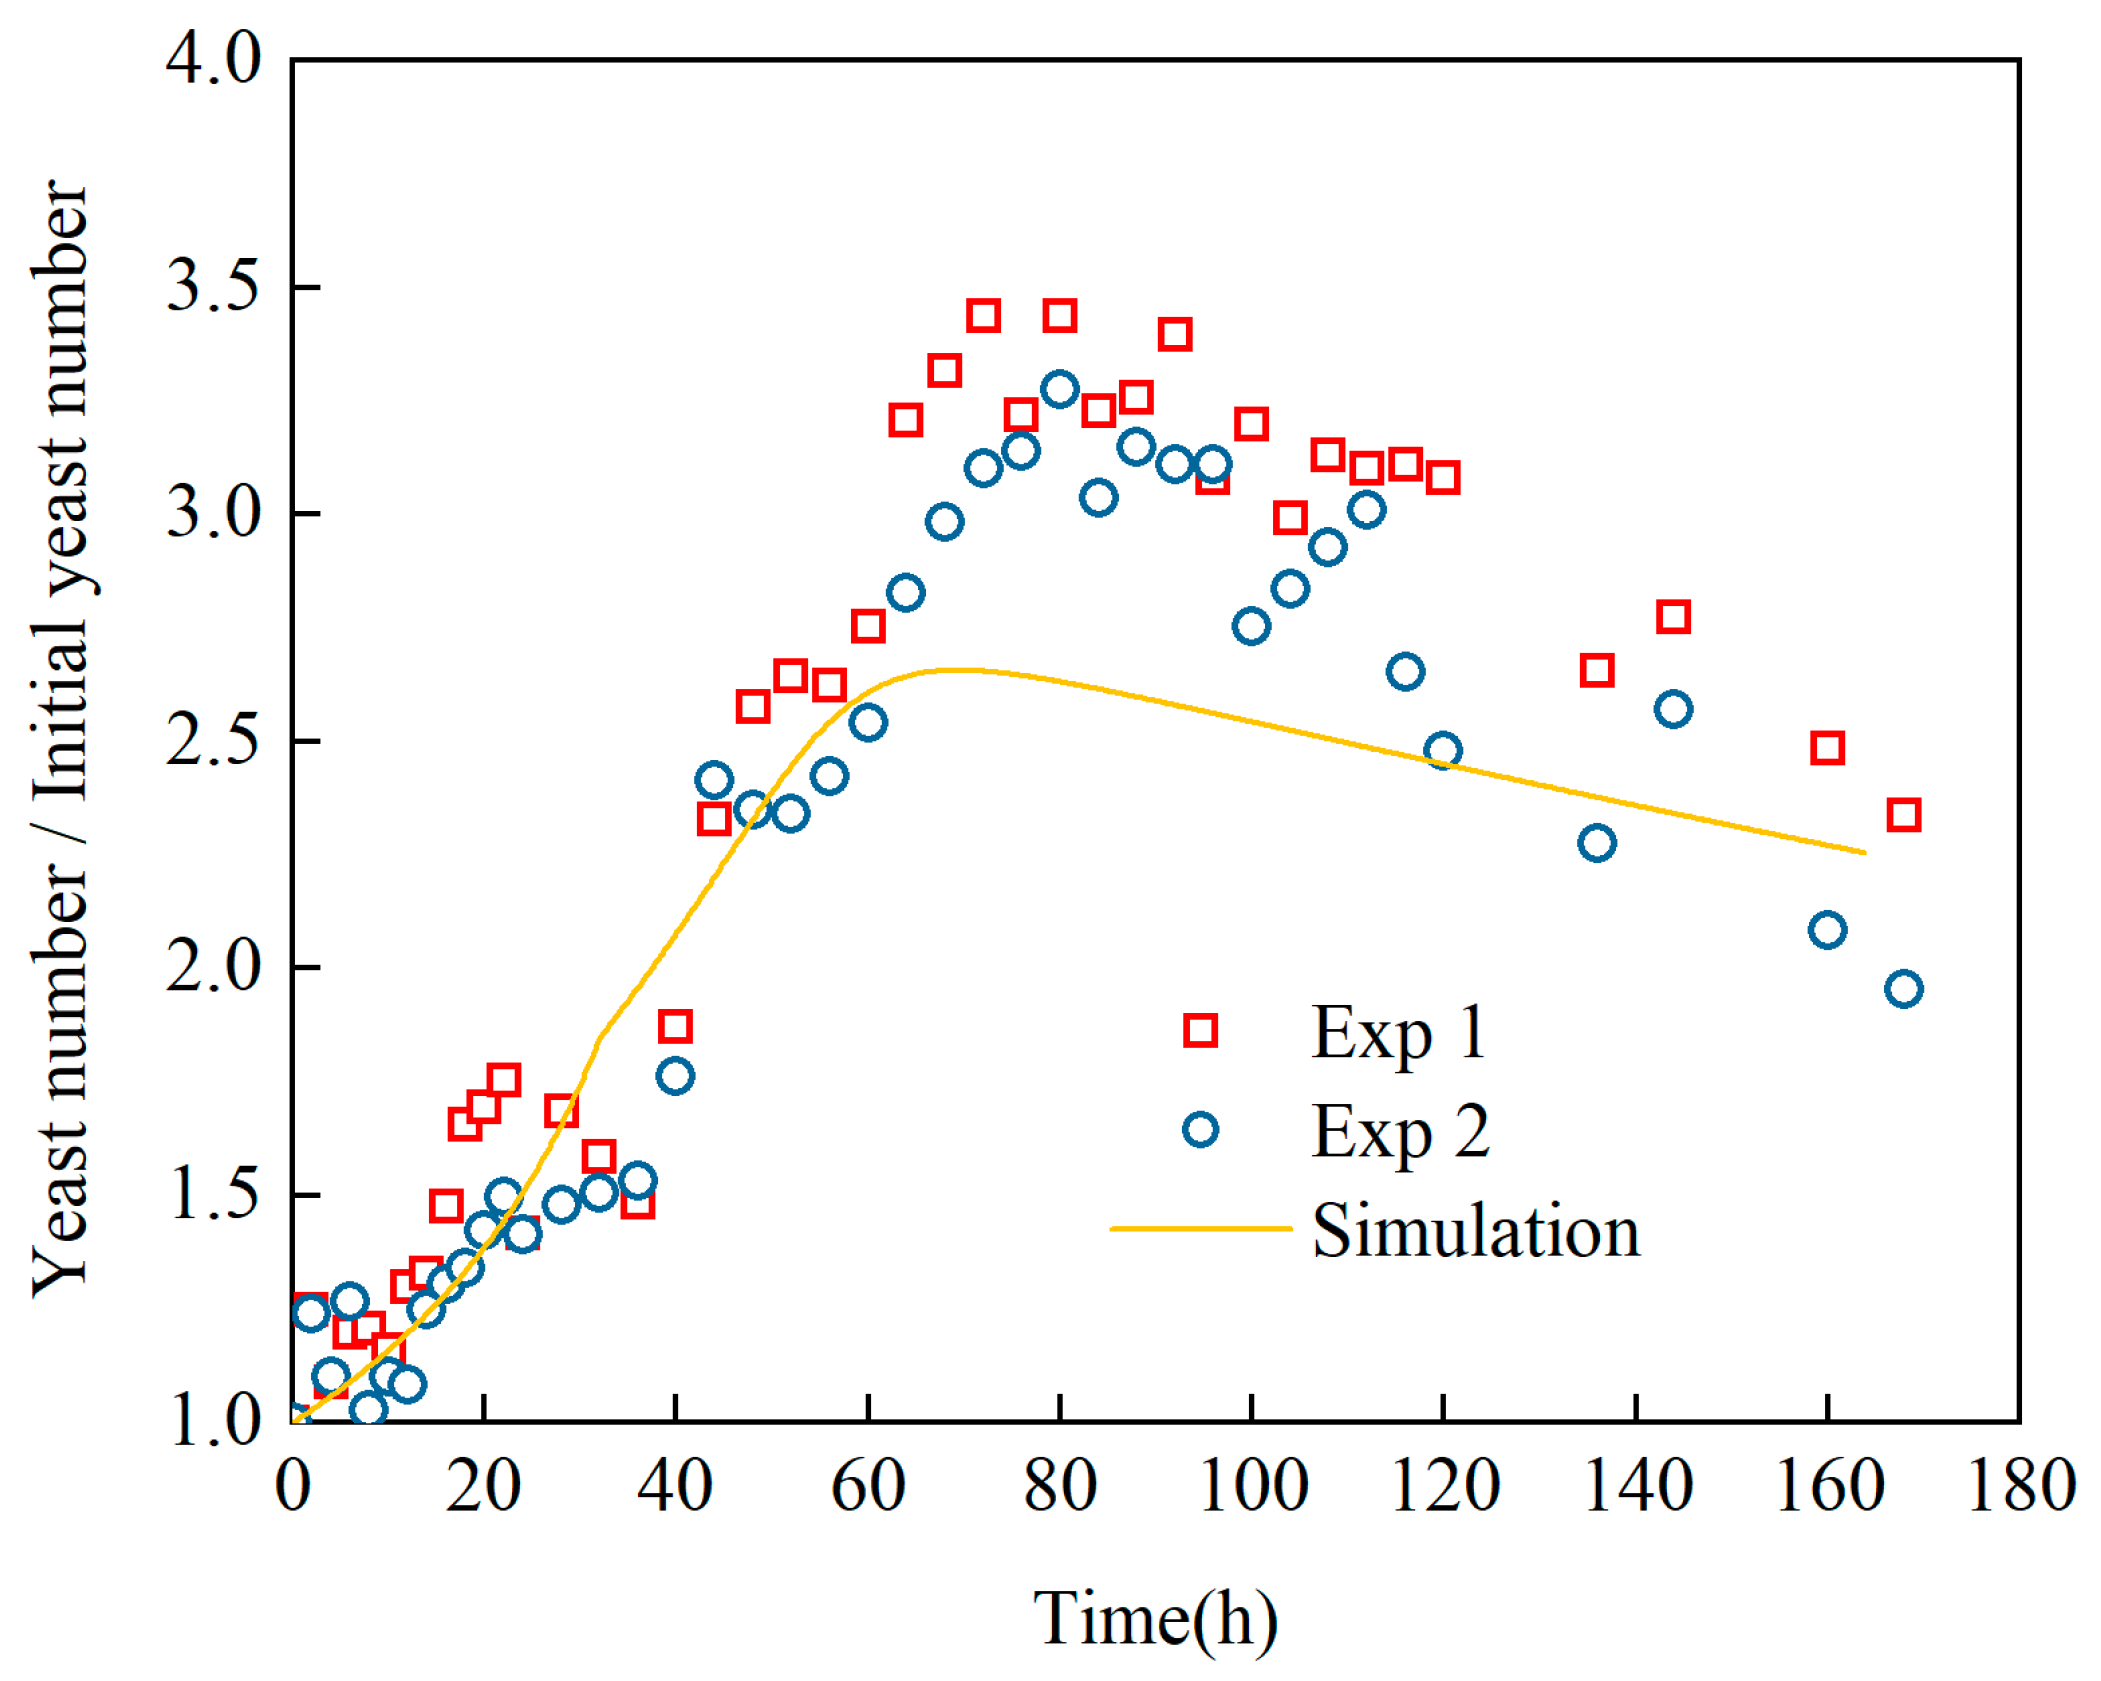
The initial yeast concentration is set at 1, and the trend of yeast cell doubling over time is depicted in Figure 8. As illustrated in the figure, the number of yeast cells exhibits an approximately linear increase during the fermentation stage, followed by a linear decrease once fermentation is complete. Although the simulation results generally align with the experimental trends, two discrepancies are noted: first, the simulated peak occurs earlier than observed experimentally and has a lower peak value. The speculation presents two potential explanations: First, there may be an inaccurate estimation of the sugar-to-yeast conversion constant. It is possible that the yeast strain utilized in the experiment exhibits stronger reproductive capabilities than initially anticipated. Second, there can be a delayed measurement of sampled yeast. The proliferation of yeast cells continues post-sampling, which likely results in artificially elevated measurements.
Figure 8. Lab-scale fermentation yeast number profile, comparing simulation with measurements from single-point sampling.
To quantitatively assess the accuracy of the lab-scale model, the coefficient of determination (R2) was calculated for the key parameters, comparing the simulation results against the data from two separate experiments. The results are presented in Table 7. As the table indicates, the model demonstrates a high degree of accuracy in predicting temperature (R2 of 96.9% and 93.9%), alcohol content (R2 of 99.2% and 98.8%), and sugar content (R2 of 96.2% and 95.6%). These high R2 values signify an excellent agreement between the simulated and experimental data, confirming the model’s ability to capture the core physicochemical dynamics of the fermentation process.
Table 7. R2 values for lab-scale model validation.

4.2. Industrial-Scale Results

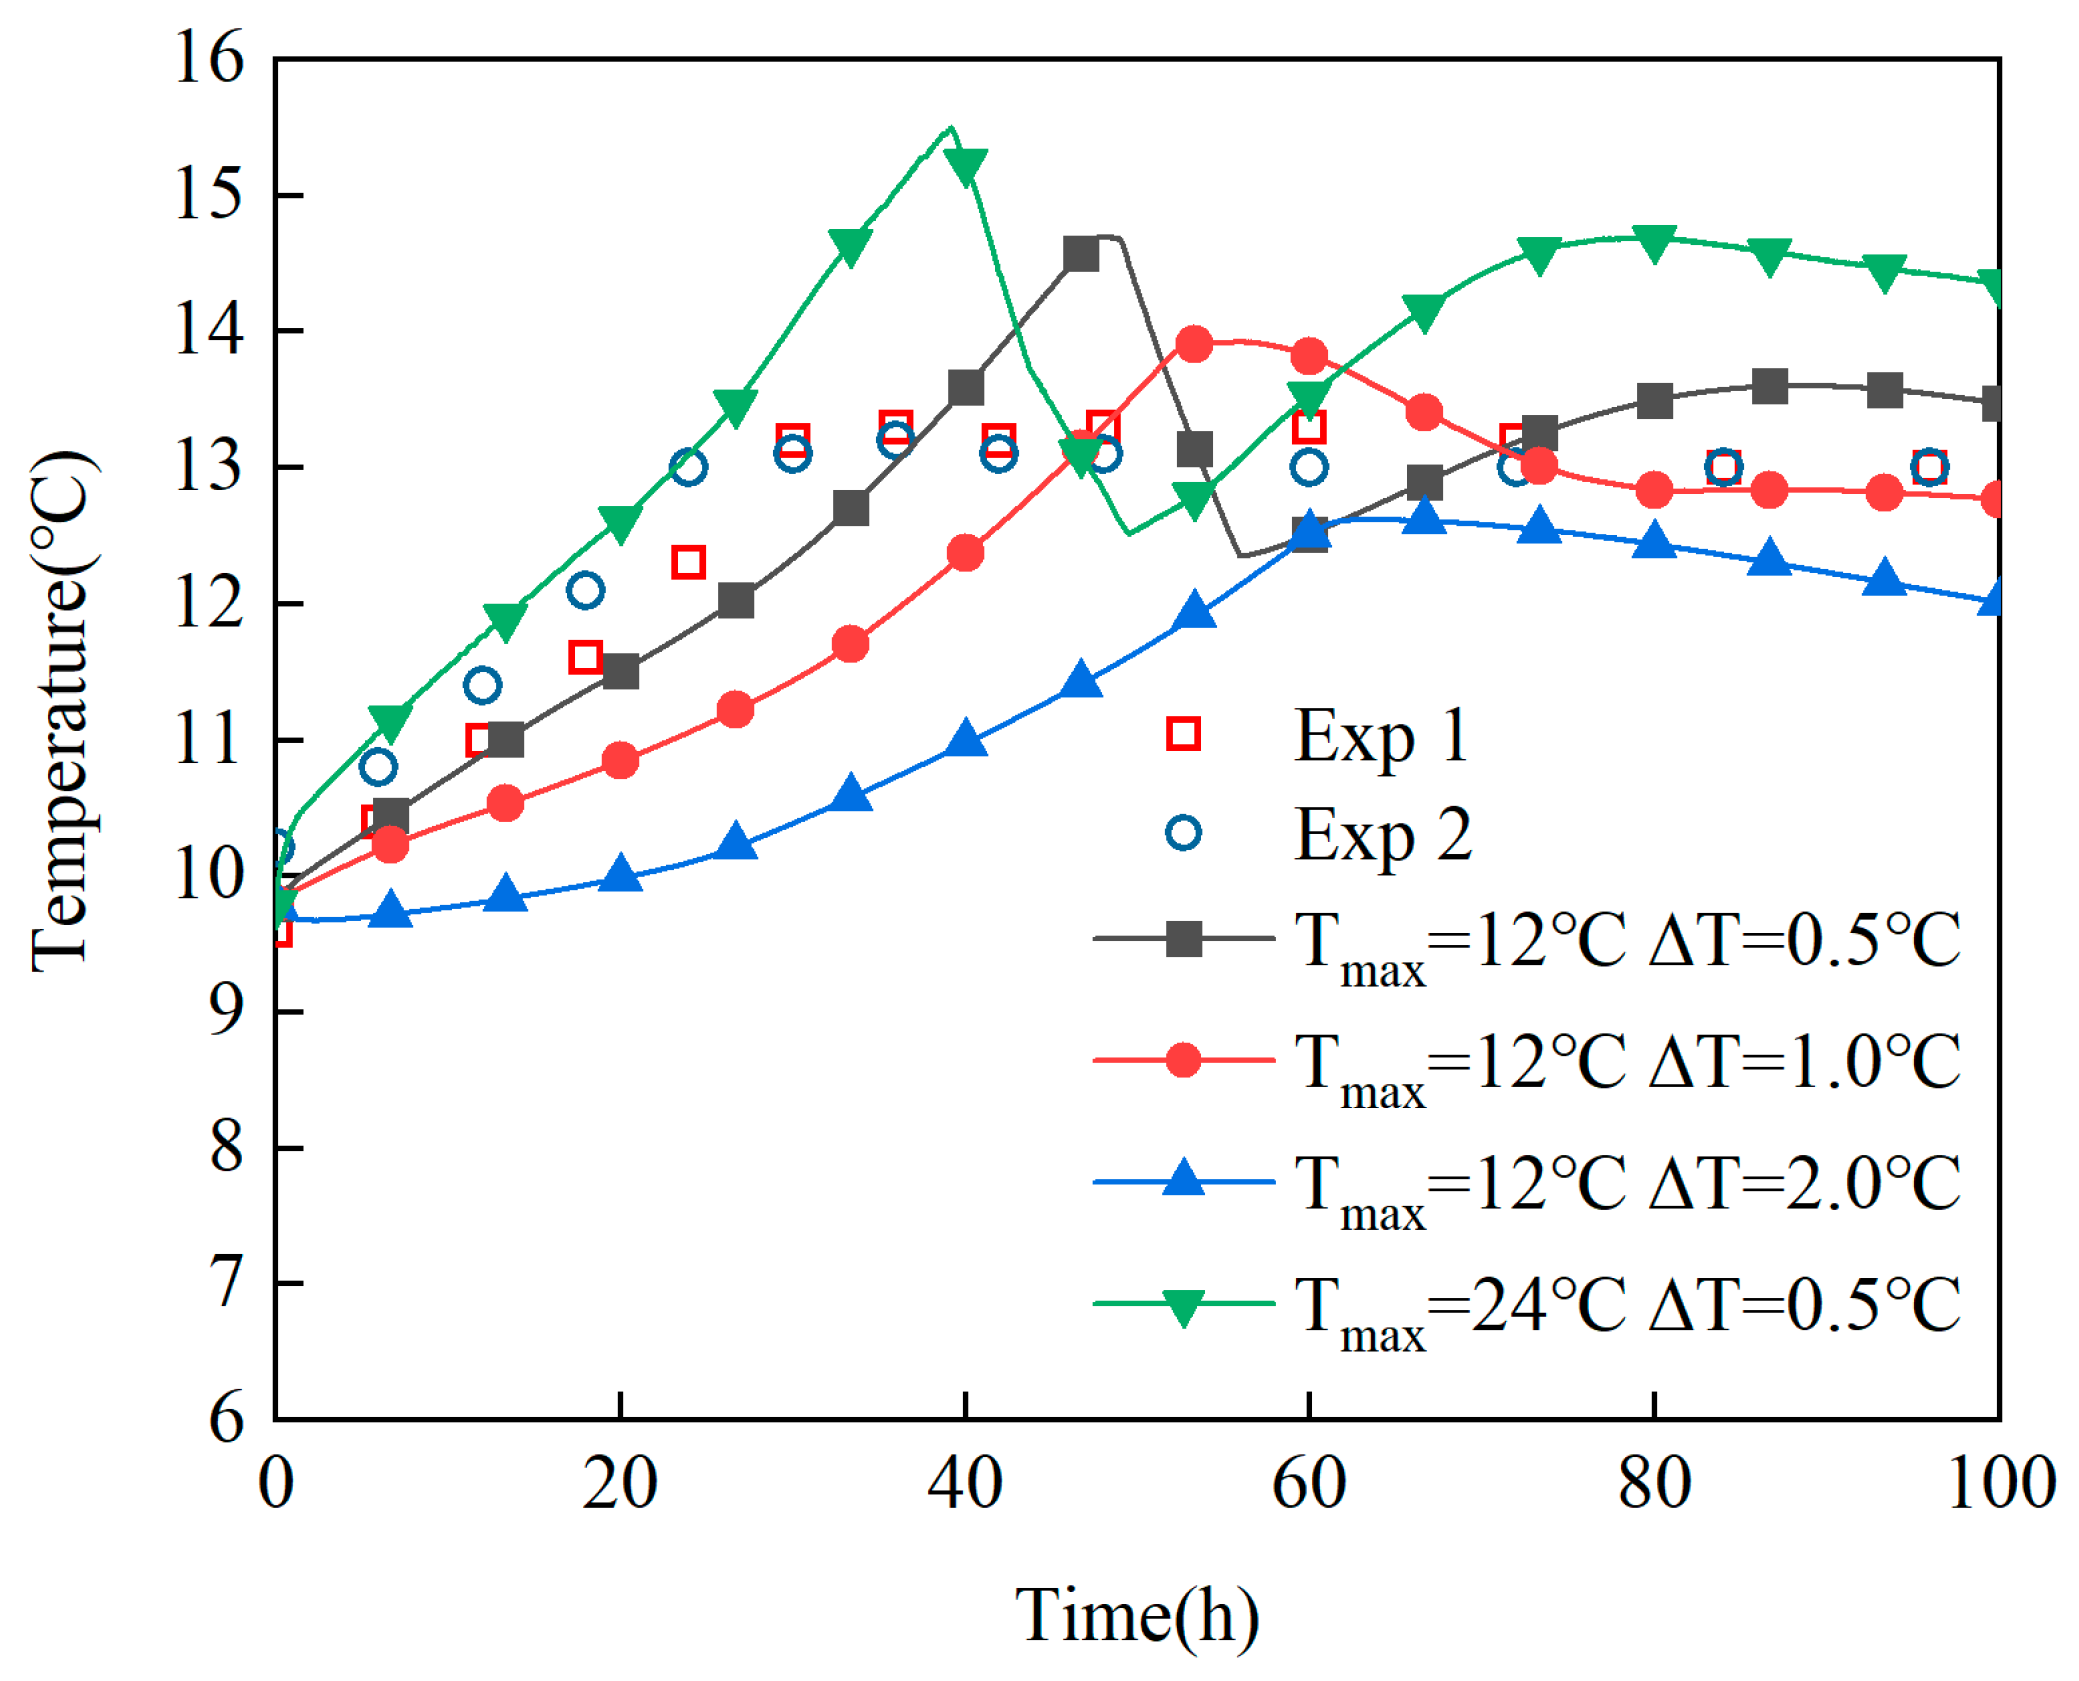
As illustrated in Figure 9, the experiment captures the average temperature variation during the primary fermentation process. Specifically, from the initiation of wort into the conical tank, the wort temperature measurement is approximately 10 °C. During fermentation, as the wort temperature gradually rises, it attains the preset threshold of 13 °C approximately 30 h following the initiation of the infusion process. Thereafter, PID temperature control is activated to maintain a stable wort temperature near 13 °C until most of the sugars were depleted. The simulation is executed by establishing initial and boundary conditions corresponding to key stages in the fermentation process; thus, an average temperature change over time is also depicted in the figure. It is important to note that while the experimental average temperature represents an arithmetic mean of real-time measurements taken at specific points, that used in simulations reflects an overall average for all wort within the tank. In terms of simulation results, it is observed that the wort temperature consistently increases for approximately 40 h; it surpasses 13 °C before continuing on an upward trend. Afterwards, the temperature started to decrease due to the activation of the PID temperature control device, so the temperature curve fluctuated around 13 °C.
Figure 9. Industrial-scale fermentation temperature profile, comparing simulation with experimental data (Exp 1 and Exp 2 represent the arithmetic average of three fixed-point sensor measurements).
According to Figure 9, it can be observed that an increase in the threshold temperature results in a decrease in the overshoot of the average fermenter temperature and a reduction in control hysteresis; however, this also leads to an extended duration for the system to achieve the specified temperature T c . Conversely, when the normal coolant temperature T m a x is elevated, the system’s temperature increases more rapidly and is more susceptible to overshooting. Therefore, for outdoor fermentation tanks, when the environmental temperature is high or the solar radiation is strong, the fuzziness of the PID should be set to a larger value to prevent the wort temperature from exceeding the limit excessively. In contrast, when conditions are favorable, the PID fuzziness should be appropriately reduced to improve fermentation efficiency.
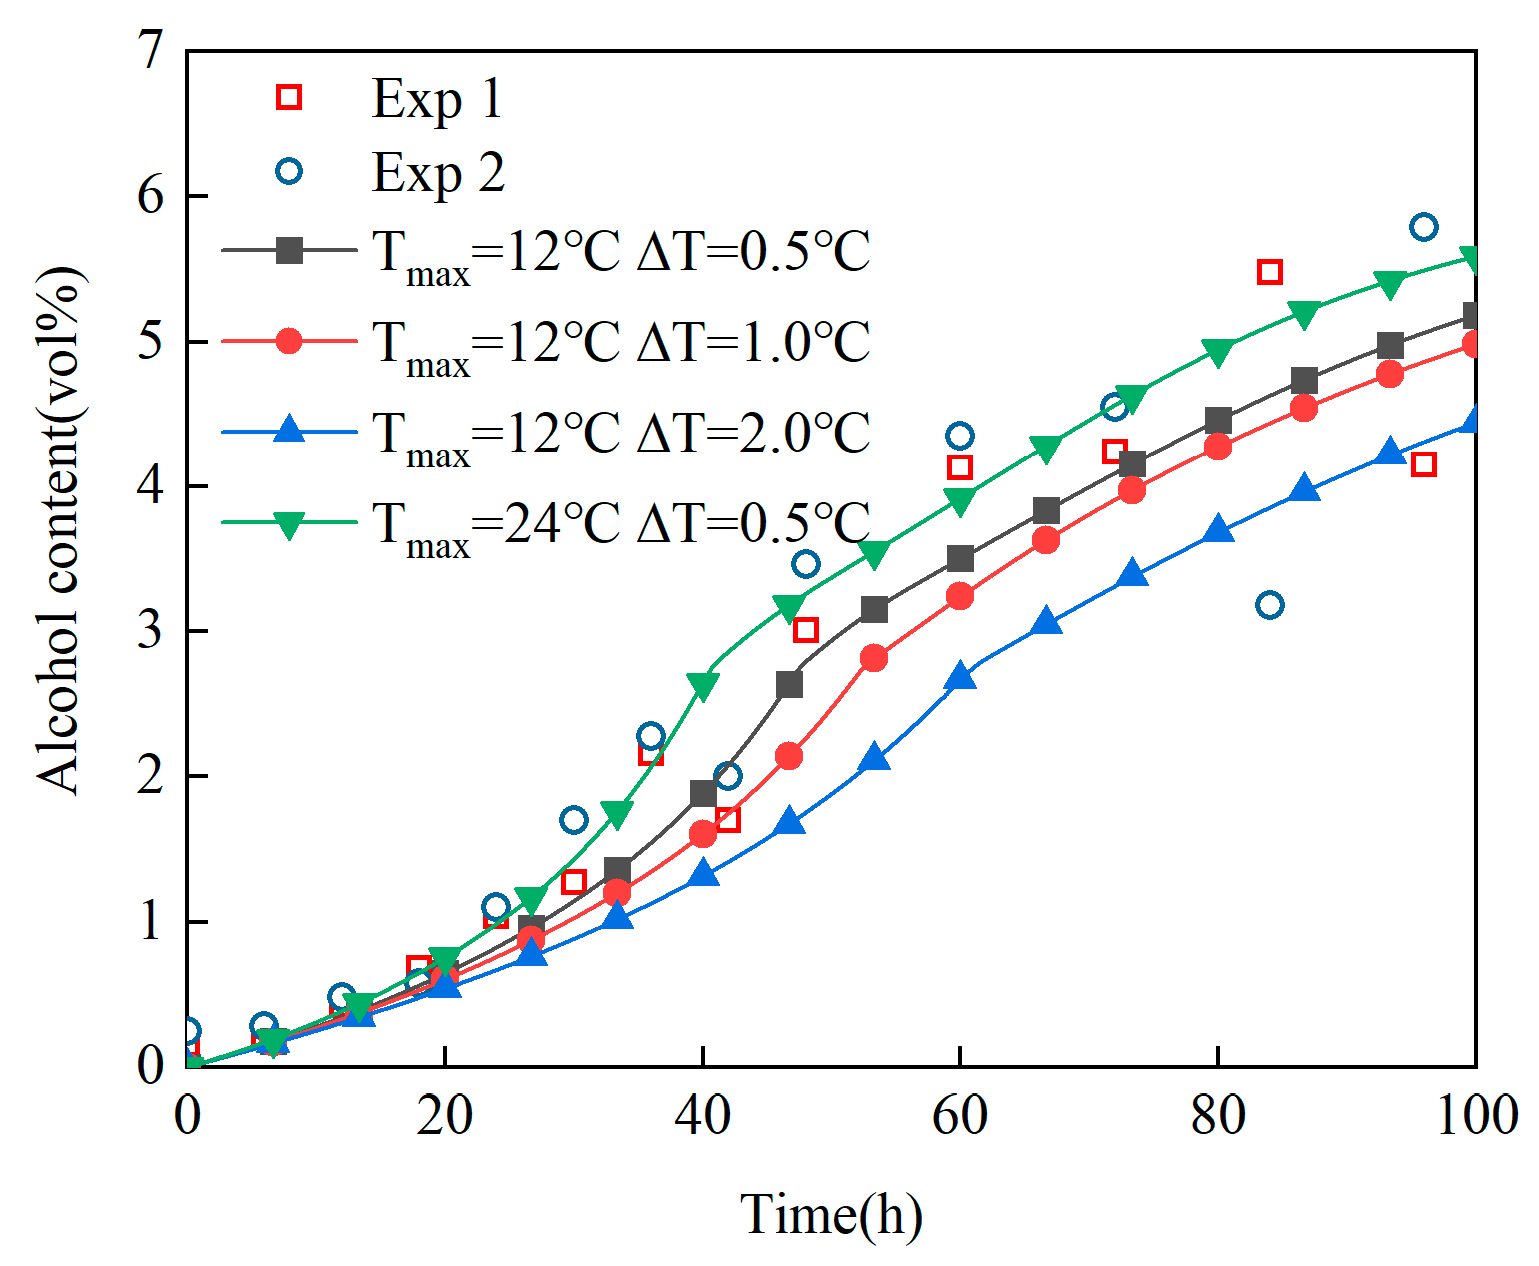
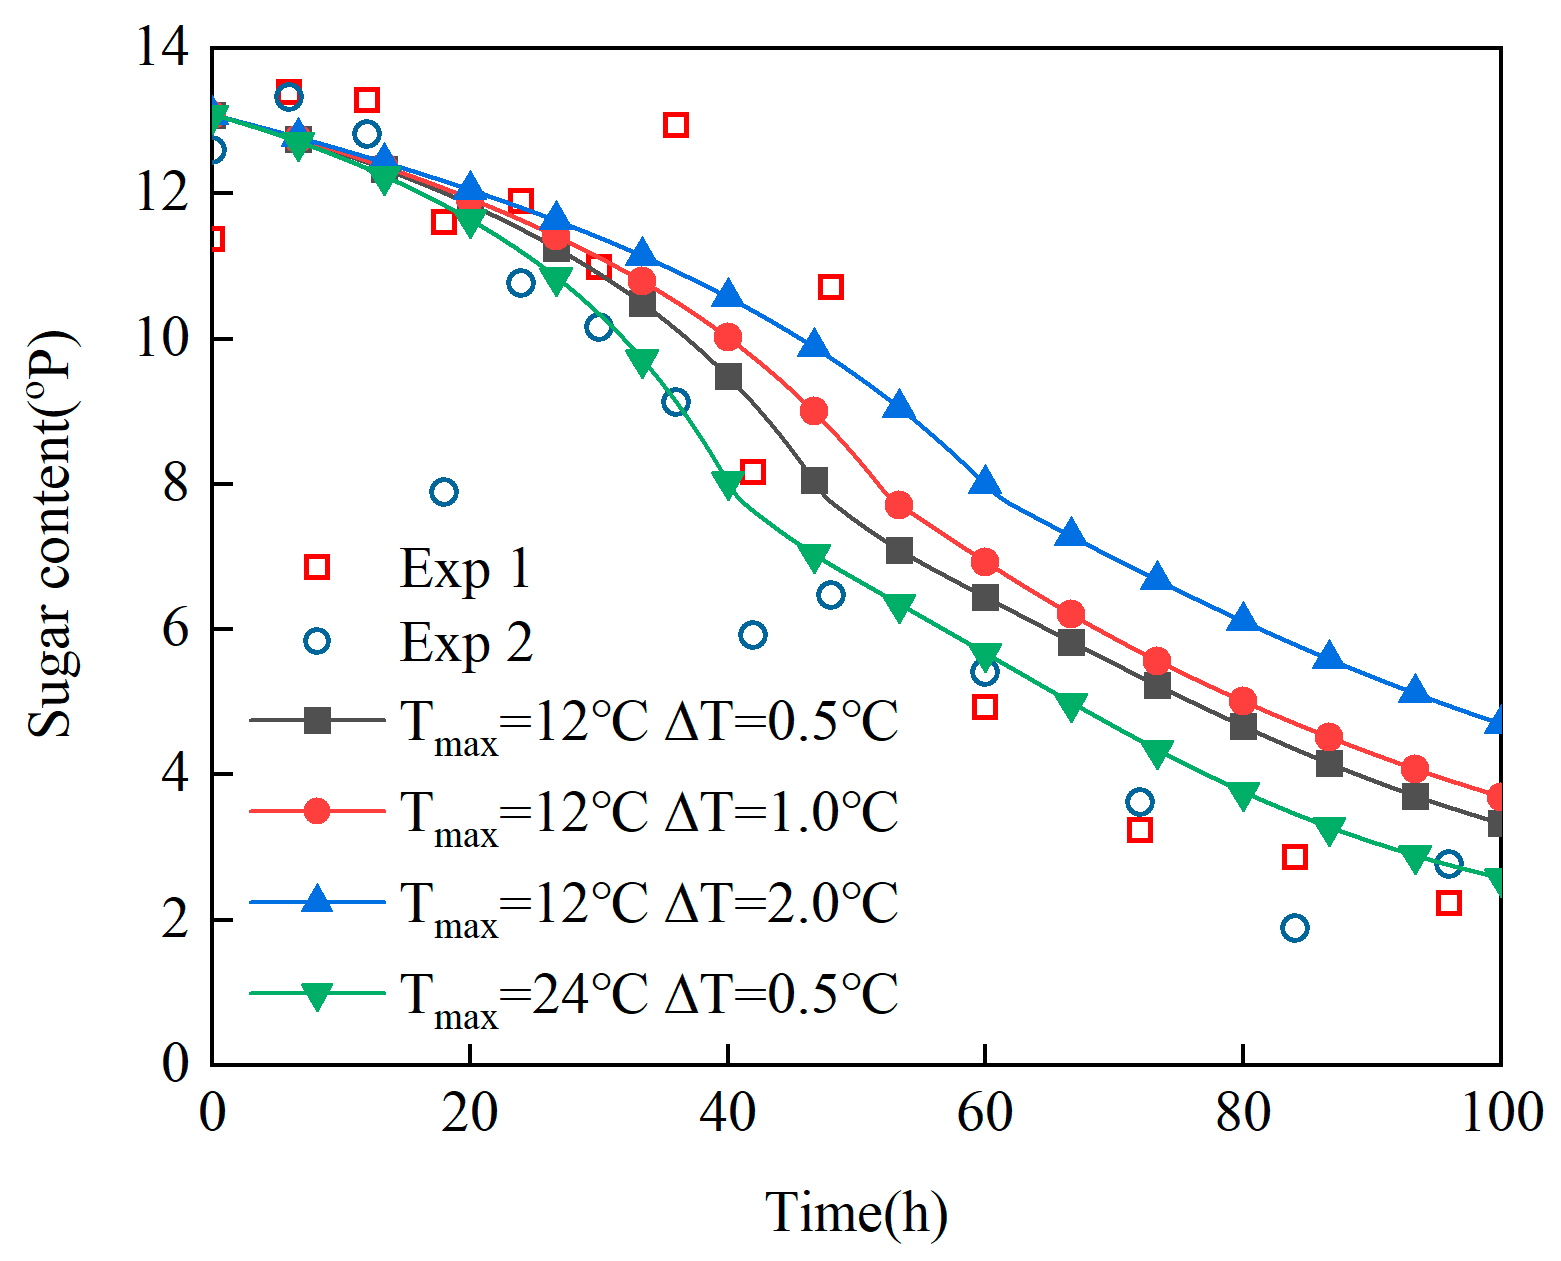
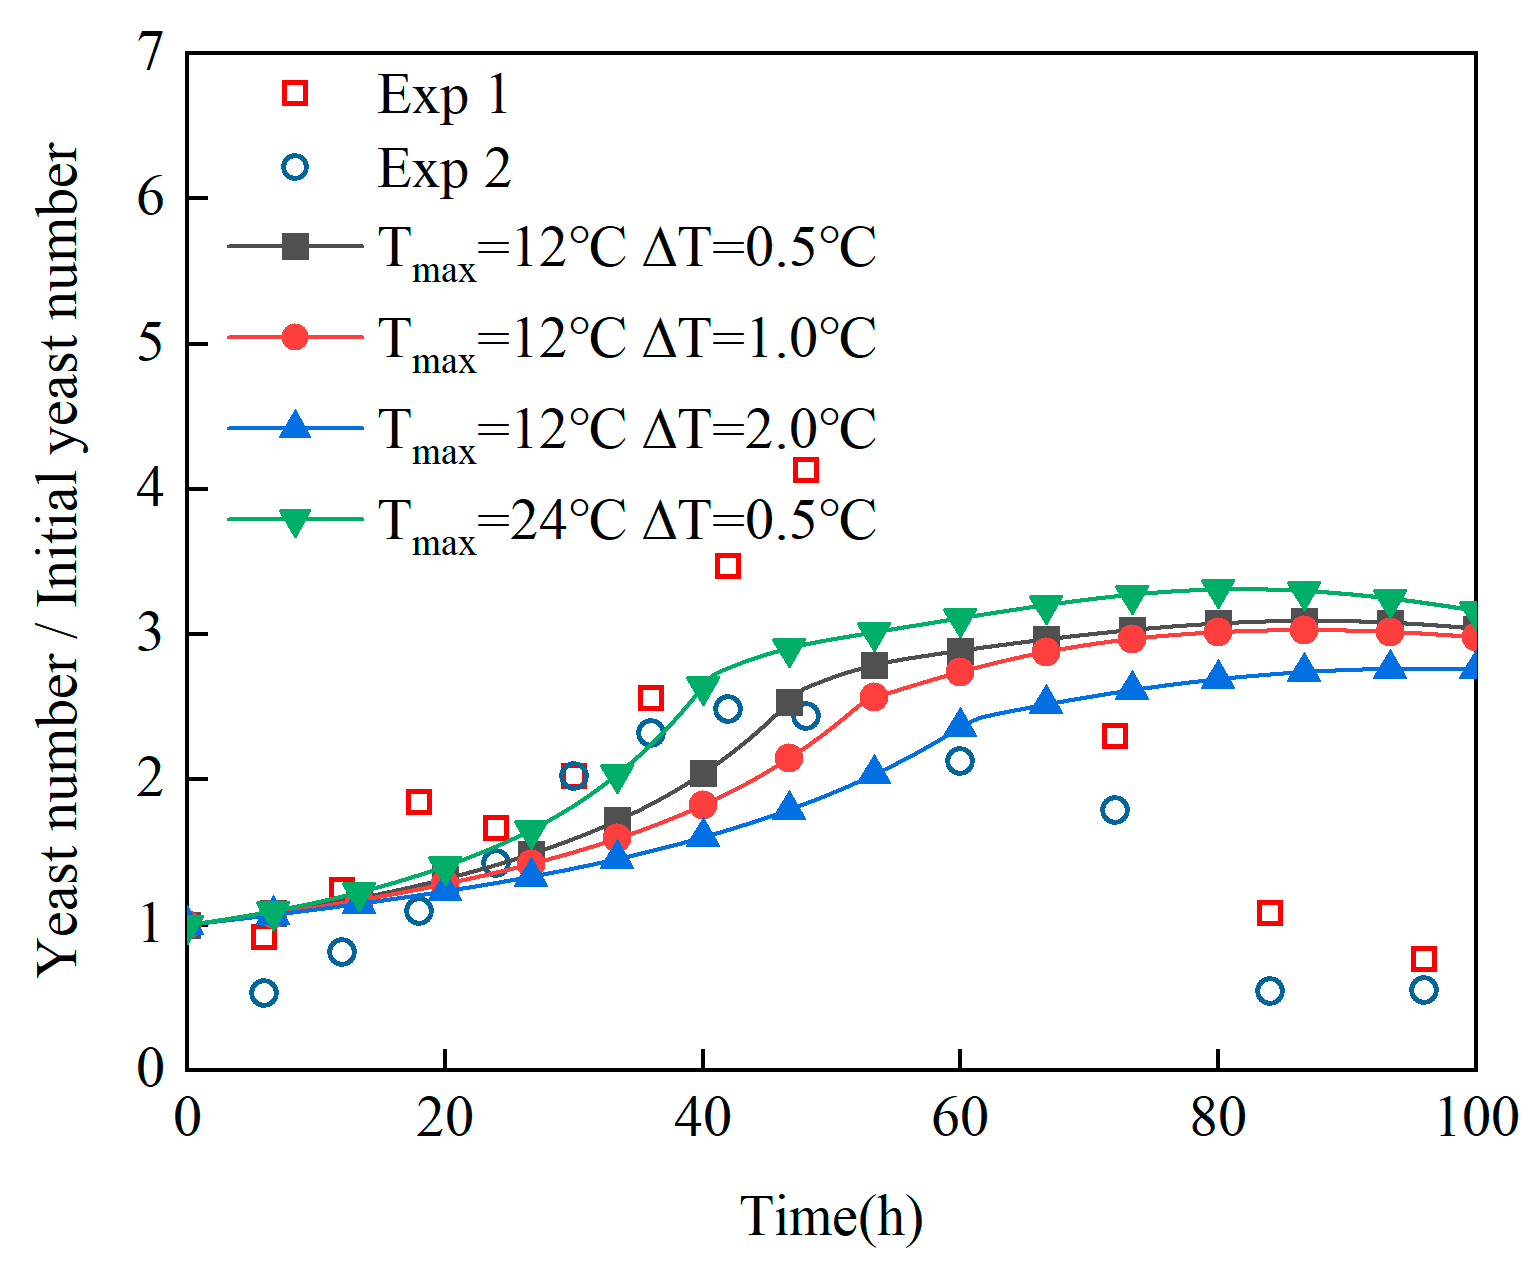
Figure 10 and Figure 11 show the changes in alcohol concentration and sugar content over time in the simulation and experiment, respectively. The trend curves for sugar content and alcohol concentration indicate that the experimental data closely match the simulation results. Under varying temperature control conditions, the experimental data and simulation outcomes nearly coincide, demonstrating that within a 100 h period, alcohol concentration increases from 0% to 6%, while sugar content decreases from 13 °P to 2 °P, thereby completing the primary fermentation process. In contrast, variations in yeast concentration reveal some discrepancies between experimental observations and simulations, as shown in Figure 12. Experimental findings indicate that yeast cell count steadily rose during the first 50 h but subsequently declined from hours 50 to 100. Conversely, simulation results suggest a continuous increase in yeast cell count throughout the entire duration of 100 h, with a gradual decrease only commencing after fermentation concluded at this point. The deviation between the simulation and experimental results can be attributed to two potential factors: First, yeast sedimentation may cause a substantial decrease in nutrient availability for individual yeast cells, leading to a more rapid apoptosis rate than theoretically predicted, which implies that the value of the apoptosis rate, ω , should be higher. Second, the rise in ethanol concentration or the decline in glucose concentration may inhibit yeast cell proliferation, and this inhibitory effect becomes increasingly significant over time.
Figure 10. Industrial-scale fermentation ethanol concentration profile, comparing simulation with experimental data (Exp 1 and Exp 2 are derived from samples taken at a single fixed port).
Figure 11. Industrial-scale fermentation sugar content profile, comparing simulation with experimental data (Exp 1 and Exp 2 are derived from samples taken at a single fixed port).
Figure 12. Industrial-scale fermentation yeast number profile, comparing simulation with experimental data (Exp 1 and Exp 2 are derived from samples taken at a single fixed port). To quantitatively evaluate the model’s predictive accuracy, we calculated the coefficient of determination (R2). Table 6 presents the results for the key fermentation kinetics—alcohol concentration and sugar content—under the primary simulation condition (Tmax = 12 °C, ΔT = 0.5 °C). This condition was selected because it serves as the basis for the subsequent detailed analysis of the internal spatio-temporal distributions of the flow and temperature fields.
As Table 8 shows, the simulation results demonstrate excellent agreement with the two independent sets of experimental data. The R2 values for alcohol concentration reached 93.2% and 87.5%, while those for sugar content also reached 84.8% and 77.0%, respectively. These high R2 values provide strong evidence that our coupled model can capture and predict the core chemical reaction kinetics of the main fermentation process with high fidelity under typical industrial operating conditions. This offers a solid quantitative basis for the model’s application as a theoretical tool for optimizing cooling strategies and control algorithms.
Table 8. R2 values for industrial-scale model under different conditions (Tmax = 12 °C, ∆T = 0.5 °C).
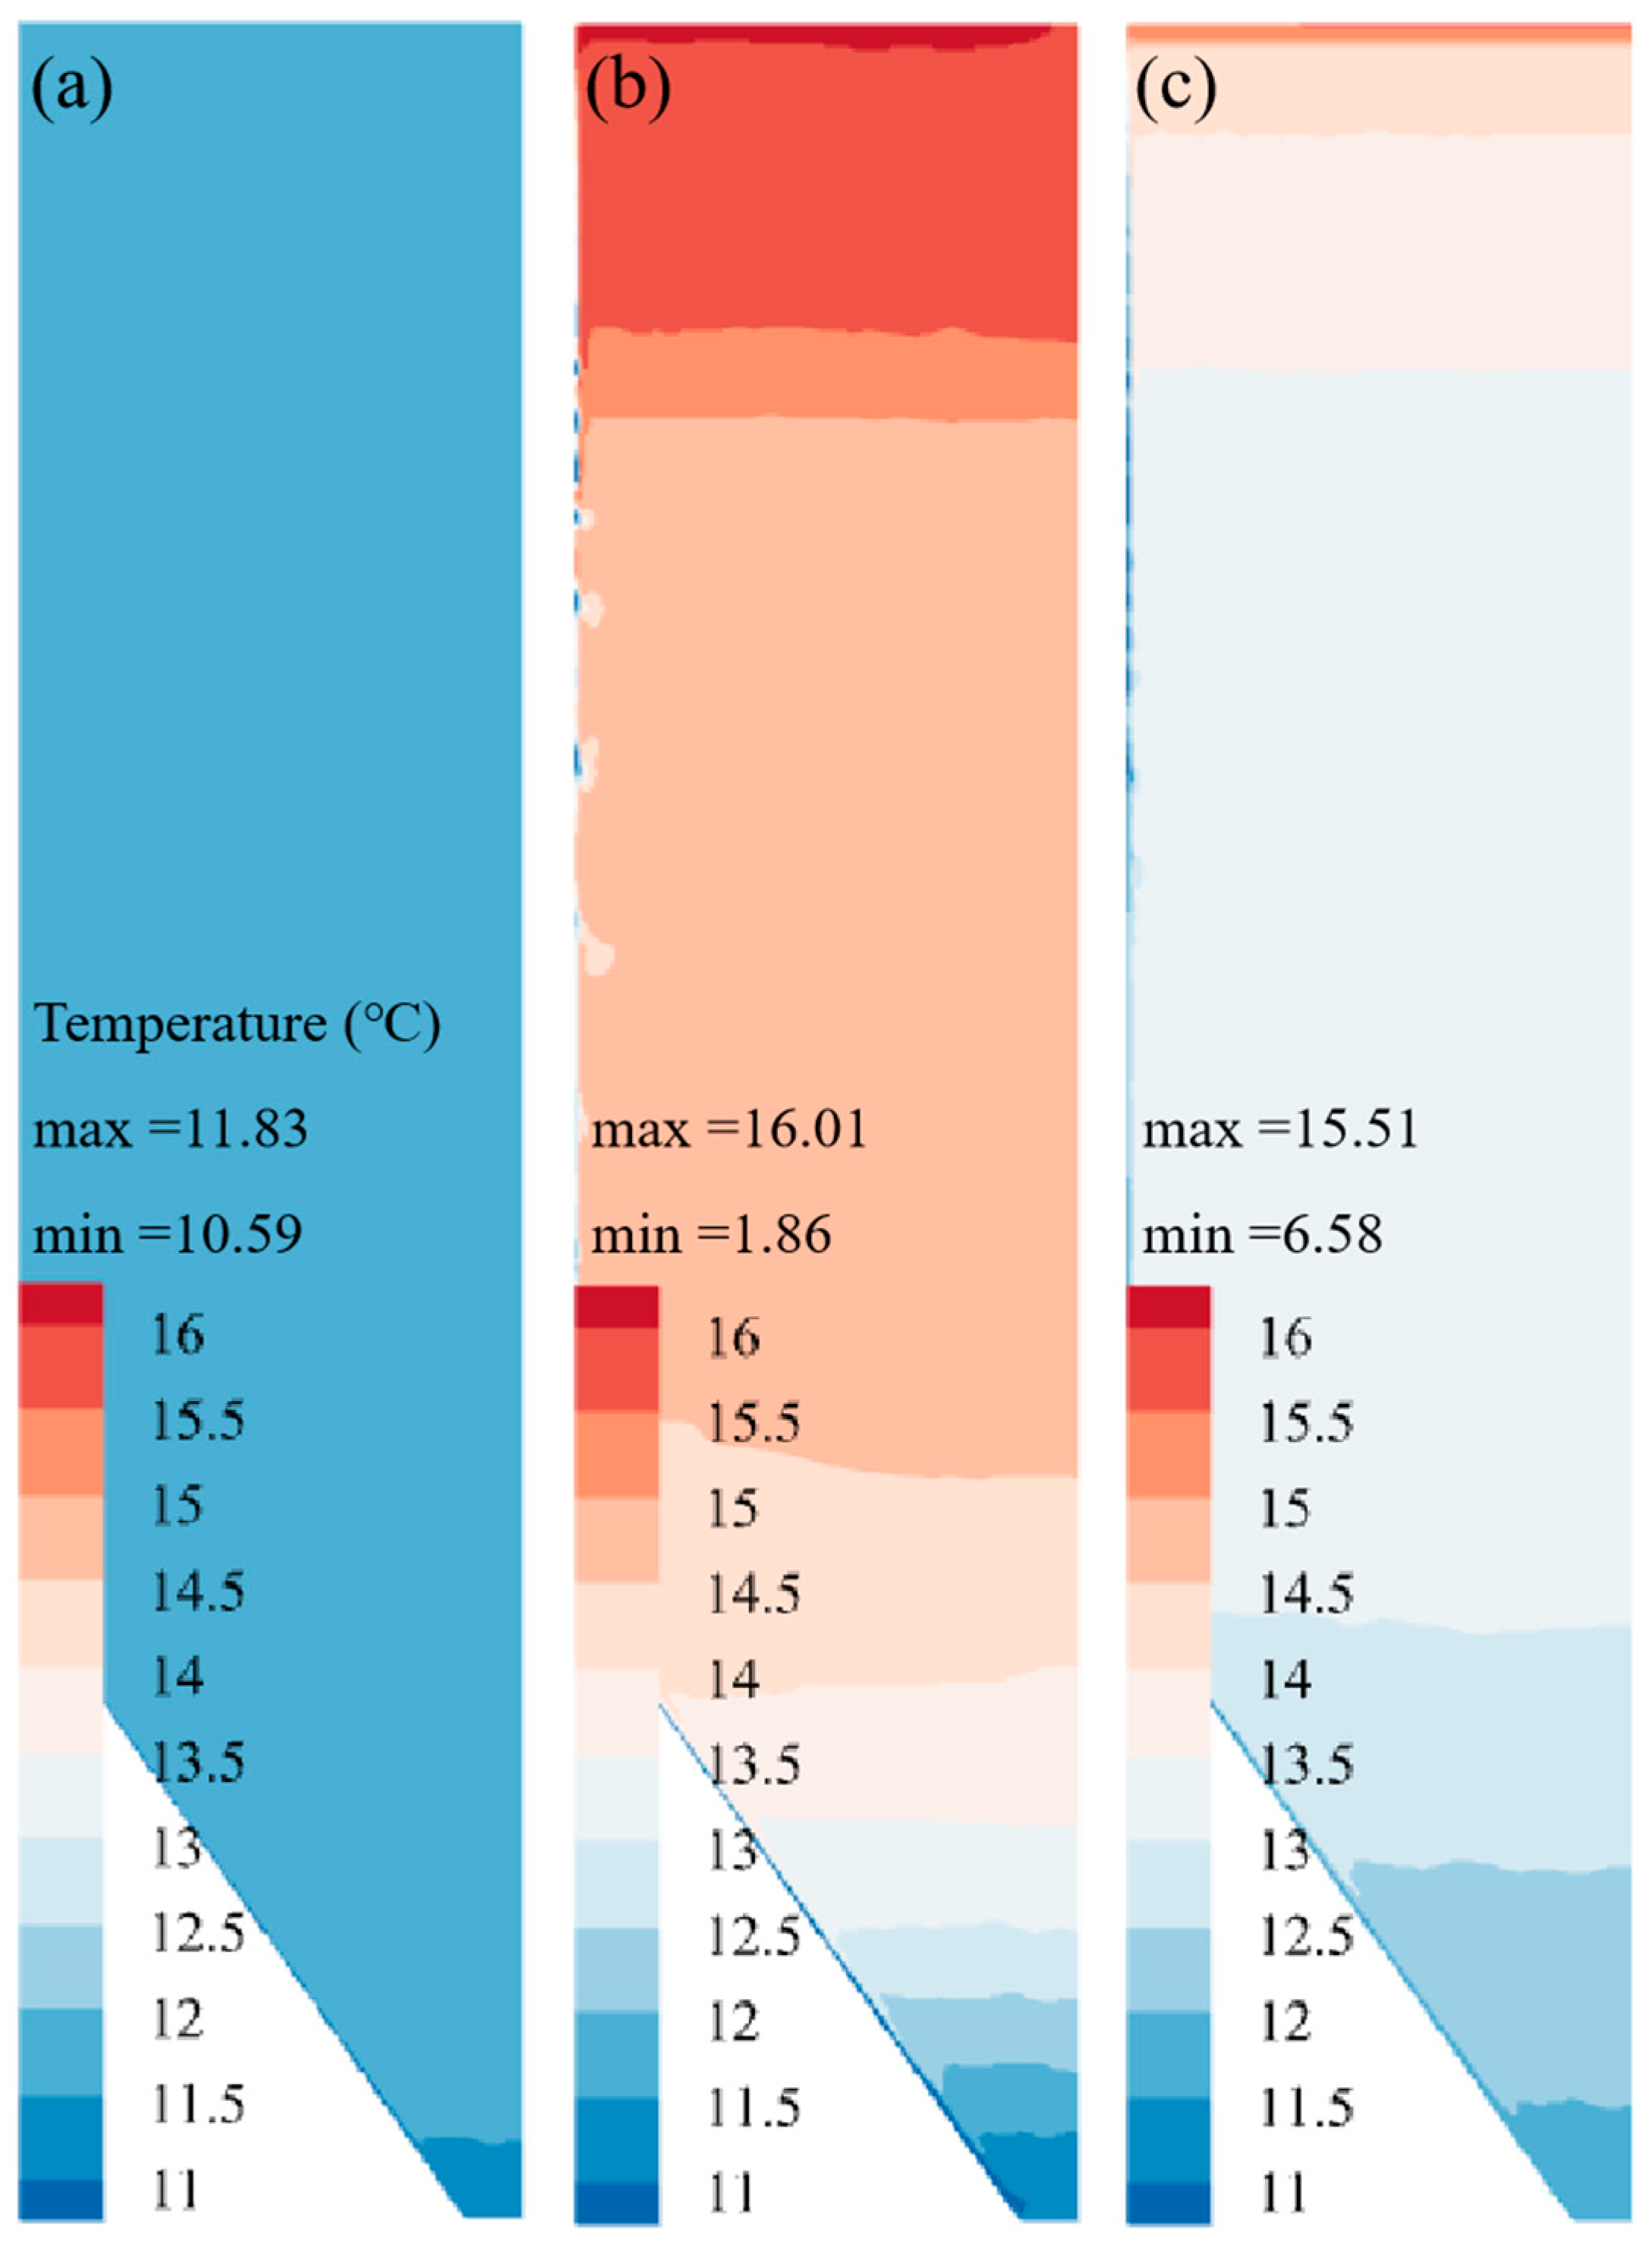
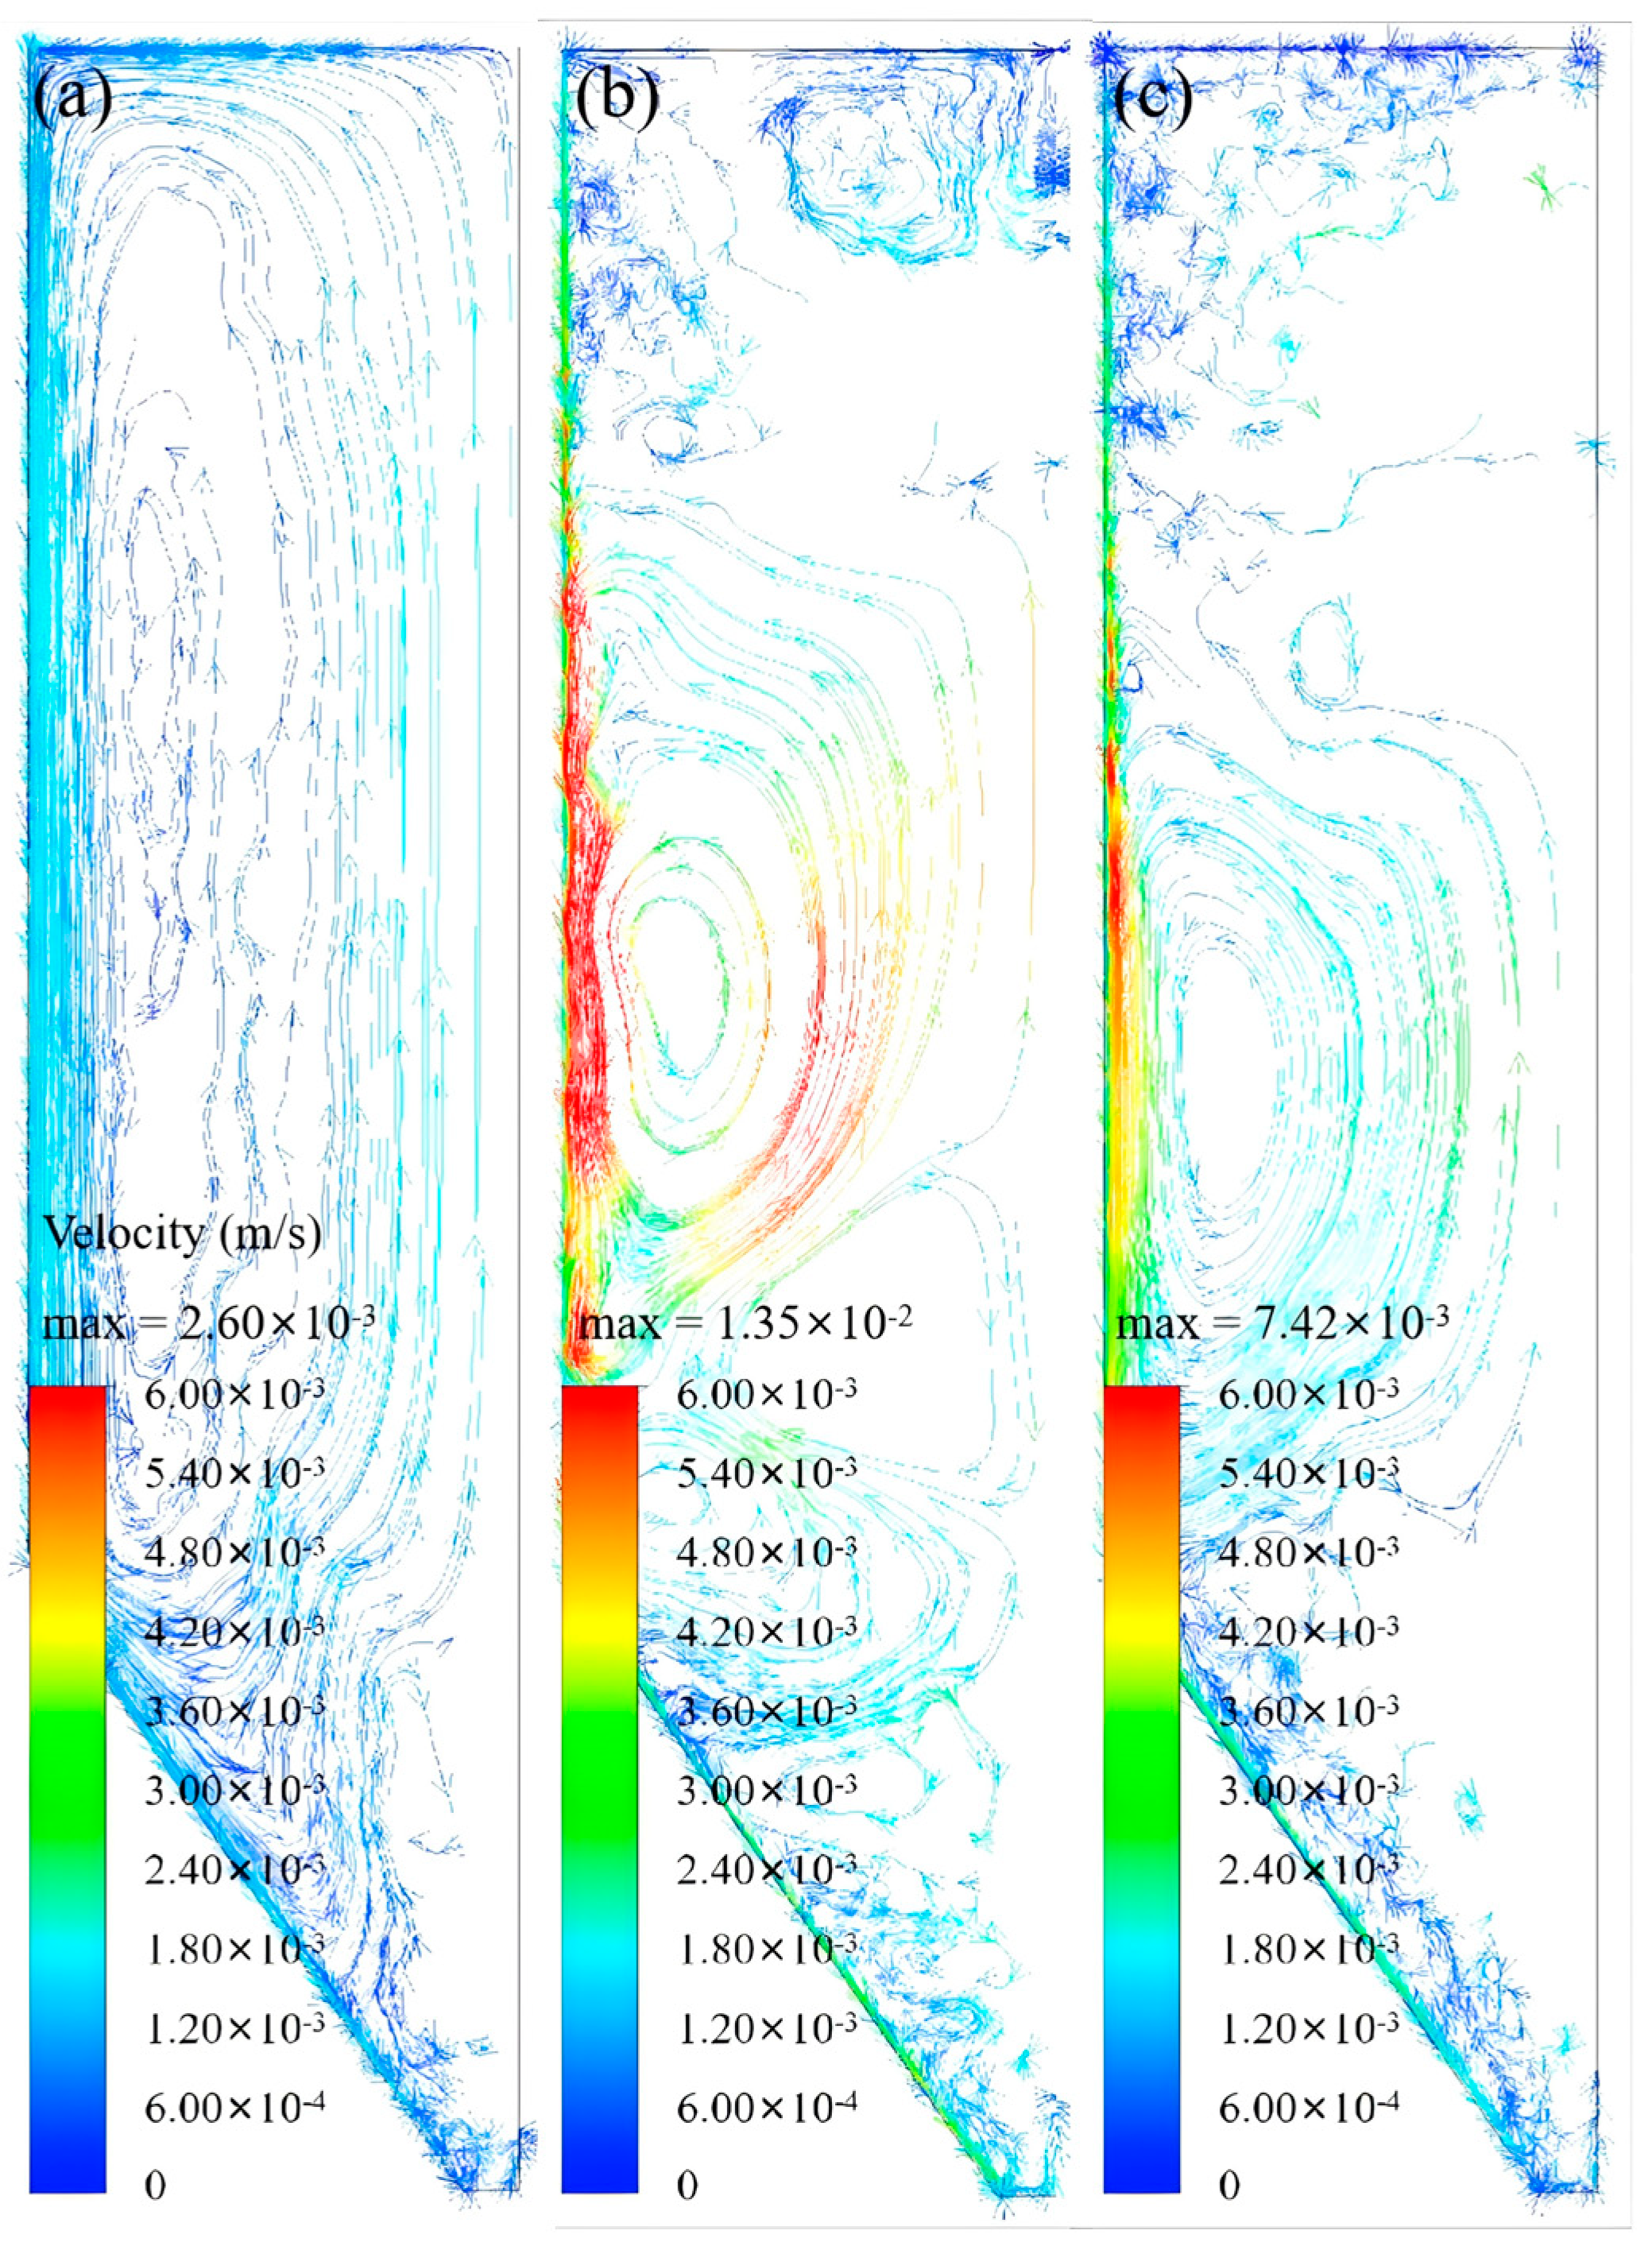
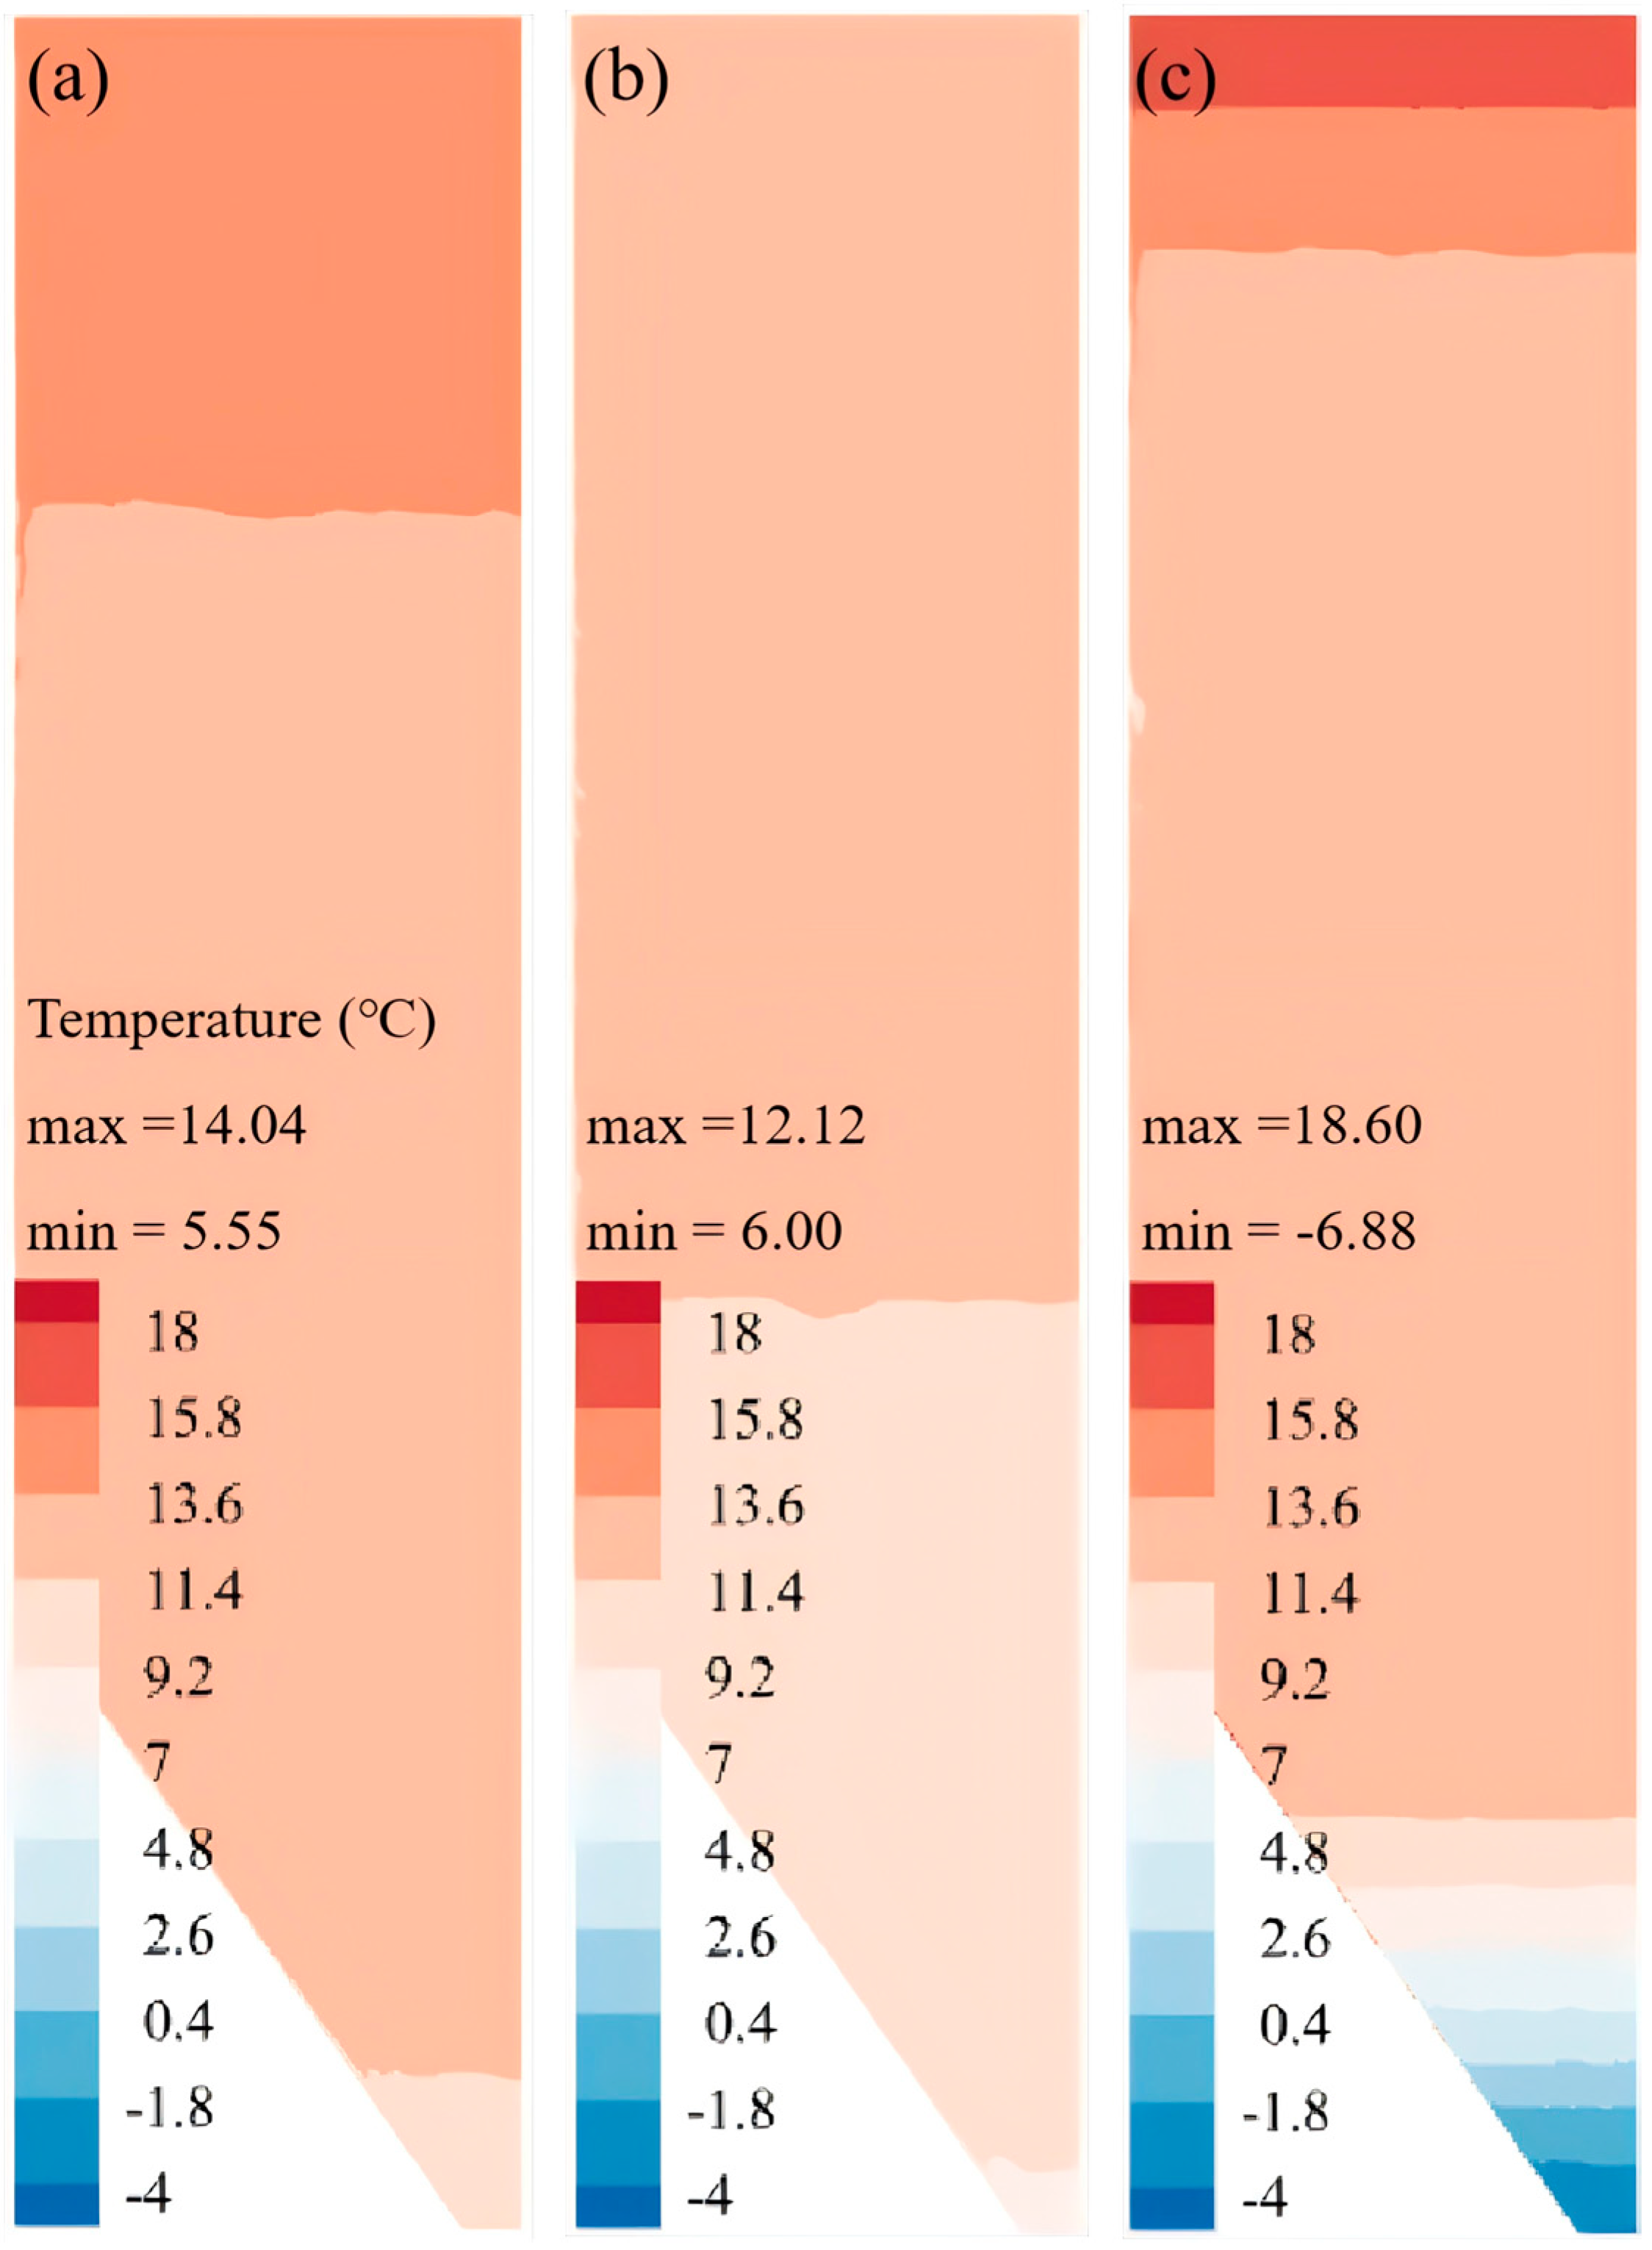
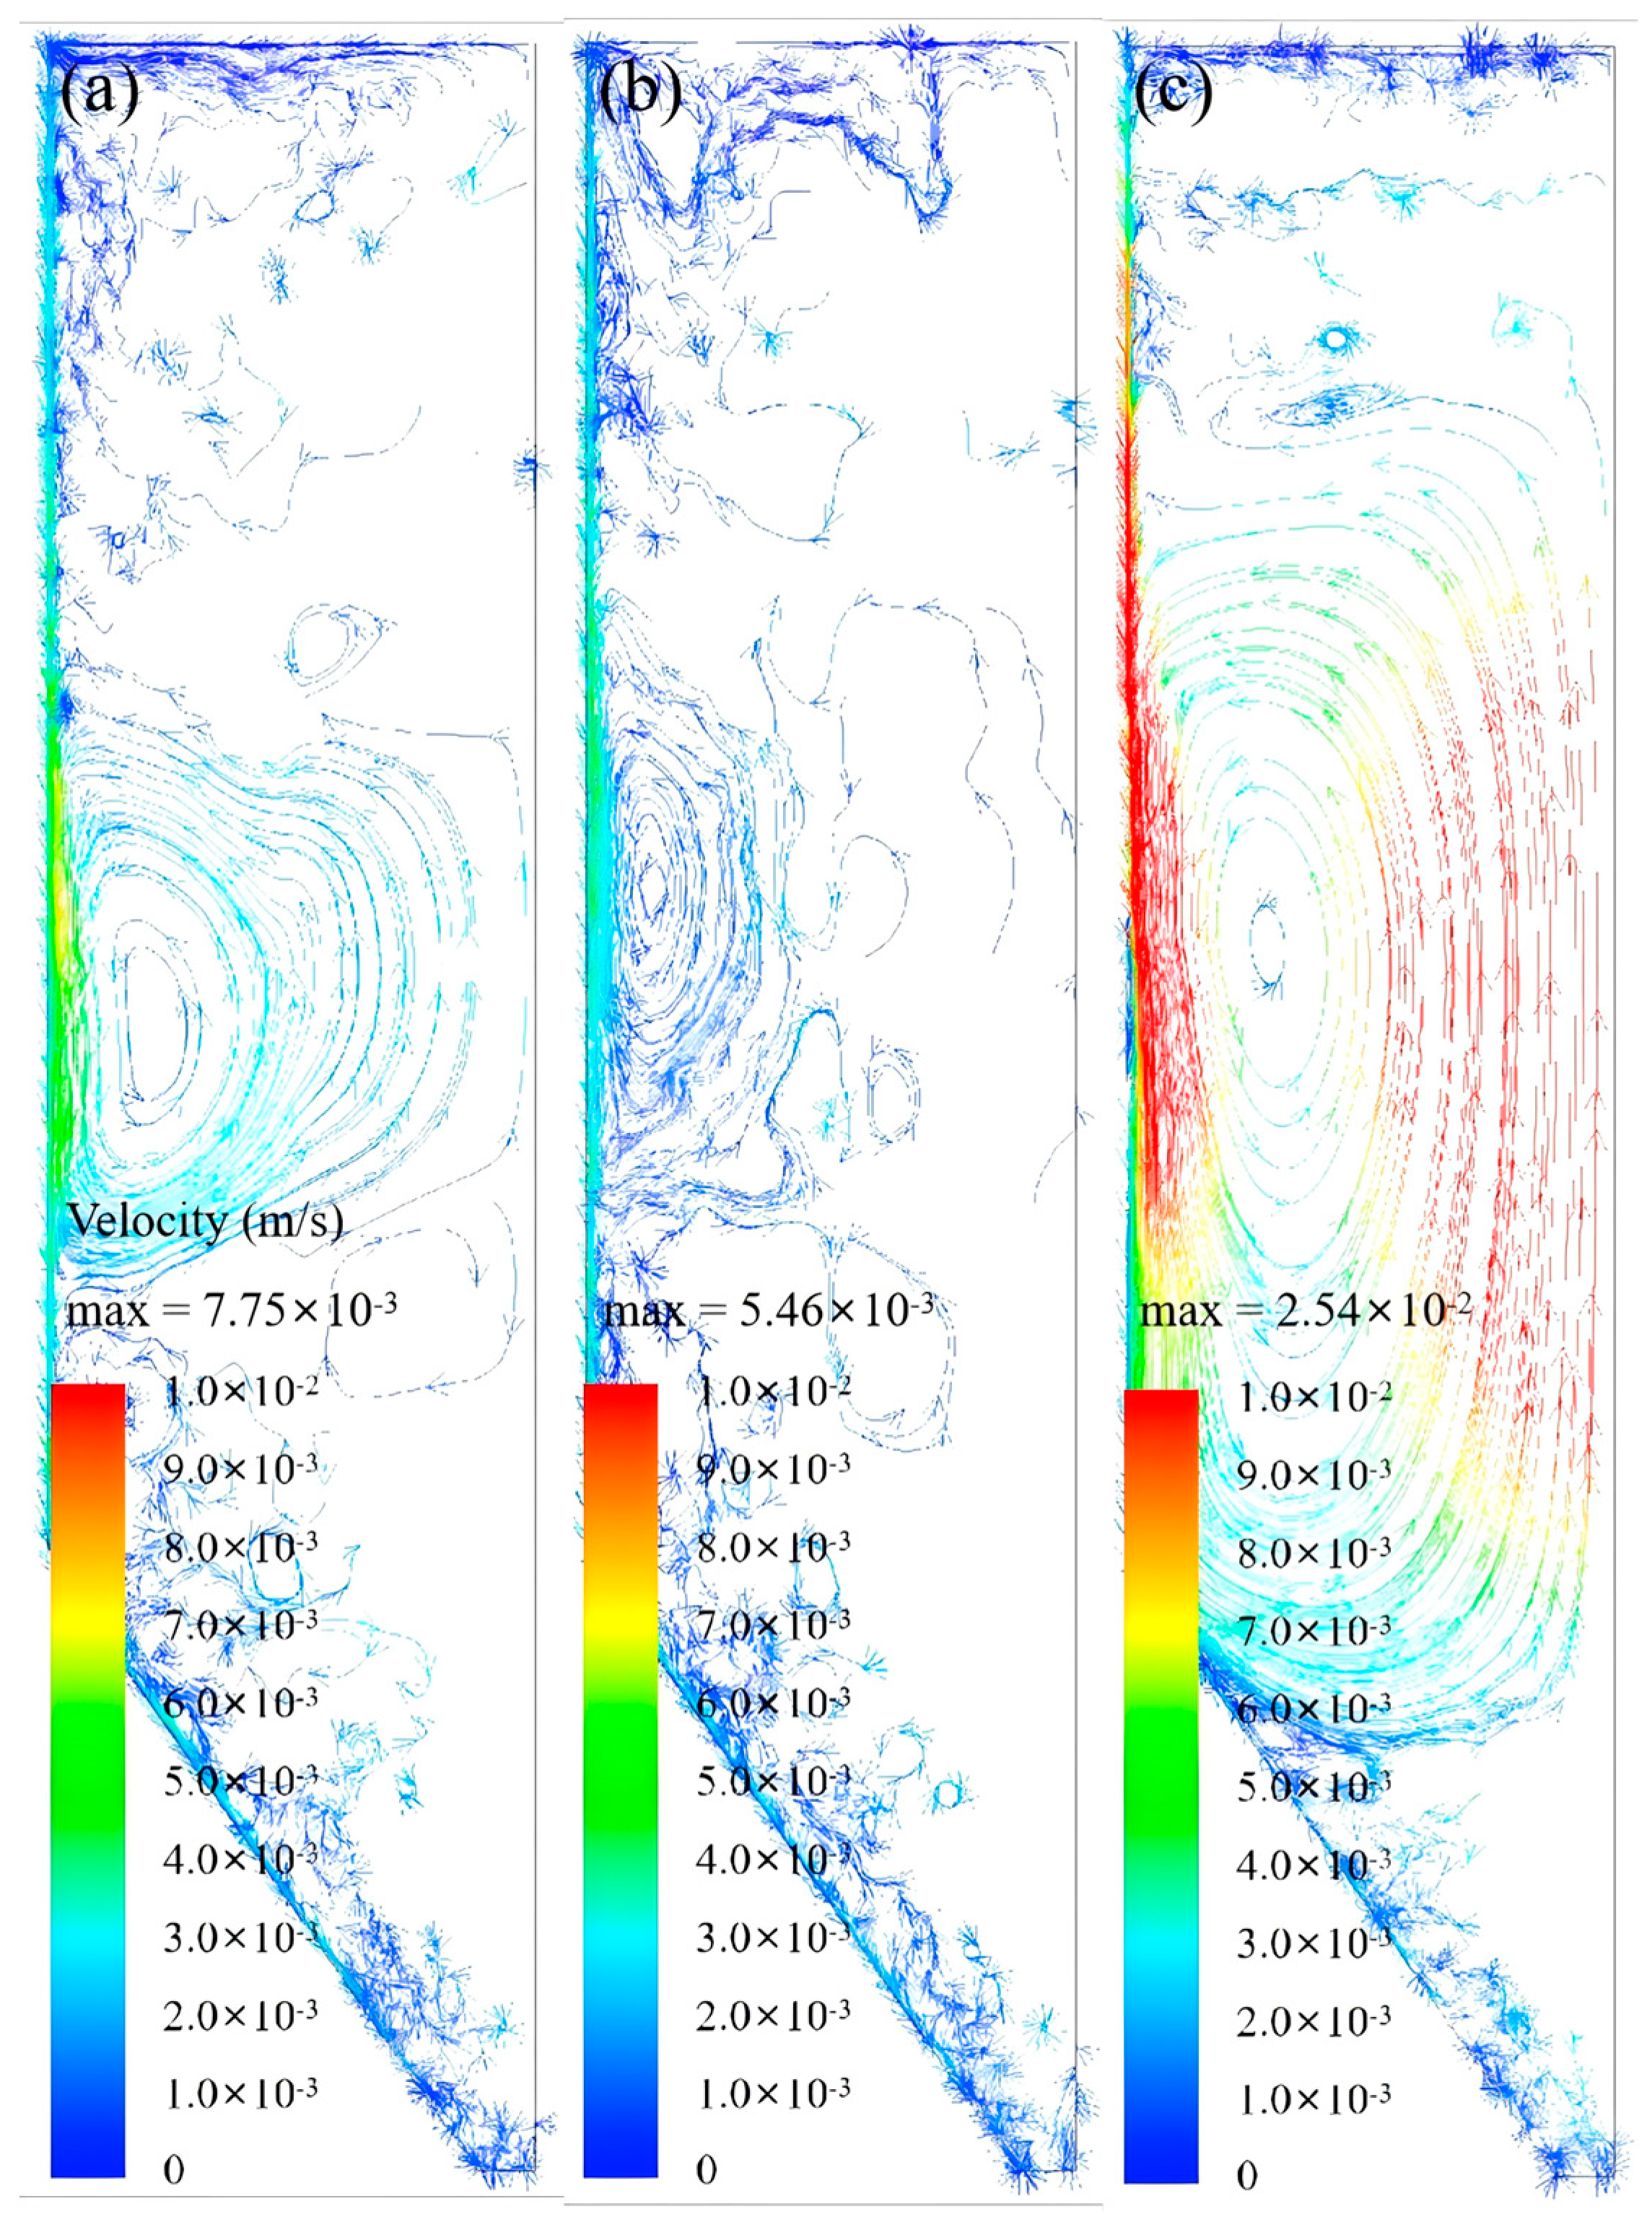
In contrast to traditional experimental methods, which are limited to sparse point measurements from wall-mounted sensors, the simulation provides a high-fidelity visualization inside the fermenter’s “black box,” a critical challenge highlighted in industrial practice. This spatially and temporally resolved data allows for a mechanistic understanding of the transport phenomena governing fermentation performance. Unlike the simplified compartment models used in early alcoholic fermentation studies such as those by Zenteno et al. [], our CFD results reveal complex, asymmetric flow structures and thermal gradients that are crucial for process control. Figure 13 presents the temperature distribution of the wort within the fermenter at 24, 48, and 72 h, while Figure 14 depicts the corresponding flow path lines at these intervals.
Figure 13. Temperature spatial distribution within the fermenter, Tmax = 12 °C, ∆T = 0.5 °C. (a) 24 h; (b) 48 h; (c) 72 h.
Figure 14. Flow path line spatial distribution within the fermenter, Tmax = 12 °C, ∆T = 0.5 °C. (a) 24 h; (b) 48 h; (c) 72 h.
At the 24 h mark, the temperature distribution of the wort was relatively uniform as it remained in the heating phase, with most areas measuring approximately 11.8 °C. The overall temperature difference did not exceed 2 °C. During this period, a partial opening of the condenser pipeline valve in the fermenter resulted in a slight cooling effect on its walls; consequently, wall temperatures were lower than those at the center of the tank. This induced downward flow of wort along the walls and an upward flow at the tank’s center, thereby establishing a significant circulation pattern throughout. Notably, natural convection effects are minimal during this stage, with peak flow velocities reaching up to 2.60 mm·s−1 at the central axis of the tank. Henceforth, heat transfer within the fermenter predominantly occurs due to diffusion mechanisms.
By 48 h, due to the significant lag in the system’s response to the temperature control device, the average temperature of the fermenter exceeds 13 °C. Consequently, there is a sharp increase in the temperature difference within the fermenter, resulting in a non-equilibrium state for the system. At this point, the maximum recorded temperature reaches 16.01 °C, surpassing process requirements by 3 °C, specifically at the top of the fermenter. In contrast, influenced by the cooling jacket, the wall temperature of the fermenter drops as low as 1.86 °C, while approximately 10 °C is noted at its bottom. The substantial temperature gradient induces strong convection currents in the middle section of the fermenter, with a flow velocity measuring at 13.2 mm·s−1, thereby establishing a local large circulation pattern. Additionally, other regions within the fermenter are observed to generate small local circulations attributable to various uneven condensation effects. During this period and impacted by intense circulation dynamics in the middle section, flow separation occurs along the walls; this phenomenon involves cooler wort being entrained away from the walls towards the center of the fermenter. Moreover, a detailed examination of the temperature distribution near the walls reveals that certain areas exhibit swirling characteristics within the thermal boundary layer adjacent to the walls. At this stage, the enhancement of heat transfer within the fermenter is facilitated by robust local convection patterns.
By 72 h, following the continuous operation of the temperature control device, the system as a whole begins to stabilize. The average temperature within the fermenter gradually approaches the target of 13 °C, albeit with some oscillations present. The temperature differential within the fermenter also reduces, with the maximum recorded temperature reaching 15.51 °C at the top of the fermenter, and a minimum recorded temperature of 6.58 °C observed near the cooling jacket; meanwhile, temperatures at the bottom of the fermenter are approximately 12 °C. In comparison to conditions observed at 48 h, natural convection effects within the fermenter have diminished by 72 h, characterized by a maximum flow velocity of 7.42 mm·s−1 and a reduction in both scale and turbulence within the thermal boundary layer adjacent to its walls. At this stage, it is noted that convection-induced heat transfer enhancement within the fermenter has experienced a significant decline.
For a horizontal comparison at 48 h, Figure 15 illustrates the temperature distribution of the wort under three different conditions. Similarly, Figure 16 depicts the corresponding flow streamlines inside the fermenter. Upon examining Figure 13b and Figure 15a,b, it is evident that the fermenter systems with temperature control precision of 1.0 °C and 2.0 °C both enter an overshoot state, while another system remains below 13 °C. All three temperature control systems have been activated, with the system exhibiting lower temperature control precision starting earlier due to its specific control algorithm. At this juncture, a greater fuzziness in the control method correlates with a reduced temperature difference within the system and consequently lowers maximum temperatures; although the 1.0 °C system experiences an overshoot, its peak temperature is closer to meet fermentation process requirements of 13 °C compared to that of the 0.5 °C system, which also maintains a minimum temperature further from freezing point conditions. In contrast, the 0.5 °C system consistently controls temperatures stably below 13 °C. As the disparity in system temperatures diminishes, so too do natural convection effects within the fermenter as depicted in Figure 16. Concurrently, it is observed that maximum convection velocities are recorded at 13.5 mm·s−1 for the 1.0 °C system and nearly half that value (7.75 mm·s−1) for the 2.0 °C unit; additionally, maximum velocity for this other system reaches only 5.46 mm·s−1. An analysis of circulation structures across these three systems reveals similar configurations characterized by large local circulations primarily in midsections coupled with smaller circulations elsewhere, but as thermal gradients decrease, so do their respective influence ranges on overall fluid dynamics within each fermenting apparatus. The system conditions illustrated in Figure 15c are characterized by an ambient temperature of 24 °C and a control method fuzziness of 0.5 °C. The figure indicates that the temperature gradient within the fermenter is significantly large, with the maximum temperature reaching 18.6 °C at the top, while the minimum temperature drops to −6.88 °C near the condensing jacket wall-close to the coolant’s lowest temperature. The bottom region of the conical tank exhibits an approximate temperature of −4 °C, during which time, the alcohol content is observed to be 3.5%, correlating with a freezing point around −2 °C. Consequently, under realistic operational conditions using this control algorithm, it is anticipated that freezing occurs at the bottom of this fermenter. Due to this substantial temperature differential, a vigorous circulating flow develops within the fermenter, achieving a maximum convection velocity of 25.4 mm·s−1. However, since this circulation does not manifest as localized circulation in the central section, flow separation occurs at the junction between the conical and cylindrical segments located at the base of the fermenter. As a result, cooler wort adjacent to the cooling jacket cannot effectively circulate towards the center; instead, it is directly transported to the conical bottom section, diminishing convective heat transfer efficiency. This further facilitates accumulation patterns whereby lower-temperature wort congregates at the bottom while higher-temperature wort collects at the top part, ultimately exacerbating the overall thermal gradient within the tank.
Figure 15. Temperature spatial distribution within the fermenter at 48 h. (a) Tmax = 12 °C, ∆T = 1.0 °C; (b) Tmax = 12 °C, ∆T = 2.0 °C; (c) Tmax = 24 °C, ∆T = 0.5 °C.
Figure 16. Flow path line spatial distribution within the fermenter at 48 h. (a) Tmax = 12 °C, ∆T = 1.0 °C; (b) Tmax = 12 °C, ∆T = 2.0 °C; (c) Tmax = 24 °C, ∆T = 0.5 °C.
These comparative simulations (Figure 15 and Figure 16) are crucial as they directly address the optimization of cooling strategies, a central challenge in large-scale brewing. The findings demonstrate that suboptimal PID tuning or extreme environmental conditions can lead to either excessive thermal stratification or localized freezing near the jackets—both detrimental to yeast health and product quality. While prior research has focused on developing advanced control algorithms, they often lack the detailed spatial information needed to understand why a certain strategy succeeds or fails. Our model bridges this gap by providing a visual and quantitative basis for evaluating control strategies. For instance, the simulation clearly shows how a larger ∆T (fuzziness) can mitigate temperature overshoot at the cost of slower cooling, allowing operators to make more informed, data-driven decisions. This aligns with the broader goal in process engineering to move beyond empirical adjustments and towards model-based optimization, positioning this simulation tool as a valuable asset for virtual prototyping and process improvement.
Furthermore, the validated model exhibits significant generalizability, making it a versatile tool for broader applications in brewing process design and optimization. The model’s adaptability stems from its foundation in first-principle physics and its parametric design:
  • Applicability to diverse fermenter geometries: The model is governed by the fundamental Navier–Stokes and energy equations, which are scale-independent. Its application to fermenters of different sizes or geometries (e.g., varying cone angles or height-to-diameter ratios) is straightforward, requiring only an updated computational mesh to reflect the new physical domain. The locations and specifications of cooling jackets can be readily modified as boundary conditions, enabling virtual prototyping to optimize tank design for improved thermal homogeneity.
  • Flexibility for alternative control strategies: The simulation of the PID temperature control, via the Boltzmann distribution function, is inherently modular. As demonstrated in our comparative analysis (Figure 15 and Figure 16), key control parameters such as the setpoint temperature ( T c ) and the control fuzziness (∆T) can be easily adjusted. This allows operators to simulate and de-risk alternative control strategies in silico, predicting their impact on internal flow dynamics and identifying optimal settings to prevent issues like temperature overshoot or localized freezing without costly and time-consuming physical trials.
  • Adaptation to various substrate profiles: The fermentation kinetics are modeled based on the consumption of glucose, maltose, and maltotriose. The model can be readily adapted to different wort compositions—such as those used in high-gravity brewing or for different beer styles—by simply adjusting the initial concentrations of these sugars. This allows for the prediction of fermentation performance and thermal load for a wide range of beer recipes, providing a theoretical basis for process adjustments.

5. Conclusions

The study develops a multi-physics coupled simulation model for the beer fermentation process by integrating CFD technology with a fermentation reaction model. This research initiative is specifically aimed at addressing the challenges related to temperature monitoring and control in large-scale beer fermenters, with the overarching goals of enhancing beer quality and improving production efficiency. Through a series of lab-scale and industrial-scale experiments, the key components of the model are rigorously validated, enabling the simulation and in-depth analysis of the beer fermentation process under diverse operating conditions. The primary achievements of this study are summarized as follows:
(1)
Model Establishment and Validation: Both laboratory and industrial experiments have confirmed the reliability of the heat generation equation within the fermentation reaction model. Based on the PID algorithm commonly used for temperature control in actual production, a dynamic function is incorporated to simulate the boundary conditions of cooling jackets. This approach successfully results in the development of a coupled simulation model that is well-suited for industrial-scale fermenter operations.
(2)
Revelation of Fermentation Process Dynamic Characteristics: The results of lab-scale experiments show that during the uncontrolled fermentation stages, parameters such as temperature, alcohol concentration, sugar content, and yeast concentration exhibit distinct temporal evolution patterns. Notably, the increase in temperature follows an approximately quadratic function curve, which indicates that the rate of fermentation reactions progresses in a relatively linear manner over time. Moreover, the findings from industrial-scale simulations demonstrate a high degree of consistency between the average temperature changes observed during the primary fermentation process and the corresponding experimental records. It is also observed that variations in the parameters of the control algorithm have a significant impact on both the temperature distribution and flow patterns within the fermenter. Larger temperature discrepancies lead to more pronounced convective effects and complex temperature profiles. A central finding is that this behavior is governed by a fundamental symmetry-breaking mechanism, where asymmetric cooling disrupts the thermal uniformity of the geometrically symmetric fermenter.
(3)
Demonstration of the Advantages of Coupled Simulation: In contrast to traditional experimental methods, which typically only provide time-variant changes in variables, the proposed simulation approach is capable of offering detailed spatial distribution information for various parameters within the fermenter. This includes the temperature distribution and the flow path lines of wort at different fermentation stages. Such comprehensive data serves as an invaluable basis for optimizing fermenter design, configuring cooling systems, and formulating control strategies, thereby enhancing the stability of the beer fermentation process and improving overall product quality.
In summary, by elucidating the mechanisms of thermal symmetry-breaking and its impact on large-scale convection, the multi-physics coupled simulation model developed in this study provides a critical tool for understanding and controlling the ‘black box’ of industrial fermentation. It serves as a powerful foundational tool intended to support future optimization and design studies, such as optimizing cooling jacket zoning, temperature control trajectories, and sensor placement. Its importance in advancing technological progress in the beer fermentation industry cannot be overstated.
However, the current model has certain limitations. The most significant of these is the omission of the effects of carbon dioxide (CO2) evolution during fermentation. The buoyancy-driven flow induced by rising CO2 bubbles could significantly impact local fluid velocities and turbulence intensity, thereby altering heat and mass transfer efficiencies. Additionally, the model incorporates other simplifications, such as the Boussinesq approximation for density variations, a simplified free-surface treatment, and uncertainties in kinetic parameters. In future work, we will prioritize addressing the impact of CO2 evolution by introducing more advanced multiphase flow models (e.g., the Volume of Fluid method or an Euler–Lagrange approach) to capture the gas–liquid dynamics more accurately.
Future research will focus on integrating these more advanced numerical techniques to effectively handle the increasingly complex scenarios encountered in industrial production. For instance, Large Eddy Simulation (LES) could be employed to resolve buoyancy-driven turbulence with higher fidelity, or Bayesian calibration methods could be used to quantify and reduce the uncertainty in kinetic parameters. The application of these methods will help address practical challenges such as non-isothermal wort charging, dynamic variations in coolant supply temperatures, and the differing fermentation characteristics of various yeast strains.

Author Contributions

Conceptualization, W.L.; methodology, L.L.; software, H.Y.; validation, Z.O.; formal analysis, L.L. and J.Z.; investigation, J.S.; resources, Z.O.; data curation, H.Y. and J.S.; writing—original draft preparation, W.L.; writing—review and editing, W.L.; visualization, Z.O.; supervision, J.Z.; project administration, J.S.; funding acquisition, Z.O. All authors have read and agreed to the published version of the manuscript.

Funding

This research was funded by the China Resources Breweries Co., Ltd., grant number HX2024000093.

Data Availability Statement

The original contributions presented in this study are included in the article. Further inquiries can be directed to the corresponding author Zhenyu Ouyang.

Conflicts of Interest

Authors Jie Sun, Leiming Lou and Junhui Zhong were employed by the China Resources Snow Breweries. The authors declare that this study received funding from the China Resources Snow Breweries Co. (HX2024000093). The funder had the following involvement with the study: collection and interpretation of data.

References

  1. Ruarte, P.; Pantano, N.; Noriega, M.; Fernández, C.; Serrano, E.; Scaglia, G. Optimization of Time-Varying Temperature Profiles for Enhanced Beer Fermentation by Evolutive Algorithms. Fermentation 2024, 11, 2. [Google Scholar] [CrossRef]
  2. Shopska, V.; Dzhivoderova-Zarcheva, M.; Kostov, G. Continuous Primary Beer Fermentation with Yeast Immobilized in Alginate–Chitosan Microcapsules with a Liquid Core. Beverages 2024, 10, 87. [Google Scholar] [CrossRef]
  3. Puligundla, P.; Smogrovicova, D.; Mok, C.; Obulam, V.S.R. Recent Developments in High Gravity Beer-Brewing. Innov. Food Sci. Emerg. 2020, 64, 102399. [Google Scholar] [CrossRef]
  4. Guan, Y.; Xu, X.; Liu, C.; Wang, J.; Niu, C.; Zheng, F.; Li, Q. Evaluating the Physiology and Fermentation Performance of the Lager Yeast during Very High Gravity Brewing with Increased Temperature. Lwt-Food Sci. Technol. 2023, 173, 114312. [Google Scholar] [CrossRef]
  5. Wei, C. Case Study on the Design of Large Cylindrical-Conical Fermenters for Beer. Chin. Foreign Food Ind. 2023, 15, 123–128. (In Chinese) [Google Scholar]
  6. Huang, L.; Wu, Y.; Zhou, C.; Wang, C.; Wang, Z. Research on the Temperature Distribution in the Cone-Shape Tank of Fermentable Liquid. Glob. Alcinfo 2000, 11, 31–35. (In Chinese) [Google Scholar]
  7. Song, F.; Meng, X.; Chen, Z. Temperature Monitoring System of Beer Fermentation and Brewing Based on Immune Fuzzy PID Controller. Adv. Control Appl. 2024, 6, e154. [Google Scholar] [CrossRef]
  8. Li, H. Temperature Control of Beer Fermentation Based on Variable Domain Fuzzy PID and Neural Network Technology and Its Application Analysis. Adv. Control Appl. 2024, 6, e203. [Google Scholar] [CrossRef]
  9. Moya-Almeida, V.; Diezma-Iglesias, B.; Correa-Hernando, E.; Vaquero-Miguel, C.; Alvarado-Arias, N. Setpoint Temperature Estimation to Achieve Target Solvent Concentrations in S. Cerevisiae Fermentations Using Inverse Neural Networks and Fuzzy Logic. Eng. Appl. Artif. Intell. 2024, 127, 107248. [Google Scholar] [CrossRef]
  10. Zhang, Z.; Zhou, Q. The Study of Multivariate Fuzzy Neural Scheme in Controlling Temperature during Beer Fermentation. J. Phys. Conf. Ser. 2021, 1732, 012140. [Google Scholar] [CrossRef]
  11. Nanxuan, Q.; Tielin, M.; Xiangsheng, W.; Jie, W.; Jingcheng, F.; Pu, X. An Approach for Formation Design and Flight Performance Prediction Based on Aerodynamic Formation Unit: Energy-Saving Considerations. Chin. J. Aeronaut. 2024, 37, 77–91. [Google Scholar] [CrossRef]
  12. Wu, X.; Zuo, Z.; Ma, L.; Zhang, W. Multi-Fidelity Neural Network-Based Aerodynamic Optimization Framework for Propeller Design in Electric Aircraft. Aerosp. Sci. Technol. 2024, 146, 108963. [Google Scholar] [CrossRef]
  13. Hasan, M.; Redonnet, S.; Zhongmin, D. Aerodynamic Optimization of Aircraft Wings Using Machine Learning. Adv. Eng. Softw. 2025, 200, 103801. [Google Scholar] [CrossRef]
  14. Yoo, S.; Oh, S. Flow Analysis and Optimization of a Vertical Axis Wind Turbine Blade with a Dimple. Eng. Appl. Comput. Fluid Mech. 2021, 15, 1666–1681. [Google Scholar] [CrossRef]
  15. Farajyar, S.; Ghafoorian, F.; Mehrpooya, M.; Asadbeigi, M. CFD Investigation and Optimization on the Aerodynamic Performance of a Savonius Vertical Axis Wind Turbine and Its Installation in a Hybrid Power Supply System: A Case Study in Iran. Sustainability 2023, 15, 5318. [Google Scholar] [CrossRef]
  16. Rasekh, S.; Aliabadi, S.K. Toward Improving the Performance of a Variable Pitch Vertical Axis Wind Turbine (VP-VAWT), Part 2: Multi-Objective Optimization Using NSGA-II with CFD in the Loop. Ocean Eng. 2023, 278, 114308. [Google Scholar] [CrossRef]
  17. Dirkes, N.; Key, F.; Behr, M. Eulerian Formulation of the Tensor-Based Morphology Equations for Strain-Based Blood Damage Modeling. Comput. Methods Appl. Mech. Eng. 2024, 426, 116979. [Google Scholar] [CrossRef]
  18. Song, M.; Wang, S.; Qian, Q.; Zhou, Y.; Luo, Y.; Gong, X. Intracranial Aneurysm CTA Images and 3D Models Dataset with Clinical Morphological and Hemodynamic Data. Sci. Data 2024, 11, 1213. [Google Scholar] [CrossRef]
  19. Hussain, A.; Dar, M.N.R.; Kanwal, R.; Cheema, W.K.; Sarwar, L. Unraveling the Hemodynamic Impact: Computational Insights into Blood Flow and Heat Transport Dynamics in Triangle-Shaped Stenotic Aneurysmal Arteries. Int. Commun. Heat Mass Transf. 2024, 155, 107520. [Google Scholar] [CrossRef]
  20. Fujimura, S.; Tanaka, K.; Takao, H.; Okudaira, T.; Koseki, H.; Hasebe, A.; Suzuki, T.; Uchiyama, Y.; Ishibashi, T.; Otani, K.; et al. Computational Fluid Dynamic Analysis of the Initiation of Cerebral Aneurysms. J. Neurosurg. 2021, 137, 335–343. [Google Scholar] [CrossRef]
  21. Weerasuriya, A.; Longo, R.; Zhang, X.; Cotteleer, L.; Parente, A. Comprehensive Evaluation of Constant and Variable Turbulent Schmidt Numbers for CFD Simulation of Near-Field Air Pollutant Dispersion. Build. Environ. 2025, 270, 112493. [Google Scholar] [CrossRef]
  22. He, J.; Kang, Y.; Wang, Y.; Gu, Y.; Zhong, K. Effects of Sea-Land Breeze on Air Pollutant Dispersion in Street Networks with Different Distances from Coast Using WRF-CFD Coupling Method. Sustain. Cities Soc. 2024, 115, 105757. [Google Scholar] [CrossRef]
  23. Liu, W.; Huang, Z.; Cui, D.; Ma, D.; Mei, S.; Guo, R. Impact of Street Interface Permeability on Ventilation and Pollutants Dispersion in Urban Street Spaces. Build. Environ. 2025, 274, 112779. [Google Scholar] [CrossRef]
  24. Soon, G.; Chan, W.P.; Lisak, G.; Law, A.W.K. Assessment Framework for Gaseous Pollutant Emissions from Decentralized Pyrolysis Units in Urban Canopies: Case Study in Singapore. Sustain. Cities Soc. 2025, 122, 106231. [Google Scholar] [CrossRef]
  25. Wang, J.; Xue, Q.; Guo, T.; Mei, Z.; Long, E.; Wen, Q.; Huang, W.; Luo, T.; Huang, R. A Review on CFD Simulating Method for Biogas Fermentation Material Fluid. Renew. Sustain. Energy Rev. 2018, 97, 64–73. [Google Scholar] [CrossRef]
  26. Ding, J.; Wang, X.; Zhou, X.F.; Ren, N.Q.; Guo, W.Q. CFD Optimization of Continuous Stirred-Tank (CSTR) Reactor for Biohydrogen Production. Bioresour. Technol. 2010, 101, 7005–7013. [Google Scholar] [CrossRef]
  27. Ri, P.C.; Ren, N.Q.; Ding, J.; Kim, J.S.; Guo, W.Q. CFD Optimization of Horizontal Continuous Stirred-Tank (HCSTR) Reactor for Bio-Hydrogen Production. Int. J. Hydrogen Energy 2017, 42, 9630–9640. [Google Scholar] [CrossRef]
  28. Spann, R.; Glibstrup, J.; Pellicer--Alborch, K.; Junne, S.; Neubauer, P.; Roca, C.; Kold, D.; Lantz, A.E.; Sin, G.; Gernaey, K.V.; et al. CFD Predicted pH Gradients in Lactic Acid Bacteria Cultivations. Biotechnol. Bioeng. 2019, 116, 769–780. [Google Scholar] [CrossRef] [PubMed]
  29. Novak, M.; Trontel, A.; Slavica, A.; Horvat, P.; Šantek, B. Computational Fluid Dynamic (CFD) Modeling of Simultaneous Extraction and Fermentation Process in a Single Sugar Beet Cossette. EuroBiotech J. 2017, 1, 18–26. [Google Scholar] [CrossRef]
  30. Haringa, C.; Deshmukh, A.T.; Mudde, R.F.; Noorman, H.J. Euler-Lagrange Analysis towards Representative down-Scaling of a 22 M3 Aerobic S. Cerevisiae Fermentation. Chem. Eng. Sci. 2017, 170, 653–669. [Google Scholar] [CrossRef]
  31. Zenteno, M.I.; Pérez-Correa, J.R.; Gelmi, C.A.; Agosin, E. Modeling Temperature Gradients in Wine Fermentation Tanks. J. Food Eng. 2010, 99, 40–48. [Google Scholar] [CrossRef]
  32. Miller, K.V.; Oberholster, A.; Block, D.E. Creation and Validation of a Reactor Engineering Model for Multiphase Red Wine Fermentations. Biotechnol. Bioeng. 2019, 116, 781–792. [Google Scholar] [CrossRef]
  33. Incropera, F.P.; DeWitt, D.P.; Bergman, T.L.; Lavine, A.S. Fundamentals of Heat and Mass Transfer, 8th ed.; John Wiley & Sons: Hoboken, NJ, USA, 2017. [Google Scholar]
  34. Mhaskar, P.; Hjortsø, M.A.; Henson, M.A. Cell Population Modeling and Parameter Estimation for Continuous Cultures of Saccharomyces Cerevisiae. Biotechnol. Prog. 2002, 18, 1010–1026. [Google Scholar] [CrossRef] [PubMed]
  35. Gee, D.A.; Ramirez, W.F. A Flavour Model for Beer Fermentation. J. Inst. Brew. 1994, 100, 321–329. [Google Scholar] [CrossRef]
  36. Johnson, K.A.; Goody, R.S. The Original Michaelis Constant: Translation of the 1913 Michaelis–Menten Paper. Biochemistry 2011, 50, 8264–8269. [Google Scholar] [CrossRef]
  37. Waldherr, S. Estimation Methods for Heterogeneous Cell Population Models in Systems Biology. J. R. Soc. Interface 2018, 15, 20180530. [Google Scholar] [CrossRef] [PubMed]
  38. Zhu, G.Y.; Zamamiri, A.; Henson, M.A.; Hjortsø, M.A. Model Predictive Control of Continuous Yeast Bioreactors Using Cell Population Balance Models. Chem. Eng. Sci. 2000, 55, 6155–6167. [Google Scholar] [CrossRef]
  39. Bird, R.B.; Stewart, W.E.; Lightfoot, E.N. Transport Phenomena, Revised, 2nd ed.; John Wiley & Sons: Hoboken, NJ, USA, 2007. [Google Scholar]
Disclaimer/Publisher’s Note: The statements, opinions and data contained in all publications are solely those of the individual author(s) and contributor(s) and not of MDPI and/or the editor(s). MDPI and/or the editor(s) disclaim responsibility for any injury to people or property resulting from any ideas, methods, instructions or products referred to in the content.

Article Metrics

Citations

Article Access Statistics

Multiple requests from the same IP address are counted as one view.