Abstract
This paper examines the dynamic characteristics and seismic responses of suspen-dome structures, incorporating the influence of substructures, using the Lanzhou Olympic Sports Center Comprehensive Gymnasium with a symmetric suspen-dome roof as a case study. A scaled test model with a 1:20 ratio was developed, and a novel approach to simplifying the complex substructures of the prototype structure within the scaled model was proposed. The accuracy of this method was validated. Subsequently, both an overall numerical model and a simplified numerical model (excluding substructures) were constructed. Their natural frequencies and seismic responses were compared. Additionally, the impact of substructure stiffness on dynamic characteristics and seismic responses investigated. The findings reveal that substructures decrease the natural frequencies of the suspen-dome structure while amplifying its seismic responses. The maximum relative error of the natural frequencies between the overall model and the simplified numerical model is as high as 25.9%; and the maximum relative difference in acceleration, displacement and strain between the two models can reach 0.71 g, 1.27 mm and 181.6 με, respectively. Thus, the inclusion of substructure effects is critical in the seismic analysis of suspen-dome structures. Moreover, as substructure stiffness decreases, the natural frequencies of the suspen-dome structure are reduced, and the vibration mode shifts from superstructure deformation to cooperative deformation involving both the superstructure and substructure. Finally, variations in substructure stiffness influence the constraints on the superstructure or the fundamental frequency of the overall structure, and consequently, the seismic responses of the suspen-dome structure. Thus, when performing seismic analyses, it is essential to design appropriate substructure stiffness and consider the specific characteristics of the building site.
1. Introduction
The suspen-dome structure is a prestressed long-span spatial structure, typically composed of an upper symmetric single-layer reticulated shell and a lower prestressed cable-strut system [1], as illustrated in Figure 1a. Compared to the single-layer reticulated shell, the addition of the lower cable-strut system significantly enhances the stiffness of the suspen-dome structure. This improvement enables its application in larger-span buildings [2].
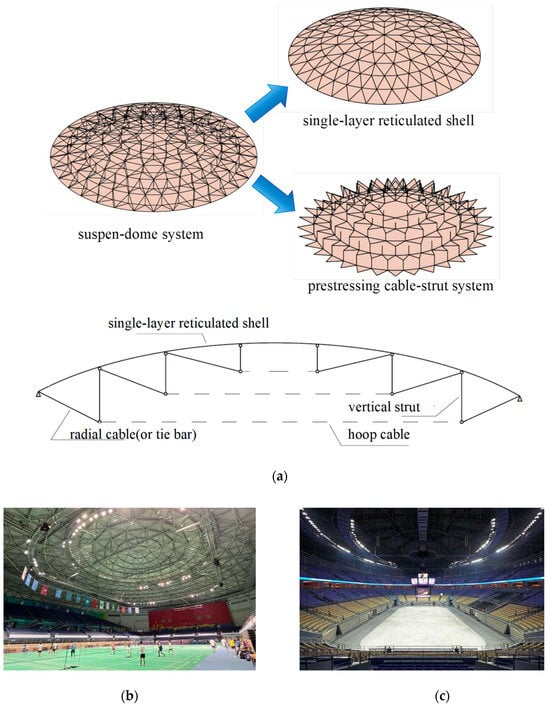
Figure 1.
Suspen-dome structure: (a) structural composition of suspen-dome; (b) the Badminton Gymnasium for the 2008 Olympic Games; (c) the Dalian Gymnasium.
The Hikarigaoka Dome, constructed in Japan in 1994 with a span of 30 m, is recognized as the world’s first suspen-dome structure [3]. Since its inception, the use of suspen-dome structures has proliferated globally, particularly in East Asia [4,5,6,7]. In China, the first suspen-dome structure, spanning 93 m, was built for the Badminton Gymnasium at the 2008 Olympic Games [8], as shown in Figure 1b. Currently, the largest suspen-dome in Asia is the Dalian Gymnasium, spanning 145.5 m [9], as shown in Figure 1c.
Because suspen-dome structures are frequently employed in major public buildings—such as gymnasiums, exhibition halls, and convention centers—their dynamic characteristics and seismic response are critical to ensuring structural safety during earthquakes.
To comprehensively investigate the seismic performance of suspen-dome structures, in addition to theoretical analyses and numerical simulations, dynamic scale model experiments have alaso become a vital research method. Kawaguchi and colleagues [10] conducted a series of experimental studies on the Hikarigaoka Dome and the Gathering Dome, demonstrating the superior dynamic property of suspen-dome structures. Similarly, Wang et al. [11] performed white noise excitation and earthquake simulation tests on a dynamic scale model based on the suspen-dome structure of the 2008 Olympic Badminton Gymnasium, revealing that the structure exhibited dense natural frequencies and excellent seismic performance. Tatemichi et al. [12] analyzed the dynamic characteristics and testing accuracy of a suspen-dome structure through vibration testing. Wu et al. [13] further investigated the seismic behavior of a suspen-dome structure using a scale model tested on eight sub-shaking tables, employing an improved plant growth simulation algorithm to enhance the analysis.
Previous studies on suspen-dome structures, whether theoretical or experimental, have primarily focused on the upper suspen-dome roof structure, largely neglecting the influence of substructures. In reality, most long-span spatial structures are constructed on concrete or steel substructures, which often amplify the input seismic load [14]. In many cases, the vibrations of the substructure can induce significant seismic forces on the upper roof structure, and these forces vary depending on the substructure’s stiffness [15].
Recognizing this, some researchers have investigated the dynamic characteristics and seismic response of various types of long-span roof structures incorporating substructures. For instance, Yu et al. [16] analyzed the dynamic characteristics and failure mechanisms of single-layer reticulated domes under the influence of substructures, demonstrating that the substructure significantly affects seismic performance and that structural failure modes under severe earthquakes are influenced by substructure stiffness. Fan et al. [17] examined the impact of substructures on the seismic response of grid structures and proposed a simplified method for modeling substructures. Similarly, Nie et al. [18] investigated the influence of substructures on the seismic performance of cylindrical reticulated shell structures, revealing that substructures reduce structural stiffness and amplify seismic responses.
Despite these advancements, the previous research subjects were all reticulated shell structures, there is currently no research addressing the seismic performance of suspen-dome structures while accounting for substructure influence.
To address this, the present study adopts the suspen-dome structure of the Lanzhou Olympic Sports Center as a prototype and carries out a comprehensive investigation into its natural vibration characteristics and seismic response, considering the influence of substructures. Initially, a method for incorporating and simplifying the complex concrete substructure of the suspen-dome prototype into a dynamic scale model was proposed, resulting in the development of an overall model with a similarity ratio of 1:20. The dynamic characteristics of the scale model were assessed through a white noise excitation test, and the results were compared to those of the prototype structure.
Subsequently, an earthquake simulation test was performed on the scale model. To complement the experimental study, an overall numerical model corresponding to the test model, along with a simplified model using three-directional hinge supports as boundary conditions, was developed using ABAQUS software. The natural frequencies and seismic responses of the overall numerical, simplified numerical, and test models were compared.
Finally, three overall numerical models with varying levels of substructure stiffness were established. The dynamic characteristics and seismic responses—including acceleration, displacement, and internal force—of these models were analyzed and compared.
The findings of this study offer practical guidance for the seismic analysis of suspen-dome structures with substructures in real-world engineering applications.
2. Shaking Table Test Scale Model
2.1. Project Overview
The Gymnasium of the Lanzhou Olympic Sports Center is situated in Lanzhou, China, as illustrated in Figure 2a. The gymnasium features a suspen-dome roof spanning 94 m with a structural height of 8 m. This structure comprises a ribbed single-layer lattice shell and a Levy-type cable-strut system, as depicted in Figure 2b,c. The reticulated shell is composed of 528 bars and 253 nodes (Q355B steel), and the cable-strut system includes 5 hoop cables, 90 vertical struts and 186 steel tie bars. The materials and cross-sectional properties of all structural components are detailed in Table 1.
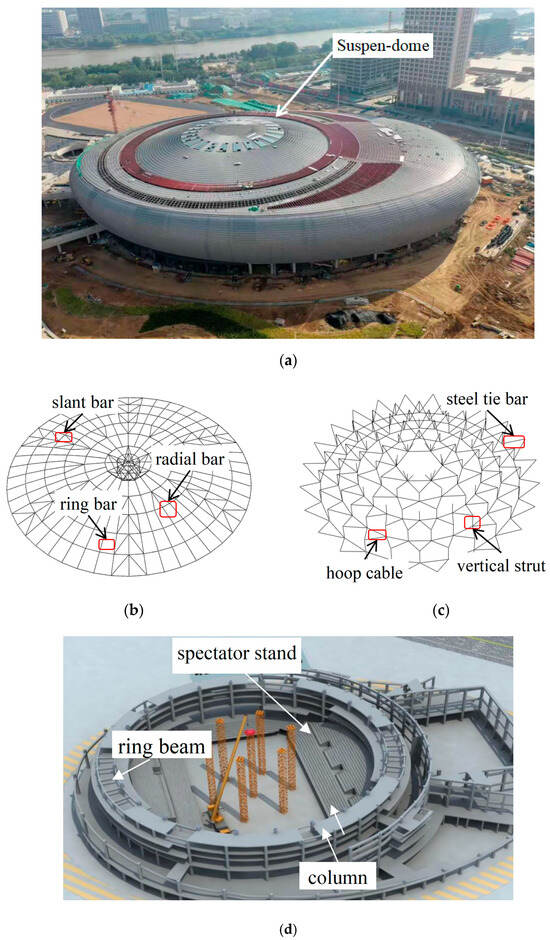
Figure 2.
The suspen-dome of the Lanzhou Olympic Sports Center: (a) aerial view of the gymnasium; (b) reticulated shell; (c) cable-strut system; (d) substructure.

Table 1.
Member information.
The structure is located in a region with a seismic fortification intensity of 8 (0.2 g design PGA), on a Site Class II with the third earthquake group. Its complex-shaped substructure, shown in Figure 2d, supports the main arena and primarily consists of ring beams, columns, and spectator stands.
2.2. Test Model
2.2.1. The Substructure
The shaking table test was conducted on a 5 m × 5 m platform at the Huixian Earthquake Engineering Comprehensive Laboratory, using a 1:20 scale model. The substructure of the prototype is a complex concrete structure, as depicted in Figure 2d, which presents challenges for direct fabrication at the specified scale. To address this, a method was proposed to simplify the complex substructure of the prototype using a steel column–ring beam substructure in the scaled test model. This approach aimed to ensure that the fundamental frequency of the test model matches that of the prototype structure when accounting for the scale ratio. The fundamental frequency is a critical parameter in evaluating a structure’s dynamic characteristics, as it is closely linked to the susceptibility of the structure to resonance-induced damage under dynamic loads of specific frequencies. The accuracy of this replacement method is demonstrated later in the text.
Based on the structure’s arch rise, test conditions, and the practicality of instrument installation, the height of the columns in the test model was finalized at 0.98 m. The columns and diagonal braces were constructed using round steel pipes with an outer diameter of 48 mm and a wall thickness of 2.8 mm. The ring beams were fabricated from box-shaped steel sections with dimensions of 50 mm × 50 mm × 2 mm × 2 mm (where 50 mm is the side length and 2 mm is the wall thickness). The column bases were welded to high-stiffness steel foundation beams, which were secured to the shaking table using M20 bolts. The substructure of the test model is illustrated in Figure 3.
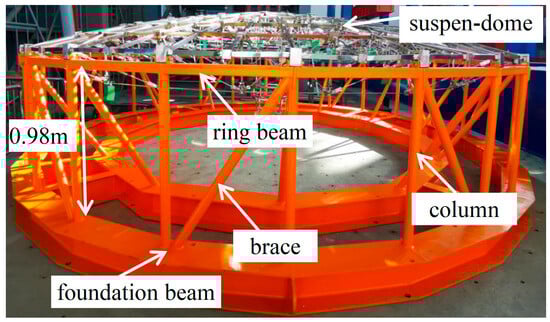
Figure 3.
The substructure of the test model.
2.2.2. The Superstructure
Austenitic 304 stainless steel was selected as a substitute for Q355B steel for the reticulated shell members to address the challenges posed by the small, thin, and difficult-to-fabricate cross-sections of the ideal scale model members. The key mechanical properties of Austenitic 304 stainless steel and Q355B steel were evaluated experimentally using monotonic tensile tests, and the results are summarized in Table 2. Based on the yield strength fy ratio of the two materials, the stress similarity ratio for the model was determined to be 1:1.5. By combining the size similarity ratio with the stress similarity ratio, the acceleration similarity ratio was established as 1:1. These three similarity ratios were utilized as the primary controllable similarity constants. The frequency similarity ratio () is derived from geometric scaling (SL = 1:20) and acceleration similarity (Sa = 1:1) using dimensional analysis:
Table 2.
Tensile mechanical properties of the steel materials.
The remaining similarity constants for other physical quantities were derived using dimensional analysis [19], as detailed in Table 3.
Table 3.
Scaling factors for the physical parameters.
Figure 4a illustrates the member types and nodal details of the test model. The dead load and live load of the roof were set at 0.8 kN/m2 and 0.33 kN/m2, respectively. These loads were simulated by attaching mass blocks to the model nodes and member midpoints (Figure 4b). Figure 4c shows the assembled test model.
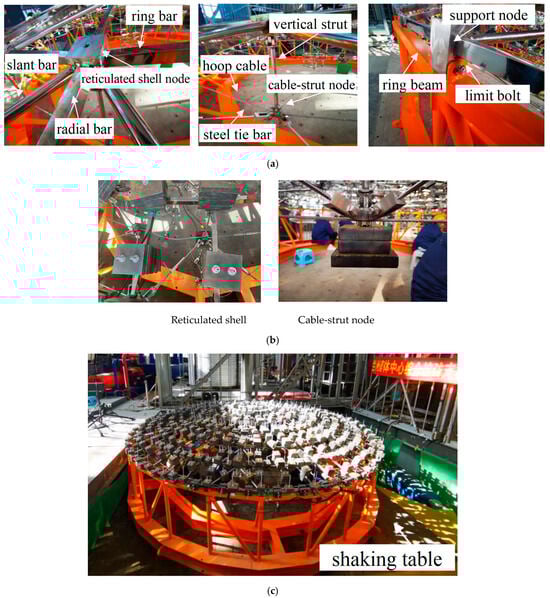
Figure 4.
The test model: (a) members and nodes; (b) application of mass blocks; (c) assembled test model.
2.2.3. Layout of Measuring Points
Considering the model’s symmetry and site constraints, measuring points were strategically instrumented on the model to facilitate the installation of acquisition instruments, as drawn in Figure 5. The measuring points were assigned to the following codes: A (acceleration), D (displacement), C (ring bar strain), R (radial bar strain), and HS (hoop cable strain). The first digit following each letter corresponds to the radial number of the measuring point, while the second digit indicates the ring number. The measuring points employ 48 radial numbers and ring numbers from 1 (innermost) to 7 (outermost), as illustrated in Figure 5a. Additionally, acceleration and displacement measuring points were positioned at the bottom of the columns.
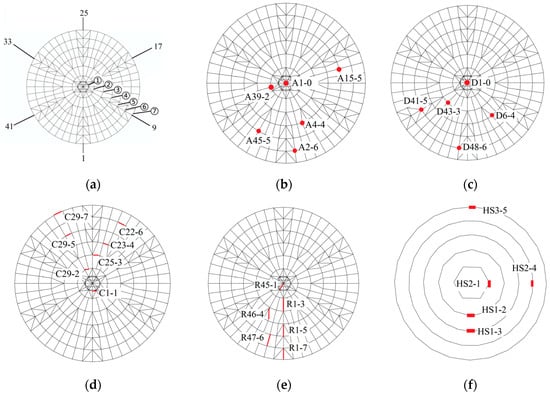
Figure 5.
Measuring points: (a) radial numbers and ring numbers; (b) acceleration; (c) displacement; (d) ring bar; (e) radial bar; (f) hoop cable.
Figure 6 presents the test instruments used in the experiment. The range of the acceleration sensors is from −16 g to 16 g, while the range of the pull-wire displacement sensors spans from 250 mm to 1000 mm. The resistance value and sensitivity coefficient of the strain gauges are 120.3 ± 0.1 Ω and 2.22 ± 1%, respectively.
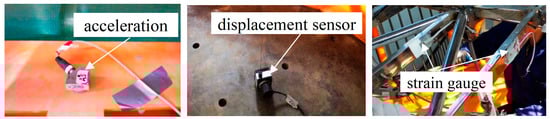
Figure 6.
Acquisition instruments.
3. Verification of the Method for Simplifying Complex Substructures of the Suspen-Dome Prototype in the Dynamic Scale Model
3.1. Comparing Natural Frequencies of the Test Model and Prototype Structure
To validate the proposed substructure simplification method and the accuracy of the test model, a white noise excitation test was conducted on the model (Figure 4c). The natural frequencies were then identified through spectral analysis of the acquired acceleration data. Due to the complex geometry and numerous components of the prototype structure’s substructure, Midas/Gen 2024 software was adopted to establish the finite element model of the prototype structure and carry out modal analysis on the model. Figure 7 compares the first ten natural frequencies of the test model with their counterparts from the scaled prototype structure (after applying the scale ratio). It can be seen that the natural frequencies of the test model, after scaling, show close agreement with those of the prototype structure; the relative errors for all modal orders are within 6%. Notably, the error for the fundamental frequency is only 1.30%. It is demonstrated that the method of accounting for the concrete substructure of the suspen-dome prototype structure in the test scale model is accurate.
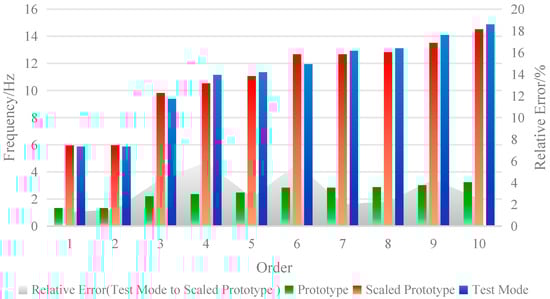
Figure 7.
Natural frequencies: test model vs. scaled prototype.
3.2. Comparing Vibration Modes of the Test Model and Prototype Structure
Following the test model, an overall numerical scale model was created in ABAQUS; the model parameters are given in Section 4.1. The Block Lanczos method was utilized to conduct the modal analysis of the overall numerical model. Figure 8 compares the first two mode shapes of the scale model and the prototype structure. It can be found that the first 2-order vibration modes of the scale model and the prototype structure are both dominated by vertical vibration, and the mode shapes of the two are basically consistent. This further validates the rationality and accuracy of the method used to account for the prototype structure’s concrete substructures in the dynamic scale model.
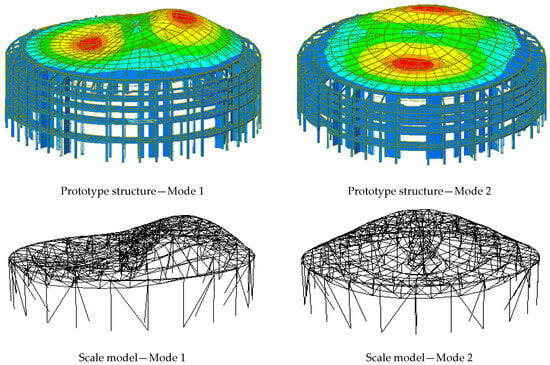
Figure 8.
Mode shape comparison: prototype structure vs. scale model.
4. Influence of Accounting for Substructures on Natural Frequencies and Seismic Responses of Suspen-Dome Structure
4.1. Numerical Model
An overall numerical model (Model 1) representing the test model and a simplified model with three-directional hinge supports as boundary conditions were developed by ABAQUS software, respectively, as shown in Figure 9. In Model 1, the bottom of the column and the foundation were fixedly connected. Except for the boundary conditions, other parameters of the two models are identical. The reticulated shell and substructure members were simulated with B31 beam elements. The element lengths were 136.94–194.45 mm for the reticulated shell, 980 mm for the columns, and 613.47 mm for the ring beams. The cable-strut system was modeled using truss elements, with lengths ranging from 433.42 mm to 516.78 mm for the hoop cables, 416.16 mm to 509.32 mm for the radial tie bars, and 187.5 mm to 325 mm for the vertical struts. The reticulated shell members had fixed connections, while the connections of the cable-strut system members to the shell were modeled as hinges. The preload applied to the hoop cables, from the innermost to the outermost, are 0.56 kN, 0.55 kN, 1.25 kN, 2.19 kN, and 4.73 kN, respectively. In the overall numerical model, the boundary condition at the shell–ring beam interface allowed radial displacement. The roof loads were applied to the nodes of the model as concentrated masses. All members were modeled as ideal elastoplastic materials with parameters identical to those in the test model. Furthermore, the high agreement between the overall numerical model and the test results (see Section 4.2 and Section 4.3 for details) provides validation for the convergence of the numerical model.
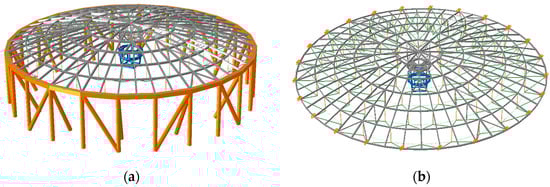
Figure 9.
The overall model and simplified model: (a) the overall numerical model (Model 1); (b) the simplified model.
Rayleigh damping was used to model structural damping. The multiple reference modes based on the computation method were used to calculate the Rayleigh damping coefficient [20]. The Rayleigh damping coefficients α and β can be calculated using Equation (2); this method not only accounts for multiple reference modes but also considers the dynamic characteristics of the structure and expresses the results as Rayleigh damping coefficients, which is convenient for implementation in existing computational software. The Rayleigh damping coefficients of the overall model and simplified model under the action of different seismic records are presented in Table 4.
where is the maximum strain energy ratio of the ith mode; is the benchmark damping ratio, generally 0.02 for steel structures; ωi is the frequency of the ith mode.
Table 4.
Rayleigh damping coefficients.
4.2. Comparison of Natural Frequencies
The Block Lanczos method was adopted to perform modal analysis on the overall numerical model and simplified model, respectively. The first 10-order natural frequencies of the overall numerical model are compared with the test model and the simplified model, respectively, as shown in Table 5. It can be seen that the natural frequencies of the overall numerical model are significantly lower than those of the simplified model; the maximum relative error of the natural frequencies between the two models is as high as 25.9%. In other words, the inclusion of the substructure reduces the overall stiffness of the suspen-dome structure, thereby lowering its natural frequency. As is well-known, natural frequency is an important factor in determining the seismic performance of a structure. Therefore, the substructure should be considered in the dynamic analysis of the suspen-dome structure. On the other hand, according to Table 5, the relative error of the natural frequency between the overall numerical model and the test model is controlled within 3%, which demonstrates the accuracy of the modeling method and the numerical model.
Table 5.
Comparison of natural frequency.
4.3. Comparison of Seismic Responses
The seismic simulation test was carried out on the test scale model shown in Figure 4c. Based on the seismic design foundation and site-specificity in the region where the prototype structure is located, as described in Section 2.1, two seismic records, including the TAFT seismic record and Beijing seismic record, were selected and were applied in the x-direction at the column bases, respectively, and their durations were 21 s and 23.2 s, respectively. The acceleration amplitudes of the two seismic records were set to 0.4 g. Figure 10 presents the acceleration time histories of the input seismic records and those measured on the shaking table, respectively. Meanwhile, the seismic time-history analysis of the overall numerical model and simplified model was also carried out by ABAQUS 2024 software. The acceleration time history recorded from the shaking table was applied as the seismic excitation. Due to space limitations, the acceleration, displacement and strain responses of a single measuring point of the overall numerical model are selected to compare between the test model and the simplified model, as shown in Table 6. Figure 11a–c are the seismic response time-history curves of the three models when the TAFT seismic records are input. All displacements refer to the relative motion between the measuring points and the column base.
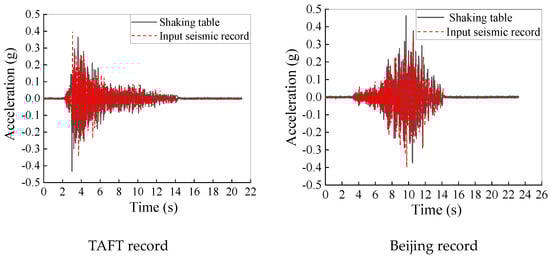
Figure 10.
Acceleration–time-history curves of seismic records.
Table 6.
Comparison of seismic response peaks.
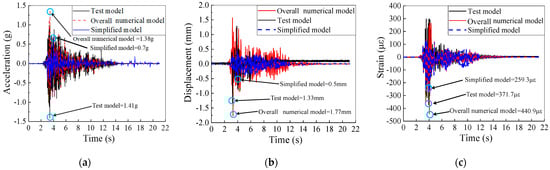
Figure 11.
Comparison of seismic responses: (a) acceleration–time-history curve of measuring point A1-0; (b) displacement–time-history curve of measuring point D41-5; (c) strain–time-history curve of measuring point C29-5.
It can be found that the seismic responses of the overall model are visibly higher than those of the simplified model. Under the action of the TAFT seismic record, the difference in the peak values of the three responses between the two models reaches 0.68 g, 1.27 mm, and 181.6με, respectively; under the excitation of the Beijing seismic record, the differences in the peak values of the three types of responses between the two models are 0.71 g, 0.9 mm, and 104.97 με, respectively. This indicates that substructures can significantly amplify the seismic response of the suspen-dome structure. Ignoring the substructure in seismic analysis leads to an underestimation of the actual seismic response and an overestimation of the structural seismic performance, thereby threatening its structural safety during earthquakes. Therefore, the substructure should be considered in the seismic analysis of the suspen-dome structure. In addition, the seismic responses from the overall numerical model agree well with the test results, which corroborates the fidelity of the modeling approach.
5. Dynamic Characteristics and Seismic Responses of Suspen-Dome Structures with Varying Substructure Stiffness
To further investigate the dynamic characteristics and seismic response of suspen-dome structures with substructures, three overall numerical models with varying substructure stiffness levels were established by ABAQUS software. Model 1 was taken as the model with a strong stiffness substructure. Meanwhile, Model 2 with a medium stiffness substructure and Model 3 with a weak stiffness substructure were established by reducing the diagonal braces in Model 1, as shown in Figure 12. The substructure lateral stiffness of the three models is 159.1 kN/mm, 69.9 kN/mm and 23.7 kN/mm, respectively.
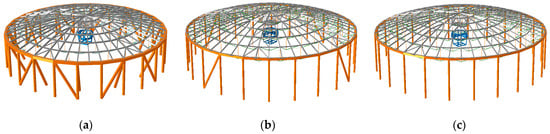
Figure 12.
Models with varying substructure stiffness: (a) overall model with strong stiffness substructure (Model 1); (b) overall model with medium stiffness substructure (Model 2); (c) overall model with weak stiffness substructure (Model 3).
5.1. Dynamic Characteristics
Modal analysis was performed on the three overall models, and their first 50-order natural frequencies are compared in Figure 13. It can be observed that with the reduction in the substructure stiffness, the natural frequencies of the suspen-dome structure decrease significantly; the fundamental frequencies of Model 1, Model 2, and Model 3 are 5.75 Hz, 5.11 Hz, and 3.42 Hz, respectively. That is to say, the reduction in the substructure stiffness will reduce the stiffness of the overall suspen-dome structure, thereby reducing the natural frequency of the structure.
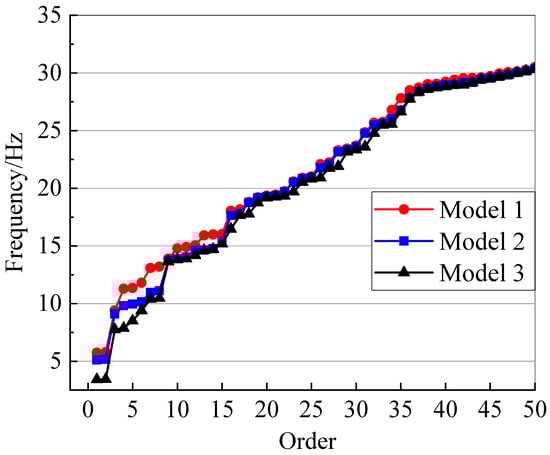
Figure 13.
Comparison of natural frequencies.
Figure 14 compares the first 5-order vibration modes of the three models. It can be found that all vibration modes of Model 1 involve deformation primarily in the superstructure, while the fourth- and fifth-order vibration modes of Model 2 and the first 4-order vibration modes of Model 3 are all the coupled deformations of the superstructure and the substructure. In other words, as the substructure stiffness decreases, the vibration mode of the overall structure changes from the deformation of the superstructure to the coupled deformation of the superstructure and the substructure. The above results declare that the substructure stiffness has a significant impact on the natural vibration characteristics of the suspen-dome structure.
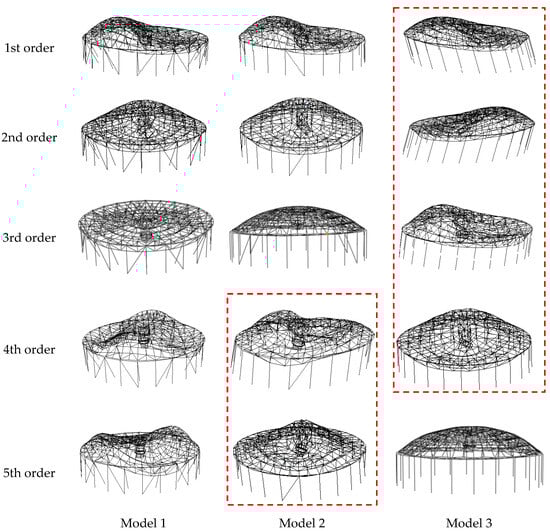
Figure 14.
Comparison of vibration modes.
5.2. Seismic Responses
The seismic time-history analysis was carried out on Model 1, Model 2, and Model 3, respectively, and one measuring point was selected from each ring of the superstructure. The acceleration data of the seismic record collected from the shaking table was used as the severe seismic load. Meanwhile, in order to consider the influence of seismic intensity on structural seismic response, according to relevant regulations, the peak acceleration values collected from the vibration table were reduced by 2 times and 5.7 times, respectively, and used as medium and minor seismic loads.
5.2.1. Acceleration Response
The peak acceleration responses in the x-direction of the three models are drawn in Figure 15a,b; Figure 16 shows the acceleration time-history curves of measuring point A4-4 under the severe seismic load. It can be seen that the acceleration responses of the three models under various intensities of seismic loads differ significantly. Model 2 exhibits the highest acceleration response, followed by Model 1, and the acceleration response of Model 3 is the weakest; taking the peak acceleration of measuring point A4-4 as an example, under the excitation of the severe TAFT seismic record, the peak accelerations of A4-4 in Model 1, Model 2 and Model 3 are 1.15 g, 1.4 g, and 0.51 g, respectively; under the action of the severe Beijing seismic record, the peak accelerations of A4-4 in the three models are 1.11 g, 1.38 g, and 0.9 g, respectively. Moreover, Figure 15 also reveals that the acceleration response of each measuring point in Model 3 is relatively consistent, indicating that the superstructure of Model 3 tends to vibrate as a rigid body; however, there is an obvious difference in the peak acceleration of each measuring point in Model 1 and Model 2.
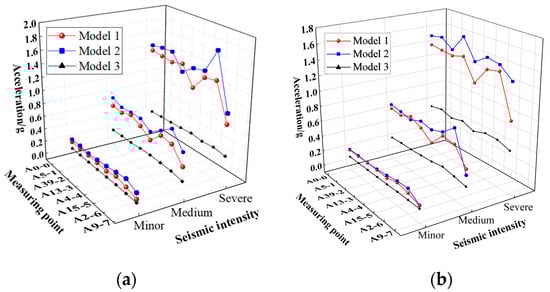
Figure 15.
Comparison of peak acceleration: (a) TAFT record; (b) Beijing record.
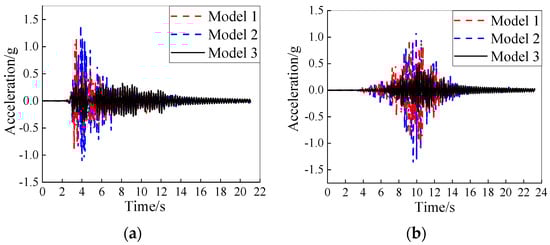
Figure 16.
Acceleration–time-history curve of measuring point A4-4: (a) TAFT record; (b) Beijing record.
Table 7 compares the maximum peak accelerations and the acceleration amplification coefficients of the three models. In this paper, the ratio of the peak acceleration response a to the peak acceleration of the seismic record ag is defined as the acceleration amplification coefficient Ra, the calculation method is as follows:
Table 7.
Comparison of the maximum peak acceleration.
It can be observed that Model 2 exhibits the greatest amplification effect on seismic loads, followed by Model 1, and Model 3 has the weakest amplifying effect on seismic loads.
These results indicate that the stiffness of the substructure has a great influence on the acceleration response of the suspen-dome structure; when the substructure stiffness decreases, it may further increase the acceleration response of the superstructure or it can have a seismic isolation effect on the superstructure, thereby reducing the superstructure’s acceleration response, and the underlying reasons for this will be analyzed later.
5.2.2. Displacement Response
Figure 17a,b show the peak displacement responses of the three models; Figure 18a,b depicts the displacement time-history curves of measuring point D43-3. To exclude the influence of substructure displacements, the displacement values at each measuring point were taken as relative displacements to the column top. It can be observed that under varying intensities of seismic loads, the displacement responses of the three models exhibit significant differences. Of the three, Model 2 demonstrates the most intense displacement response, followed by Model 1, while Model 3 exhibits the smallest displacement response. For instance, under the severe TAFT seismic record’s action, the peak displacements of A4-4 in Model 1, Model 2, and Model 3 are 2.09 mm, 2.82 mm, and 1.26 mm, respectively. Similarly, under the severe Beijing seismic record’s action, the peak displacements of A4-4 in the three models are 1.93 mm, 2.70 mm, and 1.34 mm, respectively. Furthermore, it is evident that the peak displacements at each measurement point of Model 3 are similar, and the trend of the line connecting the peak displacements at each point is relatively smooth and approaches a line, indicating that under the impact of an earthquake, its superstructure tends to move as a rigid body. In contrast, significant differences in peak displacements exist between each measurement point in Models 1 and 2, suggesting that the superstructures of these two models have undergone significant displacement deformation.
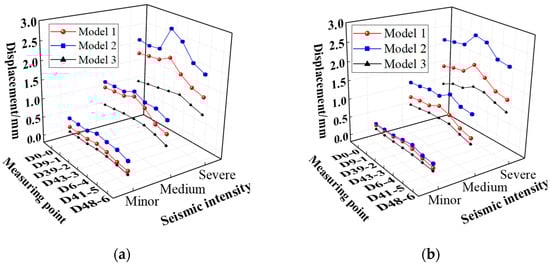
Figure 17.
Comparison of peak displacement: (a) TAFT record; (b) Beijing record.
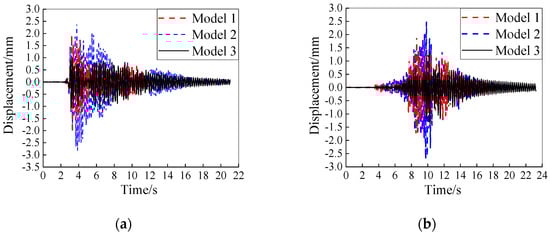
Figure 18.
Displacement–time-history curve of measuring point D43-3: (a) TAFT record; (b) Beijing record.
Table 8 presents the maximum peak displacement of the three models under seismic actions of varying intensities. It can be seen that there are significant differences in the maximum displacement responses among the three models, with Model 2 exhibiting the largest displacement response, followed by Model 1, and Model 3 having the weakest displacement response. That is to say, the deformation of Model 2 is the most obvious, followed by Model 1, and the deformation of Model 3 is the smallest.
Table 8.
Comparison of the maximum peak displacement.
The aforementioned results demonstrate that the displacement response of the suspen-dome structure is obviously influenced by the substructure stiffness; and similar to acceleration response, as the stiffness of the substructure decreases, the displacement and deformation of the suspen-dome structure may either increase or decrease.
5.2.3. Internal Force Response
Figure 19a–b display the peak internal force responses of the ring bars, radial bars, and hoop cables, respectively; Figure 20a,b present the internal force time-history curves of measuring points C29-7 under the severe seismic record’s action. It is shown that under the excitation of seismic loads with different intensities, there are remarkable differences in the internal forces of various types of members in the three models, and the internal force response of Model 2 is the most intense, followed by Model 1, and the internal force response of Model 3 is the smallest. Taking the maximum internal force of the ring bar C29-7 as an example, when Model 1, Model 2 and Model 3 are excited by the severe TAFT record, the peak internal forces of the ring bar C29-7 of the three models are 6.77 kN, 7.26 kN, and 3.26 kN, respectively; when the three models are excited by the severe Beijing record, the peak internal forces of the ring bar C29-7 of the three models are 6.86 kN, 7.79 kN, and 4.65 kN, respectively.
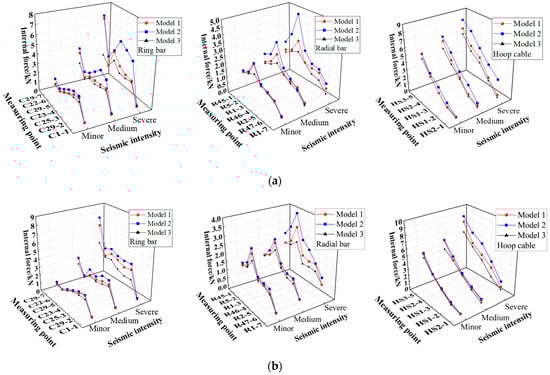
Figure 19.
Comparison of peak internal force: (a) TAFT record; (b) Beijing record.
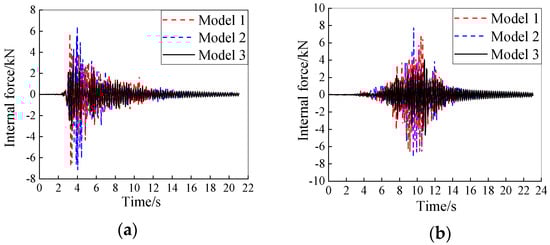
Figure 20.
Internal force–time-history curve of measuring point C29-7: (a) TAFT record; (b) Beijing record.
Table 9 lists the maximum peak internal forces of various members in the three models under the action of seismic load. It is also illustrated that the internal force responses of the three models vary noticeably, and Model 2 exhibits the largest internal force response, followed by Model 1, while Model 3 shows the smallest.
Table 9.
Comparison of maximum peak internal force.
Based on the above results, it can be inferred that the internal forces of the suspen-dome structure are considerably affected by the substructure stiffness. In addition, consistent with the variation patterns of acceleration response and displacement, when the stiffness of the substructure decreases, the internal forces of the suspended dome structure may significantly increase or decrease.
5.3. Result Analysis
According to the above results, although the substructure stiffness of Model 2 and Model 3 is lower than that of Model 1, the seismic responses of Model 2 are more severe than that of Model 1, while the seismic responses of Model 3 are the weakest, the superstructure of which tends to move and deform as a whole. This is attributed to the greater amplification of seismic input by the substructure of Model 2 compared to Model 1; while compared with Model 1 and Model 2, the substructure of Model 3 had a seismic isolation effect.
To validate the above inference, the column-top acceleration–time-history curves of the three models under severe TAFT seismic excitation were compared against the input acceleration–time-history curves, as shown in Figure 21a–c. It can be observed that the peak acceleration of the input seismic record is 0.43 g, and the peak accelerations of the column tops of Model 1, Model 2, and Model 3 are 0.65 g, 0.96 g, and 0.31 g, respectively; in other words, the substructures of Model 1, Model 2 and Model 3 amplify the input seismic load by factors of 1.5, 2.2, and 0.73, respectively, indicating that the substructure of Model 2 has the greatest amplification effect on seismic loads, followed by Model 1, while the substructure of Model 3 has a seismic isolation effect on seismic loads, which proves the correctness of the above inference.
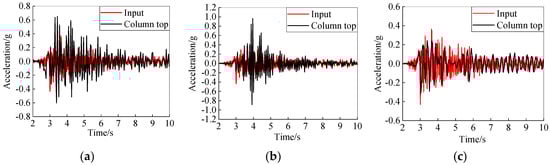
Figure 21.
Acceleration–time-history curve comparison of column top and input seismic record: (a) Model 1; (b) Model 2; (c) Model 3.
In addition, in order to further study the influence of the substructure stiffness on the seismic response of the suspen-dome structure, the amplitude–frequency curves of the seismic records are depicted in Figure 22. It can be seen that the main frequency ranges of TAFT seismic record and Beijing seismic record are 4.53 Hz~16.52 Hz and 3.15 Hz~8.67 Hz, respectively. At the same time, according to Figure 12, the fundamental frequencies of the three models are 5.784 Hz, 5.111 Hz and 3.420 Hz, respectively. It follows that the fundamental frequency of Model 3 is quite different from that of Model 1 and Model 2, which falls outside the main frequency ranges of the seismic records, thus the substructure of Model 3 has a seismic isolation effect on the superstructure, so that the seismic response of the superstructure of Model 3 is the smallest; by contrast, the fundamental frequencies of Model 1 and Model 2 are relatively close and the main frequency range of seismic records cannot be avoided, so the seismic responses of the superstructures of Model 1 and Model 2 are relatively violent. In addition, the substructure stiffness of Model 1 is the strongest and the upper suspen-dome is firmly constrained; hence, the seismic response of Model 1 is weaker than that of Model 2, while the restraining effect of the substructure in Model 2 is relatively weaker, resulting in a more intense seismic response of the superstructure than that of Model 1.
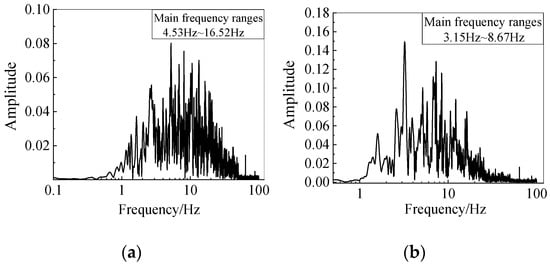
Figure 22.
Amplitude–frequency curves of seismic records: (a) TAFT record; (b) Beijing record.
Based on the above analysis, it can be concluded that the influence of substructure stiffness on the seismic response of suspen-dome structure mainly depends on two aspects: on one hand, as the substructure stiffness is different, the strength of the constraint on the superstructure is varying, which affects the seismic responses of the superstructure; on the other hand, the change in the substructure stiffness will affect the fundamental frequency of the overall structure, so that the seismic responses of the structures will also be different under seismic loads with certain spectral characteristics. At the same time, it is well-known that the spectral characteristics of seismic load are often site-dependent. Consequently, in seismic analysis and design, the influence of substructure stiffness on the seismic response of suspended dome structures should be considered, and the substructure with reasonable stiffness should be designed and selected in combination with the building site.
6. Conclusions
In order to investigate the dynamic characteristics and seismic responses of suspen-dome structures accounting for substructure stiffness, the gymnasium of the Lanzhou Olympic Sports Center served as the prototype, a method of accounting for the complex concrete substructures of the prototype structure in a dynamic scale model was proposed, and an overall test model with a scale ratio of 1:20 was designed and produced. After that, a white noise excitation test was carried out on the test model, and the natural frequencies were compared with those of the prototype structure after considering the scale ratio. Moreover, the natural frequency and seismic response of the overall numerical model were compared with the simplified model, and the influence of the substructure on the seismic performance of the suspen-dome structure was studied. Finally, three overall numerical models with various levels of substructure stiffness were established, and the dynamic characteristics and seismic response of the three models were compared and analyzed. The following conclusions can be drawn:
(1) The proposed method of replacing complex concrete substructures of the suspen-dome prototype structure with steel substructures in the dynamic scale model is accurate and reasonable. The result will provide a reference for the design of shaking table test models of suspen-dome structures with substructures.
(2) The inclusion of substructures reduces the overall stiffness of the suspen-dome structure, thereby reducing the structural natural frequency. Meanwhile, the seismic responses of the overall model increase significantly compared to the simplified model. Therefore, substructures should be considered, and overall models employed in the seismic analysis and design of suspen-domes.
(3) With a reduction in substructure stiffness, the natural frequency of the suspen-dome structure will decrease, and the vibration mode of the overall structure will change from the deformation of the superstructure to the coupled deformation of the superstructure and the substructure.
(4) The seismic response of the suspen-dome structure is governed by two primary factors related to substructure stiffness: the degree of constraint it imposes on the superstructure, and the fundamental frequency of the overall system, which determines its resonance susceptibility to the spectral characteristics of the seismic input.
In future research, the failure mechanism and ultimate bearing capacity of the suspen-dome structure considering the influence of the substructures subjected to extremely severe earthquakes can be further studied by shaking table tests and numerical simulations.
Author Contributions
Conceptualization, S.X.; methodology, S.X., Z.Z. and X.L.; software, Z.Z.; validation, S.X.; investigation, Z.Z.; resources, Z.Z.; data Z.Z.; writing—original draft preparation, Z.Z.; writing—review and editing, X.L.; visualization, Z.Z.; supervision, X.L.; project administration, X.L.; funding acquisition, Z.Z. All authors have read and agreed to the published version of the manuscript.
Funding
This research was funded by Science Research Project of Hebei Education Department (No. QN2025377).
Data Availability Statement
The data presented in this study are available on request from the corresponding author.
Acknowledgments
The authors would like to acknowledge the Lanzhou Olympic Sports Center Construction and Development Co., Ltd. and China Aviation Planning and Design Institute (Group) CO., LTD. and Huixian Earthquake Engineering Comprehensive Laboratory of the Institute of Engineering Mechanics, China Earthquake Administration.
Conflicts of Interest
The authors declare no conflicts of interest.
References
- Kawaguchi, M.; Tatemichi, I.; Chen, P. Optimum shapes of a cable dome structure. Eng. Struct. 1999, 21, 719–725. [Google Scholar] [CrossRef]
- Kawaguchi, M.; Abe, M.; Hatabo, T. Structural Tests on the Suspen-Dome System. In Proceedings of the of IASS Symposium, Atlanta, GA, USA, 24–28 April 1994. [Google Scholar]
- Wang, X.; Chen, Z.; Yu, J. Numerical and experimental study on loaded suspen-dome subjected to sudden cable failure. J. Constr. Steel Res. 2017, 137, 358–371. [Google Scholar] [CrossRef]
- Zeng, J.; Lv, H.; Zhu, Z. Static and stability analyses of multi-strut type aluminium alloy suspen-dome structure with large opening. Thin-Walled Struct. 2024, 205, 112529. [Google Scholar] [CrossRef]
- Li, Z.; Zhang, Z.; Dong, S. Construction Sequence Simulation of a Practical Suspen-dome in Jinan Olympic Center. Adv. Steel Constr. 2012, 8, 38–53. [Google Scholar]
- Liu, H.; Chen, Z. Influence of Cable Sling on the Stability of Suspen-domewith Stacked Arches Structures. Adv. Steel Constr. 2012, 8, 54–70. [Google Scholar]
- Liu, M.; Zhao, J.; Wang, Y. Study on static performance and dynamic characteristics of a spoke cable-truss suspen-dome system. Structures 2024, 68, 107162. [Google Scholar] [CrossRef]
- Zhang, A.; Wang, D.; Liu, X. Dynamic Performance Experiment and Theoretical Analysis on the Suspend-Dome Structure Model of the Badminton Gymnasium for 2008 Olympic Games. J. Build. Struct. 2007, 28, 68–75. [Google Scholar] [CrossRef]
- Nie, G.; Fan, F.; Zhi, X. Test on the Suspended Dome Structure and Joints of Dalian Gymnasium. Adv. Struct. Eng. 2013, 16, 467–486. [Google Scholar] [CrossRef]
- Kawaguchi, M.; Masaru, A.; Tatemichi, I. Design, Tests and Realization of ‘Suspen-Dome’ System. J. Int. Assoc. Shell Spat. Struct. 1999, 40, 179–192. [Google Scholar]
- Wang, D.; Zhang, A.; Liu, X. Novel dynamical feature and anti-seismic experiment about the big span suspend-dome structure. J. Beijing Univ. Technol. 2012, 38, 194–200. [Google Scholar]
- Tatemichi, I.; Hatato, T.; Anma, Y. Vibration Tests on a Full-Size Suspen-Dome Structure. Int. J. Space Struct. 1997, 12, 217–224. [Google Scholar] [CrossRef]
- Wu, C.; Zhang, J.; Gao, Y. Research on Seismic behavior of Suspen-dome Structure Based on Improved Plant Growth Simulation Algorithm. Steel Constr. 2018, 33, 66–70. [Google Scholar] [CrossRef]
- Nie, G.; Dai, J.; Zhang, C. Failure patterns of large span space structures in Lushan earthquake and numerical simulation. China Civ. Eng. J. 2015, 48, 1–6. [Google Scholar] [CrossRef]
- Chen, Y.; Chen, J. Study of the cooperative effect between reticulated shell and supporting structure. J. Huazhong Univ. Sci. Technol. 2004, 32, 49–53. [Google Scholar] [CrossRef]
- Yu, Z.; Li, S.; Lu, D. Failure mechanism of single-layer steel reticular domes with reinforced concrete substructure subjected to severe earthquakes. Int. J. Steel Struct. 2016, 16, 1083–1094. [Google Scholar] [CrossRef]
- Fan, F.; Sun, M.; Zhi, X. Simplified design method and seismic performance of space trusses with consideration of the influence of the stiffness of their lower supporting columns. Earthq. Eng. Eng. Vib. 2016, 15, 401–409. [Google Scholar] [CrossRef]
- Nie, G.; Zhi, X.; Shang, Y. Seismic performance of single-layer cylindrical latticed shell considering effect of lower supporting structure. J. Build. Struct. 2020, 41, 10–16. [Google Scholar] [CrossRef]
- Chi, S.; Lin, S. Validation of Similitude Laws for Dynamic Structural Model Test. World Inf. Earthq. Eng. 2004, 20, 11–20. [Google Scholar] [CrossRef]
- Yang, D.; Zhang, Y.; Wu, J. Computation of Rayleigh Damping Coefficients in Seismic Time-history Analysis of Spatial Structures. J. Int. Assoc. Shell Spat. Struct. 2010, 51, 125–136. [Google Scholar]
Disclaimer/Publisher’s Note: The statements, opinions and data contained in all publications are solely those of the individual author(s) and contributor(s) and not of MDPI and/or the editor(s). MDPI and/or the editor(s) disclaim responsibility for any injury to people or property resulting from any ideas, methods, instructions or products referred to in the content. |
© 2025 by the authors. Licensee MDPI, Basel, Switzerland. This article is an open access article distributed under the terms and conditions of the Creative Commons Attribution (CC BY) license (https://creativecommons.org/licenses/by/4.0/).