Abstract
Seven groups of near-field pulse-like ground motions and three groups of ordinary ground motions were bidirectionally inputted into a symmetrical high-rise structure to comparatively study the deformation and energy dissipation characteristics of the structure. The results reveal that compared to ordinary ground motions, under near-field pulse-like ground motions, the inter-story drift angles of the structure significantly exceed the code limit, accompanied by a downward shift of the floors with the maximum drift angles. Moreover, the input energy is substantially higher and the hysteresis energy dissipation supersedes damping energy dissipation as the dominant mode. During an 8-degree frequent earthquake, coupling beams are the main energy-dissipating members, the floors below 2/3 of structural height mainly dissipate hysteresis energy by coupling beams, while the floors above 2/3 of structural height mainly dissipate hysteresis energy by frame beams. During 8-degree design earthquakes and rare earthquakes, frame beams are the main energy-dissipating members, the hysteresis energy ratio of coupling beams is significantly reduced, and the hysteresis energy ratio of shear walls gradually increases. During 8-degree design earthquakes, the 1st floor mainly dissipates hysteresis energy by shear walls, the 2nd to 6th floors mainly dissipate hysteresis energy by coupling beams, and the 7th to 36th floors mainly dissipate hysteresis energy by frame beams. During 8-degree rare earthquakes, the hysteresis energy on the 1st to 2nd floors is mainly dissipated by shear walls, while it is mainly borne by frame beams on other floors.
1. Introduction
Strong earthquakes (M ≥ 6) tend to generate near-field pulse-like ground motions near seismogenic faults. Near-field pulse-like ground motions are a special type of long-period ground motion characterized by large amplitudes, short duration, and one or more long-period velocity pulses rich in low-frequency components, as well as high ratios of peak velocity to peak acceleration PGV/PGA [1,2]. Cheng et al. [2] pointed out that the PGA, PGV and PGD of near-field pulse-like ground motions are 1.34, 1.91 and 2.44 times those of ordinary ground motions, respectively, and the PGV/PGA ratio is generally greater than 0.2. Near-field pulse-like ground motions are likely to rapidly input substantial seismic energy into high-rise structures, causing violent impacts and more significant damage compared to ordinary ground motions. During major earthquakes in recent decades, such as the 1994 M6.7 Northridge earthquake, the 1995 M6.9 Kobe earthquake, the 1999 M7.5 Kocaeli earthquake, the 1999 M7.6 Chi-Chi earthquake and the 2008 M8.0 Wenchuan earthquake, near-field pulse-like ground motion records have been observed, resulting in severe structural damage and heavy casualties in the vicinity of the faults [3,4,5,6]. Due to unique geographical locations, seismic fault zones are well developed in China. Many important cities such as Beijing, Xi’an, Lanzhou and Urumqi are located near seismogenic faults and some large engineering structures even span the fault zones. These cities and engineering structures may face severe threats from near-field pulse-like ground motions, and the potential casualties and economic losses resulting from a major near-field earthquake would be immeasurable [7,8].
Extensive research has been devoted to studying the seismic behavior of high-rise structures subjected to near-field pulse-like ground motions. Babak et al. [9] compared the seismic response characteristics of a 20-story reinforced concrete frame structure, finding that near-field pulse-like ground motions impose larger demands on the structure than ordinary ground motions. Ma et al. [10] further confirmed that near-field pulse-like ground motions significantly amplify seismic responses in frame structures, such as inter-story drift angles, inter-story shear forces and roof accelerations, compared to far-field and non-pulse ground motions. Jiang et al. [11] examined the influence of velocity pulses of near-field ground motions on the seismic responses of high-rise steel frame structures, suggesting that pulse-like ground motions primarily excite the fundamental mode responses of the structures. Hu et al. [12] and Emamikoupaei et al. [13] extended this understanding to cold-formed steel (CFS) buildings and steel Modular Building Systems (MBSs), showing that they also experience larger demands under near-field ground motions. Khademi et al. [14] specifically highlighted the considerable increase in collapse risk for RC shear wall systems under near-field pulse-like ground motions, based on the ratio of the pulse period of ground motions to the elastic first mode period. Furthermore, studies have begun to explore the influence of specific pulse characteristics. Yang et al. [15] used a synthetic broadband ground motion model to show the significant influence of pulse amplitude on structural drift demands, Zhang et al. [16] revealed that the orientation angle of forward-directivity pulses affects structural collapse capacity because as the angle between the ground motion and the fault strike increases the destructiveness of the ground motion intensifies, whereas the collapse capacity of the structures decreases linearly. Majdi et al. [17] investigated the correlation between pulse-type earthquake characteristics and the seismic response of buildings under both pounding and non-pounding conditions. Zhang et al. [18] conducted a comparative study and seismic fragility analysis with consideration of modeling uncertainty for a 12-story reinforced concrete frame structure under excitation by far-field and pulse-like near-field ground motions by using the multiple stripes analysis method.
However, the aforementioned studies have mainly focused on comparative analysis of internal forces and deformation indicators, with limited attention given to the energy responses of high-rise structures under near-field pulse-like ground motions. Unlike conventional indicators such as bearing capacity or displacement, the energy response, which fundamentally represents the process of seismic energy input and dissipation, provides a more comprehensive assessment of seismic behavior and structural damage mechanisms [19]. While some researchers have investigated energy distribution [20,21,22] and the dissipation mechanisms in structural members [23,24,25] under ordinary ground motions, research focused on near-field pulse-like motions has been limited. Cheng et al. [26] analyzed the energy dissipation of reinforced concrete frame-core tube high-rise structures under near-field pulse-like ground motions, showing that the energy release of near-field pulse-like ground motions is relatively concentrated, with frame beams bearing most of the hysteresis energy, shear walls bearing a small portion and frame columns contributing minimally. A critical limitation of this research was the predominant adoption of unidirectional input for near-field pulse-like ground motions. Spectral analysis revealed that two horizontal ground motions recorded at a single station may be near-field pulse-like ground motions. Whether high-rise structures are symmetrical or not, structural responses under bidirectional ground motions are quite different from those under unidirectional ground motions [26]. Nevertheless, the energy responses of high-rise structures under bidirectional near-field pulse-like ground motions are rarely mentioned, necessitating further investigation.
Deformation and energy dissipation are two critical issues that need to be comprehensively considered in the seismic design and damage assessment of high-rise structures. Therefore, seven groups of near-field pulse-like ground motions and three groups of ordinary ground motions were selected and bidirectionally inputted into a symmetrical high-rise structure. An analysis of the deformation characteristics of the structure was provided and a focus on the differences in energy dissipation of the structure was investigated, aiming to offer insights for the seismic design of high-rise structures subjected to near-field pulse-like ground motions.
2. Design and Modeling of a Symmetrical High-Rise Structure
A 36-story symmetrical SRC frame-RC core tube high-rise structure was designed based on the current Chinese structural design codes. The structure has a story height of 4.0 m, with total plan dimensions of 36 m × 28 m. The standard floor plan is illustrated in Figure 1 [27]. The concrete strength grade of beams and slabs is C30, the concrete strength grades of the SRC columns and RC core tube walls are C60 (1st to 12th floors), C50 (13th to 24th floors) and C40 (25th to 36th floors). The steel sections in the SRC columns are of grade Q345, and the reinforcing bars in beams, slabs, SRC columns and shear walls are of grade HRB400. The dead load on the floors is 5.0 kN/m2, the dead load on the roof is 6.0 kN/m2, the live load is 2.0 kN/m2, the basic wind pressure is 0.5 kN/m2 and the site roughness is Class C. The seismic fortification intensity is 8-degree (0.2 g), the site category is Class II, the design earthquake group is Group III, the characteristic period Tg is 0.45 s and the seismic resistance classifications of the SRC frames and RC core tube are Class I and special Class I, respectively. The cross-sectional dimensions and reinforcement information of structural members are detailed in reference [28].
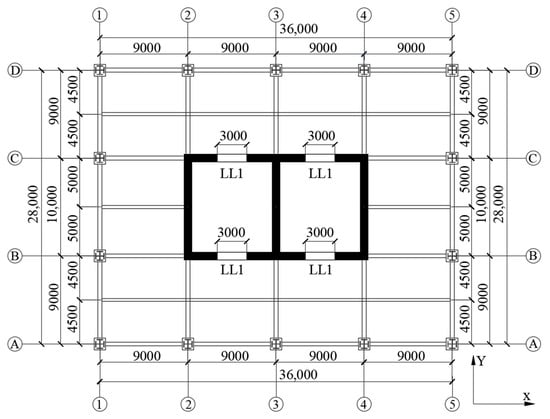
Figure 1.
Standard floor plan of SRC frame—RC core tube high-rise structure (Unit: mm) [27].
Structural modeling and dynamic elastic–plastic analysis were conducted using Perform-3D (Version 7) software. During structural modeling, the Mander constitutive model was adopted for concrete in regions with dense stirrup configurations, such as the stirrup-reinforced zones of beam ends and column ends, as well as the constrained edge regions of shear walls, while the stress–strain relationship curve of concrete under uniaxial compression given in the “Code for design of concrete structures” was adopted for concrete in areas with less stirrup reinforcement. Steel sections and reinforcing bars were simulated using the bilinear elastic–plastic constitutive relationship without descending sections, while RC beams, SRC columns, coupling beams and shear walls were simulated using the fiber element model. The detailed modeling process can be found in reference [28].
The first vibration mode of the structure is the first translational mode along the Y direction, with the corresponding fundamental period T1 of 3.35 s, which is consistent with the typical period range of frame-core tube high-rise structures. According to the empirical formula for the T1 of frame-core tube high-rise structures proposed in reference [29], the T1 of the structure is approximately 3.55 s, with a difference of 5.6%. The second vibration mode is the first translational mode along the X direction, with a corresponding second period T2 of 2.95 s. The third vibration mode is the first torsional mode along the Z direction, with a corresponding first torsional period Tt of 2.50 s. This indicates that the stiffness of the structure in the Y direction is lower than that in the X direction and the Y direction is the main direction of the structure, while the X direction is the secondary direction. The ratio Tt/T1 = 2.50/3.35 = 0.75 < 0.85, showing a rational structural load-bearing layout.
Structural stiffness characteristics have a direct impact on the seismic response analysis of the structure. The Y-direction is the more flexible direction of the structure, meaning it is more susceptible to excitation and will generate larger responses. Therefore, during bidirectional input, the ground motion with the largest peak acceleration should be input along the Y-direction, constituting the most critical scenario likely to induce structural damage. The coupling effect between the two orthogonal ground motions and the inherent stiffness asymmetry of the structure allows for a more comprehensive reflection of seismic performance.
3. Selection of Near-Field Pulse-like Ground Motions
Near-field pulse-like ground motions are characterized by rich low-frequency components and significant velocity pulses. Research has shown that when the weighted average value βl of the ground motion amplification factor spectrum values within the 2–10 s range is ≥0.4, the ground motions can be considered long-period ground motions due to high proportions of low-frequency components [30]. When the ratio PGV/PGA ≥ 0.2, the pulse characteristics of the ground motions are highly pronounced [31,32]. Since the current design response spectrum does not adequately account for the influence of near-field pulse-like ground motions [4,33], the fitted response spectrum proposed in Reference [34], which can reflect the characteristics of such ground motions, is accordingly employed as the matching target to select near-field pulse-like ground motions in this paper. In summary, the selection criteria for near-field pulse-like ground motions are as follows:
(1) Magnitude ≥ 6, fault distance ≤ 20 km, βl ≥ 0.4 and PGV/PGA ≥ 0.2.
(2) Due to the large peak velocity of the pulses, the PGV of selected ground motions is required to be ≥30 cm/s [35].
(3) Since the site category in this study is Class II, the ground motions are required to be recorded on Class II sites or Class C sites as classified by the U.S. NEHRP code.
(4) To ensure statistical consistency between the design response spectrum and the selected ground motions, it is required that average acceleration response spectrum values in the period range [0.1, Tg] and acceleration response spectrum values at period T1 deviate by less than 20% from the corresponding values of the fitted response spectrum [27].
Based on the above criteria, seven groups of near-field pulse-like ground motions were selected from the 1999 M7.6 Chi-Chi earthquake in the near-field pulse-like ground motion database [28]. Additionally, three groups of ordinary ground motions were selected for comparative analysis. The selection criteria were as follows: magnitude < 6, βl < 0.4, site Class C, and the acceleration response spectrum values in the period range [0.1, Tg] and at period T1 deviate by less than 20% from the design response spectrum specified in the seismic code.
All groups of ground motions were inputted bidirectionally. For each group, the Y-direction horizontal ground motion was selected as the one with the closest acceleration response spectrum value at the period T1 to the targeted response spectrum, and the other ground motion was inputted along the X-direction. Based on the Chinese “Code for seismic design of buildings”, to rationally consider the simultaneous action and mutual coupling effect of two orthogonal horizontal ground motions, the peak acceleration PGA of inputted ground motions was scaled to a PGAy/PGAx ratio of 1:0.85. The basic information of the selected ground motions is detailed in Table 1.

Table 1.
Basic information of selected ground motions.
The average acceleration amplification factor β spectrum of the selected ground motion is presented in Figure 2. It can be observed that the peak values of the β spectrum of near-field pulse-like ground motions are lower than those of ordinary ground motions. However, after reaching the peak, as the structural period increases, the β spectrum values of ordinary ground motions decay rapidly, whereas those of near-field pulse-like ground motions decay relatively slowly. At the fundamental period T1 (3.35 s) and the second period T2 (2.95 s), the spectral values of near-field pulse-like ground motions are 2.66 times and 3.07 times those of ordinary ground motions, respectively. Conversely, in the common period range of low- and medium-rise structures (T= 0.5–1.5 s), the amplification effect of near-field pulse-like motions over ordinary motions is smaller. This contrast underscores that the detrimental effects of near-field pulse-like motions are particularly acute for long-period structures, while the impact on short-period structures may be comparatively less severe. Further analysis reveals that near-field pulse-like ground motions exhibit energy concentrations in the low-frequency range of 0.09 Hz to 3.8 Hz, whereas ordinary ground motions show energy dispersal in the mid-to-high-frequency range of 0.6 Hz to 6.7 Hz. The frequencies of the first two modes, which significantly contribute to the seismic response, are 0.30 Hz and 0.34 Hz, both falling within the frequency distribution range of the main energy of near-field pulse-like ground motions. Therefore, the selected near-field pulse-like ground motions inherently contain more resonant components for high-rise structures.
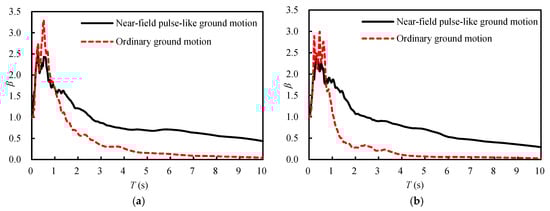
Figure 2.
Average acceleration amplification factor β spectrum of selected ground motions. (a) Y-direction ground motion; (b) X-direction ground motion.
4. Deformation Analysis of the Symmetrical High-Rise Structure Under Bidirectional Near-Field Pulse-like Ground Motions
The inter-story drift angle is an important indicator characterizing the degree of seismic damage to high-rise structures, and is the main element of deformation verification in structural seismic design. According to the levels of 8-degree frequent earthquakes, 8-degree design earthquakes and 8-degree rare earthquakes specified in the “Code for seismic design of buildings”, the peak accelerations of the ground motions inputted along the Y-axis of the structure were scaled to 70 gal, 200 gal and 400 gal, respectively. Correspondingly, the peak accelerations of the ground motions inputted along the X-axis of the structure were scaled to 59.5 gal, 170 gal and 340 gal, respectively. Elastic–plastic time history analyses were conducted to compare the response characteristics of the inter-story drift angles of the high-rise structure under bidirectional near-field pulse-like ground motions and ordinary ground motions.
4.1. Inter-Story Drift Angle of the High-Rise Structure During an 8-Degree Frequent Earthquake
Figure 3 presents a comparison of the inter-story drift angles of the high-rise structure under two types of ground motion during an 8-degree frequent earthquake. Distinct differences in both the magnitude and distribution of structural responses were observed.
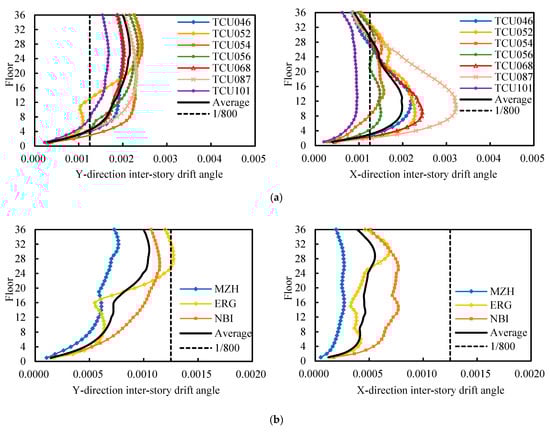
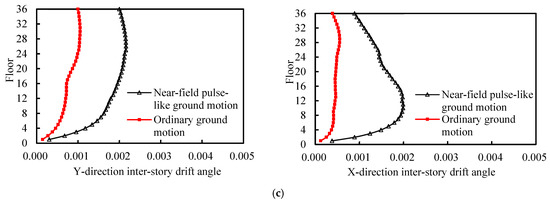
Figure 3.
Inter-story drift angles of the high-rise structure under two types of ground motion during an 8-degree frequent earthquake. (a) Near-field pulse-like ground motion; (b) ordinary ground motion; (c) comparison of average inter-story drift angles.
Under ordinary ground motions, the structure remains elastic, with relatively small inter-story drift angles. The maximum drift angles range from 0.00077 to 0.00127 in the Y-direction and 0.00027 to 00077 in the X-direction, occurring in the upper-middle to upper floors (25th–32nd floor), with corresponding averages of 0.0011 and 0.00058, both less than the elastic inter-story drift angle limit of 1/800.
In contrast, under near-field pulse-like ground motions, the structural response is significantly amplified and exhibits a shift in the location of maximum inter-story drift angles. The inter-story drift angles of the structure are significantly greater than those under ordinary ground motions, ranging from 0.0017 to 0.0024 in the Y-direction and 0.0009 to 0.0032 in the X-direction, with corresponding averages reaching 0.0022 and 0.002, approximately 2.0 and 3.45 times those under ordinary ground motions, respectively, and exceeding the elastic limit of 1/800. Furthermore, the floors with maximum drift angles shift downward, particularly in the X-direction, where they are located between the 9th and 14th floors.
4.2. Inter-Story Drift Angle of the High-Rise Structure During an 8-Degree Design Earthquake
Figure 4 presents a comparison of the inter-story drift angles of the high-rise structure under two types of ground motion during an 8-degree design earthquake.
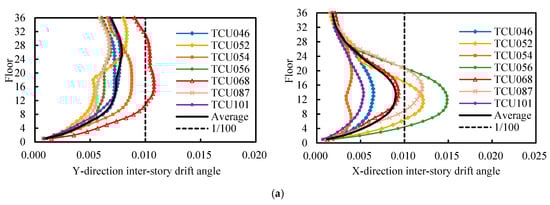
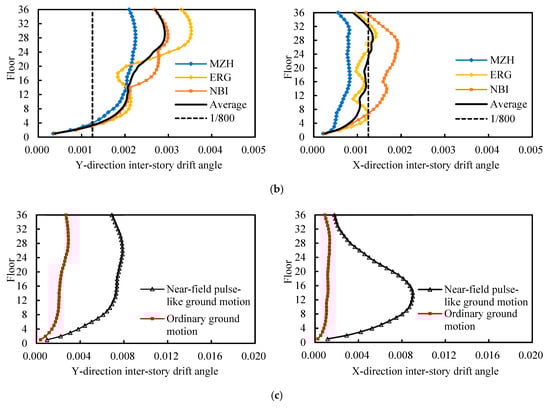
Figure 4.
Inter-story drift angles of the high-rise structure under two types of ground motion during an 8-degree design earthquake. (a) Near-field pulse-like ground motion; (b) ordinary ground motion; (c) comparison of average inter-story drift angles.
Under ordinary ground motions, the structure experiences limited plasticity. The maximum drift angles range from 0.00224 to 0.00353 in the Y-direction and 0.0008 to 0.0019 in the X-direction, with the maximum values confined to the upper floors (28th–32nd floor). These drift angles remain within a relatively controlled range.
In comparison, under near-field pulse-like ground motions, the structural deformation demands increase dramatically. The average inter-story drift angles of the structure are 0.0081 in the Y-direction and 0.0092 in the X-direction, approximately 2.79 and 6.57 times those under ordinary ground motions, respectively. For some near-field pulse-like ground motions (e.g., TCU068), the drift angles even surpass the elastic–plastic limit of 1/100. The downward shift in the location of the maximum drift angles remains evident, located between the 22nd and 28th floors in the Y-direction and the 11th and 16th floors in the X-direction.
4.3. Inter-Story Drift Angle of the High-Rise Structure During an 8-Degree Rare Earthquake
Figure 5 presents a comparison of the inter-story drift angles of the high-rise structure under two types of ground motion during an 8-degree rare earthquake.
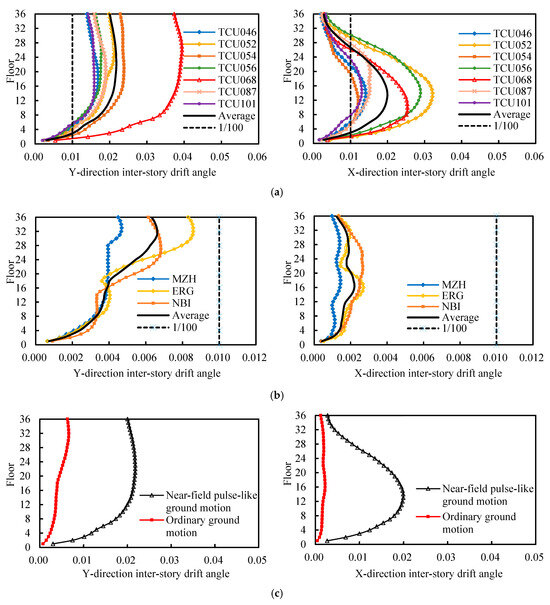
Figure 5.
Inter-story drift angles of the high-rise structure under two types of ground motion during an 8-degree rare earthquake. (a) Near-field pulse-like ground motion; (b) ordinary ground motion; (c) comparison of average inter-story drift angles.
Under ordinary ground motions, the maximum drift angles of the structure are 0.00469 to 0.00858 in the Y-direction and 0.00144 to 0.0027 in the X-direction, all meeting the elastic–plastic inter-story drift angle limit of 1/100, occurring on the 28th to 32nd floors in the Y-direction and the 16th and 21st floors in the X-direction.
Compared to ordinary ground motions, the structural response is extreme under near-field pulse-like ground motions. The average inter-story drift angles of the structure are 0.022 in the Y-direction and 0.0201 in the X-direction, about 3.28 and 9.14 times those under ordinary ground motions, respectively, and significantly exceeding the elastic–plastic limit of 1/100. The floors with maximum drift angles shift downward, located between the 18th and 26th floors in the Y-direction and the 10th and 14th floors in the X-direction.
Based on the above analysis, there are obvious differences in the inter-story drift angles of the high-rise structure under two types of ground motion. At the same earthquake level, the inter-story drift angles under near-field pulse-like ground motions are significantly larger than those under ordinary ground motions. The inter-story drift angles under ordinary ground motions fully meet the requirements of the code limit, while they significantly exceed the code limit under near-field pulse-like ground motions, approximately 0.72 to 2.56 times and 1.21 to 3.94 times the code limit during the 8-degree frequent earthquake and rare earthquake, respectively. These indicate that high-rise structures designed in accordance with the current Chinese structural design code may suffer unpredictable damage under near-field pulse-like ground motions. Therefore, it is essential to pay attention to the adverse effects of near-field pulse-like ground motions on high-rise structures.
The floors with the maximum drift angles are mainly located above 2/3 of the structural height under ordinary ground motions, whereas the floors shift downward under near-field pulse-like ground motions, mainly located within the range of 1/4 to 2/3 of the structural height. This is because the long-period pulses of near-field pulse-like ground motions are in resonance with the fundamental period of the structure, strongly exciting the fundamental vibration mode of the structure and causing larger inter-story drift angles in the middle and lower floors of the structure. This is consistent with the distribution pattern of the hysteresis energy dissipation along the floors, as described in the subsequent section.
5. Energy Dissipation of the Symmetrical High-Rise Structure Under Bidirectional Near-Field Pulse-like Ground Motions
The energy dissipation of a structure under seismic excitation is expressed as
EI = EK + EE + ED + EH
Here, EI, EK, EE, ED and EH correspond to the input energy, kinetic energy, elastic strain energy, damping energy, and hysteresis energy, respectively. ED and EH are calculated according to Equations (2) and (3), respectively.
where and C represent the velocity and damping matrices of the structure, respectively; u and F(u) represent the deformation and restoring force of the member, respectively; represents the area of the hysteresis loop; and n and m represent the number of the same member and the total number of all members, respectively.
In accordance with the levels of 8-degree frequent earthquakes, design earthquakes and rare earthquakes, the PGAs of Y-direction ground motions were scaled to 70 gal, 200 gal and 400 gal, respectively. Correspondingly, the PGAs of X-direction ground motions were scaled to 59.5 gal, 170 gal, and 340 gal, respectively. Time history analyses were conducted to compare the energy dissipation characteristics of the high-rise structure under bidirectional near-field pulse-like and ordinary ground motions.
5.1. Distribution of Input Energy in the High-Rise Structure
The input energy of the high-rise structure was calculated. It can be ascertained that at the same earthquake level, the input energy under near-field pulse-like ground motions consistently surpasses that under ordinary ground motions. During an 8-degree frequent earthquake, 8-degree design earthquake and 8-degree rare earthquake, the average input energy under near-field pulse-like ground motions is 1.0 × 10⁴ kN m, 8.09 × 10⁴ kN m and 31.12 × 10⁴ kN m, respectively, approximately 2.56 times, 4.76 times, and 5.92 times that under ordinary ground motions, respectively. Furthermore, the input energy exhibits a pronounced growth with increasing PGA. When the PGA reaches 200 gal and 400 gal, the average input energy under near-field pulse-like ground motions is approximately 8.09 and 31.12 times that at 70 gal, respectively, whereas at ordinary ground motions, it is about 4.36 and 13.49 times that at 70 gal, respectively.
Hysteresis energy EH is dissipated through structural inelastic deformation and is directly linked to the structural cumulative damage. For a given input energy, a larger hysteresis energy implies potentially more severe structural damage. Conversely, damping energy ED is dissipated through inherent structural damping. If damping can dissipate a major portion of input energy, the structure may avoid damage or sustain only minor damage. Thus, the ratios of hysteresis energy and damping energy to the total input energy, namely EH/EI and ED/EI, can better reflect the structural damage status and energy dissipation mode. Table 2 lists the EH/EI and ED/EI of the high-rise structure under two types of ground motions.
Table 2.
EH/EI and ED/EI of the high-rise structure under two types of ground motions.
The following can be observed:
(1) During an 8-degree frequent earthquake, the EH/EI is 0 under ordinary ground motions, indicating that the structure remains elastic without plastic damage. In contrast, under near-field pulse-like ground motions, the structure exhibits inelastic behavior. The EH/EI ranges from 0.015 to 0.314, averaging 0.197, which suggests a limited degree of damage. In this scenario, damping dissipates 53.5% of the input energy, demonstrating that it serves as the primary energy dissipation mode.
(2) During an 8-degree design earthquake, the structure experiences certain plastic damage. Under ordinary ground motions, the hysteresis energy and damping energy account for an average of about 82.8% of the input energy, but the average EH/EI is only 0.097, with a maximum of 0.148, significantly lower than ED/EI. This indicates that the structural damage development is insufficient, with damping energy dissipation still remaining dominant. Under near-field pulse-like ground motions, the hysteresis energy and damping energy together dissipate 89.9% to 96.1% of the input energy, and EH/EI increases significantly to an average of 0.449, about 4.63 times that under ordinary ground motions, indicating that the inelastic deformation response of the structure is greater at this time, more hysteresis energy is consumed, and the damage is more severe.
(3) During an 8-degree rare earthquake, the structure experiences further deepened plastic development. Approximately 90% to 99% of the input energy is dissipated through hysteresis energy and damping energy, with a further increase in EH/EI. The average EH/EI values under near-field pulse-like ground motions and ordinary ground motions are 0.524 and 0.22, respectively, which are 1.17 times and 2.28 times those during an 8-degree design earthquake, respectively, indicating that the structure consumes a greater proportion of hysteresis energy. The average EH/EI value under near-field pulse-like ground motions is 2.38 times that under ordinary ground motions, meaning deeper plastic damage development under such conditions. Comparative analysis reveals that under ordinary ground motions, ED/EI significantly exceeds EH/EI, with damping energy dissipation remaining dominant. Whereas under near-field pulse-like ground motions, EH/EI is larger than ED/EI, with hysteresis energy dissipation becoming the main mode.
5.2. Distribution of Hysteresis Energy in the High-Rise Structure
The hysteresis energy dissipation or EH/EI cannot fully and accurately reflect the damage development in the high-rise structure. The structural damage degree depends not only on the magnitude of hysteresis energy, but also on the distribution of hysteresis energy among structural members and floors. Identical hysteresis energy distributed differently among members and floors can lead to significantly different damage degree. Based on the calculated energy responses of the structure, further comparative studies were conducted on the distribution patterns of hysteresis energy among structural members and floors under two types of ground motion.
5.2.1. Distribution of Hysteresis Energy Among Structural Members
The distribution of hysteresis energy among structural members is expressed as the ratio of EH-Member/EH, representing the hysteresis energy EH-Member of each member to the total hysteresis energy EH of the high-rise structure. Figure 6 presents the EH-Member/EH of structural members under near-field pulse-like ground motions during an 8-degree frequent earthquake. Since the structure remains in the elastic stage under ordinary ground motions, no analysis is provided. It can be seen that under near-field pulse-like ground motions, SRC columns and shear walls are in the elastic stage and do not contribute hysteresis energy, while frame beams and coupling beams begin to dissipate hysteresis energy. The coupling beams are the main energy-dissipating members, dissipating about 80% to 98% of the total hysteresis energy, with frame beams dissipating the remaining smaller portion. Further analysis reveals that although few in quantity, coupling beams yield first during an earthquake and dissipate more than 80% of the total hysteresis energy. This effectively shields other structural members from damage, establishing coupling beams as the first line of seismic defense. Therefore, structural design should incorporate reasonable measures that enhance their energy dissipation capacity.
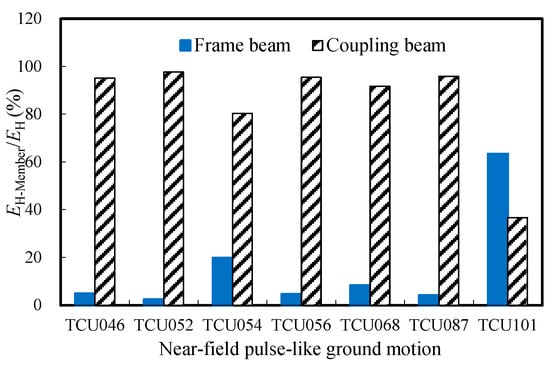
Figure 6.
EH-Member/EH of structural members under near-field pulse-like ground motions during an 8-degree frequent earthquake.
Figure 7 compares EH-Member/EH and average values among structural members during an 8-degree design earthquake. Under ordinary ground motions, SRC columns and shear walls still remain elastic and hysteresis energy is dissipated mainly by coupling beams (average 63.9%) and frame beams (remaining 36.1%). Under near-field pulse-like ground motions, the EH-Frame beam/EH value begins to increase, accounting for about 57% to 70%, and frame beams become the primary energy-dissipating members. In contrast, the EH-Coupling beam/EH value reduces significantly to about 17% to 41%. Shear walls begin to yield and dissipate a small portion of hysteresis energy, averaging about 2.2% and no more than 8.7%, while SRC columns remain elastic. Analysis indicates that under near-field pulse-like ground motions, the plastic development of the structure is relatively fast, and the inter-story drift angles under some ground motions even exceed the limit of 1/100. Coupling beams yield first and form plastic hinges to dissipate hysteresis energy, but their limited number constrains their energy dissipation capacity. Consequently, frame beams dissipate a larger proportion of hysteresis energy through developed plastic deformation, forming the second line of seismic defense. Shear walls exhibit limited plastic development, contributing minimally to energy dissipation.
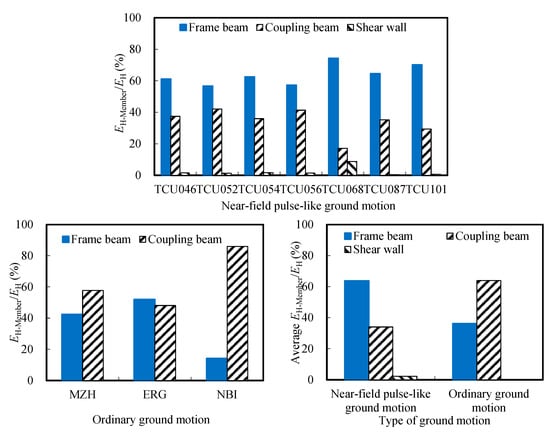
Figure 7.
Comparison of EH-Member/EH values and average values among structural members under two types of ground motions during an 8-degree design earthquake.
Figure 8 compares the EH-Member/EH values and average values among structural members during an 8-degree rare earthquake. Under ordinary ground motions, SRC columns and shear walls remain largely elastic, and hysteresis energy is dissipated jointly by coupling beams (34% to 63%) and frame beams (37% to 65%). Compared with ordinary ground motions, under near-field pulse-like ground motions EH-Frame beam/EH significantly increases, accounting for approximately 70% to 86%, and frame beams become the main energy-dissipating members, while EH-Coupling beam/EH reduces significantly to only 7% to 15%. Meanwhile, the EH-Shear wall/EH rises, ranging from 8% to 23%, with an average nearly matching that of the coupling beams, while SRC columns still remain elastic. This occurs because under near-field pulse-like ground motions, the seismic action on shear walls increases significantly, causing wall limbs to yield and develop plasticity more fully, thereby dissipating more hysteresis energy.
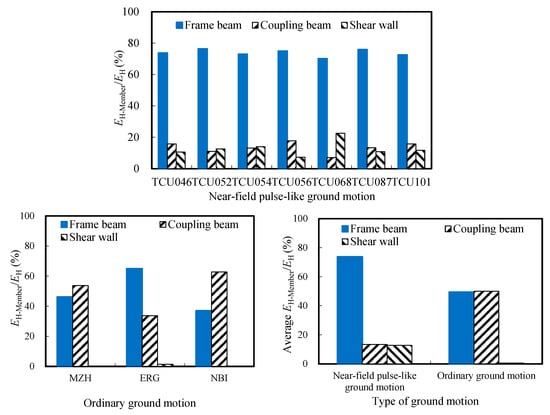
Figure 8.
Comparison of EH-Member/EH and average values among structural members under two types of ground motion during an 8-degree rare earthquake.
5.2.2. Distribution of Hysteresis Energy of Structural Members Along the Floors
(1) Hysteresis energy distribution along the floors under an 8-degree frequent earthquake
Figure 9 shows the hysteresis energy distribution of coupling beams and frame beams along the floors under near-field pulse-like ground motions during an 8-degree frequent earthquake, namely the proportion of hysteresis energy of coupling beams and frame beams on each floor to the total hysteresis energy of coupling beams (EH-Coupling beam) and frame beams (EH-Frame beam), respectively.
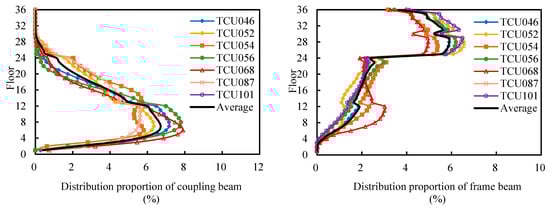
Figure 9.
Hysteresis energy distribution of structural members along floors under near-field pulse-like ground motions during an 8-degree frequent earthquake.
It can be seen that the hysteresis energy proportion of coupling beams increases from the bottom, peaks at the 6th to 8th floors (about 1/6 of the structural height), accounting for 5.7% to 6.9% of the EH-Coupling beam, then decreases rapidly as the floor rises, approaching zero in the range above the 30th floor (about 5/6 of the structural height). Thus, the hysteresis energy dissipation of coupling beams is concentrated in the floors near 1/6 of the structural height, with minimal dissipation at the bottom and above 5/6 of the structural height. The hysteresis energy proportion of frame beams increases gradually from the bottom, about 2% to 3% of the EH-Frame beam at the 24th floor, which is 2/3 of the structural height, suddenly increases significantly to 5% to 6% at the 25th floor, and decreases slowly as the height increases. The calculation shows that the frame beams above the 24th floor dissipate approximately 60% of the EH-Frame beam and are the main energy-dissipating regions.
To gain a clearer understanding of the hysteresis energy distribution along the floors under near-field pulse-like ground motions, Figure 10 shows the average proportion of hysteresis energy of coupling beams, frame beams and floor structure on each floor to the total hysteresis energy. As the floor level increases, the hysteresis energy of the structure first increases and then decreases, reaching the maximum of 6.4% on the 7th floor. Below the 24th floor, which is 2/3 of the structural height, each floor mainly dissipates hysteresis energy by coupling beams, among which the hysteresis energy dissipation of coupling beams on the 1st to 18th floors and on the 19th to 24th floors accounts for 88.1% to 99.9% and 71% to 85.9% of the hysteresis energy of each floor, respectively. Above the 24th floor, each floor mainly dissipates hysteresis energy by frame beams, among which the hysteresis energy proportion of frame beams on the 25th floor rapidly increases to 65.9% of the hysteresis energy dissipation of each floor and further increases to 99.8% on the 31st floor. The hysteresis energy above the 32nd floor is entirely borne by the frame beams.
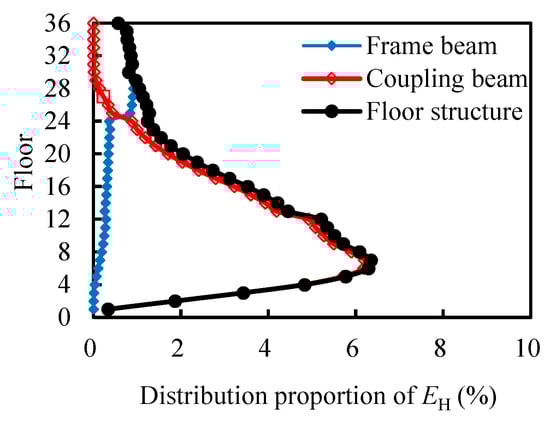
Figure 10.
Hysteresis energy distribution of the high-rise structure along floors under near-field pulse-like ground motions during an 8-degree frequent earthquake.
(2) Hysteresis energy distribution along the floors during an 8-degree design earthquake and rare earthquake
Figure 11 presents the hysteresis energy distribution of frame beams, coupling beams, and shear walls along the floors under near-field pulse-like ground motions during an 8-degree design and rare earthquake. The following can be seen:
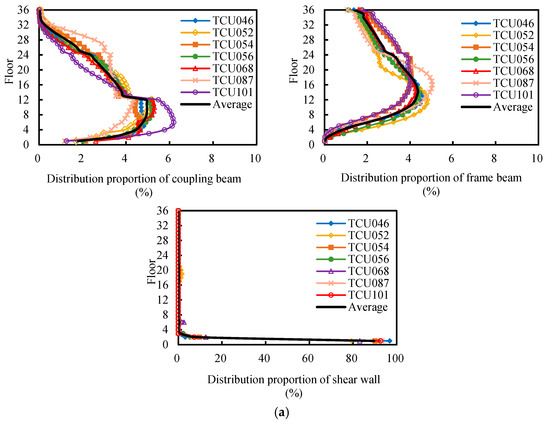
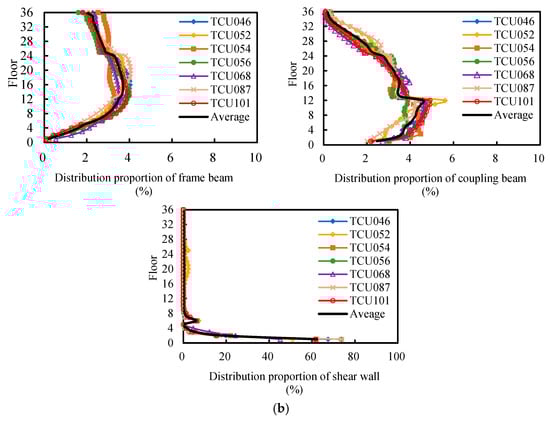
Figure 11.
Hysteresis energy distribution of structural members along floors under near-field pulse-like ground motions. (a) 8-degree design earthquake; (b) 8-degree rare earthquake.
① The hysteresis energy proportion of frame beams on the bottom floor is very small. As the floor rises, the proportion gradually increases, reaching its maximum at the 12th and 18th floors, that is, at 1/3 to 1/2 of the structural height, accounting for about 3.5% to 4.8% of the EH-Frame beam. After that, as the floor level increases, the proportion begins to decrease slowly, averaging about 1.8% to 2.0% at the top floor. Overall, the hysteresis energy dissipation of frame beams on the lower floors is very small, while that on the middle and upper floors is relatively large.
② The hysteresis energy proportion of coupling beams increases gradually from the bottom floor, peaks at the 6th to 12th floors, that is, at 1/6 to 1/3 of the structural height, accounting for about 3.9% to 6.2% of the EH-Coupling beam. After that, as the floor level rises, the proportion decreases gradually, becoming negligible above the 32nd floor. In summary, the hysteresis energy dissipation of coupling beams is primarily confined to the lower floors.
③ The hysteresis energy dissipation of shear walls is mainly confined to the 1st floor, accounting for approximately 89.7% and 62.1% of the EH-Shear wall during an 8-degree design earthquake and rare earthquake, respectively, and are the main energy-dissipating regions. As the floor level rises, the hysteresis energy of shear walls decreases sharply. During an 8-degree earthquake and rare earthquake, respectively, it is about 8.2% and 18.5% of the EH-Shear wall on the 2nd floor, and it is approximately 0.9% and 5.3%, respectively, of the EH-Shear wall on the 3rd floor. Above the 3rd floor, the shear walls remain nearly elastic and do not participate in energy dissipation.
In order to more clearly understand the hysteresis energy distribution along the floors, Figure 12 presents the average proportion of the hysteresis energy of the frame beams, coupling beams, shear walls and floor structure on each floor to the total hysteresis energy under near-field pulse-like ground motions during 8-degree design and rare earthquakes, respectively. The results reveal that the hysteresis energy dissipation of the structure first decreases, then increases, and decreases again as the floor rises. During an 8-degree design earthquake, the hysteresis energy proportion of the 12th floor is the largest, accounting for 4.4%. The hysteresis energy of the 1st floor is primarily dissipated by shear walls, accounting for 75.9% of the total hysteresis energy of that floor. Above the 2nd floor, the hysteresis energy of the structure is mainly borne by coupling beams and frame beams. Among them, the 2nd to 6th floors primarily rely on coupling beams to dissipate the hysteresis energy, accounting for 55.4–81.9% of the hysteresis energy of each floor; while the 7th to 36th floors mainly rely on frame beams to dissipate the hysteresis energy, accounting for more than 50.2% of the hysteresis energy of each floor. In particular, above the 32nd floor, the hysteresis energy is almost entirely dissipated by frame beams. During an 8-degree rare earthquake, the hysteresis energy of the 1st floor is the largest, accounting for 8.1%. The hysteresis energy of the 1st to 2nd floors is mainly dissipated by shear walls, accounting for 93.4% and 71.5% of the total hysteresis energy of that floor, respectively. Above the 3rd floor, the hysteresis energy of the structure is mainly borne by frame beams, and above the 8th floor frame beams dissipate at least 80% of the hysteresis energy of each floor.
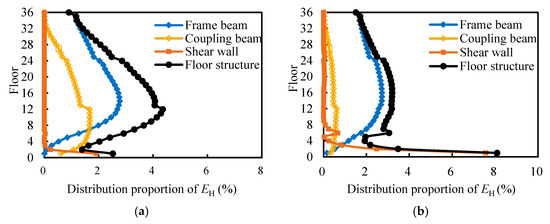
Figure 12.
Hysteresis energy distribution of the high-rise structure along floors under near-field pulse-like ground motions. (a) 8-degree design earthquake; (b) 8-degree rare earthquake.
It is noteworthy that compared with unidirectional input, the bidirectional ground motion input is more representative of real seismic scenarios, leading to more complex distribution of energy dissipation among structural members. A comparative study with unidirectional input results is recommended for future research to elucidate these interaction effects.
6. Conclusions
Seven groups of near-field pulse-like ground motions and three groups of ordinary ground motions were selected and bidirectionally inputted into a symmetrical high-rise structure to comparatively study the deformation and energy dissipation characteristics of the structure. The following conclusions can be drawn:
(1) At the same earthquake level, the inter-story drift angles of the structure under near-field pulse-like ground motions are significantly larger than those under ordinary ground motions, and the maximum values are approximately 0.72 to 2.56 times and 1.21 to 3.94 times the code limit during 8-degree design and rare earthquakes, respectively. Furthermore, the floors with the maximum drift angles shift downward. Therefore, high-rise structures designed according to the current structural design code may suffer unpredictable damage under near-field pulse-like ground motions.
(2) The input energy of the structure under near-field pulse-like ground motions consistently surpasses that under ordinary ground motions. More critically, the energy dissipation mechanism differs fundamentally. Under ordinary ground motions, damping energy dissipation remains dominant. In contrast, under near-field pulse-like ground motions, hysteresis energy dissipation is the main mode.
(3) Under near-field pulse-like ground motions, during 8-degree frequent earthquakes, coupling beams are the main energy-dissipating members and frame beams dissipate the remaining smaller proportion. During 8-degree design earthquakes and 8-degree rare earthquakes, frame beams become the main energy-dissipating members, the hysteresis energy ratio of coupling beams significantly reduces, and the hysteresis energy ratio of shear walls gradually increases.
(4) Under near-field pulse-like ground motions, during 8-degree frequent earthquakes, the floors below 2/3 of the structural height mainly dissipate hysteresis energy by coupling beams, while the floors above 2/3 of the structural height mainly dissipate hysteresis energy by frame beams. During 8-degree design earthquakes, the hysteresis energy of the 1st floor, 2nd to 6th floors and 7th to 36th floors is mainly dissipated by the shear walls, coupling beams and frame beams, respectively. During an 8-degree rare earthquake, the hysteresis energy on the 1st to 2nd floors is mainly dissipated by shear walls, while above the third floor, it is mainly borne by frame beams.
Author Contributions
All authors of this paper have made objective contributions within the scope of their respective job responsibilities, as detailed below: Conceptualization, L.J.; methodology, L.G.; software, J.D.; validation, J.D.; investigation, L.J.; resources, J.D.; data curation, L.J. and L.G.; writing—original draft preparation, L.J.; writing—review and editing, L.G.; project administration, L.J.; funding acquisition, L.G. All authors have read and agreed to the published version of the manuscript.
Funding
The research was funded by the Youth Project of the Natural Science Foundation of Jiangsu Province (BK20241099), the Natural Science Foundation of the Jiangsu Higher Education Institutions of China (23KJB410002), and the Youth Project of Suqian Science and Technology Plan (K202418).
Data Availability Statement
The original contributions presented in the study are included in the article, further inquiries can be directed to the corresponding authors.
Acknowledgments
This article especially acknowledges the contributions of all the authors in the conception, data collection and analysis, and the writing process of this article.
Conflicts of Interest
The authors declare no conflicts of interest.
References
- Xu, L.J.; Hu, J.J.; Xie, L.L. On characteristics of ground motion parameters for special long-period ground motions. Earthq. Eng. Struct. Dyn. 2008, 28, 20–27. [Google Scholar]
- Cheng, Y.; Bai, G.L. Basic characteristic parameters and influencing factors of long-period ground motion records. J. Vibroeng. 2017, 19, 5191–5207. [Google Scholar] [CrossRef]
- Wang, G.Q.; Zhou, X.Y.; Zhang, P.Z. Characteristics of amplitude and duration for near fault strong ground motion from the 1999 Chi-Chi, Taiwan earthquake. Soil Dyn. Earthq. Eng. 2002, 22, 73–96. [Google Scholar] [CrossRef]
- Somerville, P.G. Magnitude scaling of the near fault rupture directivity pulse. Phys. Earth Planet. Inter. 2003, 137, 201–212. [Google Scholar] [CrossRef]
- Bray, J.D.; Rodriguez-Marek, A. Characterization of forward-directivity ground motions in the near-fault region. Soil Dyn. Earthq. Eng. 2004, 24, 815–828. [Google Scholar] [CrossRef]
- Yang, D.X.; Wang, W. Nonlocal period parameters of frequency content characterization for near-fault ground motions. Earthq. Eng. Struct. Dyn. 2012, 38, 1257–1280. [Google Scholar] [CrossRef]
- Li, M. Study of the Effect of Near-Fault Ground Motion on Structural Seismic Design. Ph.D. Thesis, Institute of Engineering Mechanics, China Earthquake Administration, Harbin, China, 2010. [Google Scholar]
- Jia, J.F.; Du, X.L.; Han, Q. A state-of-the-art review of near-fault earthquake ground motion characteristics and effects on engineering structures. J. Build. Struct. 2015, 36, 1–12. [Google Scholar]
- Babak, A.; Krawinkle, H. Behavior of moment-resisting frame structures subjected to near-fault ground motions. Earthq. Eng. Struct. Dyn. 2004, 33, 687–706. [Google Scholar]
- Ma, X.T.; Bao, C.; Zhang, L.X.; Xu, F.Z.; Lu, H. Dynamic performance analysis of hybrid structures with different vertical stiffness under near-field earthquakes. Chin. Earthq. Eng. J. 2019, 41, 860–865. [Google Scholar]
- Jiang, Y.; Yang, D.X.; Li, G. Effects of forward directivity and fling step of near-fault ground motions on seismic responses of high-rise steel structure. J. Build. Struct. 2010, 31, 103–110. [Google Scholar]
- Hu, Y.; Jiang, L.Q.; Ye, J.H.; Zhang, X.S.; Jiang, L.Z. Seismic responses and damage assessment of a mid-rise cold-formed steel building under far-fault and near-fault ground motions. Thin-Walled Struct. 2021, 163, 107690. [Google Scholar] [CrossRef]
- Emamikoupaei, P.; Bigdeli, A.; Tsavdaridis, K.D. Nonlinear seismic response of mid-rise modular buildings subjected to near-field ground motions. J. Constr. Steel Res. 2023, 201, 107696. [Google Scholar] [CrossRef]
- Khademi, M.; Tehranizadeh, M.; Shirkhani, A.; Hajirasouliha, I.; Yang, T.Y. Effects of near-field pulse-like ground motions on the seismic resilience of RC shear wall buildings. Structures 2024, 70, 107585. [Google Scholar] [CrossRef]
- Yang, F.J.; Wang, G.X.; Ding, Y. Sensitivity analysis of reinforced concrete frame structures under near-fault pulse-like ground motions using a broadband simulation method. J. Earthq. Eng. 2020, 24, 2046–2071. [Google Scholar] [CrossRef]
- Zhang, K.; Zuo, Z.X.; Gong, M.S.; Wang, X.M.; Zhao, Y.N.; Liu, B. The influence of forward-directivity pulse-like ground motion orientation angles on structural collapse capacity. Soil Dyn. Earthq. Eng. 2025, 191, 109280. [Google Scholar] [CrossRef]
- Majdi, A.; Kontoni, D.N.; Almujibah, H. Correlation of the Near-Fault Pulse-like Ground Motion Characteristics with the Vulnerability of Buildings. Buildings 2024, 14, 2801. [Google Scholar] [CrossRef]
- Zhang, Y.T.; Ouyang, X.Y.; Sun, B.Y.; Shi, Y.A.; Wang, Z. A comparative study on seismic fragility analysis of RC frame structures with consideration of modeling uncertainty under far-field and near-field ground motion excitation. Bull. Earthq. Eng. 2022, 20, 1455–1487. [Google Scholar] [CrossRef]
- Kunnath, S.K.; Chai, Y.H. Cumulative damage-based inelastic cyclic demand spectrum. Eng. Struct. Dyn. 2004, 33, 499–520. [Google Scholar] [CrossRef]
- Miao, Z.W.; Ye, L.P. Study on Distribution of cumulative hysteretic energy in reinforced concrete frame-coupled wall. Eng. Mech. 2010, 27, 130–141. [Google Scholar]
- Li, K.; Shi, Q.X.; Wang, P.; Wang, N.; Wang, Q.W. Seismic response energy analysis for reinforced concrete frame-core wall structures. J. Vib. Shock. 2014, 33, 115–119+124. [Google Scholar]
- Bo, W.B.; Fu, L.H.; Lu, H.Y.; Xu, G.Y. Research on seismic energy distribution and dissipation of reinforced concrete frame-wall high-rise structure. J. Archit. Civ. Eng. 2015, 32, 38–45. [Google Scholar]
- Ye, L.P.; Cheng, G.Y.; Qu, Z.; Lu, X.Z. Study on energy-based seismic design method and application on steel braced frame structures. J. Build. Struct. 2012, 33, 36–45. [Google Scholar]
- Miao, Z.W.; Ye, L.P. Study on energy dissipation mechanism of reinforced concrete frame-shear wall structure under rare earthquakes. J. Build. Struct 2013, 34, 45–52. [Google Scholar]
- Wang, P.; Shi, Q.X.; Wang, F.; Wang, Q.W.; Zheng, X.L.; Wang, B. Study of mode of energy dissipation and damage of SRC frame-RC core wall structures under strong earthquake actions. Ind. Constr. 2015, 45, 91–98. [Google Scholar]
- Cheng, Y.; Bai, G.L.; Dong, Y.R. Spectrum characterization of two types of long-period ground motions and seismic behavior of frame-core wall structures under multi-dimensional earthquake records. Struct. Des. Tall Spec. Build. 2018, 27, e1539. [Google Scholar] [CrossRef]
- Jiang, L.J.; Bai, G.L.; Guo, L.; Li, F.M. Seismic damage assessment of SRC frame-RC core tube high-rise structure under long-period ground motions. Buildings 2025, 15, 3106. [Google Scholar] [CrossRef]
- Jiang, L.J. Research on Damage Performance of SRC Frame-RC Core Tube Super High-Rise Hybrid Structure Under Long-Period Ground Motions. Ph.D. Thesis, Xi’an University of Architecture and Technology, Xi’an, China, 2020. [Google Scholar]
- Yan, P.L.; Sun, B.T. Fundamental natural vibration periods testing and regression analysis for typical high-rise buildings in Shanghai. J. Vib. Shock. 2019, 38, 103–108. [Google Scholar]
- Li, X.H.; Wang, W.K.; Wu, D.; Li, X.L.; Li, Z.J.; Li, Y.X. The bounded method and characteristics analysis for long-period ground motions. J. Vib. Eng. 2014, 27, 685–692. [Google Scholar]
- Dicleli, M.; Buddaram, S. Effect of isolator and ground motion characteristics on the performance of seismic-isolated bridges. Earthq. Eng. Struct. Dyn. 2006, 35, 233–250. [Google Scholar] [CrossRef]
- Luo, Q.B.; Dai, F.; Liu, Y.; Gao, M.; Jiang, R. Seismic performance assessment of velocity pulse-like ground motions under near-field earthquakes. Rock Mech. Rock Eng. 2021, 54, 3799–3816. [Google Scholar] [CrossRef]
- Xie, J.J.; Li, X.J.; Wen, Z.P. The amplification effects of near-fault distinct velocity pulses on response spectra. Eng. Mech. 2017, 34, 194–211. [Google Scholar]
- Zhang, L.Q.; Yu, J.J. Study on the fitting of the long-period ground motion acceleration response spectrum based on genetic algorithm. J. Nat. Disasters. 2019, 28, 17–27. [Google Scholar]
- Zhai, C.H.; Chang, Z.W.; Li, S. Quantitative identification of near-fault pulse-like ground motions based on energy. Bull. Seismol. Soc. Am. 2013, 103, 2591–2603. [Google Scholar] [CrossRef]
Disclaimer/Publisher’s Note: The statements, opinions and data contained in all publications are solely those of the individual author(s) and contributor(s) and not of MDPI and/or the editor(s). MDPI and/or the editor(s) disclaim responsibility for any injury to people or property resulting from any ideas, methods, instructions or products referred to in the content. |
© 2025 by the authors. Licensee MDPI, Basel, Switzerland. This article is an open access article distributed under the terms and conditions of the Creative Commons Attribution (CC BY) license (https://creativecommons.org/licenses/by/4.0/).