Abstract
Body measurement plays a crucial role in cattle breeding selection. Traditional manual measurement of cattle body size is both time-consuming and labor-intensive. Current automatic body measurement methods require expensive equipment, involve complex operations, and impose high computational costs, which hinder efficient measurement and broad application. To overcome these limitations, this study proposes an efficient automatic method for cattle body measurement. Lateral and dorsal image datasets were constructed by capturing cattle keypoints characterized by symmetry and relatively fixed positions. A lightweight SCW-YOLO keypoint detection model was designed to identify keypoints in both lateral and dorsal cattle images. Building on the detected keypoints, 11 body measurements—including body height, chest depth, abdominal depth, chest width, abdominal width, sacral height, croup length, diagonal body length, cannon circumference, chest girth, and abdominal girth—were computed automatically using established formulas. Experiments were performed on lateral and dorsal datasets from 61 cattle. The results demonstrated that the proposed method achieved an average relative error of 4.7%. Compared with the original model, the parameter count decreased by 58.2%, compute cost dropped by 68.8%, and model size was reduced by 57%, thus significantly improving lightweight efficiency while preserving acceptable accuracy.
1. Introduction
With the development of modern agriculture and animal husbandry, livestock breeding has become increasingly important for improving production efficiency and ensuring food safety []. Advances in breeding technology directly affect livestock growth rate, health status, disease resistance, and the quality of meat and milk, all of which collectively determine the economic efficiency and market competitiveness of the livestock industry []. Cattle breeding is vital in the development of the cattle industry []. Body measurement, as an essential step in assessing livestock growth and development as well as selecting breeding stock, is crucial for precision breeding and improving livestock productivity []. Cattle body measurement data not only reflect the animal’s growth status and health condition but can also be used to assess genetic potential, providing important scientific evidence for breeding selection []. However, traditional cattle body measurements rely primarily on manual tools such as measuring sticks, tape measures, and calipers, which often induce varying degrees of stress in animals, compromise animal welfare, and increase both operator injury risk and measurement errors []. Consequently, conventional measurement methods are inadequate for large-scale, intensive farming and fail to meet the modern livestock industry’s demand for efficient and accurate data collection []. Therefore, developing rapid, accurate, and non-contact methods for cattle body measurement is a pressing issue that needs to be addressed []. The development of computer vision and artificial intelligence has created new opportunities for livestock body measurement []. Currently, livestock body measurement—particularly for cattle—mainly includes clustering-based methods using traditional machine learning, three-dimensional (3D) point cloud-based methods, object detection and instance segmentation-based methods, and keypoint detection-based methods. Clustering-based livestock body measurement methods using traditional machine learning can achieve non-contact measurement, thus improving animal welfare while saving labor and time. Zhang et al. [] employed an automatic foreground extraction algorithm based on Simple Linear Iterative Clustering (SLIC) and Fuzzy C-Means (FCM), combined with a midline extraction algorithm for symmetric bodies and a measurement point extraction algorithm, to derive segmented images and measurement points for sheep body measurement. Zheng et al. [] extracted cattle contour images using a fuzzy clustering algorithm, then used interval segmentation, curvature calculation, skeleton extraction, and pruning methods to derive keypoint information for cattle body measurement. Although these body measurement methods have made progress in automation, they still suffer from poor algorithmic robustness and limited detection accuracy.
Livestock body measurement methods based on deep learning and instance segmentation have achieved notable research progress. Qin et al. [] employed a Mask R-CNN network to identify sheep positions, used image binarization to extract sheep contours, and then used OpenCV’s ConvexHull function along with the U-chord length curvature method to derive body measurement points, thus calculating sheep body dimensions. Ai et al. [] used SOLOv2 instance segmentation to detect cattle and extract their body contours, used OpenCV to identify characteristic body parts, extracted keypoints via a discrete curvature calculation method, and computed cattle body measurements using the Euclidean distance method. Wang et al. [] employed the YOLOv5_Mobilenet_SE network to detect key anatomical regions of newborn piglets, from which they extracted keypoints and calculated body measurements. Peng et al. [] used a YOLOv8-based network to detect the posture and identity of yaks, then used the Canny and Sobel edge detection algorithms to extract yak contours for subsequent body measurement. Qin et al. [] proposed a method for measuring sheep body dimensions from multiple postures. They used Mask R-CNN to identify the contours and postures of sheep in back view and side view images, located points via the ConvexHull function, and calculated body measurements through real-distance conversion. Although these methods have made certain breakthroughs in measurement stability, they still involve complex procedures and require large amounts of data.
Livestock body measurement methods based on 3D point clouds support a wide range of measurement categories and offer high accuracy in 3D body measurements. Yang et al. [] used the Structure-from-Motion (SfM) photogrammetry method combined with Random Sample Consensus (RANSAC) to extract point clouds of dairy cattle, completed missing data using a spline curve smoothing-based completion method, and then employed morphological techniques to measure cattle body dimensions. Li et al. [] extracted body measurements of beef cattle from point cloud data by obtaining 12 micro-posture feature parameters from the head, back, torso, and legs, and refined posture errors using parameter adjustments to achieve more accurate body measurements. Jin et al. [] developed a non-contact automatic measurement system for goat body dimensions. Using an improved PointStack model, they segmented goat point clouds into distinct parts, used a novel keypoint localization method to identify measurement points, and subsequently obtained goat body measurements. Weng et al. [] proposed a cattle body measurement system that integrates the PointNet++-based Dynamic Unbalanced Octree Grouping (DUOS) algorithm with an efficient body measurement method derived from segmentation results, enabling automatic cattle measurement through the identification of key body regions and contour extraction. Lu et al. [] developed a two-stage coarse-to-fine method for cattle measurement by incorporating shape priors, posture priors, mesh refinement, and mesh reconstruction into the processing of cattle point clouds. Hou et al. [] used the CattlePartNet network to precisely segment cattle point clouds into key anatomical regions, identified and extracted measurement points using Alpha curvature, and measured body dimensions through slicing and cubic B-spline curve fitting. Xu et al. [] proposed a method for pig body measurement based on geodesic distance regression for direct detection of point cloud keypoints. They transformed the semantic keypoint detection task into a regression problem of geodesic distances from the point cloud to keypoints using heatmaps and used an improved PointNet++ encoder–decoder architecture to learn distances on the manifold, thus obtaining pig body measurements. Although these methods have further improved the range and accuracy of body measurements, they are limited by the high cost of measurement equipment, the large size of point cloud data, and the complexity of point cloud data processing.
In recent years, advances in human pose estimation and keypoint detection models have demonstrated significant advantages for livestock body measurement. Especially for keypoints with symmetry, as they exhibit bilateral symmetry in planar graphics, they can be better utilized for network model training, improvement, and error correction [,,]. Keypoints with relatively fixed positions, as they maintain a relatively fixed position across different image objects, assist the network model in performing efficient detection and cost-saving. Li et al. [] employed the Lite-HRNet network to detect keypoints for cattle body measurements and used Global–Local Path Networks to derive relative depth values. These were then converted into actual measurements of body height, body diagonal length, chest depth, and hoof diameter through real-distance calibration and the RGB camera imaging principle. Peng et al. [] extracted cattle body keypoints using YOLOv8-pose, mapped them to depth images, and used filtering. They then calculated body height, hip height, body length, and chest girth of beef cattle using Euclidean distance, Moving Least Squares (MLS), Radial Basis Functions (RBFs), and Cubic B-Spline Interpolation (CB-SI). Bai et al. [] used a Gaussian pyramid algorithm to convert cattle images into multi-scale representations and used the MobilePoseNet algorithm with scale alignment and fusion to derive high-precision keypoints. Diagonal body length, body height, chest girth, and rump length were then computed using Ramanujan’s equations and related formulas. Yang et al. [] used the CowK-Net network to extract two-dimensional (2D) cattle body keypoints, converted them to 3D keypoints using camera parameters, and used the RANSAC algorithm to detect the ground plane in the point cloud. The distances between keypoints were then calculated to derive diagonal body length, body height, hip height, and chest depth. Deng et al. [] captured side view images of cattle using a stereo camera, obtained depth information from the images using the CREStereo algorithm, and detected cattle body keypoints with the MobileViT-Pose algorithm. By combining depth data with keypoint coordinates, they calculated body height, body length, hip height, and rump length.
Keypoint detection-based approaches have simplified the process of cattle body measurement; however, because these models must perform both object detection and precise keypoint localization, they often suffer from high model complexity, a large number of parameters, substantial computational demands, and a limited range of measurable traits. YOLOv11 [], developed by Ultralytics, is a deep learning network composed of a backbone, neck, and head, offering high accuracy and fast inference speed. The YOLOv11 family includes multiple task-specific models—pose estimation (YOLOv11-pose), object detection (YOLOv11-detect), instance segmentation (YOLOv11-segment), and image classification (YOLOv11-classify)—as well as models of various scales (YOLOv11n, YOLOv11s, YOLOv11m, YOLOv11l, and YOLOv11x) []. YOLOv11-pose unifies keypoint detection and object detection within a single network, significantly improving both the speed and accuracy of keypoint estimation. Its multi-scale feature fusion enables high-precision localization of keypoints across varying object sizes and complex backgrounds, while maintaining strong real-time performance and computational efficiency, thus reducing computational overhead without compromising accuracy []. Therefore, for efficient cattle body keypoint detection, this study adopts YOLOv11n-pose [], the most lightweight pose estimation model in the YOLOv11 series. Nevertheless, due to its multi-task nature (object and keypoint detection) and multi-layer convolutional operations, YOLOv11n-pose still faces challenges such as a large number of parameters, high computational complexity, and considerable model size. Building on YOLOv11n-pose, this study proposes S2FE C2DRA WTPHead-YOLO (SCW-YOLO), a novel lightweight cattle body keypoint detection model with the following enhancements:
(1) A novel feature extraction module, ShuffleNet V2 Feature Extraction (S2FE), was designed to efficiently extract cattle keypoint features while reducing the number of model parameters and compute cost, thus decreasing the overall model size. (2) A new attention mechanism, Cross-Stage Partial with Depthwise Convolution and Channel Reduction Attention (C2DRA), was introduced to enhance global information extraction capability for cattle while simultaneously reducing computational overhead. (3) A novel keypoint detection head, Wavelet Convolution Pose Head (WTPHead), was designed to effectively expand the receptive field and further improve the lightweight nature of the model.
Using the constructed lateral and dorsal image datasets of cattle, the SCW-YOLO model designed in this study was used to extract 15 keypoints with symmetry and relatively fixed positions from cattle images, and to the body height, chest depth, abdominal depth, chest width, abdominal width, rump height, rump length, diagonal body length, cannon circumference, chest girth, and abdominal girth—11 body measurements required for breeding—were calculated using established formulas. Experiments conducted on the lateral and dorsal datasets showed that the proposed method achieved an average relative error of 4.7% in body measurement. Compared with the original YOLOv11n-pose model, the parameter count, compute cost, and model size were reduced by 58.2%, 68.8%, and 57%, respectively. These results demonstrate that the proposed approach provides an efficient and accurate solution for automated cattle body measurement.
2. Materials and Methods
2.1. Dataset Collection
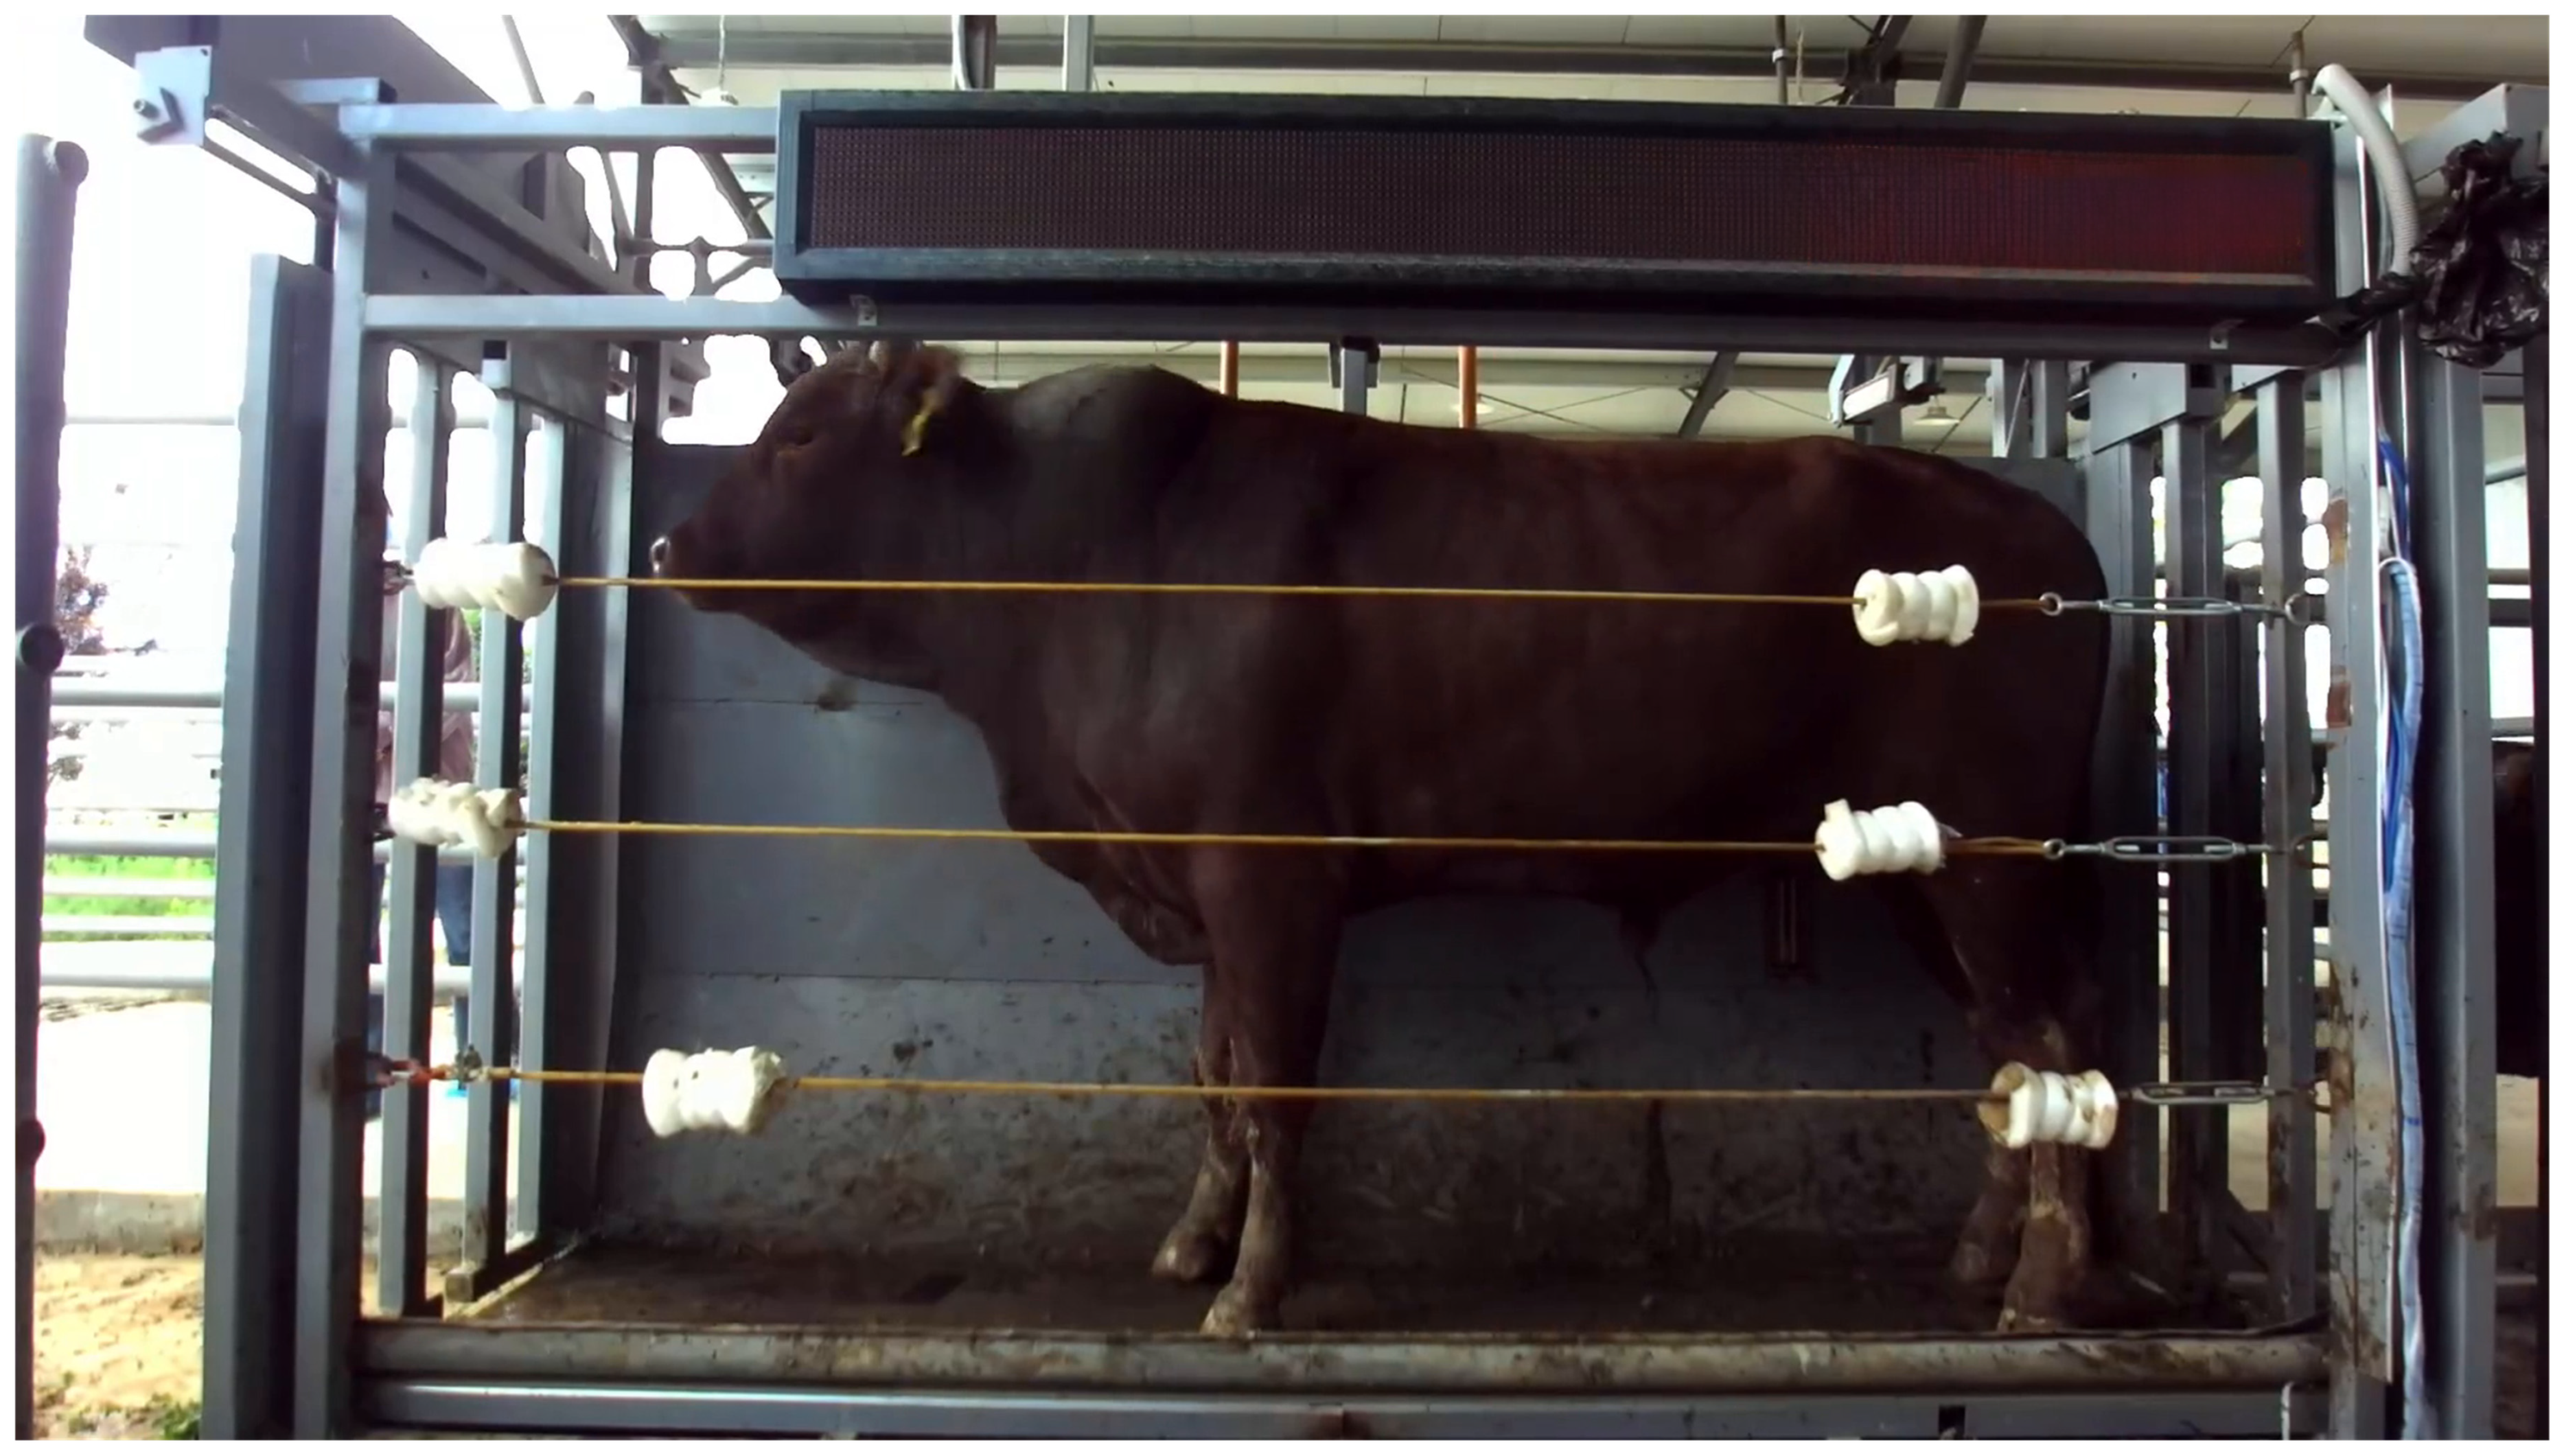
The data in this study were collected from 61 cattle belonging to the same herd at a farm in Pingliang, Gansu Province, China. Data collection was performed during different periods of the day (morning and afternoon) in June and July 2023. Figure 1 shows the data-collection environment, where natural lighting was used. A fixed passageway system was used to ensure that the cattle maintained a stable standing posture during image capture. Only one animal was allowed to pass through at a time to minimize stress and ensure the safety of personnel. The image capture system consisted of two Hikvision MV-CU020-19GC cameras (Hangzhou, China), each with dimensions of 29 mm × 29 mm × 42 mm, both capturing RGB images. The lateral view camera was positioned 85 cm above the ground and 200 cm from the side of the animal, while the dorsal view camera was installed 160 cm above the ground. The lateral camera was aligned perpendicularly to the side of the passageway, with the passage width adjusted to ensure that the cattle remained parallel to the passage wall. The dorsal camera was positioned perpendicularly to the base of the passageway to ensure the accuracy and reliability of data collection.
Figure 1.
Data collection environment.
2.2. Dataset Preparation
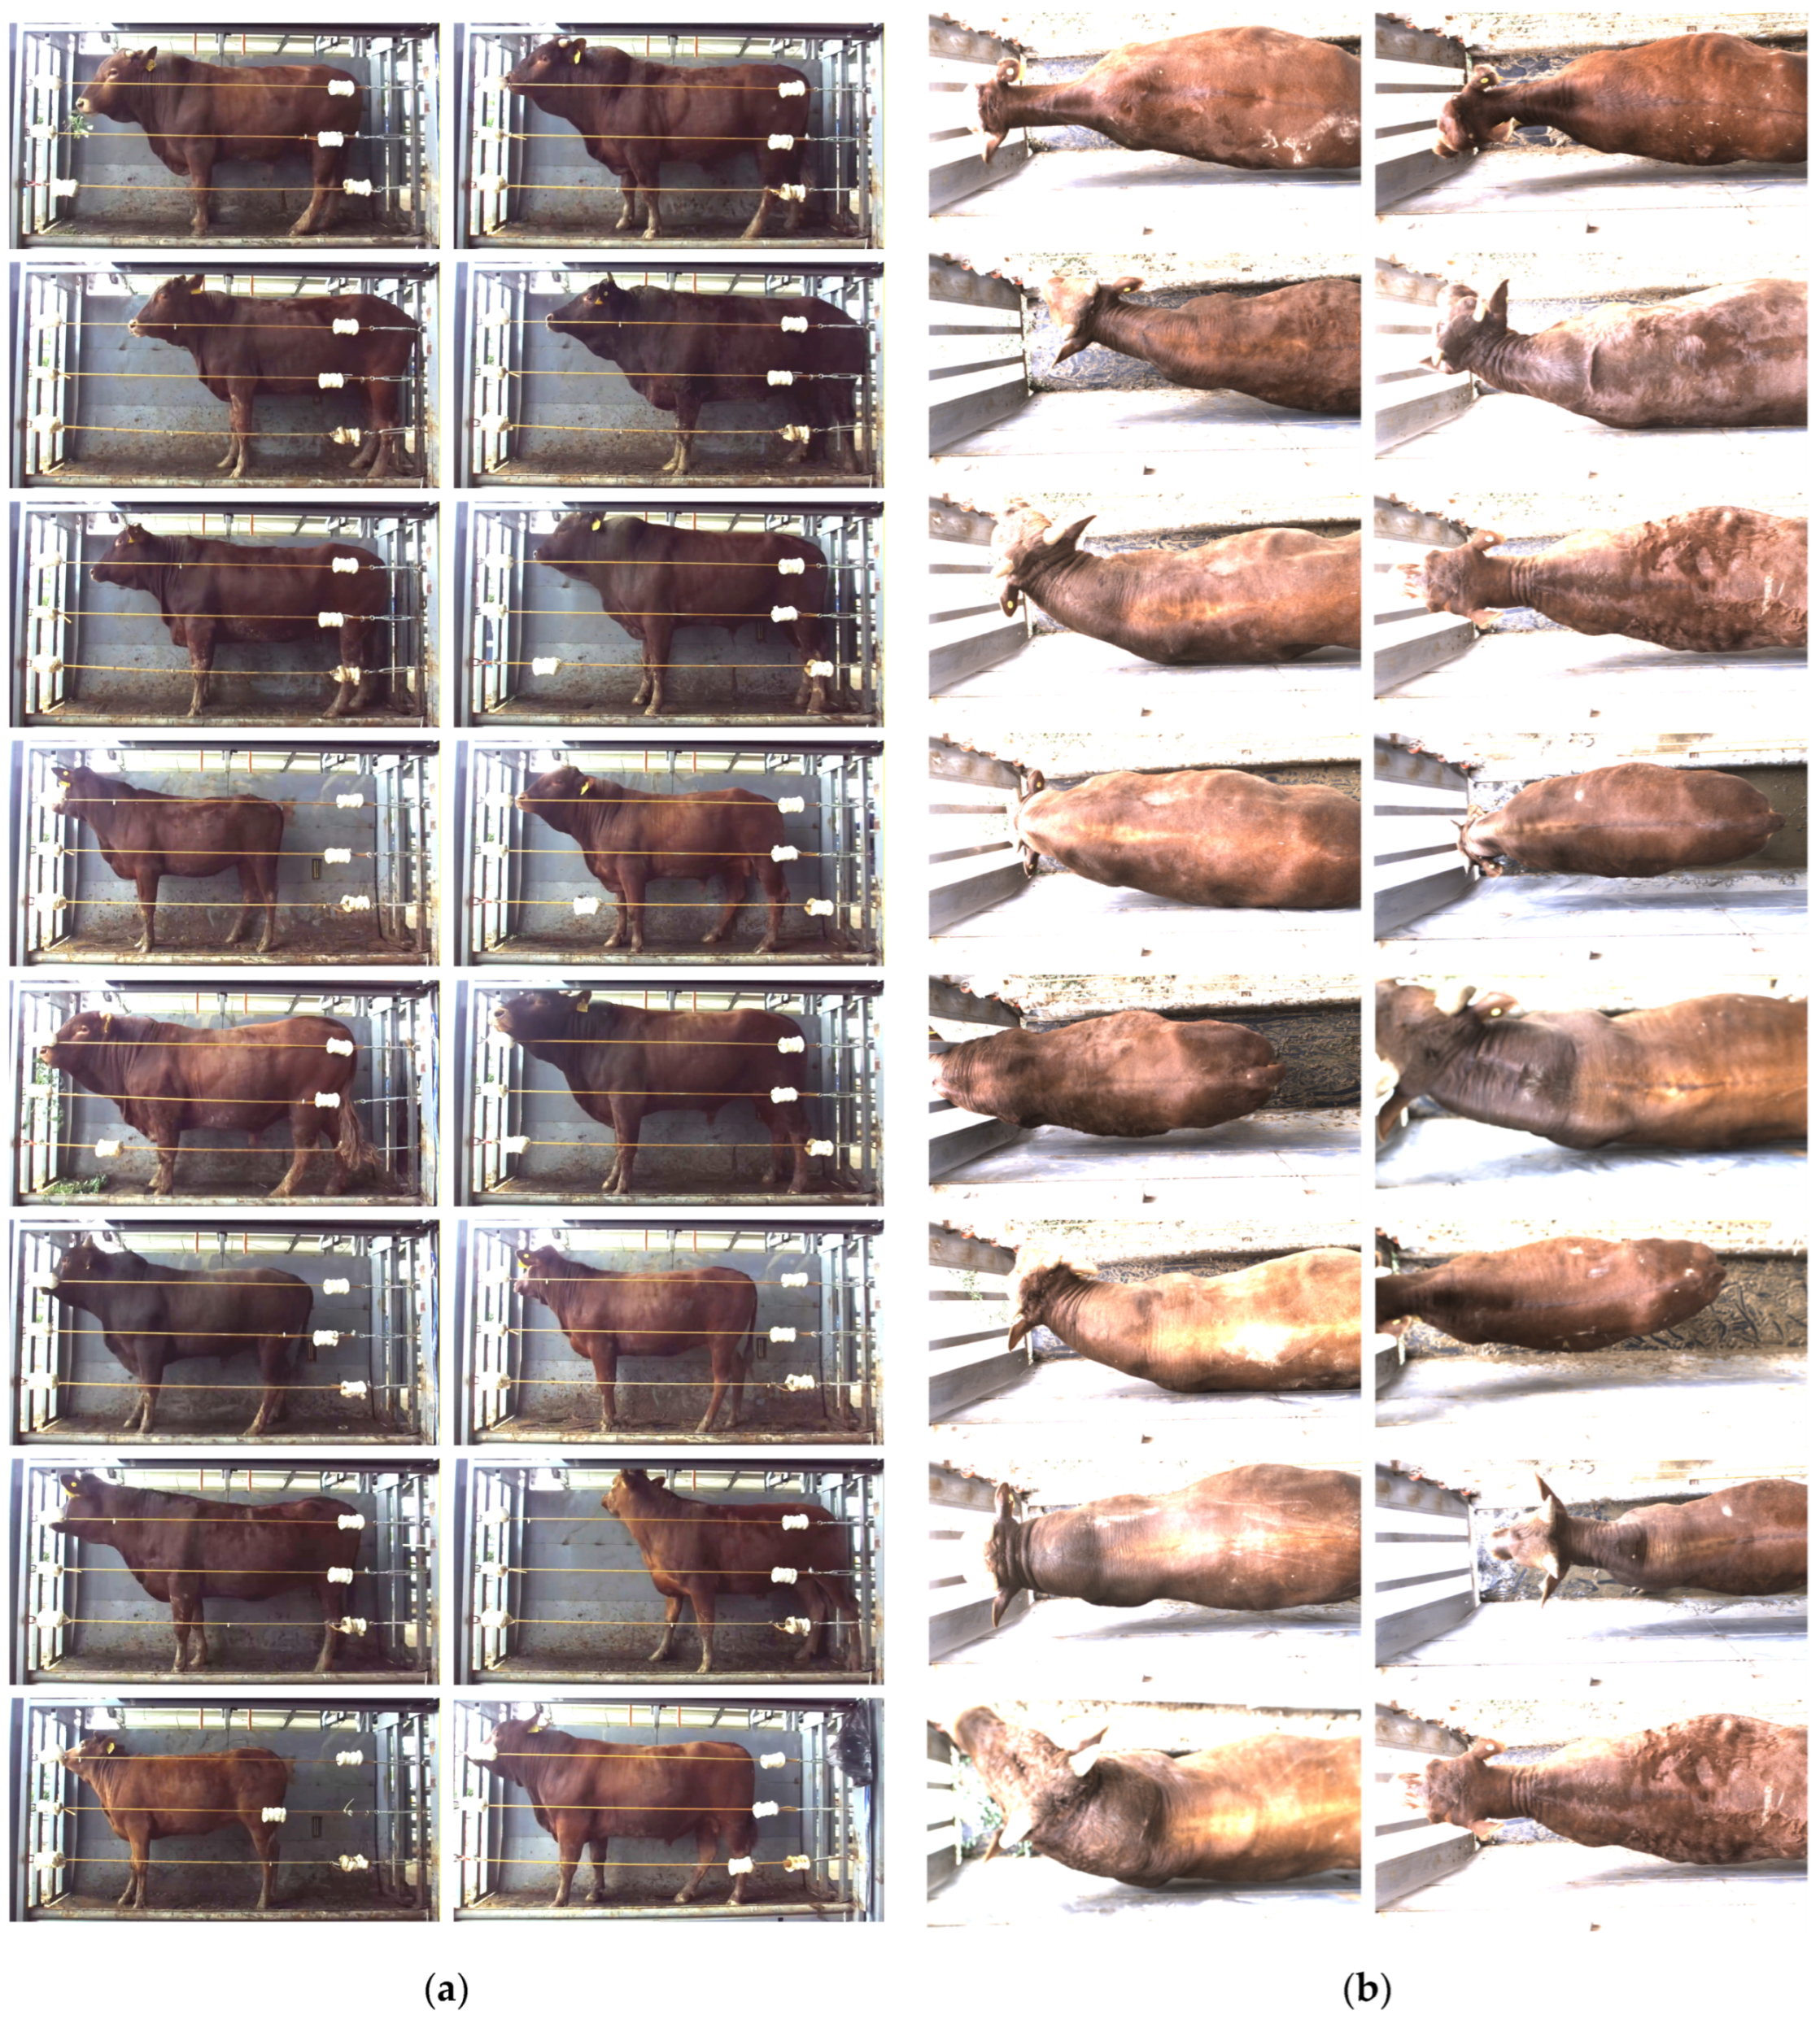
The collected image data were manually screened, and unusable images caused by equipment misplacement or camera errors were discarded. The lateral images of cattle were more complex and required the detection of numerous keypoints; therefore, data augmentation was performed on the lateral samples by adjusting brightness, sharpness, and contrast. Since the dorsal images of cattle were relatively dark, their quality was improved by increasing brightness and applying related enhancements. All images were cropped to a uniform resolution of 1600 × 840 pixels using Python 3.8, and then randomly split into training, validation, and test sets at a 7:2:1 spilt. The Labelme annotation tool was used to label 11 keypoints on the lateral images and 4 keypoints on the dorsal images. A total of 9150 cattle images (6100 lateral and 3050 dorsal) were generated, completing the dataset preparation, as illustrated in Figure 2.
Figure 2.
Example images from the cattle dataset. (a) Example image from the lateral dataset; (b) Example image from the dorsal dataset.
2.3. Measurement Indicators
To measure cattle body size, it is first necessary to localize keypoints with symmetry and fixed relative positions. In the lateral view images, 11 keypoints were identified: the highest point of the withers, forelimb ground point, chest base point, posterior edge of the withers, abdominal bottom point, lumbar vertebra point, sacral point, anterior edge of the shoulder, posterior edge of the ischial tuberosity, and the left and right forelimb points. Among these, the chest base point and posterior edge of the withers, abdominal bottom point and lumbar vertebra point, and left and right forelimb points form 3 pairs of symmetric keypoints, while the highest point of the withers and forelimb ground point, sacral point and posterior edge of the ischial tuberosity, and anterior edge of the shoulder and posterior edge of the ischial tuberosity form 3 pairs of keypoints with fixed relative positions. In the dorsal view images, 4 keypoints were annotated: the left and right posterior edges of the withers, and the left and right points of the abdominal girth. Among these, the left and right posterior edges of the withers and the left and right points of the chest girth form 2 pairs of symmetric keypoints. Building on the localized keypoints, together with the corresponding body measurement formulas and camera calibration parameters, 11 body measurements were calculated, including body height, chest depth, abdominal depth, chest width, abdominal width, sacral height, rump length, diagonal body length, cannon circumference, chest girth, and abdominal girth, as shown in Table 1 and Figure 3.
Table 1.
Standards for cattle morphometric measurements.
Figure 3.
Localization of cattle body measurement keypoints and corresponding morphometric measurement standards. (a) Keypoints of cattle body measurements. A. Highest point of the withers, B. Ground point of the forelimb, C. Chest base point, D. Rear edge of the withers point, E. Abdominal base point, F. Lumbar vertebra point, G. Sacral region point, H. Front edge of the shoulder point, I. Rear edge of the ischial tuberosity point, J. Left forelimb point, K. Right forelimb point, L. Rear edge of the left withers point, M. Rear edge of the right withers point, N. Right chest circumference point, O. Left chest circumference point. (b) Morphometric measurement indices. 1. Body height, 2. Chest depth, 3. Abdominal depth, 4. Chest Width, 5. Abdominal Width, 6. Sacral height, 7. Croup length, 8. Diagonal body length, 9. Cannon circumference, 10. Chest Girth, 11. Abdominal Girth.
2.4. Workflow for Cattle Body Measurement
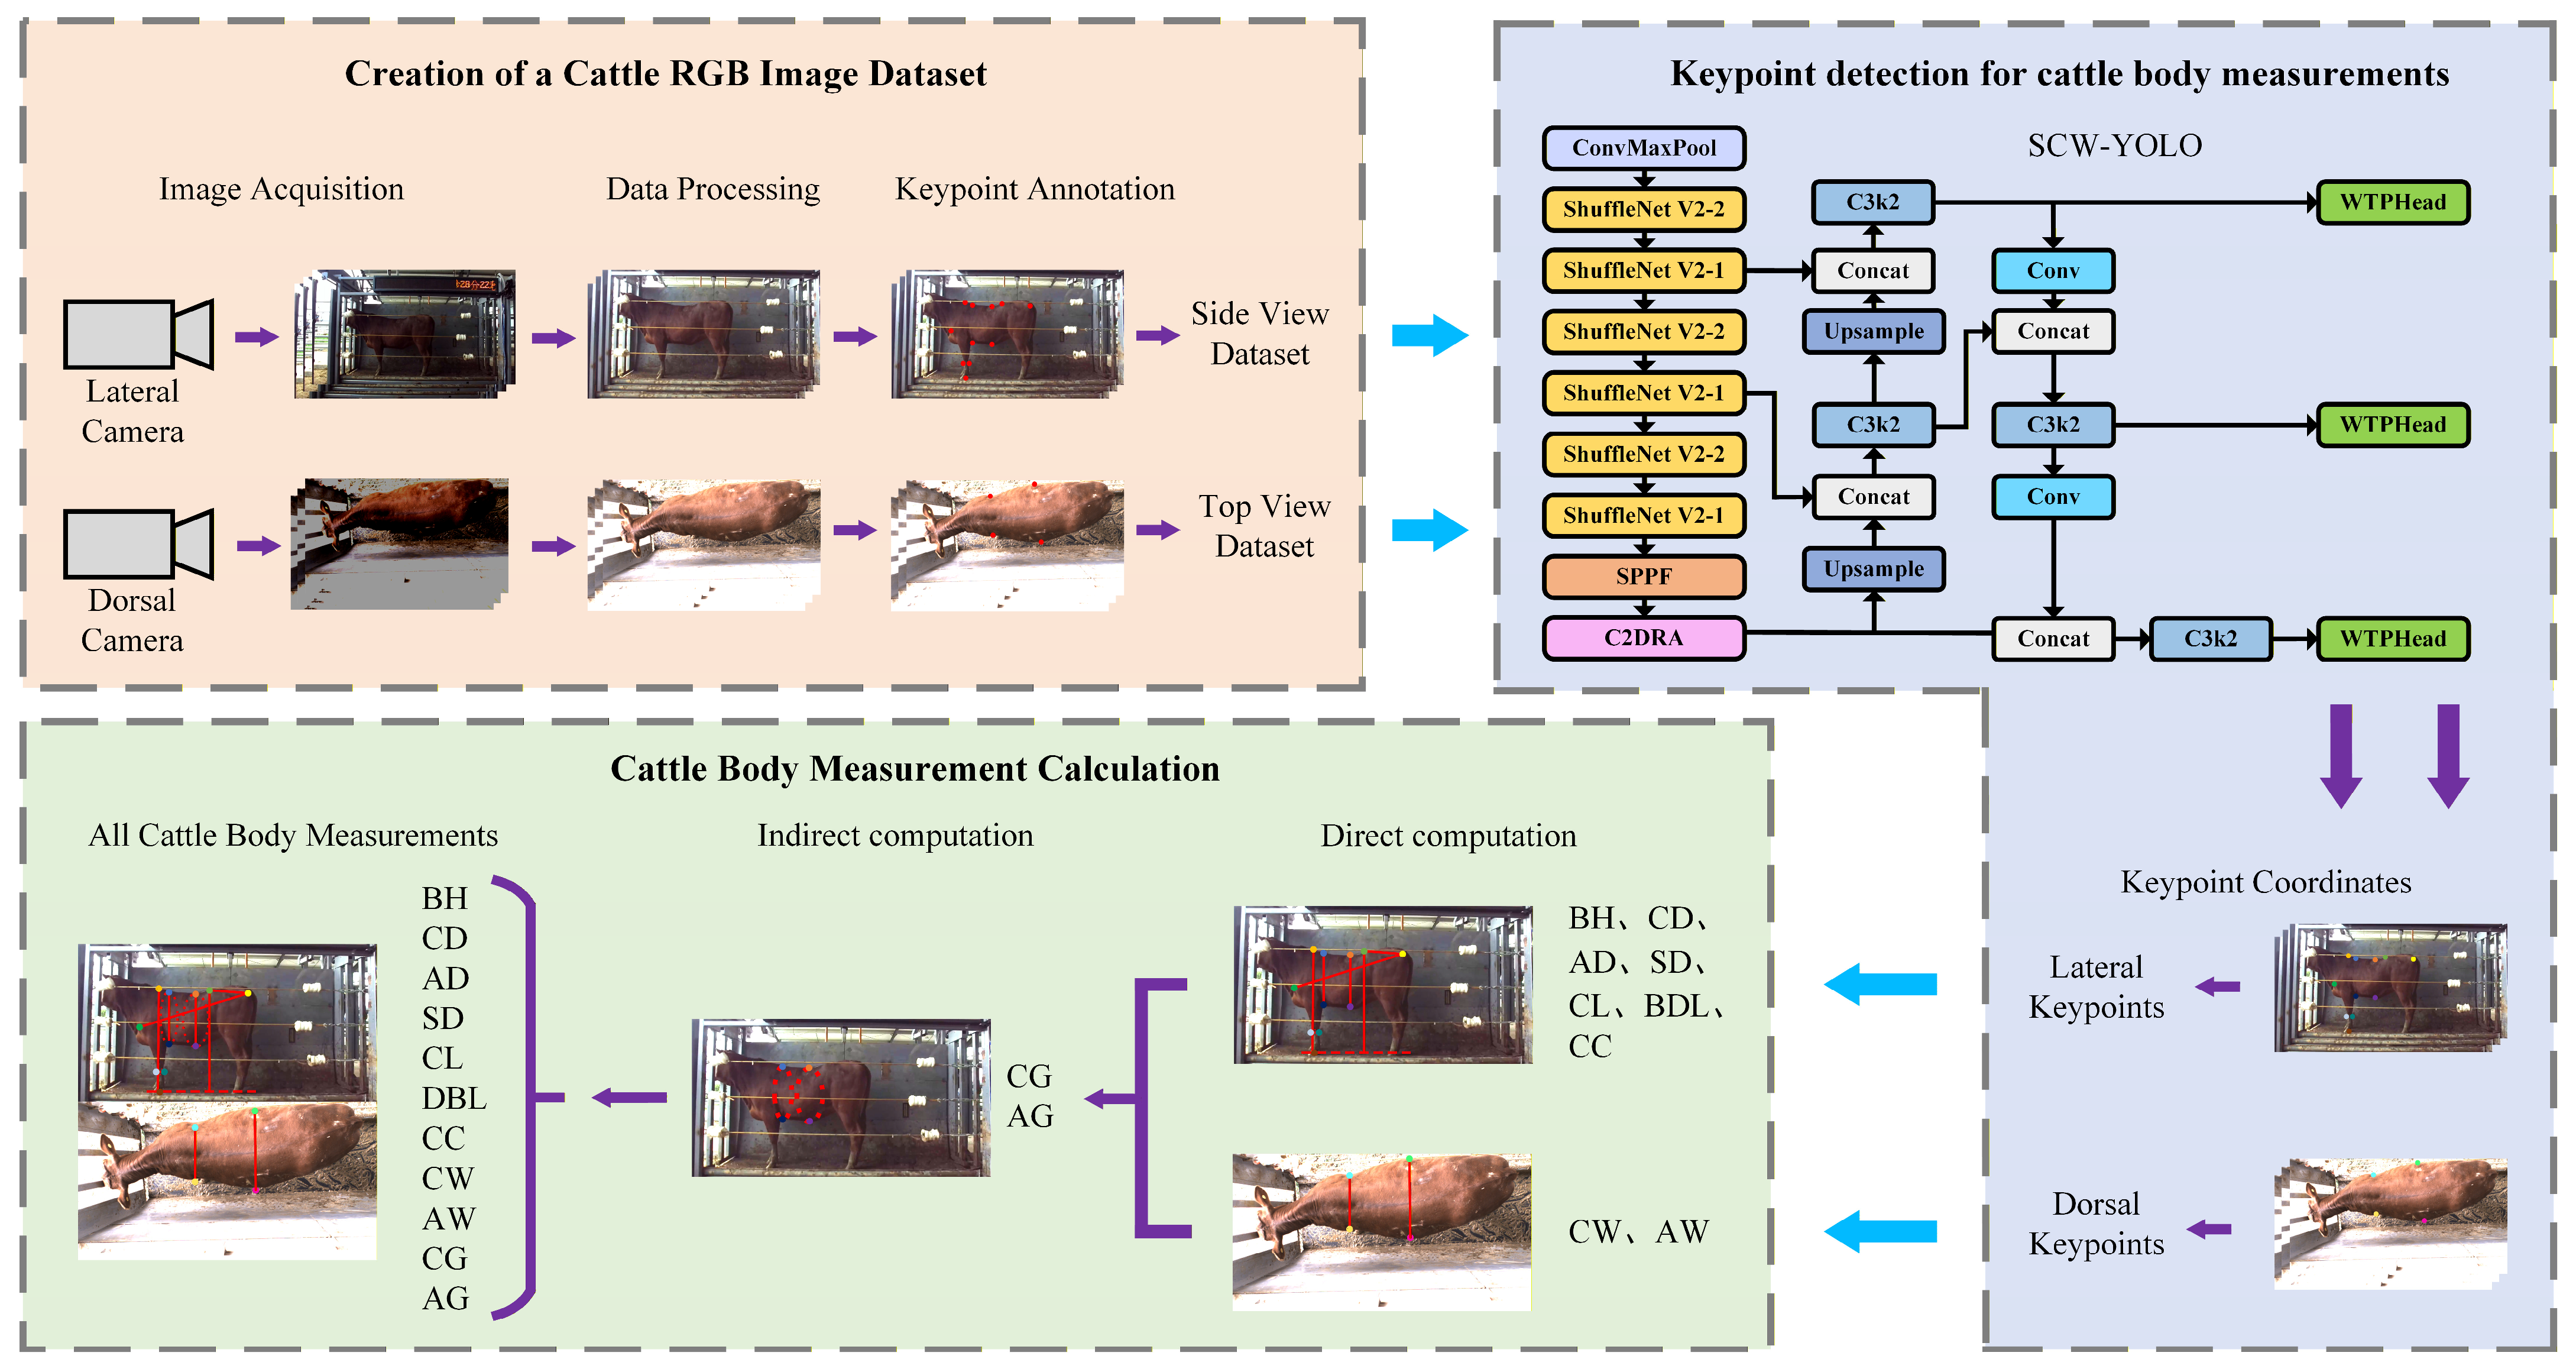
First, lateral and dorsal keypoint datasets of cattle were separately collected and constructed. Then, based on YOLOv11n-pose, new feature extraction, attention, and detection head modules were designed to propose an efficient and accurate SCW-YOLO lightweight keypoint detection network for obtaining lateral and dorsal keypoints of cattle. Subsequently, using the relevant body measurement formulas and camera calibration parameters, seven body measurements—body height, chest depth, abdominal depth, sacral height, rump length, diagonal body length, hoof diameter, and cannon circumference—were directly calculated from lateral images, while chest depth and abdominal depth were directly calculated as 2D body measurements from dorsal images. Finally, combining the measured chest depth, abdominal depth, chest width, and abdominal width data, chest girth and abdominal girth were indirectly calculated as 3D body measurements using the body measurement formulas. Figure 4 illustrates the measurement process.
Figure 4.
Workflow of cattle body measurement. BH denotes body height; CD denotes chest depth; AD denotes abdominal depth; CW denotes chest width; AW denotes abdominal width; SH denotes sacral height; CL denotes croup length; DBL denotes diagonal body length; CC denotes cannon circumference; CG denotes chest girth; and AG denotes abdominal girth.
2.5. SCW-YOLO Lightweight Keypoint Detection Network
2.5.1. Framework of the Cattle Body Measurement Keypoint Detection Network
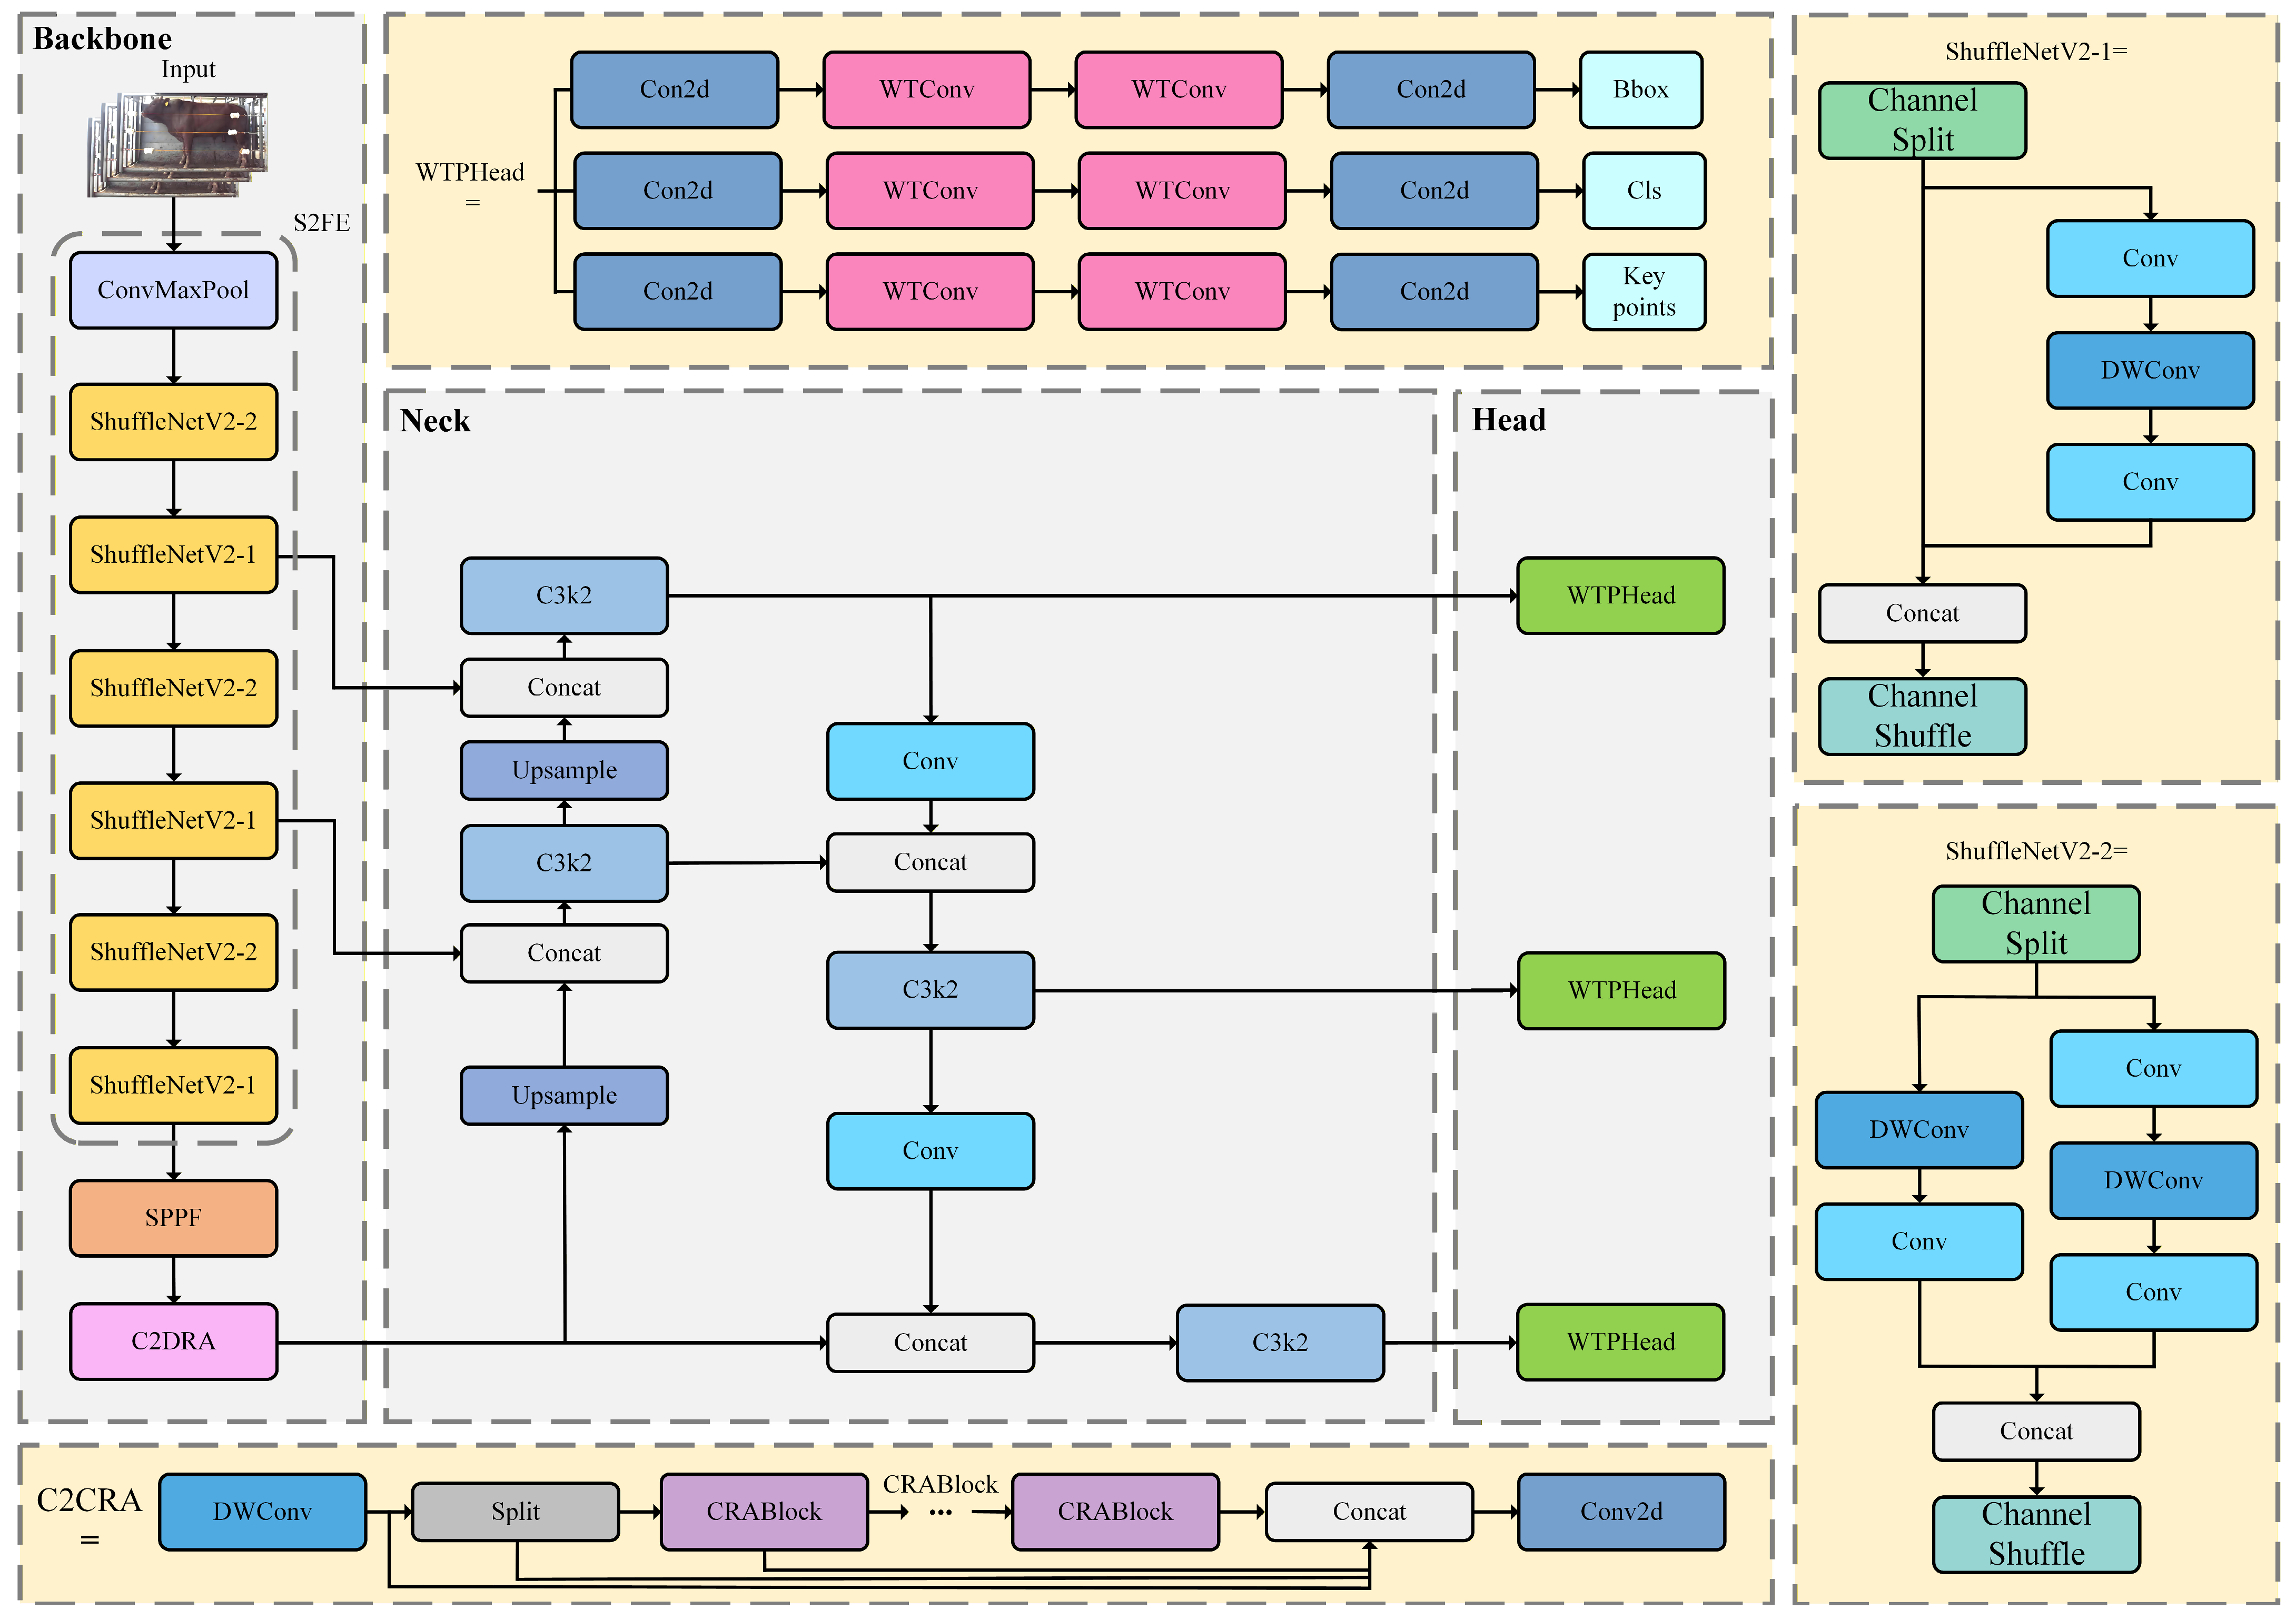
This study proposes a lightweight keypoint detection network, SCW-YOLO (Figure 5), designed to reduce model parameters, compute cost, and model size while ensuring efficient and accurate detection. Building on YOLOv11n-pose, a novel feature extraction module, S2FE, is introduced to efficiently extract cattle keypoint features and enhance model lightweighting. In addition, an attention module, C2DCRA, is developed to perform global pooling and compress channel dimensions, thus effectively capturing the global characteristics of cattle keypoint features while reducing computational overhead and parameter redundancy. Furthermore, a wavelet convolution-based cattle keypoint detection head, WTPHead, is proposed to efficiently expand the receptive field of convolutional modules and further improve the network’s lightweight performance.
Figure 5.
Architecture of the SCW-YOLO lightweight keypoint detection network.
2.5.2. S2FE Feature Extraction Module
The backbone network of YOLOv11n-pose relies heavily on Conv and C3k2 modules for extracting features of bovine body measurement key points, leading to low feature extraction efficiency and limited model lightweighting. The lightweight backbone networks, such as MobileNetV3 [], EfficientNetV2 [], and StarNet [], did not demonstrate significant lightweighting effects when used to the YOLOv11 model. In this study, we propose an S2FE feature extraction module to enhance the efficiency of feature extraction while improving the network’s lightweight characteristics.
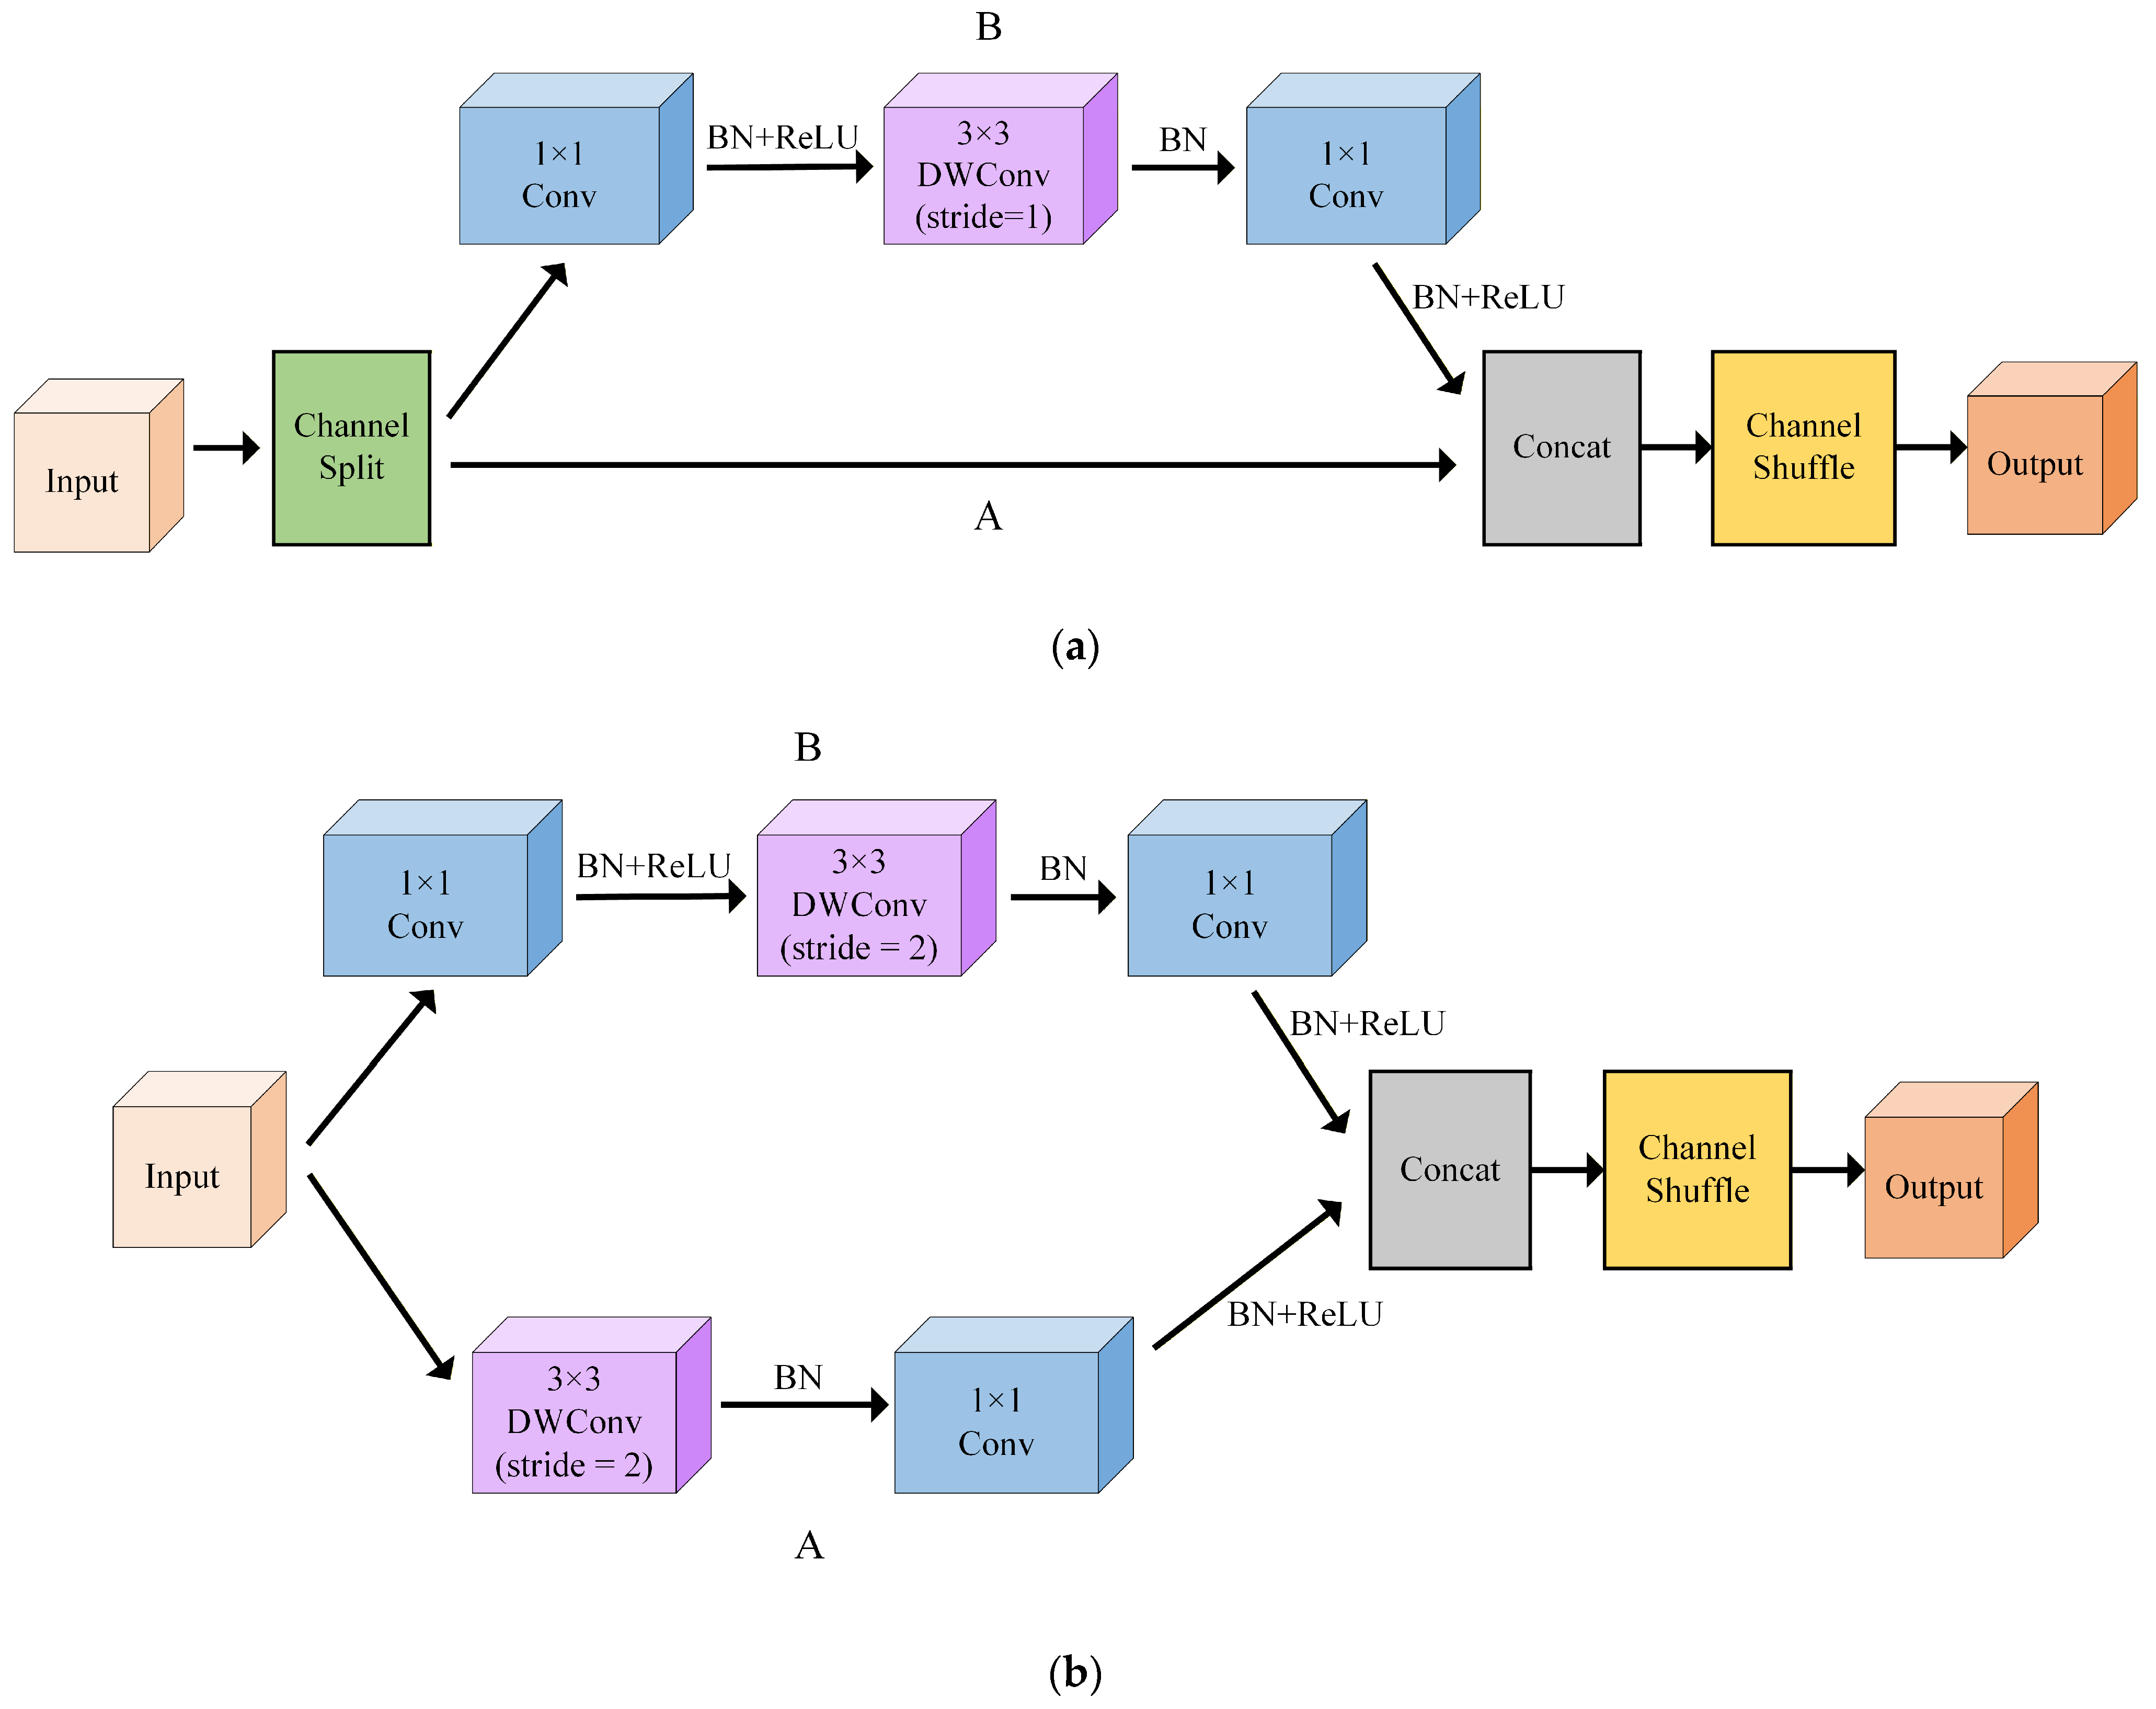
The S2FE module is composed of the ConvMaxPool module and the basic units ShuffleNetV2-1 and ShuffleNetV2-2 from the ShuffleNet V2 [] network (Figure 6). At the initial stage of feature extraction, the Conv_maxpool operation is employed to efficiently extract cattle keypoint features and reduce spatial dimensions through convolution and max-pooling, thus improving computational efficiency []. To balance computational efficiency with model performance and network representational capacity, two mixed convolution basic units with different strides—ShuffleNetV2-1 (stride = 1) and ShuffleNetV2-2 (stride = 2)—are alternately used [,] (Figure 7). When the input feature map enters the ShuffleNetV2-1 unit (stride = 1), the input channels are split into two branches, A and B. Branch A directly outputs the features, while branch B first applies a 1 × 1 pointwise convolution to adjust the number of channels and enhance feature transformation capability, followed by a 3 × 3 depthwise convolution (DWConv) [] for efficient single-channel feature extraction, and finally another 1 × 1 pointwise convolution to restore the feature dimensions, thus reducing parameters and compute cost. After concatenation of branches A and B, channel shuffle is used to enable information exchange between channels, enhancing the network’s representational ability. When the input feature map enters the ShuffleNetV2-2 unit (stride = 2), the 3 × 3 DWConv in branch A halves the feature map size, which enlarges the receptive field while reducing parameters and compute cost. This is followed by a 1 × 1 pointwise convolution to increase the number of channels and enhance the network’s ability to extract cattle keypoint features. In branch B, feature extraction is performed simultaneously with channel mapping, also reducing parameters and computation. The outputs from both branches are concatenated along the channel dimension and undergo channel shuffle to enhance inter-channel information fusion, thus improving the network’s performance.
Figure 6.
S2FE module.
Figure 7.
S2FE module. Basic units of the ShuffleNet V2 module. (a) ShuffleNetV2-1 basic unit with stride = 1; (b) ShuffleNetV2-2 basic unit with stride = 2.
2.5.3. C2DCRA Attention Module
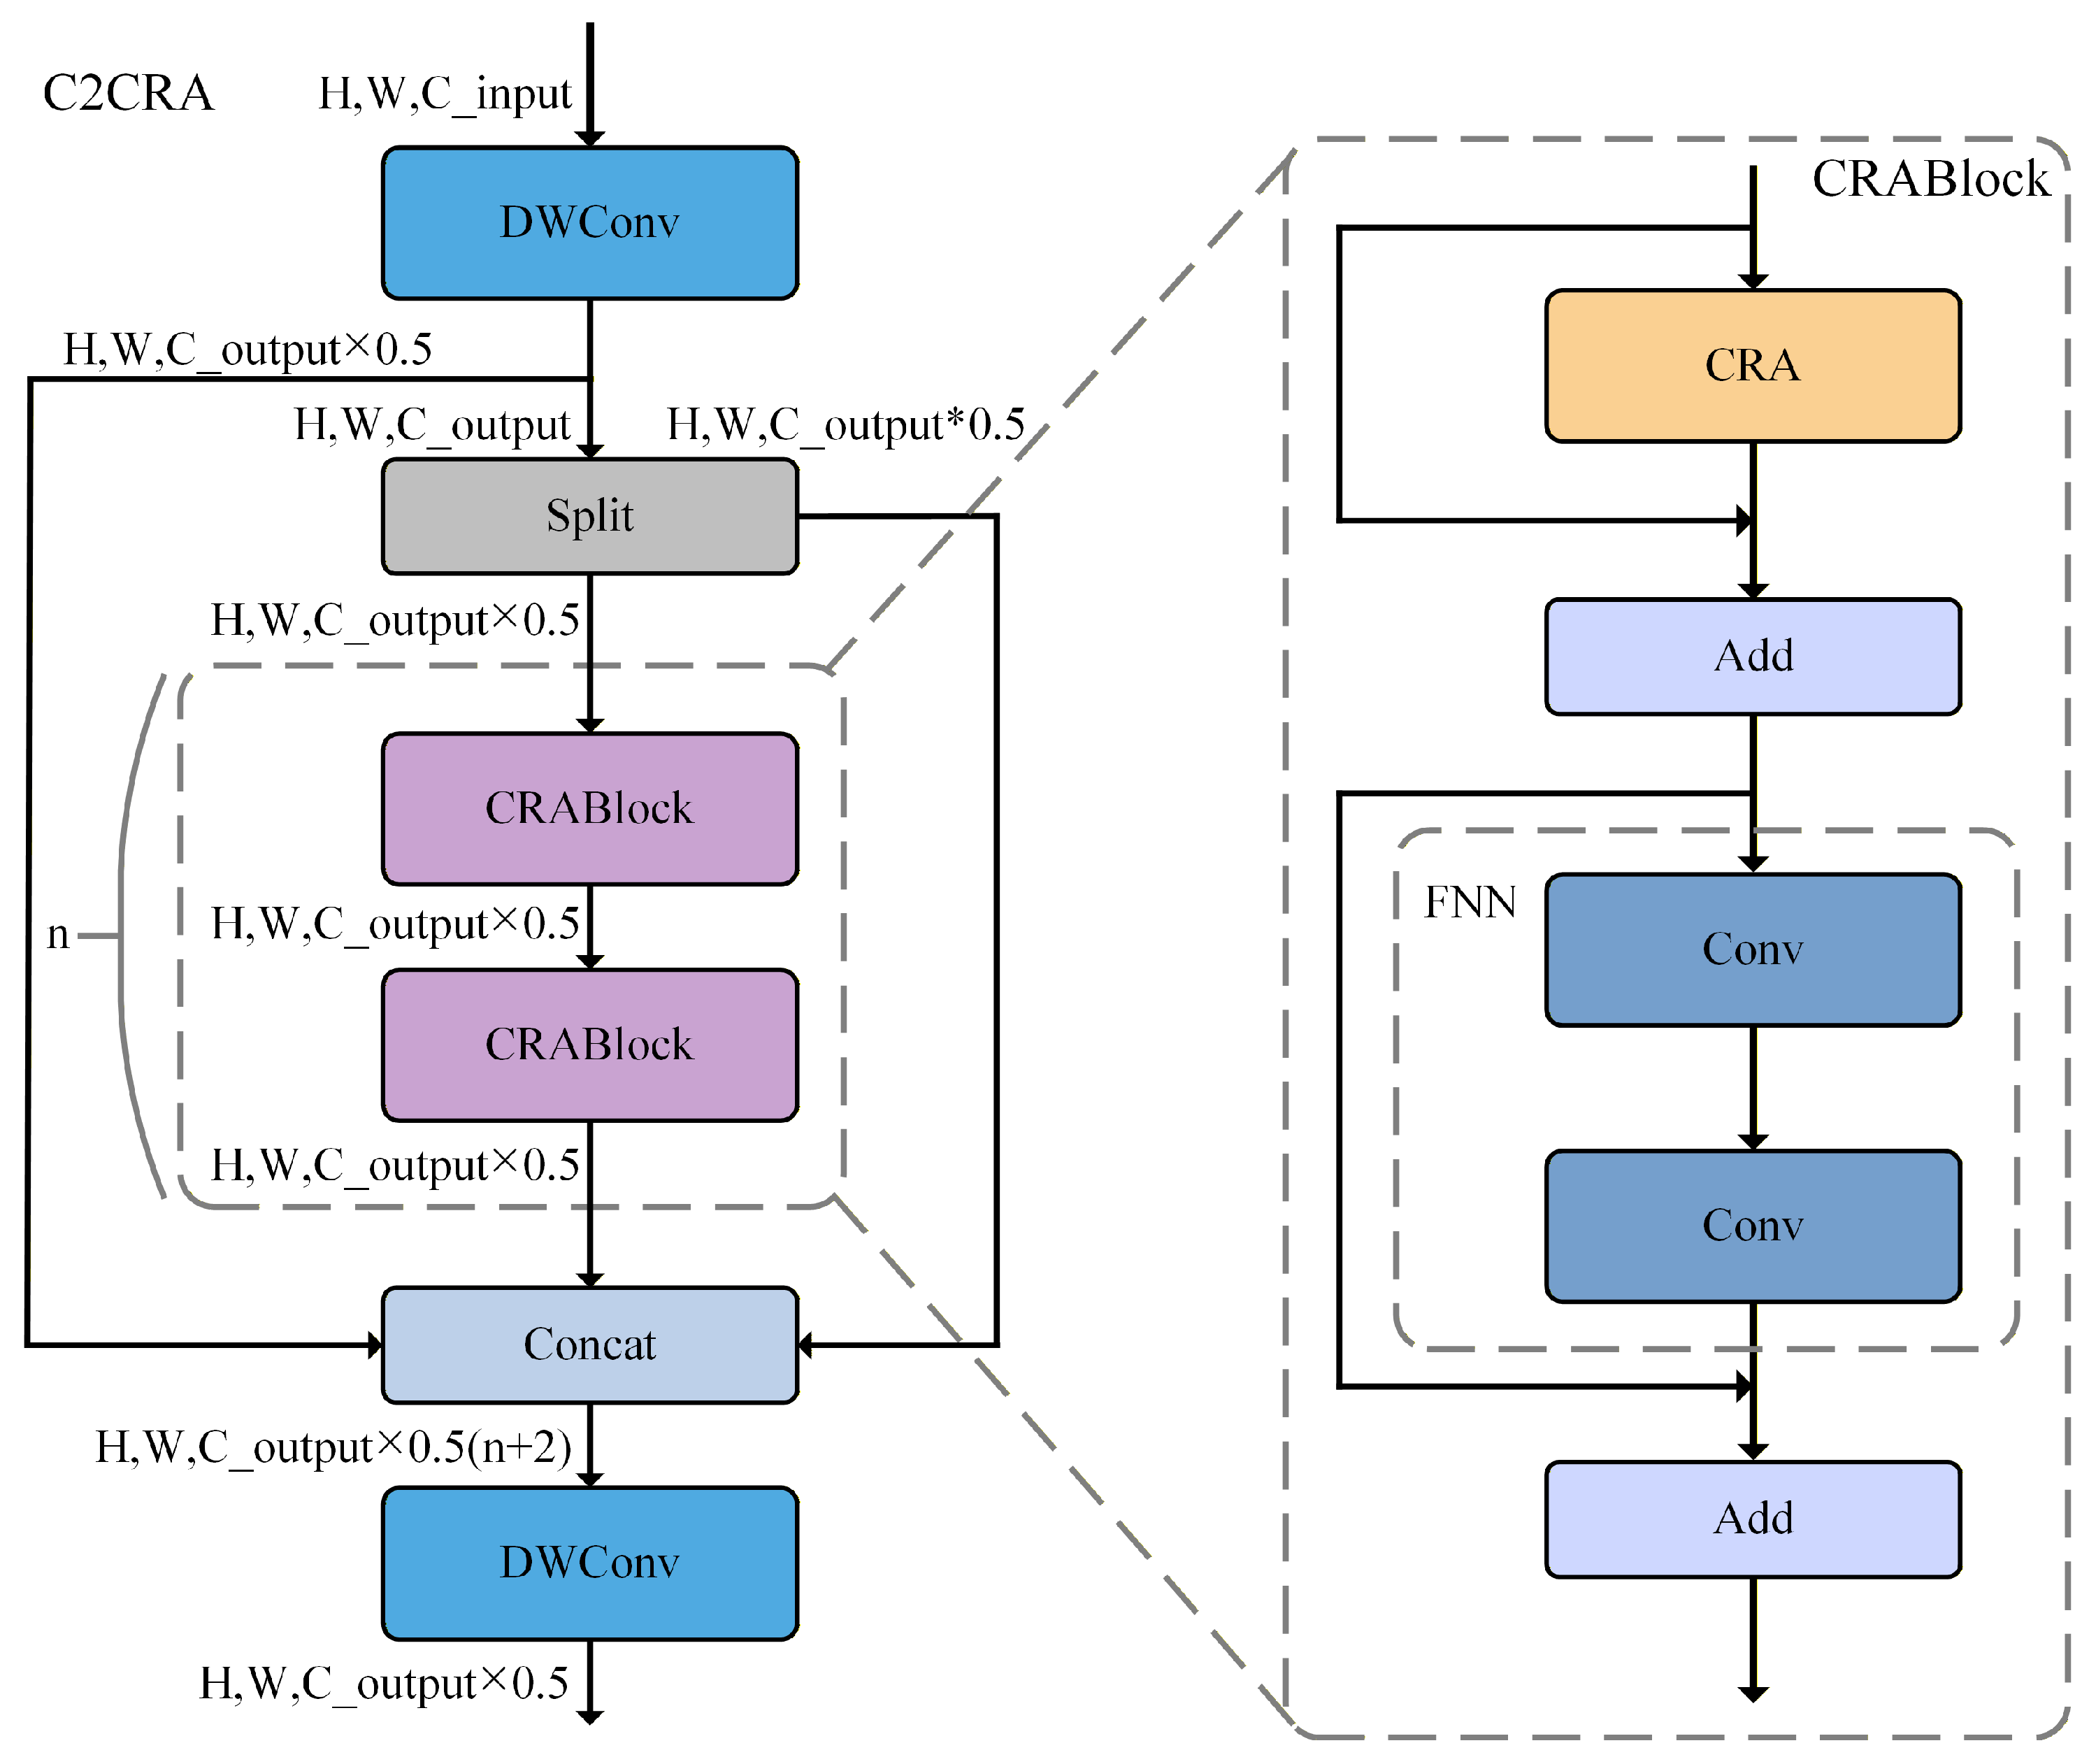
The attention module in YOLOv11n-pose employs a standard convolutional (Conv) module combined with a multi-head attention mechanism, leading to suboptimal extraction of global cattle information and high compute cost []. Lightweight modules composed of attention mechanisms such as MLCA [] yielded almost no improvement in lightweight efficiency and showed limited effectiveness in keypoint extraction. In this study, a novel C2DCRA attention module is proposed to enhance the network’s ability to capture global cattle information while reducing computational complexity and parameter overhead. The C2DCRA module is composed of a DWConv module and a CRABlock module (Figure 8).
Figure 8.
Structure of the C2DCRA module.
CRABlock: In this study, the channel reduction attention (CRA) [] mechanism was incorporated into the design of the CRABlock to effectively extract global contextual information of cattle while reducing computational complexity and parameter overhead, as shown in Figure 8.
CRA: The Key and Value are subjected to average pooling, while the channel dimensions of the Query and Key are compressed to a single dimension to significantly reduce computational costs. The channel-compressed Query and Key are then utilized to effectively capture global features, as shown in Equation (1).
As shown in Equation (1) and Figure 9, CRA is a multi-head self-attention mechanism composed of multiple self-attention heads, ranging from to . For an input of size , each self-attention head first splits it into three branches to derive the query , key , and value . Specifically, the first branch applies a channel-reduced linear projection to compress the channel dimension, producing a of size . The second branch first performs average pooling to reduce the spatial dimension, followed by a channel-reduced linear projection, resulting in a of size . The third branch first applies global average pooling to compress the spatial dimension and then uses a linear projection to generate a of size . The and are multiplied (MatMul) to generate an attention map of size . The attention map is then multiplied with the value to produce an output feature of the same size as the original . Finally, the outputs from all attention heads are concatenated and mapped through a linear transformation matrix to derive the final multi-head attention output.
where denotes the attention head, represents the number of attention heads, and refers to the projection parameters. Specifically, , , . Here, , and represent the query, key, and value tensors, respectively. AvgPool denotes the average pooling operation at each stage with scales .
Figure 9.
Principle of the CRA module.
2.5.4. WTPHead Detection Head Module
The convolution modules in the detection head of YOLOv11n-pose have a limited receptive field and redundant parameters, which restrict the accuracy of cattle keypoint localization and the degree of network lightweighting. Detection heads composed of lightweight convolutional modules such as DEConv [] and LDConv [] exhibit the limitation of reducing only either the parameter count or the compute cost, but not both simultaneously. In this study, we designed a wavelet convolution-based cattle keypoint detection head module, WTPHead, which effectively enlarges the receptive field of the convolution modules and reduces the parameter count, thus enhancing the lightweight characteristics of the network.
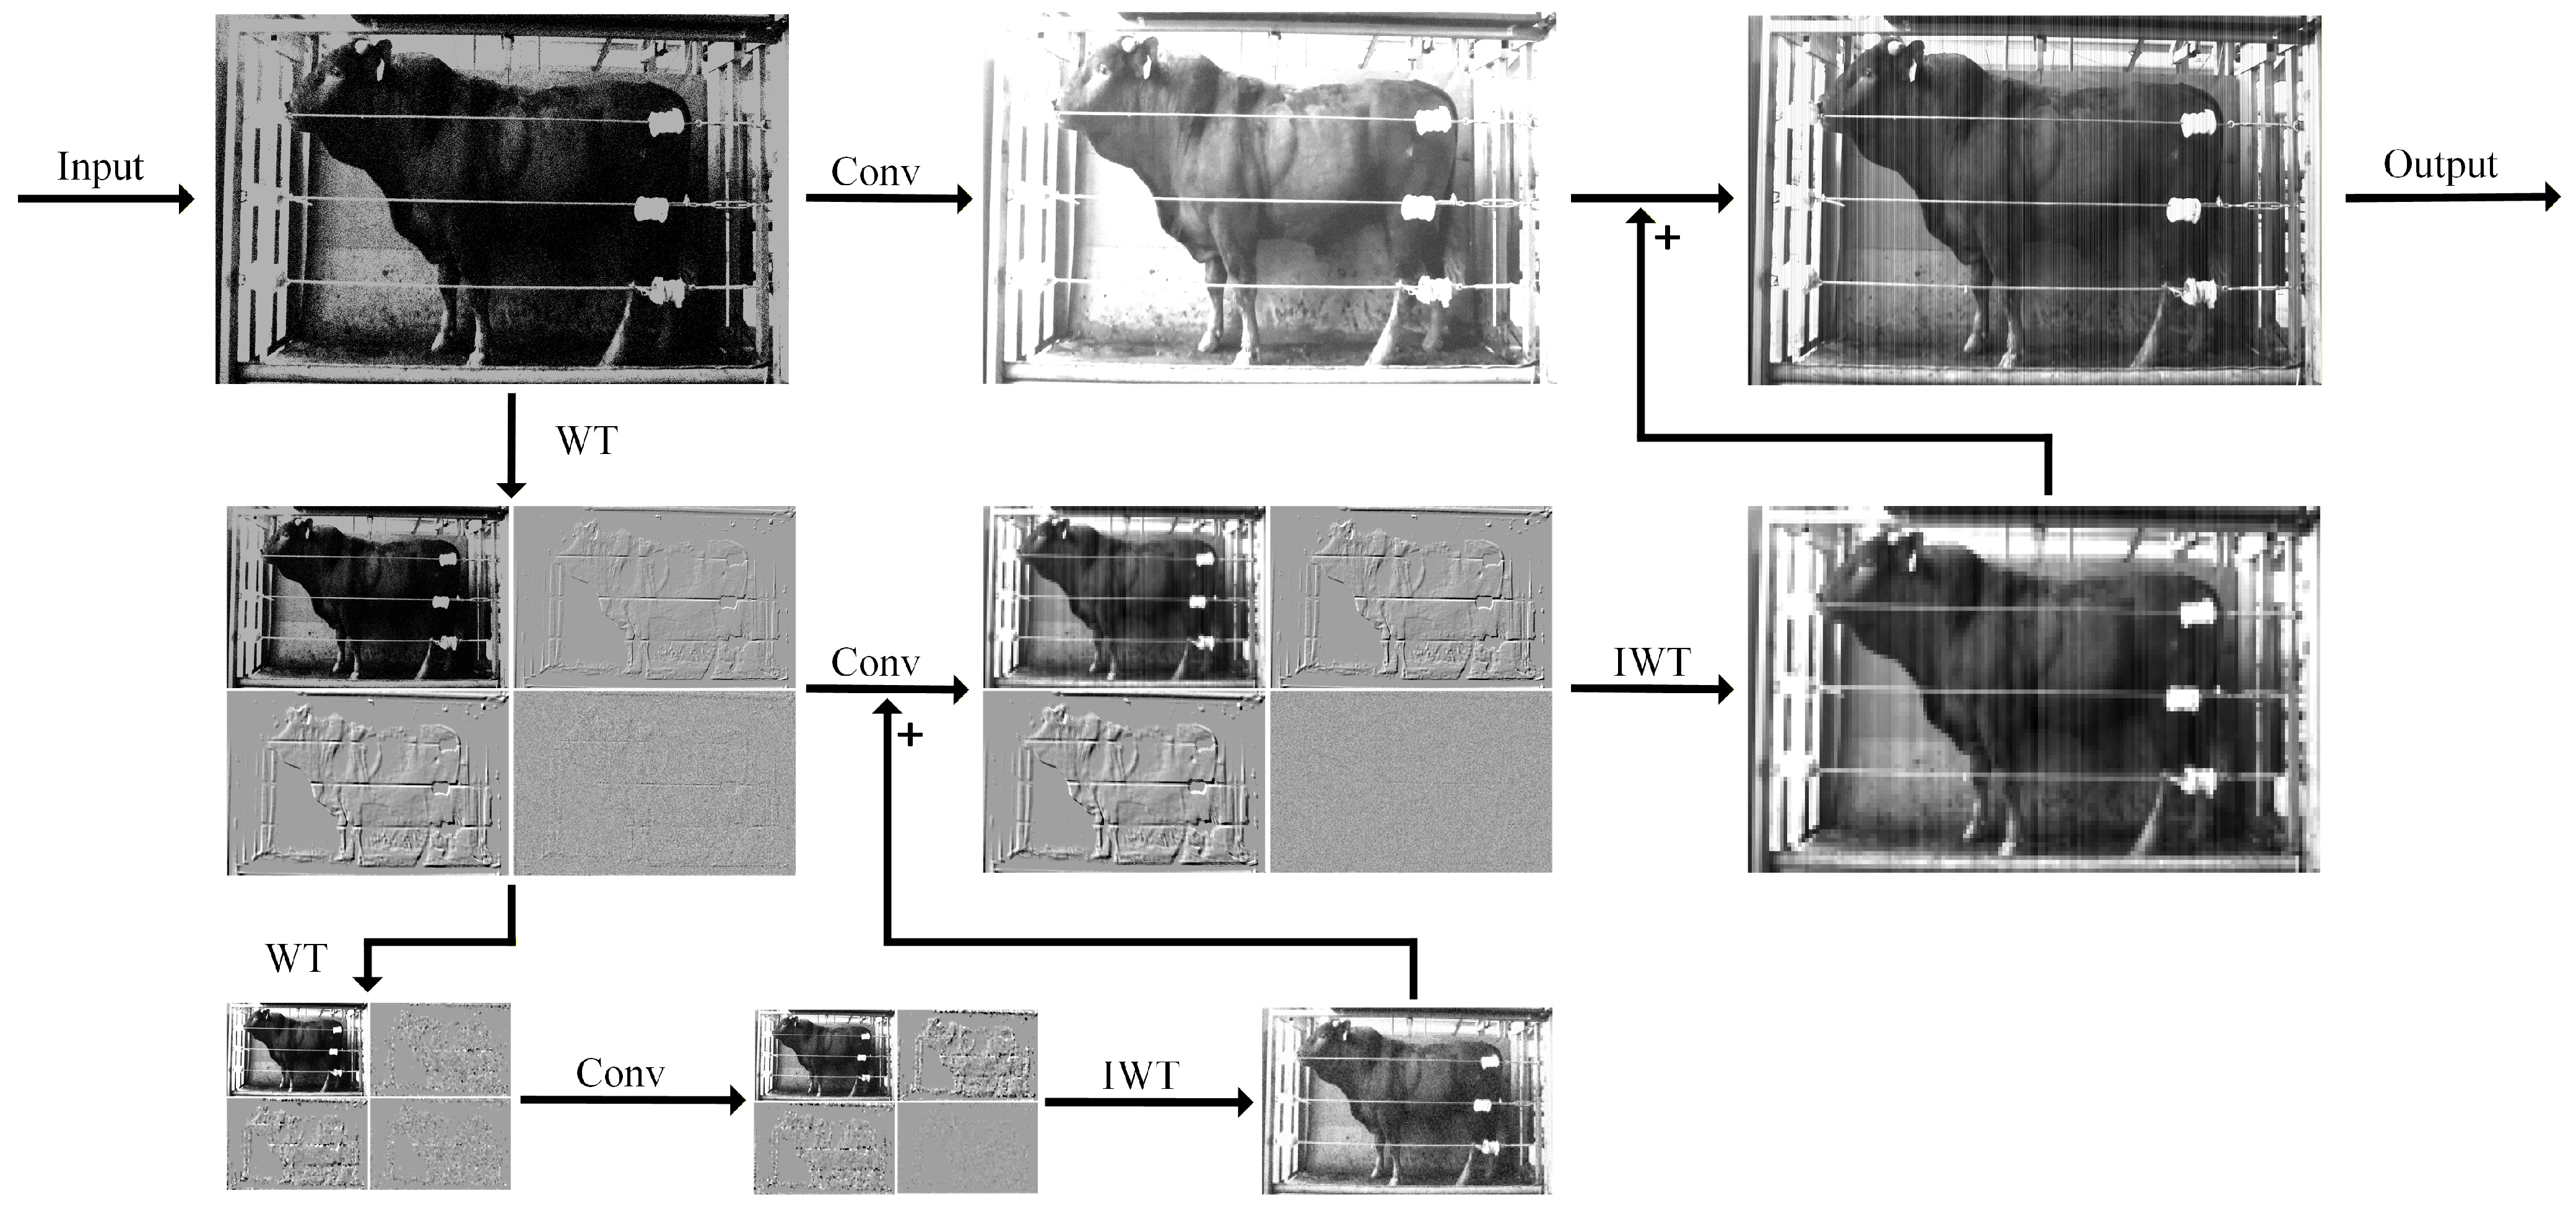
The WTPHead module consists of a Conv2d module and a WTConv [] module (Figure 10). The Conv2d module is responsible for basic feature extraction of cattle keypoints and for adjusting feature dimensions. The WTConv module employs the wavelet transform (WT) [] to efficiently expand the receptive field of the convolution module, while reducing both the parameter count and the compute cost (Figure 11). By applying a wavelet transform to the input, WTConv separates low-frequency and high-frequency information, performs small-kernel DWConv in each frequency band, and finally reconstructs the output using an inverse wavelet transform (IWT). This process not only reduces the model’s parameters and compute cost but also enhances its fitting ability and robustness against noise []. For each input channel, WTConv performs a two-dimensional wavelet transform to generate four sub-bands: the low-frequency component, as well as the horizontal, vertical, and diagonal high-frequency components. The low-frequency component is then recursively decomposed to perform cascaded wavelet decomposition for each level of sub-band, as shown in Equation (2). This process separates convolution operations from frequency components, enabling small convolution kernels to operate over a larger effective area than in the original domain, thus achieving an exponential increase in the receptive field without adding parameters.
where denotes the low-pass filter, and , and denote the high-pass filters. represents the input image, represents the low-frequency component, while , , and correspond to the horizontal, vertical, and diagonal high-frequency components, respectively. denotes the output image obtained from the inverse wavelet transform, and indicates the current decomposition level.
Figure 10.
Comparison of the architectures of the detection head modules. (a) Structure of the WTPHead detection head module; (b) Structure of the original YOLOv11n-pose detection head module.
Figure 11.
WTConv module.
3. Body Measurement of Cattle Building on Key Points
3.1. Camera Calibration
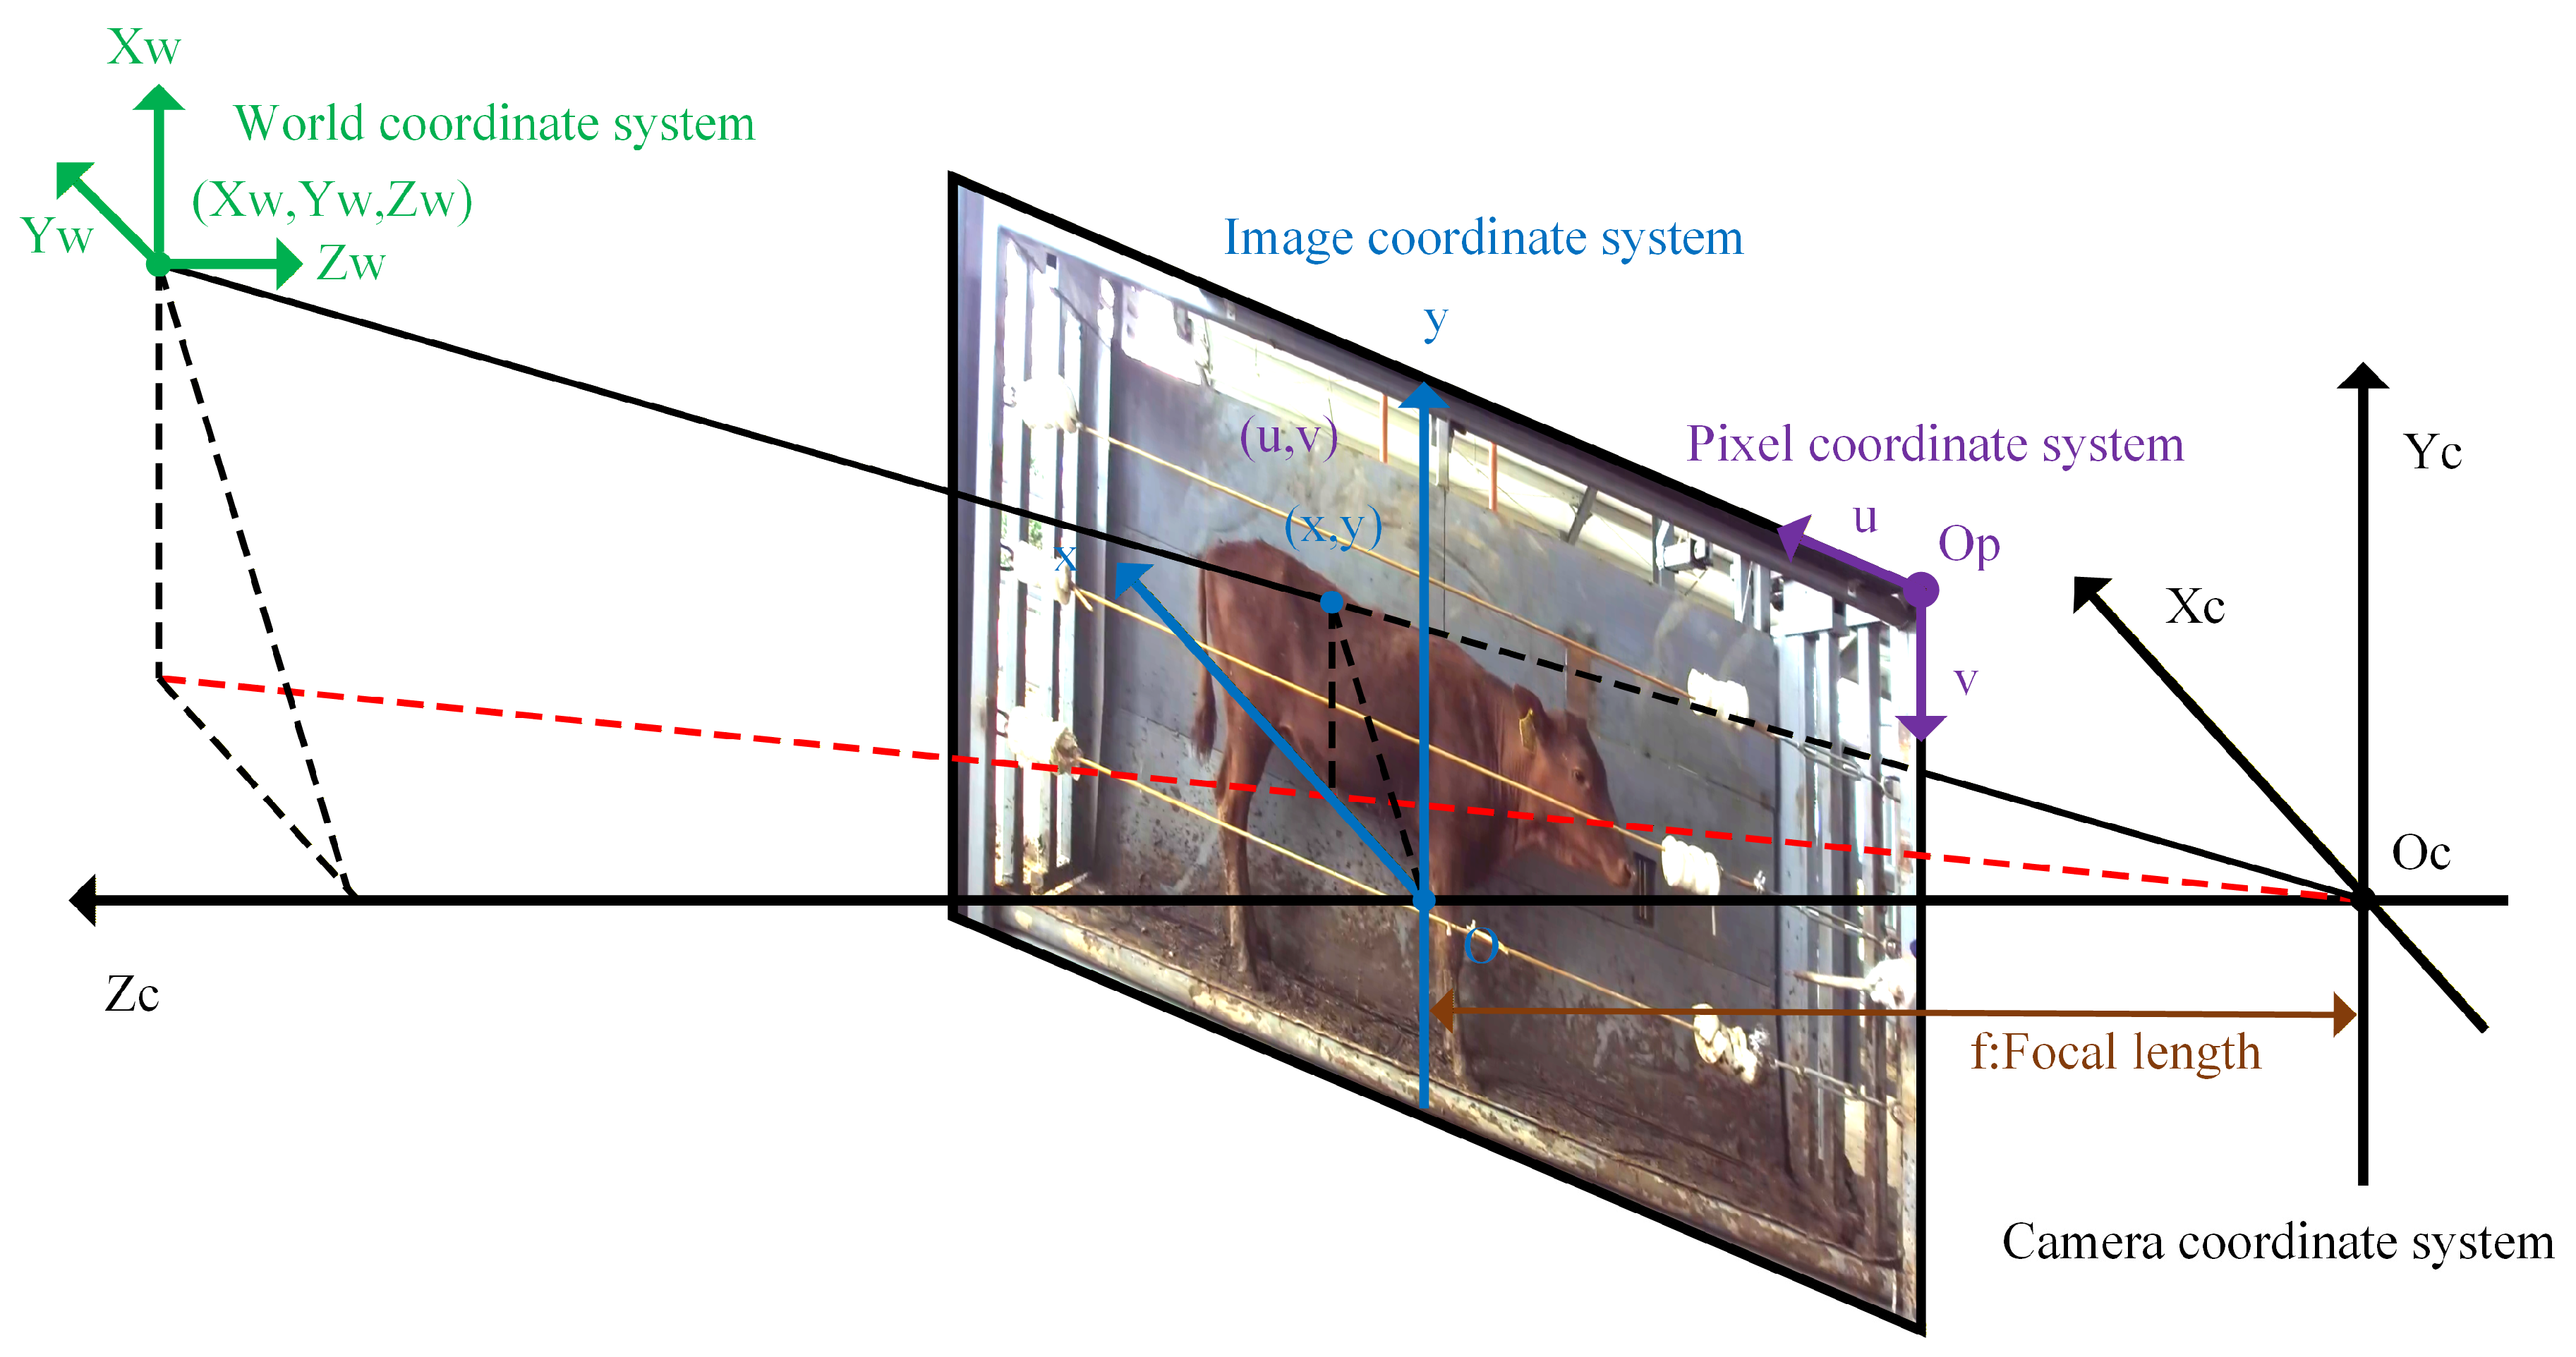
To derive the actual body measurements of the cattle, this study used camera calibration to determine the intrinsic and extrinsic camera parameters, thus establishing the conversion ratio between pixel measurements and real-world dimensions []. The intrinsic parameters include the pixel size, focal length, and principal point, while the extrinsic parameters consist of the rotation matrix and translation vector []. The coordinate systems of the imaging model are illustrated in Figure 12, and the computational relationships among them are described in Equation (3). Camera calibration was performed at a distance of 200 cm from the camera—the standing position of the cattle in the fixed passage—using a checkerboard pattern measuring 20 cm × 20 cm.
where denotes the coordinate point in the camera coordinate system, ( denotes the coordinate point in the image coordinate system, and () denotes the coordinate point in the world coordinate system. and represent the size of a unit pixel in the horizontal and vertical directions, respectively. denotes the focal length of the camera, and () denotes the principal point of the camera. denotes the rotation matrix in the world coordinate system, and denotes the translation vector in the world coordinate system.
Figure 12.
Coordinate systems of the imaging model.
3.2. Calculation of Body Measurements
The calculation of cattle body measurements is a crucial step in the measurement process and the ultimate goal of keypoint detection. In this study, body measurements are categorized into 2D and 3D metrics. The 2D measurements include body height, chest depth, abdominal depth, chest width, abdominal width, sacral height, croup length, and diagonal body length, while the 3D measurements consist of chest girth, abdominal girth, and cannon circumference.
3.2.1. Calculation of Body Height, Chest Depth, Abdominal Depth, Chest Width, Abdominal Width, and Sacral Height
The key point coordinates for body height, chest depth, abdominal depth, chest width, abdominal width, and sacral height lie within the same longitudinal plane, with identical horizontal coordinates. The corresponding measurements are calculated as the vertical distance between two key points, as shown in Equation (4).
where and denote the vertical coordinates of the upper and lower key points of the body measurement in the pixel coordinate system within the same longitudinal plane, respectively, and denotes the conversion ratio.
3.2.2. Calculation of Diagonal Body Length and Croup Length
The key point coordinates for diagonal body length and croup length are also located within the same longitudinal plane; however, both the horizontal and vertical coordinates of the key points differ. Therefore, the body measurement is obtained by calculating the Euclidean distance between the two key points, as shown in Equation (5).
where and denote the horizontal coordinates of the left and right key points of the body measurement in the pixel coordinate system within the same longitudinal plane, and denote their corresponding vertical coordinates, and denotes the conversion ratio.
3.2.3. Calculation of Chest Girth and Abdominal Girth
Before calculating the chest girth and abdominal girth, it is necessary to first determine the chest depth and chest width, as well as the abdominal depth and abdominal width. The chest girth is indirectly calculated from the chest depth and width, while the abdominal girth is derived from the abdominal depth and width. In the early 20th century, Ramanujan proposed an approximate formula for calculating the circumference of an ellipse, known as the Ramanujan formula []. Since the cross-sections of the chest and abdomen are approximately elliptical in shape, this study applies the Ramanujan formula to convert a rectangle into an actual approximate ellipse, as illustrated in Figure 13, to derive the chest and abdominal girths, as given in Equation (6).
where denotes the perimeter of the ellipse, corresponding to the chest girth and abdominal girth of the cattle. The parameters and represent the semi-major and semi-minor axes of the ellipse, respectively. Specifically, 2 corresponds to the line segment connecting the chest depth and abdominal depth points in Figure 13, while 2 corresponds to the line segment connecting the chest width and abdominal width points in Figure 13. denotes the conversion ratio. As shown in Equation (7), both chest girth and abdominal girth are related not only to chest depth and abdominal depth but also to chest width and abdominal width. The approximation coefficient can be computed using a series expansion, in which the factor / represents the ratio of double factorials of odd and even numbers, and its value gradually approaches 1 as increases.
Figure 13.
Indirect 3D body measurements. (a) chest girth; (b) abdominal girth.
3.2.4. Calculation of Cannon Circumference
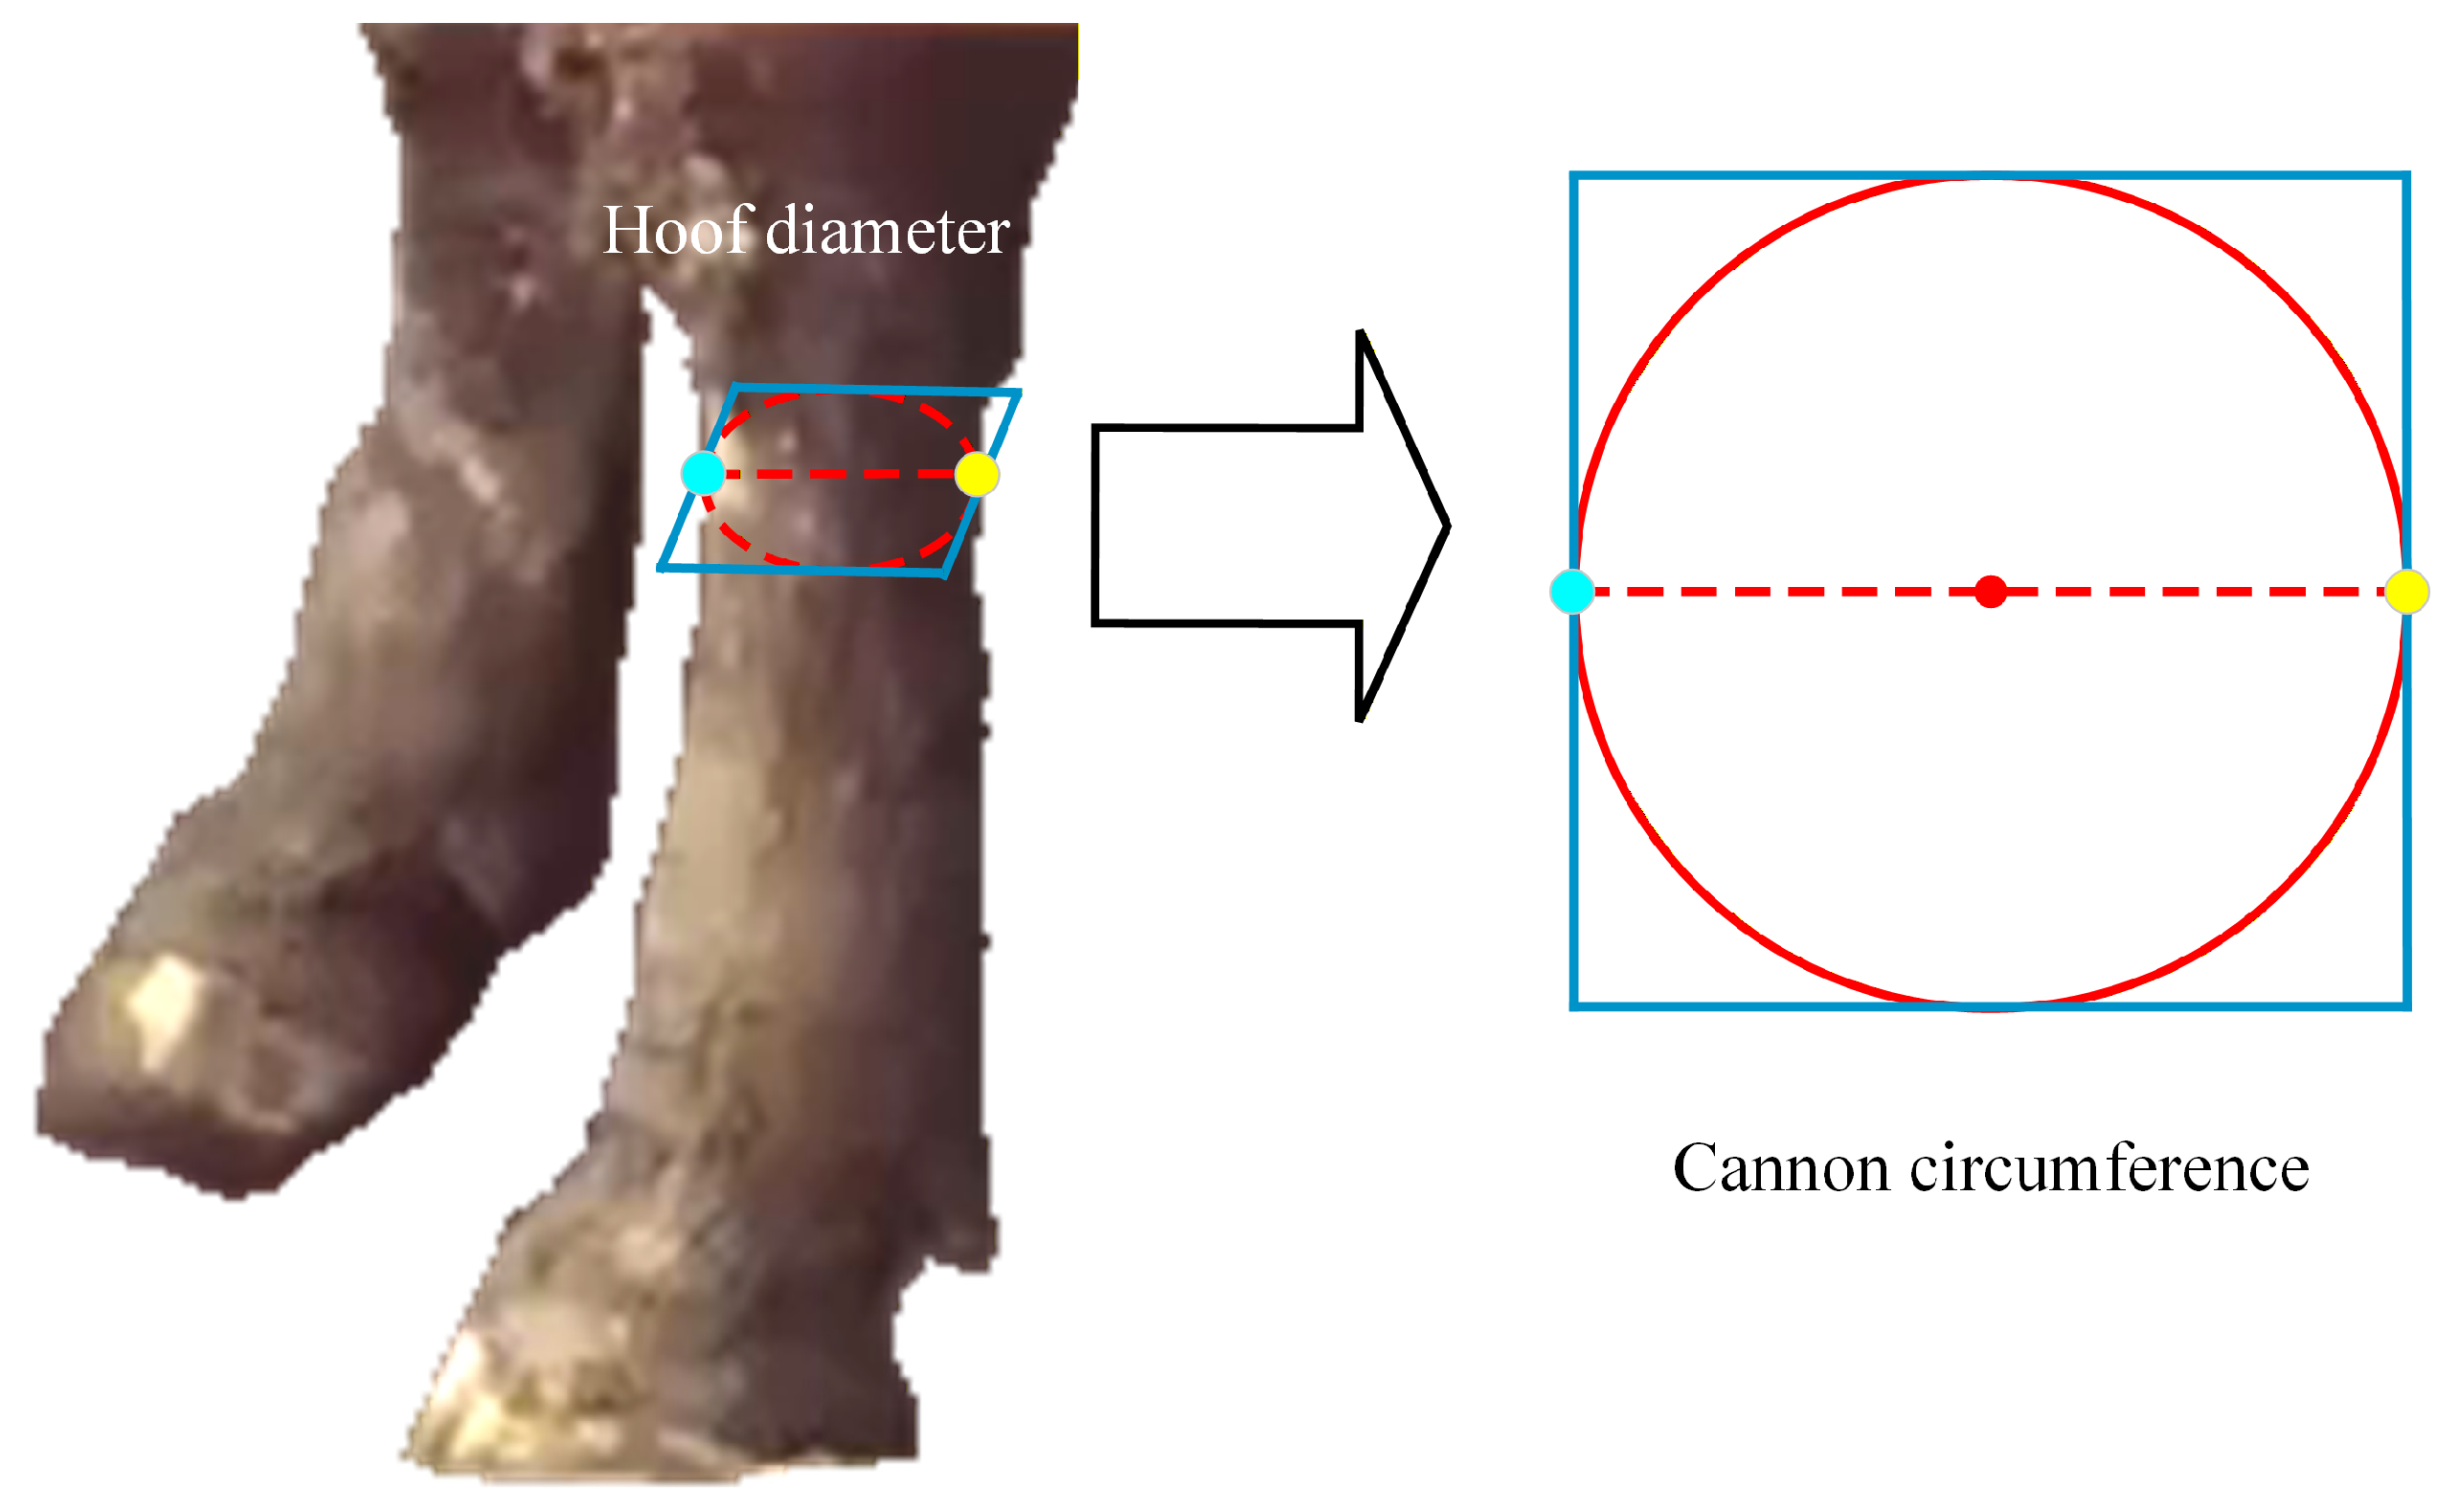
The calculation of the cannon circumference first requires determining the hoof diameter. In this study, the cannon circumference is approximated as the circumference of a circle, with the hoof diameter considered as the circle’s diameter. The method for calculating the cannon circumference is shown in Equation (8) and Figure 14.
Figure 14.
Direct 3D body measurements: Cannon Circumference.
To calculate the cannon circumference, the hoof diameter must first be determined. In this study, the cannon circumference is approximated as the circumference of a circle, with the hoof diameter considered as the circle’s diameter. The direct method for calculating the cannon circumference is shown in Equation (7) and Figure 14.
where denotes the cannon circumference, and represent the horizontal coordinates of the left and right key points in the pixel coordinate system of the same longitudinal section, indicates the hoof diameter, and represents the conversion ratio.
4. Results and Analysis
4.1. Experimental Setup
The hardware configuration of the model training platform included an NVIDIA GeForce RTX 3050Ti Laptop GPU, a 12th Gen Intel(R) Core(TM) i7-12700H processor, and 16 GB of RAM. The software environment consisted of Windows 11, Python 3.8, and PyTorch 1.13.0. The training hyperparameters were set to an initial learning rate of 0.01, 150 training epochs, and a batch size of 16.
4.2. Evaluation Metrics
The model’s lightweight performance was evaluated using the parameter count, floating point operations per second (FLOPs), and model size. Keypoint detection accuracy was assessed using the mean average precision (mAP), and body measurement accuracy was evaluated using the mean relative error (MRE).
The mAP for the keypoints in this study was calculated based on the object keypoint similarity (OKS) [], where the OKS is computed as shown in Equation (8).
where denotes the visibility of the keypoint (0 for invisible and 1 for visible), represents the Euclidean distance between the detected and annotated keypoints, denotes the scale of the target object, and is the normalization factor of the keypoint. A higher threshold indicates greater precision accuracy relative to the annotated keypoints.
The mAP computed over thresholds ranging from 0.5 to 0.95 with a step size of 0.05 was used as the evaluation metric for detection accuracy, as shown in Equation (9).
The evaluation of body measurement results was performed using the MRE, as defined in Equation (10).
where denotes the ground truth value, represents the predicted value, and is the number of samples.
4.3. Ablation Experiments
To verify the effectiveness of each innovative module in the SCW-YOLO keypoint detection model, ablation experiments were designed on both the lateral and dorsal cattle datasets using YOLOv11n-pose as the baseline. The experimental results on the two datasets are presented in Table 2.
Table 2.
Ablation study results.
Experiments were performed separately on the lateral and dorsal cattle datasets, and the results were averaged. Building on the original model, the S2FE feature extraction module was first introduced. By employing channel splitting, DWConv, and pointwise convolution, the parameter count, compute cost, and model size were reduced by 39.3%, 42%, and 40.4%, respectively, thus significantly decreasing model complexity. Building upon this, the C2DCRA module was incorporated, which compresses channels via CRA and integrates a lightweight DWConv module. Compared with the Y + S model, the parameters, computing cost, and model size were further reduced by 17.6%, 5%, and 14.7%, respectively. On this basis, the WTPHead detection head was introduced, which separates low- and high-frequency information through wavelet transform and reconstructs the output using inverse wavelet transform. Compared with the Y + S + C model, this further reduced the parameter count, compute cost, and model size by 14.3%, 43.6%, and 13.3%, respectively. As shown in Table 2, the SCW-YOLO model achieved an average reduction of 58.2%, 68.8%, and 57% in the parameter count, computing cost, and model size, respectively, across both datasets, compared with the original model. Although the mAP decreased slightly by 1.2%, the degree of model lightweighting was significantly improved. These results demonstrate that, on both the lateral and dorsal cattle datasets, the SCW-YOLO keypoint detection model considerably reduced the parameter count, compute cost, and model size compared with the baseline model, thus achieving a much higher degree of lightweighting while still maintaining a high level of accuracy.
4.4. Comparative Analysis of Different Models
To further objectively validate the performance advantages of the SCW-YOLO keypoint detection model, comparative experiments were performed on both the lateral and dorsal cattle datasets. Specifically, the SCW-YOLO model was compared with YOLOv8n-pose, YOLOv9t-pose [], YOLOv10n-pose, and the baseline YOLOv11n-pose models, as summarized in Table 3.
Table 3.
Comparison of Experimental Results.
Experiments conducted on both the lateral and dorsal cattle datasets, with averaged results, demonstrated that SCW-YOLO achieved the most pronounced lightweight performance, with parameter count and model size reduced to 1.2 M and 2.5 MB, respectively. Compared with YOLOv8n-pose, YOLOv9t-pose, YOLOv10n-pose, and YOLOv11n-pose, the parameter count was reduced by 2 M, 0.9 M, 1.7 M, and 1.6 M, while the model size was reduced by 3.8 MB, 2.4 MB, 3.6 MB, and 3.3 MB, respectively. The computing cost of SCW-YOLO was 2.2 G, which was 6.5 G, 0.7 G, and 4.8 G lower than that of YOLOv8n-pose, YOLOv10n-pose, and YOLOv11n-pose, respectively, and only slightly higher than YOLOv9t-pose (by 0.1 G). However, compared with YOLOv9t-pose, SCW-YOLO exhibited superior efficiency, with lower parameter count (by 0.9 M), smaller model size (by 2.3 MB), higher mAP accuracy (by 0.9%), and lower MRE (by 0.3%). The mAP of SCW-YOLO reached 97.4%, which was 1.2%, 1.0%, and 2.3% higher than YOLOv8n-pose, YOLOv9t-pose, and YOLOv10n-pose, respectively, and only 1.2% lower than the baseline YOLOv11n-pose. This slight reduction may be attributed to the lower computational complexity of the improved modules; nevertheless, the accuracy remained within an acceptable range. The MRE of SCW-YOLO was 6%, which was 0.4%, 0.3%, and 0.7% lower than YOLOv8n-pose, YOLOv9t-pose, and YOLOv10n-pose, respectively, but slightly higher than YOLOv11n-pose (by 0.2%).
4.5. Analysis of Cattle Body Measurement Keypoint Detection and Measurement Results
4.5.1. Keypoint Detection Results for Cattle Body Measurements
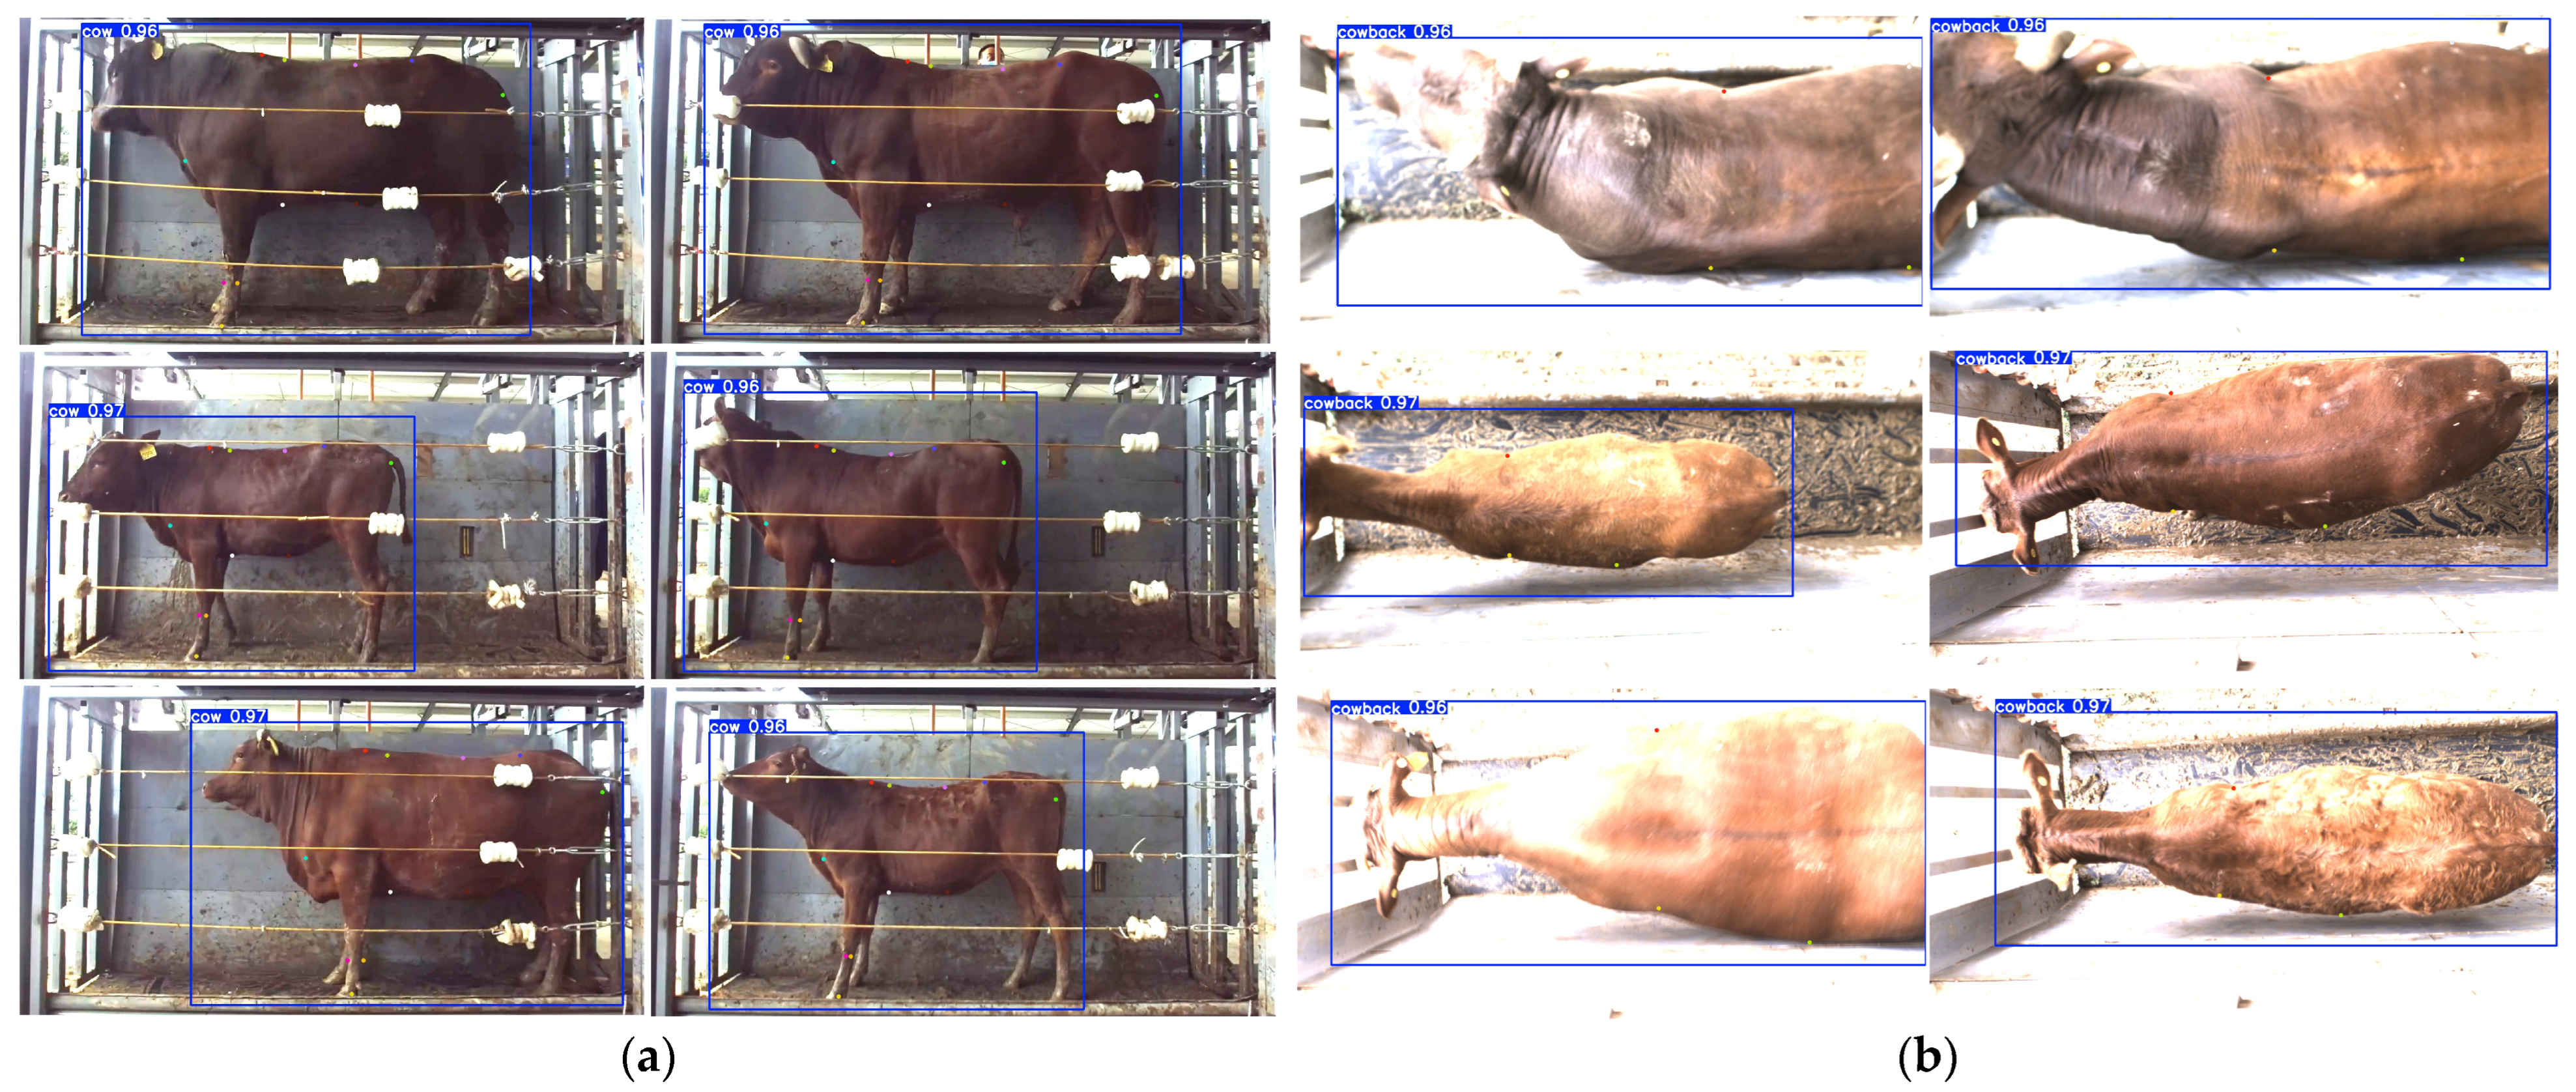
The SCW-YOLO model was used to detect the body measurement keypoints of six cattle in the test set, and the results are shown in Figure 15.
Figure 15.
Keypoint detection results. (a) Detection results of keypoints on the lateral view of cattle; (b) detection results of keypoints on the dorsal view of cattle.
4.5.2. Results and Analysis of Cattle Body Measurements
To validate the effectiveness of the proposed cattle body measurement method, the MRE was used to compare the predicted and actual body measurements in the lateral and dorsal test sets, as presented in Table 4 and Table 5.
Table 4.
MRE between predicted and actual body measurements based on the lateral view of cattle.
Table 5.
MRE between predicted and actual body measurements based on the dorsal view of cattle.
Experimental results on the lateral dataset demonstrated that the proposed body size measurement method achieved high accuracy, with an average relative error of 4.9% across all traits and a real-world distance error of 3.6 cm, indicating reliable performance.
Experimental results on the dorsal dataset showed that the proposed body size measurement method achieved an average relative error of 7% across all traits and a real-world distance error of 10.5 cm, which falls within the acceptable range, demonstrating accurate performance on the dorsal dataset.
To further validate the accuracy of the proposed efficient cattle body measurement method, Table 6 and box plots were employed to analyze the MRE, maximum relative error, and minimum relative error between the predicted and actual body measurements, as illustrated in Figure 16. The withers height showed a MRE of 2.8%, with a maximum error of 4% and a minimum error of 1.8%. Chest depth exhibited a MRE of 4.4%, a maximum error of 5.6%, and a minimum error of 2.2%. Abdominal depth had a MRE of 4.0%, with maximum and minimum errors of 5.6% and 2.2%, respectively. Chest width recorded a MRE of 4.7%, a maximum error of 7.1%, and a minimum error of 2.4%. Abdominal width yielded a MRE of 4.0%, with maximum and minimum errors of 7.0% and 1.6%, respectively. Hip height showed a MRE of 3.1%, with maximum and minimum errors of 5.3% and 1.8%. Rump length achieved a MRE of 4.6%, a maximum error of 6.3%, and a minimum error of 2.1%. The diagonal body length exhibited a MRE of 6.5%, with a maximum error of 11.2% and a minimum error of 3.5%. The experimental results demonstrated that the errors of withers height, chest depth, abdominal depth, chest width, abdominal width, hip height, rump length, and diagonal body length were all within acceptable limits. Larger errors were observed for girth measurements. The cannon circumference showed a MRE of 8.8%, with maximum and minimum errors of 14.5% and 5.5%, respectively. Chest girth exhibited a MRE of 9.9%, with maximum and minimum errors of 13.4% and 5.7%. Abdominal girth had a MRE of 9.4%, with maximum and minimum errors of 12.4% and 5.1%. The larger errors may be attributed to variations in thoracic and abdominal movements affecting girth measurements, the subtle changes in cannon circumference making accurate localization difficult, and the inherent limitations of reconstructing 3D traits from 2D images. Overall, the average MRE across all body measurements was 5.7%, which meets the precision requirements for cattle breeding applications.
Table 6.
MRE of cattle body measurement data.
Figure 16.
Boxplot of relative errors in cattle body measurement data. The 25–75% range represents the interquartile range (IQR), the horizontal line within each box indicates the median, and the hollow square denotes the MRE.
Although the proposed automatic cattle body measurement method can meet the requirements for breeding data collection, some limitations remain. The data were collected in a fixed-channel environment with a simple unobstructed background, which may reduce the model’s robustness when used to complex scenarios. In future work, images of cattle with and without occlusions should be collected in diverse environments such as barns and pastures, enabling the model to be trained for improved robustness and more effective body measurement in complex backgrounds. In addition, the dataset included only a single cattle breed, which limits the model’s generalizability across multiple breeds. Future research should incorporate data from multiple regions and cattle breeds to enhance robustness and improve applicability in multi-breed measurements. Moreover, the errors in 3D traits such as cannon circumference, chest girth, and abdominal girth were larger than those of 2D traits. To address this, multi-angle images—for example, those captured from the direct posterior view—could be collected to more accurately reconstruct true body dimensions, providing higher-quality data for breeding. Furthermore, deploying the method on terminal devices such as smartphones in the future could enable real-time and convenient measurement of cattle body dimensions, supporting broader implementation and application of this novel automatic measurement approach.
5. Discussion
To address the limitations of existing computer vision-based methods for cattle body size measurement, including high compute cost, expensive equipment, and limited measurable traits, this study proposed an efficient automatic measurement approach based on side view and back view 2D images captured by monocular cameras. The approach involves creating a cattle body measurement keypoint dataset with symmetry and fixed relative positions, using an improved keypoint detection model to achieve accurate and efficient body size measurement for cattle breeding. We developed the SCW-YOLO model by improving upon YOLOv11n-pose. Specifically, the S2FE module was introduced to enhance feature extraction while significantly reducing parameters and computational complexity. The C2DCRA attention module replaced the original C2f structure, enabling channel compression and global pooling to improve global information extraction and reduce redundancy. Furthermore, the WTPHead detection head based on WTConv employed wavelet transforms to enlarge the receptive field and decrease compute cost and redundant parameters. The SCW-YOLO model achieved excellent performance, with an average of 1.2M parameters, 2.2 G FLOPs, a model size of 2.5 MB, and a mAP of 97.4% across side view and back view datasets. Building on detected keypoints and corresponding measurement formulas, 11 body size traits were computed. The MRE were 2.8% for body height, 4.4% for chest depth, 4.0% for abdominal depth, 4.7% for chest width, 4.0% for abdominal width, 3.1% for hip height, 4.6% for rump length, 6.5% for diagonal body length, 8.8% for cannon circumference, 9.9% for chest girth, and 9.4% for abdominal girth, with an overall average MRE of 5.7%. These results demonstrate that the proposed SCW-YOLO-based method enables efficient and accurate automatic measurement of cattle body traits, meeting the precision requirements for cattle breeding. This approach provides a novel and practical solution for livestock selection and body size evaluation.
Author Contributions
Conceptualization, X.C. and X.G.; methodology, X.C.; software, X.C.; validation, X.C. and Y.L.; formal analysis, X.C.; investigation, X.C. and Y.L.; resources, X.G. and Y.L.; data curation, X.C. and Y.L.; writing—original draft preparation, X.C.; writing—review and editing, X.G.; visualization, X.C. and C.L.; supervision, X.G. and Y.L.; project administration, X.C., X.G. and Y.L. All authors have read and agreed to the published version of the manuscript.
Funding
This research received no external funding.
Institutional Review Board Statement
The study was conducted in accordance with national and institutional regulations and was approved by the Ethics Committee of Gansu Agricultural University ethic committee (GSAU-Eth-IST-2025-020) on 28 October 2025.
Data Availability Statement
The data presented in this study are available on request from the corresponding author due to restrictions imposed by the cattle breeding farm. The data cannot be publicly shared due to privacy and ethical considerations regarding the animals involved.
Conflicts of Interest
The authors declare no conflicts of interest.
Abbreviations
The following abbreviations are used in this manuscript:
| SCW-YOLO | S2FE C2DRA WTPHead-YOLO |
| S2FE | ShuffleNet V2 Feature Extraction |
| C2DRA | Cross-Stage Partial with Depthwise Convolution and Channel Reduction Attention |
| WTPHead | Wavelet Convolution Pose Head |
| BH | body height |
| CD | chest depth |
| AD | abdominal depth |
| CW | chest width |
| AW | abdominal width |
| SH | sacral height |
| CL | croup length |
| DBL | diagonal body length |
| CC | cannon circumference |
| CG | chest girth |
| AG | abdominal girth |
| DWConv | depthwise convolution |
| CRA | channel reduction attention |
| WT | wavelet transform |
| IWT | inverse wavelet transform |
| 2D | two-dimensional |
| 3D | three-dimensional |
| FLOPs | floating point operations per second |
| mAP | mean average precision |
| MRE | mean relative error |
| OKS | object keypoint similarity |
| Y | YOLOv11n-pose |
| S | S2FE |
| C | C2CRA |
| W | WTPHead |
| Y + S + C +W | SCW-YOLO |
| P | predicted body measurement value |
| T | true body measurement value |
| M | MRE |
References
- Friggens, N.C.; Blanc, F.; Berry, D.P.; Puillet, L. Review: Deciphering Animal Robustness. A Synthesis to Facilitate Its Use in Livestock Breeding and Management. Animal 2017, 11, 2237–2251. [Google Scholar] [CrossRef]
- Song, H.; Dong, T.; Yan, X.; Wang, W.; Tian, Z.; Sun, A.; Dong, Y.; Zhu, H.; Hu, H. Genomic Selection and Its Research Progress in Aquaculture Breeding. Rev. Rev. Rev. Aquac. 2023, 15, 274–291. [Google Scholar] [CrossRef]
- Ouédraogo, D.; Soudré, A.; Yougbaré, B.; Ouédraogo-Koné, S.; Zoma-Traoré, B.; Khayatzadeh, N.; Traoré, A.; Sanou, M.; Mészáros, G.; Burger, P.A.; et al. Genetic Improvement of Local Cattle Breeds in West Africa: A Review of Breeding Programs. Sustainability 2021, 13, 2125. [Google Scholar] [CrossRef]
- Ma, W.; Qi, X.; Sun, Y.; Gao, R.; Ding, L.; Wang, R.; Peng, C.; Zhang, J.; Wu, J.; Xu, Z.; et al. Computer Vision-Based Measurement Techniques for Livestock Body Dimension and Weight: A Review. Agriculture 2024, 14, 306. [Google Scholar] [CrossRef]
- Li, J.; Ma, W.; Bai, Q.; Tulpan, D.; Gong, M.; Sun, Y.; Xue, X.; Zhao, C.; Li, Q. A Posture-Based Measurement Adjustment Method for Improving the Accuracy of Beef Cattle Body Size Measurement Based on Point Cloud Data. Biosyst. Eng. 2023, 230, 171–190. [Google Scholar] [CrossRef]
- Li, K.; Teng, G. Study on Body Size Measurement Method of Goat and Cattle Under Different Background Based on Deep Learning. Electronics 2022, 11, 993. [Google Scholar] [CrossRef]
- Zhao, K.; Zhang, M.; Shen, W.; Liu, X.; Ji, J.; Dai, B.; Zhang, R. Automatic Body Condition Scoring for Dairy Cows Based on Efficient Net and Convex Hull Features of Point Clouds. Comput. Electron. Agric. 2023, 205, 107588. [Google Scholar] [CrossRef]
- Ling, Y.; Jimin, Z.; Caixing, L.; Xuhong, T.; Sumin, Z. Point Cloud-Based Pig Body Size Measurement Featured by Standard and Non-Standard Postures. Comput. Electron. Agric. 2022, 199, 107135. [Google Scholar] [CrossRef]
- Khoroshailo, T.A.; Komlatsky, V.I.; Kozub, Y.A. Use of Computer Technologies in Animal Breeding. IOP Conf. Ser. Earth Environ. Sci. 2021, 666, 042027. [Google Scholar] [CrossRef]
- Zhang, A.L.; Wu, B.P.; Wuyun, C.T.; Jiang, D.X.; Xuan, E.C.; Ma, F.Y. Algorithm of Sheep Body Dimension Measurement and Its Applications Based on Image Analysis. Comput. Electron. Agric. 2018, 153, 33–45. [Google Scholar] [CrossRef]
- Zheng, Z.; Gao, J.B.; Weng, Z. Measurement of Body Size Parameters and Body Weight Prediction in Beef Cattle Based on Image Analysis. J. Intell. Fuzzy Syst. 2024, 47, 155–167. [Google Scholar] [CrossRef]
- Qin, Q.; Dai, D.; Zhang, C.; Zhao, C.; Liu, Z.; Xu, X.; Lan, M.; Wang, Z.; Zhang, Y.; Su, R.; et al. Identification of Body Size Characteristic Points Based on the Mask R-CNN and Correlation with Body Weight in Ujumqin Sheep. Front. Vet. Sci. 2022, 9, 995724. [Google Scholar] [CrossRef]
- Ai, B.; Li, Q. SOLOv2-Based Multi-View Contactless Bovine Body Size Measurement. J. Phys. Conf. Ser. 2022, 2294, 012011. [Google Scholar] [CrossRef]
- Wang, Y.; Sun, G.; Seng, X.; Zheng, H.; Zhang, H.; Liu, T. Deep Learning Method for Rapidly Estimating Pig Body Size. Anim. Prod. Sci. 2023, 63, 909–923. [Google Scholar] [CrossRef]
- Peng, Y.; Peng, Z.; Zou, H.; Liu, M.; Hu, R.; Xiao, J.; Liao, H.; Yang, Y.; Huo, L.; Wang, Z. A Dynamic Individual Method for Yak Heifer Live Body Weight Estimation Using the YOLOv8 Network and Body Parameter Detection Algorithm. J. Dairy Sci. 2024, 107, 6178–6191. [Google Scholar] [CrossRef]
- Qin, Q.; Zhang, C.; Lan, M.; Zhao, D.; Zhang, J.; Wu, D.; Zhou, X.; Qin, T.; Gong, X.; Wang, Z.; et al. Machine Vision Analysis of Ujumqin Sheep’s Walking Posture and Body Size. Animals 2024, 14, 2080. [Google Scholar] [CrossRef]
- Yang, G.; Xu, X.; Song, L.; Zhang, Q.; Duan, Y.; Song, H. Automated Measurement of Dairy Cows Body Size via 3D Point Cloud Data Analysis. Comput. Electron. Agric. 2022, 200, 107218. [Google Scholar] [CrossRef]
- Jin, B.; Wang, G.; Feng, J.; Qiao, Y.; Yao, Z.; Li, M.; Wang, M. PointStack Based 3D Automatic Body Measurement for Goat Phenotypic Information Acquisition. Biosyst. Eng. 2024, 248, 32–46. [Google Scholar] [CrossRef]
- Weng, Z.; Lin, W.; Zheng, Z. Cattle Body Size Measurement Based on DUOS–PointNet++. Animals 2024, 14, 2553. [Google Scholar] [CrossRef]
- Lu, H.; Zhang, J.; Yuan, X.; Lv, J.; Zeng, Z.; Guo, H.; Ruchay, A. Automatic Coarse-to-Fine Method for Cattle Body Measurement Based on Improved GCN and 3D Parametric Model. Comput. Electron. Agric. 2025, 231, 110017. [Google Scholar] [CrossRef]
- Hou, Z.; Zhang, Q.; Zhang, B.; Zhang, H.; Huang, L.; Wang, M. CattlePartNet: An Identification Approach for Key Region of Body Size and Its Application on Body Measurement of Beef Cattle. Comput. Electron. Agric. 2025, 232, 110013. [Google Scholar] [CrossRef]
- Xu, Z.; Li, Q.; Ma, W.; Li, M.; Morris, D.; Ren, Z.; Zhao, C. A Geodesic Distance Regression-Based Semantic Keypoints Detection Method for Pig Point Clouds and Body Size Measurement. Comput. Electron. Agric. 2025, 234, 110285. [Google Scholar] [CrossRef]
- Boonyopakorn, P.; Ketcham, M. Geometric Symmetry and Temporal Optimization in Human Pose and Hand Gesture Recognition for Intelligent Elderly Individual Monitoring. Symmetry 2025, 17, 1423. [Google Scholar] [CrossRef]
- Liu, S.; Wang, X.; Ji, H.; Wang, L.; Hou, Z. A Novel Driver Abnormal Behavior Recognition and Analysis Strategy and Its Application in a Practical Vehicle. Symmetry 2022, 14, 1956. [Google Scholar] [CrossRef]
- Xu, Z.; Liu, R.; Wang, Z.; Wang, S.; Zhu, J. Detection of Key Points in Mice at Different Scales via Convolutional Neural Network. Symmetry 2022, 14, 1437. [Google Scholar] [CrossRef]
- Li, R.; Wen, Y.; Zhang, S.; Xu, X.; Ma, B.; Song, H. Automated Measurement of Beef Cattle Body Size via Key Point Detection and Monocular Depth Estimation. Expert Syst. Appl. 2024, 244, 123042. [Google Scholar] [CrossRef]
- Peng, C.; Cao, S.; Li, S.; Bai, T.; Zhao, Z.; Sun, W. Automated Measurement of Cattle Dimensions Using Improved Keypoint Detection Combined with Unilateral Depth Imaging. Animals 2024, 14, 2453. [Google Scholar] [CrossRef]
- Bai, L.; Guo, C.; Song, J. Cattle Weight Estimation Model Through Readily Photos. Eng. Appl. Artif. Intell. 2025, 143, 109976. [Google Scholar] [CrossRef]
- Yang, G.; Qiao, Y.; Deng, H.; Shi, J.Q.; Song, H. One-Stage Keypoint Detection Network for End-to-End Cow Body Measurement. Eng. Appl. Artif. Intell. 2025, 146, 110333. [Google Scholar] [CrossRef]
- Deng, H.; Yang, G.; Xu, X.; Hua, Z.; Liu, J.; Song, H. Fusion of CREStereo and MobileViT-Pose for Rapid Measurement of Cattle Body Size. Comput. Electron. Agric. 2025, 232, 110103. [Google Scholar] [CrossRef]
- Wang, D.; Tan, J.; Wang, H.; Kong, L.; Zhang, C.; Pan, D.; Li, T.; Liu, J. SDS-YOLO: An Improved Vibratory Position Detection Algorithm Based on YOLOv11. Measurement 2025, 244, 116518. [Google Scholar] [CrossRef]
- He, L.; Zhou, Y.; Liu, L.; Zhang, Y.; Ma, J. Application of the YOLOv11-Seg Algorithm for AI-Based Landslide Detection and Recognition. Sci. Rep. 2025, 15, 12421. [Google Scholar] [CrossRef]
- Li, P.; Chen, J.; Chen, Q.; Huang, L.; Jiang, Z.; Hua, W.; Li, Y. Detection and Picking Point Localization of Grape Bunches and Stems Based on Oriented Bounding Box. Comput. Electron. Agric. 2025, 233, 110168. [Google Scholar] [CrossRef]
- Wu, C.; Zhang, S.; Wang, W.; Wu, Z.; Yang, S.; Chen, W. Computation and Analysis of Phenotypic Parameters of Scylla paramamosain Based on YOLOv11-DYPF Keypoint Detection. Aquac. Eng. 2025, 111, 102571. [Google Scholar] [CrossRef]
- Howard, A.; Sandler, M.; Chu, G.; Chen, L.-C.; Chen, B.; Tan, M.; Wang, W.; Zhu, Y.; Pang, R.; Vasudevan, V.; et al. Searching for MobileNetV3. In Proceedings of the 2019 IEEE/CVF International Conference on Computer Vision (ICCV), Seoul, Republic of Korea, 27 October–2 November 2019. [Google Scholar]
- Tan, M.; Le, Q. EfficientNetV2: Smaller Models and Faster Training. In Proceedings of the 38th International Conference on Machine Learning, Virtual, 18–24 July 2021; pp. 10096–10106. [Google Scholar]
- Ma, X.; Dai, X.; Bai, Y.; Wang, Y.; Fu, Y. Rewrite the Stars 2024. In Proceedings of the IEEE/CVF Conference on Computer Vision and Pattern Recognition (CVPR), Seattle, WA, USA, 17–18 June 2024. [Google Scholar]
- Ma, N.; Zhang, X.; Zheng, H.-T.; Sun, J. ShuffleNet V2: Practical Guidelines for Efficient CNN Architecture Design. In Proceedings of the 15th European Conference, Munich, Germany, 8–14 September 2018; pp. 116–131. [Google Scholar]
- Chen, S.; Zhang, K.; Zhao, Y.; Sun, Y.; Ban, W.; Chen, Y.; Zhuang, H.; Zhang, X.; Liu, J.; Yang, T. An Approach for Rice Bacterial Leaf Streak Disease Segmentation and Disease Severity Estimation. Agriculture 2021, 11, 420. [Google Scholar] [CrossRef]
- Ni, S.; Jia, Y.; Zhu, M.; Zhang, Y.; Wang, W.; Liu, S.; Chen, Y. An Improved ShuffleNetV2 Method Based on Ensemble Self-Distillation for Tomato Leaf Diseases Recognition. Front. Plant Sci. 2025, 15, 1521008. [Google Scholar] [CrossRef]
- Chen, Z.; Yang, J.; Chen, L.; Jiao, H. Garbage Classification System Based on Improved ShuffleNet V2. Resour. Conserv. Recycl. 2022, 178, 106090. [Google Scholar] [CrossRef]
- Howard, A.G.; Zhu, M.; Chen, B.; Kalenichenko, D.; Wang, W.; Weyand, T.; Andreetto, M.; Adam, H. MobileNets: Efficient Convolutional Neural Networks for Mobile Vision Applications. arXiv 2017, arXiv:1704.04861. [Google Scholar] [CrossRef]
- Liao, Y.; Li, L.; Xiao, H.; Xu, F.; Shan, B.; Yin, H. YOLO-MECD: Citrus Detection Algorithm Based on YOLOv11. Agronomy 2025, 15, 687. [Google Scholar] [CrossRef]
- Wan, D.; Lu, R.; Shen, S.; Xu, T.; Lang, X.; Ren, Z. Mixed Local Channel Attention for Object Detection. Eng. Appl. Artif. Intell. 2023, 123, 106442. [Google Scholar] [CrossRef]
- Kang, B.; Moon, S.; Cho, Y.; Yu, H.; Kang, S.-J. MetaSeg: MetaFormer-Based Global Contexts-Aware Network for Efficient Semantic Segmentation. In Proceedings of the 2024 IEEE/CVF Winter Conference on Applications of Computer Vision (WACV), Waikoloa, HI, USA, 3–8 January 2024; pp. 434–443. [Google Scholar]
- Chen, Z.; He, Z.; Lu, Z.-M. DEA-Net: Single Image Dehazing Based on Detail-Enhanced Convolution and Content-Guided Attention. IEEE Trans. Image Process. 2024, 33, 1002–1015. [Google Scholar] [CrossRef]
- Zhang, X.; Song, Y.; Song, T.; Yang, D.; Ye, Y.; Zhou, J.; Zhang, L. LDConv: Linear Deformable Convolution for Improving Convolutional Neural Networks. Image Vis. Comput. 2024, 149, 105190. [Google Scholar] [CrossRef]
- Finder, S.E.; Amoyal, R.; Treister, E.; Freifeld, O. Wavelet Convolutions for Large Receptive Fields. In Computer Vision—ECCV 2024, Proceedings of the 18th European Conference, Milan, Italy, 29 September–4 October 2024; Leonardis, A., Ricci, E., Roth, S., Russakovsky, O., Sattler, T., Varol, G., Eds.; Springer Nature: Cham, Switzerland, 2025; pp. 363–380. [Google Scholar]
- Heil, C. Ten Lectures on Wavelets (Ingrid Daubechies). SIAM Rev. 1993, 35, 666–669. [Google Scholar] [CrossRef]
- Zou, J.; Wang, T.; Li, D.; Wang, Q. WTF-Former: A Model for Predicting Optical Chaos in Laser System. Opt. Commun. 2025, 587, 131946. [Google Scholar] [CrossRef]
- Zhang, H.; Li, S.; Zhu, X.; Chen, H.; Yao, W. 3-D LiDAR and Monocular Camera Calibration: A Review. IEEE Sens. J. 2025, 25, 10530–10555. [Google Scholar] [CrossRef]
- Li, J.; Zhang, D. Camera Calibration with a Near-Parallel Imaging System Based on Geometric Moments. Opt. Eng. 2011, 50, 023601. [Google Scholar] [CrossRef]
- Almkvist, G.; Berndt, B. Gauss, Landen, Ramanujan, the Arithmetic-Geometric Mean, Ellipses, π, and the Ladies Diary. Am. Math. Mon. 1988, 95, 585–608. [Google Scholar] [CrossRef]
- Kreiss, S.; Bertoni, L.; Alahi, A. OpenPifPaf: Composite Fields for Semantic Keypoint Detection and Spatio-Temporal Association. IEEE Trans. Intell. Transp. Syst. 2022, 23, 13498–13511. [Google Scholar] [CrossRef]
- Meng, Z.; Du, X.; Sapkota, R.; Ma, Z.; Cheng, H. YOLOv10-Pose and YOLOv9-Pose: Real-Time Strawberry Stalk Pose Detection Models. Comput. Ind. 2025, 165, 104231. [Google Scholar] [CrossRef]
Disclaimer/Publisher’s Note: The statements, opinions and data contained in all publications are solely those of the individual author(s) and contributor(s) and not of MDPI and/or the editor(s). MDPI and/or the editor(s) disclaim responsibility for any injury to people or property resulting from any ideas, methods, instructions or products referred to in the content. |
© 2025 by the authors. Licensee MDPI, Basel, Switzerland. This article is an open access article distributed under the terms and conditions of the Creative Commons Attribution (CC BY) license (https://creativecommons.org/licenses/by/4.0/).