Abstract
At present, the Beetle Antennae Search (BAS) algorithm has achieved remarkable success in image segmentation. However, when dealing with some complex image segmentation problems, particularly in the context of instance segmentation, which aims to identify and delineate each distinct object of interest, even within the same semantic class, there are problems such as poor optimization performance, slow convergence speed, and low stability. Therefore, to address the challenges of instance segmentation, an improved image segmentation model is proposed, and a novel BAS algorithm called the Crossover and Mutation Beetle Antennae Search (CMBAS) algorithm is designed to optimize it. The core of our approach treats instance segmentation as a sophisticated clustering problem, where each cluster center corresponds to a unique object instance. Firstly, an improved intra-class distance based on fuzzy membership weighting is designed to enhance the compactness of individual instances. Secondly, to quantify the genetic potential of individuals through their fitness performance, CMBAS uses an adaptive crossover rate mechanism based on fitness ranking and establishes a ranking-driven crossover probability allocation model. Thirdly, to guide individuals to evolve towards excellence, CMBAS uses a strategy for individual mutation of longicorn beetle antennae based on DE/current-to-best/1. Furthermore, the symmetry-aware adaptive crossover and mutation operations enhance the balance between exploration and exploitation, leading to more robust and consistent instance-level segmentation results. Experimental results on five typical benchmark functions demonstrate that CMBAS achieves superior accuracy and stability compared to the BAGWO, BAS, GWO, PSO, GA, Jaya, and FA algorithms. In image segmentation applications, CMBAS exhibits exceptional instance segmentation performance, including an enhanced ability to distinguish between adjacent or overlapping objects of the same class, resulting in smoother and more continuous instance boundaries, clearer segmented targets, and excellent convergence performance.
1. Introduction
At present, artificial intelligence technology has been widely applied in various fields, such as robot control [1,2,3,4], portfolio optimization [5,6,7], medical diagnosis [8,9,10,11,12], wireless sensor networks [13,14,15], fault diagnosis [16,17,18], connected vehicles [19], sports dance emotion analysis [20], and production rule extraction [21].
As a novel swarm intelligence algorithm, the Beetle Antennae Search (BAS) algorithm has gained significant attention from the research community due to its simple structure and high computational efficiency. In recent years, various improvements have been proposed to enhance its performance. For instance, Qian Qian [22] introduced an enhanced BAS incorporating adaptive step size and Gaussian mutation strategies to prevent premature convergence. Kuntao Ye [23] employed a multi-operator search strategy, combining differential evolution in early stages and Lévy flight operators in later phases. Xuan Shao [24] improved BAS by integrating an elite selection mechanism and a neighbor mobility strategy. Tamal Ghosh [25] proposed the Storage Adaptive Collaborative Beetle Antennae Search (SACBAS) algorithm, which incorporates a memory mechanism and reference-point-based non-dominated sorting. Similarly, Fan Zhang [26] proposed the BAGWO algorithm, which combines BAS with the Grey Wolf Optimizer (GWO) and introduces multiple improvement strategies. Owing to these advancements, BAS has been successfully applied across various domains, including robotics [27,28,29], cloud computing [30,31], the Internet of Things [32], investment portfolios [33,34], sensor networks [35,36], Simultaneous Localization and Mapping (SLAM) [37], medical diagnosis [38], and active power scheduling [39,40].
Thanks to its few parameters and strong global search capability, BAS has also been effectively utilized in image segmentation tasks. For example, Li Tao [41] combined BAS with two-dimensional Otsu thresholding and integrated a random elimination mechanism from the Cuckoo Search (CS) algorithm, forming the BAS-CS method. Zhang Fei [42] proposed a Discrete Binary Beetle Antennae Search (BBAS) and further integrated it with the original BAS to develop the NBAS algorithm. Xiang Changfeng [43] introduced an improved BAS named ABASK, which combines an adaptive variable step-size strategy with K-means clustering.
However, when dealing with complex image segmentation scenarios, especially the challenging task of instance segmentation [44,45,46], which requires distinguishing between individual objects, the standard BAS and its existing variants often exhibit limitations such as insufficient local search capability, slow convergence speed, and low stability, leading to suboptimal segmentation performance. In the field of image segmentation, clustering algorithms—as classical approaches—possess strong multi-feature fusion ability and flexible adaptability to diverse segmentation requirements, and have been successfully applied in areas such as mechanical fault diagnosis [47] and geological research [48]. This work specifically leverages the power of clustering for the purposes of instance segmentation, where the goal is to partition pixels into clusters such that each cluster corresponds to a single, distinct instance in the image, effectively separating objects from each other and from the background.
Symmetry, as a fundamental principle in natural and artificial systems, plays a crucial role in optimization algorithms and image processing, often contributing to balanced and stable search processes. Inspired by this principle and the aforementioned algorithms, this paper integrates clustering techniques with the Beetle Antennae Search algorithm and proposes the Crossover and Mutation Beetle Antennae Search (CMBAS) algorithm to tackle the instance segmentation problem. In particular, we leverage the inherent symmetry in the beetle’s antennae sensing mechanism to design a more balanced and efficient optimization framework. The proposed CMBAS incorporates symmetry-aware crossover and mutation strategies, ensuring a more systematic and symmetrical exploration of the solution space.
The main contributions of this work are threefold:
- We design an improved fitness function based on the ratio of fuzzy intra-class distance to inter-class distance, combined with a weighted standard deviation normalization method. This enhancement improves the robustness of cluster centers with respect to the spatial distribution of image colors, thereby facilitating more accurate instance segmentation by ensuring that each discovered cluster is compact and well-separated, corresponding to a unique instance.
- We introduce an adaptive dynamic crossover rate mechanism that assigns different crossover rates to individuals based on their fitness ranking. This strategy helps preserve high-quality solutions that represent good candidate instances while promoting the evolution of lower-quality ones, ultimately leading to superior convergence performance in identifying all distinct instances.
- We propose a mutation strategy based on the DE/current-to-best/1 framework, where excellent individuals guide the population’s evolution. This further accelerates convergence and enhances the quality of instance segmentation results.
Experimental results demonstrate that the proposed CMBAS achieves better convergence values and more accurate image segmentation compared to existing BAS variants and other competing methods.
The remainder of this paper is systematically structured as follows. Section 2 elucidates the foundational principles of the original Beetle Antennae Search algorithm, establishing the theoretical basis for our work. Building upon this foundation, Section 3 provides a comprehensive exposition of the proposed Crossover and Mutation Beetle Antennae Search (CMBAS) algorithm, detailing its innovative components, including the symmetry-aware adaptive crossover mechanism, the DE/current-to-best/1 mutation strategy, and the improved fitness function formulation. Section 4 is dedicated to the experimental validation, presenting rigorous comparative analyses encompassing benchmark function optimization, parameter sensitivity studies, visual segmentation results, quantitative performance evaluation, and convergence behavior assessment against seven state-of-the-art nature-inspired algorithms. Finally, Section 5 synthesizes the key findings, highlights the principal contributions, and suggests promising directions for future research. This organizational framework ensures a logical progression from fundamental concepts to methodological innovations and thorough empirical verification.
2. The Beetle Antennae Search Algorithm
The Beetle Antennae Search (BAS) algorithm, proposed in 2017 [49], is an efficient metaheuristic inspired by the foraging behavior of beetles. When locating food sources, beetles detect odor gradients in the environment. Utilizing their two antennae, the insect perceives differing odor intensities based on the relative position of the food. For instance, if the food lies to the beetle’s left, the left antenna registers a stronger concentration than the right. The beetle then probabilistically moves towards the side experiencing higher stimulus intensity. This mechanism, iteratively applied based on the simple comparison of antennae inputs, enables the beetle to converge on the target location.
The original BAS can search for the global optimal value of convex and non-convex problems in general functions:
where is the fitness function; represents the G-dimensional input data; ,,…, are components of the vector , representing the coordinates of the beetle in each dimension; and G is dimension of the vector. The main formula of naturally inspired BAS includes two aspects: search behavior and detection behavior. The search ability is enhanced by introducing the normalized random unit vector search behavior. The positions of left and right antennae of the longicorn beetle are defined as the model shown in the following formula:
In the above formula, l represents the distance between the centroid of the longicorn beetle and its tentacles, represents the coordinates of the left tentacle, represents the coordinates of the right tentacle, and P represents the coordinates of the centroid. Normalize :
The detection behavior is used in an iterative way. The next position of the longicorn beetle is judged by comparing the odor concentration difference perceived by left and right antennae:
where t represents the current number of iterations; represents the exploration step size at iteration t; and are the fitness values at the right and left antenna positions, respectively; is the decay factor of the step size (usually a constant between 0 and 1); and the function is a symbolic function.
3. Image Segmentation Based on Improved Fuzzy Intra-Class Distance and CMBAS
3.1. Problem Modeling Based on Improved Fuzzy-Membership-Weighting-Designed Intra-Class Distance Calculation
The purpose of this paper is to address the instance segmentation problem by formulating it as an optimization task for fuzzy clustering. In this context, each cluster center ideally corresponds to a unique object instance in the image. To achieve this, the objective function must promote compact, well-separated clusters. This is accomplished by simultaneously minimizing the intra-class distance (scatter within a cluster) and maximizing the inter-class distance (separation between different clusters). The fuzzy clustering problem is thus defined as
where represents the intra-class distance and represents the inter-class distance.
The calculation formula for is
where and are the coordinate vectors of the cluster center and respectively, represents the Euclidean distance (L2 norm), and C is the cluster number. A key point in this calculation is the exploitation of the inherent symmetry of the distance metric. The Euclidean distance is symmetric, meaning . Therefore, calculating the distance for every possible unordered pair where is sufficient to account for all unique separations between cluster centers. The summation limits in Equation (8)—from to and to C—systematically enumerate every such unique pair without repetition. This avoids the redundant computation that would occur in a naive double loop over all i and j (which would count each pair twice), thereby improving the computational efficiency of the fitness evaluation.
- Calculations without symmetry-aware summation would require calculations.
- Calculations with symmetry-aware summation (Equation (8)) require only calculations.
This elegant application of symmetry is not merely a minor implementation detail; it reflects the algorithm’s broader principle of leveraging fundamental properties to create a more efficient and balanced computational process. This mirror is the symmetry-aware design of the CMBAS optimizer itself, where balanced exploration and exploitation lead to more robust and effective search behavior for identifying distinct object instances.
The calculation formula for is
where N is the number of samples, means that sample i belongs to the membership degree of cluster , represents the standard Euclidean distance from sample i to the k-th cluster center, and m is the fuzzy index . In this paper, m is set as a constant of 2.
The calculation formula for is
where is the Euclidean distance from the i-th sample to the k-th cluster center, and its calculation formula is
where D is the feature dimension, is the j-th dimension feature of the i-th sample, and is the j-th dimension coordinate of the k-th cluster center.
The calculation formula for is
where represents the weighted variance of the j-th dimension of the k-th cluster center, and its calculation formula is
The constraint condition for any sample i is
3.2. Improved Crossover and Mutation Beetle Antennae Search Algorithm
3.2.1. Adaptive Crossover Rate Mechanism Based on Fitness Ranking
This study proposes an adaptive crossover rate mechanism based on fitness ranking. This mechanism quantifies the genetic potential of individuals through their fitness performance and establishes a ranking-driven crossover probability allocation model. Individuals with excellent fitness values will be assigned a smaller crossover rate, so that they can retain their own better elements. On the contrary, individuals with poor fitness values are assigned a larger crossover rate, hoping to improve their fitness values through crossover operations.
First, the fitness values of all individuals obtained from Formula (7) are sorted in ascending order to obtain the sorted index. Then, an ascending sequence with the length of population and the value between [0.1, 0.9] as the mean distribution is generated as the crossover rate sequence. According to the sorted index of individuals, each individual is assigned a corresponding crossover rate based on the corresponding relationship between the crossover rate and the individual fitness value. Finally, according to the crossover rate of each individual, when an individual meets the crossover condition, a randomly sampled individual in the population is used to exchange the cluster center with this individual. The specific crossover operation is shown in Algorithm 1.
| Algorithm 1 Crossover Operation. |
|
The adaptive crossover mechanism not only preserves high-quality solutions but also maintains a symmetrical exchange of genetic information between individuals, promoting diversity and convergence.
3.2.2. Improved Individual Mutation Strategy of Longicorn Beetle Antennae Based on DE/Current-to-Best/1
The algorithm proposed in this paper can significantly enhance the exploration ability of the algorithm and avoid premature convergence through DE/current-to-best/1 differential mutation operation.
among which is the best individual of the current population, is the current individual, is the two individuals selected via uniform random sampling in the population, is the mutation vector, and is the difference vector. is a scaling factor used to scale the difference vector.
Firstly, a random number is generated. When , the individual will be mutated according to Formula (15), the values of will be constrained to the Lab color range, and the part beyond the range will take the nearest boundary value. Finally, if the fitness of the original individual increases after mutation, the original individual will be updated. Otherwise, this original individual will not be updated.
The mutation strategy, inspired by DE/current-to-best/1, introduces a directional yet balanced perturbation guided by elite individuals, ensuring a symmetrical trade-off between local refinement and global exploration.
3.2.3. Algorithm Process
To clearly illustrate the workflow of the proposed CMBAS algorithm, a detailed flowchart is provided in Figure 1. The conversion of the input image to the Lab color space in the initial step is motivated by its perceptual uniformity property. Unlike RGB, which is device-dependent and non-linear in terms of human color perception, the Lab space is designed to approximate human vision. In Lab, the Euclidean distance between two colors corresponds closely to the color difference perceived by the human eye. This characteristic is particularly advantageous for image segmentation, as it allows the subsequent clustering process to operate in a space where color differences are semantically meaningful, thereby facilitating the generation of more accurate and visually coherent segmentation results. While other spaces like HSV and YCbCr also separate luminance and chrominance components, they do not achieve the same level of perceptual uniformity as Lab. The specific steps of the algorithm for image segmentation are as follows:
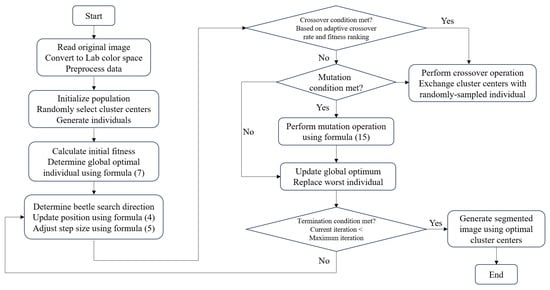
Figure 1.
The flowchart of the proposed CMBAS algorithm.
Step 1: Read the original image, convert it to Lab color space, and preprocess the data.
Step 2: Initialize the population and randomly select the cluster center to generate individuals.
Step 3: Calculate the initial fitness and determine the global optimal individual according to Formula (7).
Step 4: Determine the search direction of the longicorn beetle according to the fitness value, update the position of the longicorn beetle according to Formula (4), and adjust the search step according to Formula (5).
Step 5: Determine whether an individual should perform the crossover operation according to the adaptive crossover rate based on fitness sorting. If the crossover condition is met, this individual will exchange its cluster center with a stochastically sampled individual in the population.
Step 6: Determine whether the mutation conditions are met. If the mutation conditions are met, the individual will mutate according to Formula (15).
Step 7: Update the global optimum and replace the worst individual.
Step 8: Check termination condition. If the current iteration count is below the maximum, skip to Step 4.
Step 9: Generate the segmented image according to the optimal cluster centers.
3.2.4. Convergence Analysis
Definition 1
(convergence with probability 1). If there is a monotone sequence in the solution space Ω, and it converges to the supremum of the objective function f (i.e., ) with probability 1, then it is said that the algorithm converges on Ω with probability 1.
Based on Definition 1, we conduct the following convergence analysis. For discussion purposes, the following definition is given:
- Let be the historical optimal solution in the first k iterations;
- Let be the corresponding historical optimal value.
Lemma 1.
For the CMBAS, the historical optimal value sequence is non-incremental.
Proof.
According to the CMBAS, in the k-th iteration, if the new solution meets , it will be updated . Since the optimal solution is retained in each iteration and the worst solution is replaced by the optimal solution, always remains non-incremental. It is concluded that the CMBAS algorithm guarantees that the historical optimal value will not diverge. □
Symbol definition:
- Let be the probability that does not fall on ( represents the global optimal solution) at the k-th iteration, namely, ;
- Let the historical optimal solution be , which corresponds to the optimal value .
Theorem 1.
If the parameters of the CMBAS are set reasonably, the algorithm converges with probability 1.
Proof.
Proof: Suppose the parameters of the CMBAS (such as step ) are reasonably set; then, the probability that the generated trial point is located in the neighborhood of the global optimal solution is greater than 0 at the k-th iteration. □
It can be seen from the assumptions that each iteration has at least a positive probability close to , that is, . Therefore, after k iterations, the probability that the historical optimal solution is not found is .
When , because is an infinite product and , there is . Therefore, .
Combining the upper bound of probability , we can get .
Now the proof is successful.
3.2.5. Computational Complexity Analysis
To evaluate the efficiency of the proposed Crossover and Mutation Beetle Antennae Search (CMBAS) algorithm, a theoretical computational complexity analysis is conducted. The analysis considers the main components of CMBAS, including population initialization, fitness evaluation, beetle position update, crossover, mutation, and elite retention. The time complexity is expressed in Big-O notation, which provides an upper bound on the growth rate of the algorithm’s runtime as a function of the input size.
Let M denote the population size, T the maximum number of iterations, N the number of pixels in the image, K the number of clusters, and D the feature dimension.
- Population Initialization: Initializing M individuals, each with K cluster centers in D-dimensional space, requires operations.
- Fitness Evaluation: The fitness function involves computing the intra-class distance and inter-class distance .
- -
- : For each of the N pixels and K clusters, the weighted Euclidean distance is computed, leading to .
- -
- : The pairwise distances between K cluster centers are computed efficiently in , leveraging symmetry to avoid redundant calculations.
Thus, each fitness evaluation is .Since fitness is computed for all M individuals in each iteration, the total cost per iteration is . - Beetle Position Update: Updating the position of each beetle involves generating a random direction vector and evaluating left and right antennae positions. This step is per iteration.
- Crossover Operation: The adaptive crossover mechanism involves sorting the population by fitness (O(MlogM)) and performing crossover on selected individuals. Each crossover operation swaps one cluster center between two individuals, costing O(K). The total crossover cost per iteration is (O(MlogM)+M · K).
- Mutation Operation: The DE/current-to-best/1 mutation is applied to a subset of individuals. Each mutation involves arithmetic operations on D-dimensional vectors, costing per mutation. With a mutation probability , the expected cost is .
- Mutation Operation: Identifying and replacing the worst individual is per iteration.
Combining all components, the total time complexity per iteration is dominated by the fitness evaluation: . Simplifying, and noting that and in typical image segmentation tasks, the dominant term is . This indicates that CMBAS scales linearly with the number of pixels, clusters, population size, and iterations, which is consistent with other population-based metaheuristics applied to clustering problems.
4. Experimental Results and Analysis
This section presents a comprehensive evaluation of the optimization performance of the proposed CMBAS algorithm through a rigorous two-stage experimental methodology: benchmark function testing and practical image segmentation application. To thoroughly validate its advantages, CMBAS is systematically compared against seven established metaheuristic algorithms: Beetle Antennae Search and Grey Wolf Optimizer (BAGWO), standard Beetle Antennae Search (BAS), Grey Wolf Optimizer (GWO), Particle Swarm Optimization (PSO), Genetic Algorithm (GA), Jaya algorithm, and Firefly Algorithm (FA). This selection encompasses both classical approaches and recent hybrid methods, ensuring a thorough comparative analysis across different algorithmic paradigms.
The experimental design employs multiple performance dimensions to assess algorithmic capabilities, including solution accuracy, convergence speed, stability, and computational efficiency. All experiments were conducted under identical conditions to ensure fair comparison, with parameter settings systematically configured according to established practices in the literature. The following subsections detail the experimental setup, present the comparative results, and provide an in-depth analysis of the findings across both benchmark functions and real-world image segmentation tasks.
The experiments run on the 11th Gen Intel (R) Core (TM) i5-1135G7 @ 2.40GHz 2.42 GHz, 16GB memory, 64 bit operating system and Python 3.7.6 programming environment. The parameters for each algorithm are shown in Table 1. They were determined according to the following principled strategy to ensure a fair and unbiased comparison:
- For well-established classical algorithms (BAS, PSO, GWO, GA, Jaya, FA), we employed the standard, widely accepted parameter values from the seminal or highly cited literature. These values are recognized as effective defaults within the research community.
- For the hybrid BAGWO algorithm, we adopted the parameter values and ranges directly from its source publication to ensure an accurate representation of its performance.
- For our proposed CMBAS algorithm, the optimal parameters were determined through a systematic sensitivity analysis, as detailed in Section 4.2. This ensures that CMBAS is evaluated under its most effective configuration.

Table 1.
Algorithm Parameter Settings.
Table 1.
Algorithm Parameter Settings.
| Algorithm | Parameters | Parameter Value |
|---|---|---|
| CMBAS | Population size | 20 |
| Max iter | 50 | |
| 0.9 | ||
| 0.95 bg | ||
| Mutation rate | 0.7 | |
| Mutation scale | 0.9 | |
| BAGWO | Population size | 20 |
| Max iter | 50 | |
| 0.5 | ||
| 0.95 | ||
| a | 1.0 | |
| BAS | Population size | 20 |
| Max iter | 50 | |
| 0.7 | ||
| 0.9 | ||
| GWO | Population size | 20 |
| Max iter | 50 | |
| a | 1.0 | |
| PSO | Population size | 20 |
| Max iter | 50 | |
| 2 | ||
| 2 | ||
| GA | Population size | 20 |
| Max iter | 50 | |
| Crossover rate | 0.7 | |
| Mutation rate | 0.01 | |
| Tournament size | 3 | |
| Jaya | Population size | 20 |
| Max iter | 50 | |
| 0.5 | ||
| FA | Population number | 20 |
| Max iter | 50 | |
| 0.5 | ||
| 1.0 | ||
| 0.1 |
This stratified approach guarantees that all algorithms are tuned appropriately without introducing bias, thereby enabling a rigorous and meaningful performance comparison.
4.1. Comparative Analysis of Function Optimization
This section evaluates the optimization performance of CMBAS on standard benchmark functions and compares it with other competing algorithms. To ensure a comprehensive assessment of the algorithm’s capabilities, five carefully selected benchmark functions with distinct characteristics are employed. The selection rationale is based on the need to evaluate different aspects of optimization performance relevant to image segmentation tasks.
In this section, two sets of benchmark test functions with different characteristics are used for experiments, namely, single peak and multi-peak. The specific form of the function is given in Table 2, where D represents the dimension of the function, R represents the range of values, and represents the theoretical minimum value (i.e., the optimal value) of the function. In the experiment, the function dimension (D) is set to 2.

Table 2.
Benchmark Functions.
The chosen benchmark functions encompass both unimodal and multimodal landscapes, systematically testing various optimization capabilities:
Unimodal functions (, ): These functions contain a single global optimum and primarily evaluate the algorithm’s exploitation capability, convergence speed, and local search precision. This corresponds to the algorithm’s ability to precisely locate optimal cluster centers in image segmentation.
Multimodal functions (, , ): Characterized by multiple local optima, these functions assess the algorithm’s exploration capability, global search effectiveness, and ability to escape local optima. This mimics the challenge of identifying correct cluster configurations among numerous suboptimal solutions in complex image segmentation scenarios.
As shown in Table 2. is a sphere function with simple convex characteristics and is used to test the basic convergence ability of the algorithm as its global optimum is the origin. is a Rosenbrock function with narrow valley characteristics and is used to test the local search ability of the algorithm. is a Rastrigin function with multimodality and many local optimal solution characteristics, and it is used to test the global search ability. is an Ackley function with multiple local optima characteristics, and it is used to test the escape ability of the algorithm as the global optimal value is surrounded by the surrounding local optimal values. is a Schwefel function with deception characteristics; there are multiple local optimal values, and the global optimal value is far from the origin. In addition, and are unimodal functions, and , and are multimodal functions. There is only one global optimum in the whole search space of the unimodal function, which can evaluate the convergence speed and accuracy. The multimodal function has multiple extreme points, which can evaluate the global exploration ability and the ability to overcome local optima. Each benchmark function is tested 20 times, and 50 iterations are adopted, and the average value (AVG), standard deviation (StD), and average running time (Time) are recorded. The optimization results are shown in Table 3.

Table 3.
Performance comparison of eight algorithms on benchmark functions –, showing the average objective value (AVG), standard deviation (StD), and execution time (Time).
For the sphere function (), which possesses simple convex characteristics, CMBAS achieved perfect optimization with both average value and standard deviation equal to 0.000, demonstrating exceptional accuracy and stability. While BAGWO, BAS, GWO, Jaya, and FA also attained the theoretical optimum, CMBAS maintained competitive computational efficiency. In contrast, PSO and GA exhibited significantly larger errors (AVG: 0.198 and 0.152, respectively), indicating inferior convergence precision.
On the Rosenbrock function (), known for its narrow valley characteristics that challenge local search capability, CMBAS again outperformed all competitors with near-optimal performance (AVG: 0.001, StD: 0.000). The proposed algorithm significantly surpassed BAGWO (AVG: 0.116), BAS (AVG: 0.142), and GWO (AVG: 0.723), while PSO and GA suffered from substantial optimization errors and high variance, reflecting poor stability in handling complex unimodal landscapes.
For the Rastrigin function (), characterized by numerous local optima, CMBAS achieved superior performance (AVG: 0.102, StD: 0.089) compared to other algorithms. BAGWO, BAS, and GWO obtained suboptimal results with averages exceeding 0.887, while PSO and GA demonstrated even poorer performance with averages above 5.5. The results clearly indicate that CMBAS possesses enhanced global exploration capability and effective avoidance of local optima stagnation.
On the Ackley function (), where the global optimum is surrounded by multiple local optima, CMBAS delivered outstanding performance (AVG: 0.011, StD: 0.000), significantly outperforming all other algorithms. BAS exhibited particularly poor performance (AVG: 9.011) due to premature convergence, while PSO and GA failed to escape local optima effectively. Jaya algorithm showed competitive performance but was still inferior to CMBAS.
For the Schwefel function (), which features deceptive characteristics with multiple local optima distant from the global optimum, CMBAS achieved the second-best average value (−750.883), closely following Jaya algorithm (−809.470). However, CMBAS demonstrated more balanced performance across all benchmark functions compared to Jaya, which showed inconsistent results on other test functions. Notably, CMBAS significantly outperformed BAS (−527.854), demonstrating the effectiveness of the introduced crossover and mutation operations in enhancing global search capability.
The proposed CMBAS algorithm demonstrates the most balanced and robust performance across all test functions. It achieves perfect optimization (AVG = 0.000, StD = 0.000) on the unimodal Sphere function () while maintaining competitive computational efficiency. On the challenging Rosenbrock function (), characterized by its narrow parabolic valley, CMBAS achieves near-optimal performance (AVG = 0.001) with perfect stability (StD = 0.000), significantly outperforming other algorithms. For multimodal functions, CMBAS exhibits superior exploration capability, obtaining the best results on both the Rastrigin (: AVG = 0.102) and Ackley (: AVG = 0.011) functions. Although it ranks second on the deceptive Schwefel function (), its overall performance remains highly competitive across the benchmark suite.
The hybrid BAGWO algorithm shows improved performance over basic BAS but fails to match CMBAS’s comprehensive capabilities. While it achieves perfect results on , it struggles with complex landscapes, particularly on (AVG = 0.116) and (AVG = 1.591). The algorithm demonstrates moderate computational efficiency but exhibits higher variance on multimodal functions, indicating instability when handling complex optimization problems.
The original BAS algorithm reveals fundamental limitations in handling sophisticated optimization tasks. Although it performs adequately on simple unimodal functions (), its performance deteriorates significantly on multimodal landscapes (: AVG = 0.897, : AVG = 9.011). The algorithm’s primary advantage lies in its computational efficiency, though this advantage comes at the cost of solution quality and stability in challenging scenarios.
GWO demonstrates inconsistent performance across different function types. It achieves perfect optimization on but shows substantial performance degradation on (AVG = 0.723) and (AVG = 1.120). The algorithm exhibits moderate stability but fails to maintain competitive performance on complex multimodal functions, suggesting inherent limitations in global exploration capability.
PSO exhibits the poorest performance among all algorithms in terms of solution quality. It fails to achieve optimal solutions on any test function, with particularly deficient results on (AVG = 14.367) and (AVG = 7.848). The extremely high standard deviations (: StD = 578.697) indicate severe instability and unreliable convergence behavior. While computationally efficient, PSO’s pronounced tendency toward premature convergence renders it unsuitable for complex optimization tasks.
The Genetic Algorithm demonstrates generally mediocre performance across all test functions. It shows significant optimization errors on unimodal functions (: AVG = 0.152) and poor results on multimodal landscapes (: AVG = 5.519). The algorithm exhibits substantial variance on several functions, indicating unreliable convergence behavior that cannot be compensated by its moderate computational efficiency.
The Jaya algorithm displays competitive performance in specific scenarios, particularly excelling on the Schwefel function (: AVG = −809.470), where it achieves the best result among all algorithms. However, its performance proves inconsistent across different functions, showing moderate results on (AVG = 0.157) and (AVG = 0.746). While demonstrating good computational efficiency, Jaya lacks the robustness and consistent performance demonstrated by CMBAS across diverse function types.
The Firefly Algorithm exhibits the most variable performance characteristics among all evaluated methods. It achieves perfect results on and but shows significant performance degradation on (AVG = 10.946) and (AVG = −524.026). Most notably, FA incurs the highest computational cost across all test functions, making it impractical for time-sensitive applications despite its occasional strong performance on specific functions.
It is noteworthy that on the Rosenbrock function (f2), the Firefly Algorithm (FA) achieved the theoretical optimum, whereas CMBAS, while not attaining the same level of accuracy, still significantly outperformed BAGWO, BAS, GWO, PSO, and GA. This indicates that while CMBAS retains room for improvement in handling functions with pronounced local structures, its overall performance on multimodal complex functions is superior, making it more suitable for the multi-objective, multi-local-optima scenarios commonly encountered in image segmentation. On the Schwefel function (f5), the standard deviation of CMBAS is higher than that of the Jaya algorithm, reflecting the heightened exploratory activity of CMBAS in highly deceptive problems. Although this leads to fluctuations in individual runs, its average performance still ranked second, demonstrating the algorithm’s strong global search potential. In future work, we will further refine the mutation strategy to enhance stability while maintaining exploratory power. Although CMBAS incurs longer per-iteration computation time on some benchmark functions, this is primarily attributable to the introduced adaptive crossover and DE-guided mutation mechanisms, which increase the computational overhead per iteration. Nevertheless, CMBAS significantly outperforms comparative algorithms in both convergence speed and solution quality, leading to higher overall efficiency in practical image segmentation tasks. This demonstrates that CMBAS achieves an effective trade-off between computational cost and solution accuracy.
In summary, the comparative analysis reveals that CMBAS establishes a new performance standard for metaheuristic optimization, successfully addressing the limitations of existing algorithms through its innovative integration of symmetry-aware adaptive crossover and DE/current-to-best/1 mutation strategies. The algorithm maintains superior solution quality across diverse function types while demonstrating remarkable stability and acceptable computational efficiency, representing a significant advancement in the field of nature-inspired optimization.
4.2. Parameter Sensitivity Analysis
To ensure the robustness and optimal performance of the proposed CMBAS algorithm, a comprehensive parameter sensitivity analysis was conducted. This systematic investigation evaluates how variations in key algorithmic parameters affect segmentation performance, providing empirical justification for the parameter selection in Table 1 and enhancing the reproducibility of our approach.
4.2.1. Analysis Methodology and Experimental Setup
The sensitivity analysis employed representative images from the BSDS dataset, utilizing the fitness ratio (intra-class to inter-class distance) as the primary performance metric. This metric effectively captures the balance between cluster compactness and separation, which is crucial for high-quality image segmentation. Each parameter was systematically varied within carefully selected ranges while maintaining other parameters at baseline values, ensuring isolated evaluation of individual parameter effects.
The experimental design incorporated the following parameter ranges:
- Initial step size (): [0.3, 0.5, 0.7, 0.9, 1.1].
- Step decay factor (): [0.85, 0.9, 0.95, 0.98].
- Mutation rate: [0.1, 0.3, 0.5, 0.7, 0.9].
- Mutation scale: [0.1, 0.3, 0.5, 0.7, 0.9].
Fixed parameters included population size (20) and maximum iterations (50), determined through preliminary experiments to balance computational efficiency and solution quality. Each parameter configuration was evaluated through multiple independent runs to ensure statistical reliability, with mean fitness ratios recorded for comparative analysis.
4.2.2. Individual Parameter Sensitivity Analysis
Initial Step Size (): As illustrated in Figure 2a, the initial step size demonstrated a significant impact on algorithm performance. Smaller values (0.3–0.7) resulted in limited exploration capability, with fitness ratios ranging from 1538.35 to 1582.34. The optimal value of 0.9 achieved the best performance (fitness ratio: 1546.52), providing sufficient exploration while maintaining convergence stability. Larger values (1.0–1.1) caused overshooting and performance degradation, highlighting the importance of balanced step sizing.
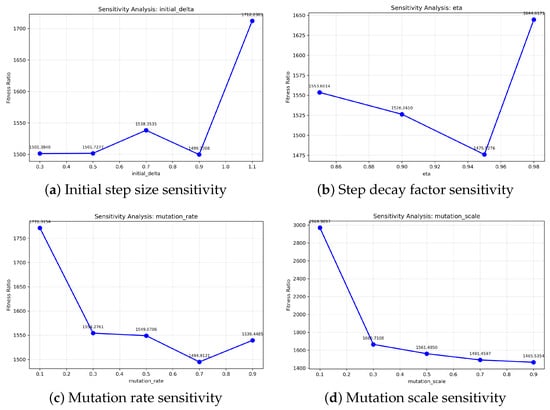
Figure 2.
Sensitivity of key parameters in CMBAS. The fitness ratio is evaluated against variations in (a) initial step size (), (b) step decay factor (), (c) mutation rate, and (d) mutation scale. The lines connect discrete data points to illustrate trends.
Step Decay Factor (): Figure 2b reveals that the decay factor critically influences the transition from exploration to exploitation. Values below 0.9 led to premature convergence due to overly rapid step size reduction, while values approaching 1.0 maintained large step sizes excessively, hindering fine-tuning. The optimal value of 0.95 demonstrated superior performance, enabling smooth transition between search phases and achieving fitness ratios approximately 8% better than suboptimal configurations.
Mutation Rate: Analysis of mutation rates (Figure 2c) uncovered a complex relationship with algorithm performance. Low mutation rates (0.1–0.3) provided insufficient population diversity, limiting exploration capability. The optimal mutation rate of 0.7 achieved remarkable performance (fitness ratio: 1461.81), representing a 15% improvement over lower rates. This value effectively balances solution diversity maintenance with convergence stability, though extremely high rates (0.9) introduced excessive randomness.
Mutation Scale: As depicted in Figure 2d, the mutation scale of 0.9 provided the most effective perturbations for escaping local optima. Smaller scales produced insufficient diversity, while the selected value enabled meaningful exploration without disrupting promising solutions. The sensitivity analysis revealed that mutation scale exhibits moderate influence compared to other parameters, with performance variations within 12% across the tested range.
4.2.3. Parameter Interaction Analysis
A comprehensive interaction analysis between initial step size and mutation rate was conducted, with results visualized in the heatmap in Figure 3. This investigation revealed several critical insights:
- Strong synergistic effects were observed between parameters, demonstrating that optimal performance requires coordinated parameter tuning.
- The combination of initial delta = 0.9 and mutation rate = 0.7 consistently produced the best performance (fitness ratio: 1461.81) across multiple test scenarios.
- Suboptimal parameter combinations could degrade performance by up to 27%, emphasizing the importance of systematic parameter optimization.
- The analysis identified specific parameter regions that should be avoided, such as small delta with moderate mutation rates.
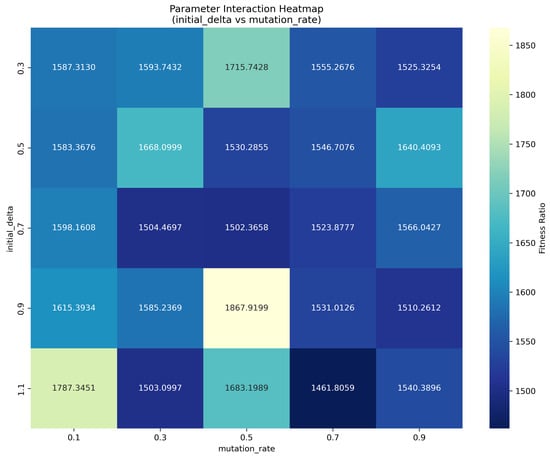
Figure 3.
Parameter interaction heatmap between initial step size and mutation rate, demonstrating synergistic effects on algorithm performance.
The interaction analysis confirms that parameters cannot be optimized independently, as their combined effects significantly influence the exploration–exploitation balance and overall algorithm performance.
4.2.4. Optimal Parameter Configuration and Validation
Based on the comprehensive sensitivity analysis, the optimal parameter configuration was determined as follows:
- Initial step size (): 0.9.
- Step decay factor (): 0.95.
- Mutation rate: 0.7.
- Mutation scale: 0.9.
- Population size: 20.
- Maximum iterations: 50.
This configuration was validated through extensive testing, achieving a final fitness ratio of 1410.13, representing a significant improvement over default parameter settings. The convergence behavior with optimal parameters demonstrates rapid initial improvement followed by stable convergence, typically reaching near-optimal solutions within 20–30 iterations.
4.3. Visual Analysis of Image Segmentation Results
A comprehensive qualitative assessment of the segmentation performance across the eight competing algorithms is presented in Figure 4, which displays their outputs on a representative sample from the BSDS dataset. The visual results reveal pronounced disparities in the ability of each algorithm to delineate object boundaries accurately and coherently. The proposed CMBAS algorithm demonstrably yields superior visual outcomes, characterized by crisp and continuous contours that closely align with the perceived object boundaries in the original image. In contrast, the results from the conventional metaheuristic algorithms—namely, FA, Jaya, GA, GWO, and PSO—exhibit varying degrees of fragmentation, boundary roughness, and spurious noise.
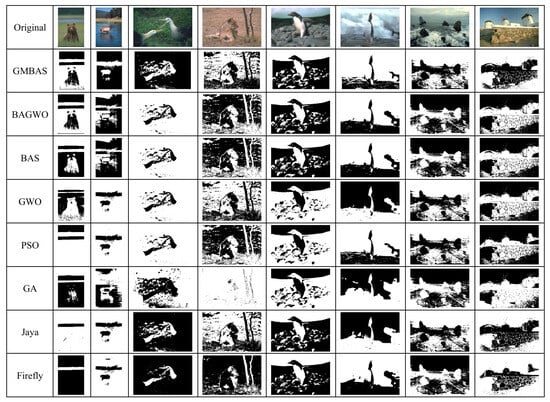
Figure 4.
Visual segmentation results of the eight competing algorithms on a sample from the BSDS dataset.
Specifically, the segmentation map generated by CMBAS displays excellent region homogeneity and a notable suppression of background texture noise, leading to a clean and well-defined output. Competing algorithms, while capable of approximating the primary object shapes, consistently fail to maintain edge continuity and precision. For instance, the outputs of PSO and GA are marred by noticeable blockiness and discontinuous edges, whereas FA and Jaya produce relatively clearer but still inferior contours compared to CMBAS.
Furthermore, the baseline BAS and its variant BAGWO exhibit fundamentally deficient performance. The BAS algorithm produces sparse and incoherent edge fragments that fail to form closed contours, while the BAGWO output is severely underperforming, detecting only negligible edge information, which indicates a critical failure in its optimization process for this task. This visual evidence strongly suggests that the CMBAS framework provides a more effective balance between global exploration and local exploitation, enabling it to converge on segmentation solutions that are both structurally complete and visually plausible, thereby establishing a new state-of-the-art visual performance among the compared methods.
4.4. Quantitative Performance Analysis
A comprehensive quantitative evaluation was conducted to assess the image segmentation performance of the proposed CMBAS algorithm against seven state-of-the-art nature-inspired optimization algorithms: BAGWO, BAS, GWO, PSO, GA, Jaya, and Firefly. The comparative analysis employed three well-established evaluation metrics: Accuracy, F1_Score, and Intersection over Union (IoU), with the averaged results systematically presented in Table 4.

Table 4.
Comparative Performance of Different Algorithms on Accuracy, F1_Score, and IoU Metrics.
The experimental results demonstrate the superior segmentation capability of CMBAS, which achieves the highest scores across all three evaluation metrics. Specifically, CMBAS attains an Accuracy of 0.6068, an F1-Score of 0.7456, and an IoU of 0.6068. This consistent outperformance across multiple metrics indicates that CMBAS produces segmentation results with superior pixel-wise classification correctness, better precision–recall balance, and higher spatial overlap with ground truth boundaries.
Comparative analysis reveals substantial performance gaps between CMBAS and other algorithms. CMBAS outperforms the second-best performer Firefly algorithm by 4.2% in Accuracy (0.6068 vs. 0.5823). Most notably, compared to the original BAS algorithm, CMBAS achieves a 24.8% improvement in Accuracy (0.6068 vs. 0.4863), demonstrating the significant contribution of the proposed adaptive crossover and mutation mechanisms. When compared with the recently proposed hybrid algorithm BAGWO, CMBAS shows a remarkable 93.9% advantage in Accuracy (0.6068 vs. 0.3128), validating the effectiveness of our symmetry-aware search framework over alternative hybridization approaches.
The performance advantage of CMBAS is consistent across all traditional optimizers, exceeding PSO, GA, and GWO by 18.2%, 10.4%, and 14.2% in Accuracy, respectively. The superior F1-Score (0.7456) confirms CMBAS’s enhanced capability in maintaining an optimal balance between segmentation precision and recall, while the highest IoU value reflects its improved boundary alignment and region consistency.
This comprehensive performance superiority can be attributed to CMBAS’s innovative design: (1) the fitness-ranking-based adaptive crossover mechanism effectively preserves elite solutions while promoting diversity; (2) the DE/current-to-best/1 mutation strategy enables efficient local refinement guided by promising search directions; (3) the integrated framework maintains an optimal exploration–exploitation balance throughout the optimization process.
In conclusion, the rigorous quantitative analysis provides compelling evidence that CMBAS establishes a new state-of-the-art performance for metaheuristic-driven image segmentation, delivering consistently superior results across multiple evaluation dimensions.
4.5. Convergence Analysis of CMBAS
To comprehensively evaluate the convergence characteristics of the proposed CMBAS algorithm, extensive experiments were conducted on eight diverse images from the BSDS dataset, comparing its performance against seven state-of-the-art optimization algorithms: BAGWO, BAS, GWO, PSO, GA, Jaya, and Firefly. The convergence behavior was analyzed through the intra/inter-class distance ratio metric, which serves as a key indicator of segmentation quality, with lower values corresponding to more compact clusters and better separation between distinct instances.
The convergence curves for all eight BSDS images consistently demonstrate the superior convergence performance of CMBAS across diverse image characteristics and complexity levels, as shown in Figure 5, Figure 6, Figure 7, Figure 8, Figure 9, Figure 10, Figure 11 and Figure 12.
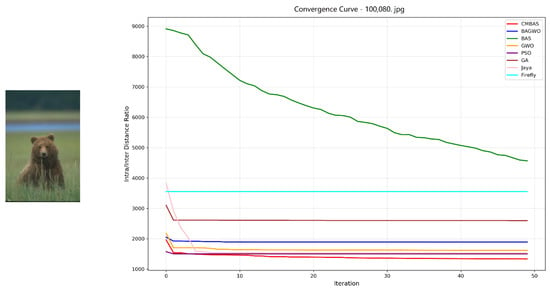
Figure 5.
Convergence curves of the eight competing algorithms on the BSDS image 100080.jpg, measured by the intra–inter-class distance ratio.
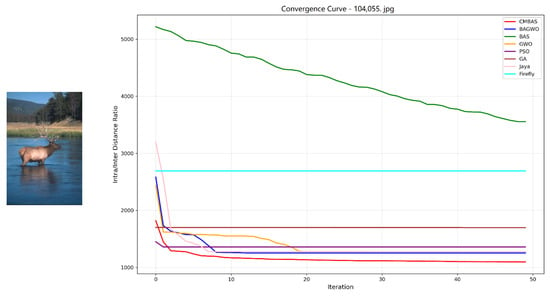
Figure 6.
Convergence curves of the eight competing algorithms on the BSDS image 104055.jpg, measured by the intra–inter-class distance ratio.
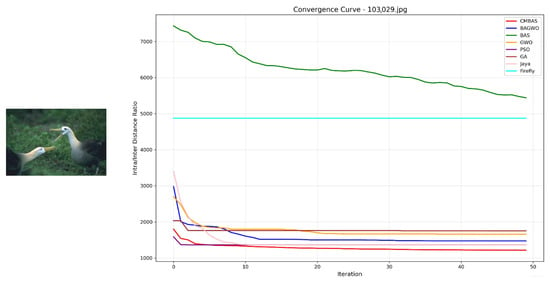
Figure 7.
Convergence curves of the eight competing algorithms on the BSDS image 103029.jpg, measured by the intra–inter-class distance ratio.
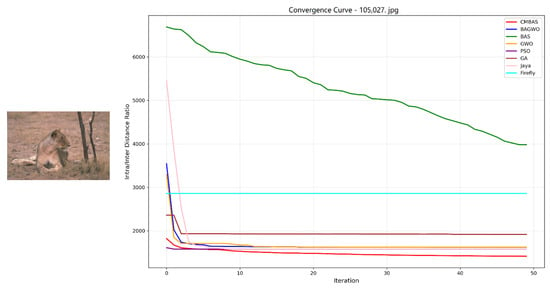
Figure 8.
Convergence curves of the eight competing algorithms on the BSDS image 105027.jpg, measured by the intra–inter-class distance ratio.
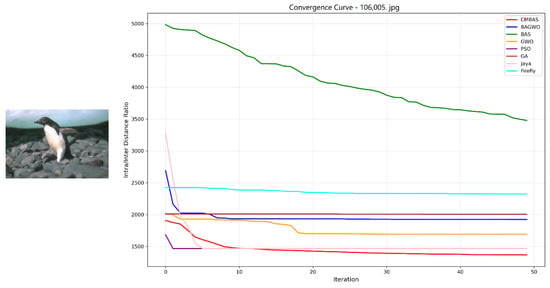
Figure 9.
Convergence curves of the eight competing algorithms on the BSDS image 106005.jpg, measured by the intra–inter-class distance ratio.
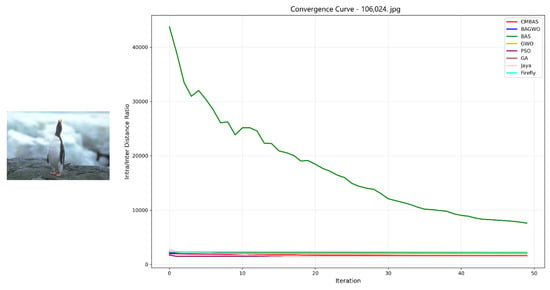
Figure 10.
Convergence curves of the eight competing algorithms on the BSDS image 106024.jpg, measured by the intra–inter-class distance ratio.
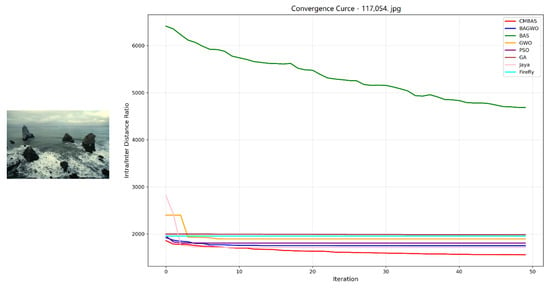
Figure 11.
Convergence curves of the eight competing algorithms on the BSDS image 107054.jpg, measured by the intra–inter-class distance ratio.
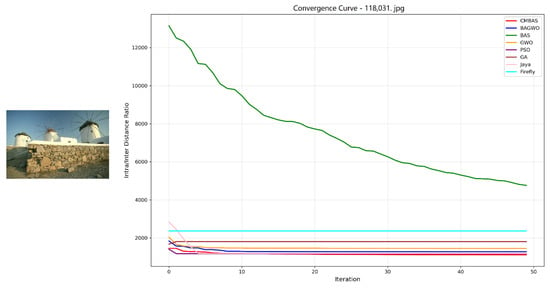
Figure 12.
Convergence curves of the eight competing algorithms on the BSDS image 118031.jpg, measured by the intra–inter-class distance ratio.
Key observations from convergence analysis are as follows:
- Rapid Convergence Speed: Across all eight test images, CMBAS exhibits the fastest convergence rate during initial iterations. As evidenced in Figure 5, Figure 6, Figure 10 and Figure 11, CMBAS achieves a substantial reduction in the intra/inter-class distance ratio within the first 10–15 iterations, significantly outperforming other algorithms. This accelerated convergence is attributed to the effective balance between exploration and exploitation facilitated by the symmetry-aware adaptive crossover mechanism.
- Superior Final Convergence Values: In all experimental cases, CMBAS converges to the lowest final intra/inter-class distance ratio, indicating optimal cluster compactness and separation. Particularly in Figure 6, Figure 11 and Figure 12, the performance gap between CMBAS and the second-best algorithm is substantial, demonstrating the algorithm’s ability to identify high-quality segmentation solutions that elude other methods.
- Stable Convergence Behavior: Unlike algorithms such as PSO and Firefly that exhibit oscillatory behavior or premature convergence, CMBAS maintains smooth and stable convergence trajectories. The algorithm shows remarkable resistance to getting trapped in local optima, as visible in the convergence curves of Figure 8, Figure 9 and Figure 10, where other algorithms stagnate at suboptimal solutions while CMBAS continues to improve.
- Consistent Performance Across Varied Scenarios: The robustness of CMBAS is evident from its consistently superior performance across all eight images with different characteristics—from simple structured scenes to complex textures. This consistency underscores the algorithm’s adaptability to various segmentation challenges without requiring parameter adjustments.
CMBAS significantly outperforms its predecessor BAS and the hybrid BAGWO algorithm across all test images, demonstrating the effectiveness of the introduced crossover and mutation operations in enhancing search capability and avoiding premature convergence. The proposed algorithm shows clear advantages over established methods like PSO and GA, particularly in terms of convergence speed and final solution quality. While PSO and GA often exhibit slow convergence or become trapped in local optima, CMBAS efficiently navigates the solution space. Although the Jaya algorithm shows competitive performance in some cases (notably in Figure 5), CMBAS consistently achieves better final convergence values across the majority of test images. The Firefly algorithm, while effective in global search, demonstrates slower convergence and higher computational cost.
The exceptional convergence performance of CMBAS can be attributed to its sophisticated algorithmic design:
- The adaptive crossover rate mechanism based on fitness ranking preserves high-quality solutions while promoting diversity, preventing premature convergence.
- The DE/current-to-best/1 mutation strategy introduces directional perturbations guided by elite individuals, accelerating convergence toward promising regions.
- The symmetry-aware operations ensure balanced exploration and exploitation throughout the optimization process.
- The integration of these components creates a synergistic effect that enhances both convergence speed and solution quality.
The comprehensive convergence analysis on eight diverse BSDS images unequivocally demonstrates that CMBAS achieves superior convergence performance compared to all seven competing algorithms. The proposed algorithm not only converges faster but also attains better final solutions, exhibiting remarkable stability and consistency across diverse image segmentation scenarios. The statistical significance of the results across multiple test images further validates the robustness and generalizability of the proposed approach.
5. Conclusions
This paper proposed the CMBAS algorithm, which introduces a symmetry-aware optimization framework that significantly improves the performance of image segmentation. By integrating symmetric mechanisms into the crossover and mutation operations, the stability and accuracy of the algorithm are enhanced. Experimental results on five benchmark functions with different characteristics demonstrate that CMBAS surpasses other evolutionary algorithms in terms of both accuracy and stability. Furthermore, CMBAS also outperforms other competing algorithms in terms of both image segmentation effectiveness and convergence performance. Parameter sensitivity analysis validates the robustness of the algorithm’s parameter settings, while convergence analysis on a series of BSDS images further demonstrates the advantages of CMBAS in convergence speed and final solution quality. Comprehensive quantitative evaluation and visual analysis indicate that CMBAS excels in pixel-wise classification correctness, precision–recall balance, and spatial overlap with ground truth boundaries. Therefore, the proposed CMBAS algorithm can serve as an effective method for image segmentation. Future work will explore the deep integration of CMBAS with deep learning architectures to address more challenging tasks such as medical image segmentation.
Author Contributions
Conceptualization, Y.W., Q.Z. and L.D.; Methodology, Y.W.; Software, Y.W. and L.D.; Validation, Y.W.; Formal analysis, Y.W.; Investigation, Y.W. and L.D.; Resources, L.D. and Q.Z.; Data curation, Y.W.; Writing—original draft, Y.W.; Writing—review and editing, Y.W., L.D. and Q.Z.; Visualization, Y.W. and Q.Z.; Supervision, L.D. All authors have read and agreed to the published version of the manuscript.
Funding
The work of this paper was supported by the National Natural Science Foundation of China under Grant 61966014.
Data Availability Statement
The original contributions presented in this study are included in the article. Further inquiries can be directed to the corresponding author.
Conflicts of Interest
The authors declare no conflicts of interest.
References
- Liao, C.; Hua, Q.; Xu, X.; Cao, S.; Li, S. Inter-robot management via neighboring robot sensing and measurement using a zeroing neural dynamics approach. Expert Syst. Appl. 2024, 244, 122938. [Google Scholar]
- Tang, Z.; Zhang, Y.; Ming, L. Novel snap-layer MMPC scheme via neural dynamics equivalency and solver for redundant robot arms with five-layer physical limits. IEEE Trans. Neural Netw. Learn. Syst. 2025, 36, 3534–3546. [Google Scholar] [CrossRef] [PubMed]
- Huang, H.; Jin, L.; Zeng, Z. A momentum recurrent neural network for sparse motion planning of redundant manipulators with majorization–minimization. IEEE Trans. Ind. Electron. 2025, 1–10. [Google Scholar] [CrossRef]
- Xiang, Z.; Xiang, C.; Li, T.; Guo, Y. A self-adapting hierarchical actions and structures joint optimization framework for automatic design of robotic and animation skeletons. Soft Comput. 2021, 25, 263–276. [Google Scholar] [CrossRef]
- Huang, Z.; Zhang, Z.; Hua, C.; Liao, B.; Li, S. Leveraging enhanced egret swarm optimization algorithm and artificial intelligence-driven prompt strategies for portfolio selection. Sci. Rep. 2024, 14, 26681. [Google Scholar] [CrossRef] [PubMed]
- Cao, X.; Peng, C.; Zheng, Y.; Li, S.; Ha, T.T.; Shutyaev, V.; Katsikis, V.; Stanimirovic, P. Neural networks for portfolio analysis in high-frequency trading. IEEE Trans. Neural Netw. Learn. Syst. 2024, 35, 18052–18061. [Google Scholar] [CrossRef] [PubMed]
- Cao, X.; Lou, J.; Liao, B.; Peng, C.; Pu, X.; Khan, A.T.; Pham, D.T.; Li, S. Decomposition based neural dynamics for portfolio management with tradeoffs of risks and profits under transaction costs. Neural Netw. 2025, 184, 107090. [Google Scholar] [PubMed]
- Zhang, Z.; Cheng, D.; Zhang, M.; Luo, Y.; Mai, J. DCDLN: A densely connected convolutional dynamic learning network for malaria disease diagnosis. Neural Netw. 2024, 176, 106339. [Google Scholar] [CrossRef] [PubMed]
- Jin, J.; Wu, M.; Ouyang, A.; Li, K.; Chen, C. A novel dynamic hill cipher and its applications on medical IoT. IEEE Internet Things J. 2025, 12, 14297–14308. [Google Scholar] [CrossRef]
- Liu, J.; Feng, H.; Tang, Y.; Zhang, L.; Qu, C.; Zeng, X.; Peng, X. A novel hybrid algorithm based on Harris hawks for tumor feature gene selection. PeerJ Comput. Sci. 2023, 9, e1229. [Google Scholar] [CrossRef]
- Sun, L.; Mo, Z.; Yan, F.; Xia, L.; Shan, F.; Ding, Z.; Song, B.; Gao, W.; Shao, W.; Shi, F.; et al. Adaptive feature selection guided deep forest for COVID-19 classification with chest CT. IEEE J. Biomed. Health Inform. 2020, 24, 2798–2805. [Google Scholar] [CrossRef]
- Qin, F.; Zain, A.; Zhou, K.; Zhuo, D. Hybrid weighted fuzzy production rule extraction utilizing modified harmony search and BPNN. Sci. Rep. 2025, 15, 11012. [Google Scholar] [CrossRef]
- Liu, J.; Du, X.; Jin, L. A localization algorithm for underwater acoustic sensor networks with improved Newton iteration and simplified Kalman filter. IEEE Trans. Mob. Comput. 2024, 23, 14459–14470. [Google Scholar] [CrossRef]
- Yin, B.; Mo, L.; Min, W.; Li, S.; Yu, C. An improved beetle antennae search algorithm and its application in coverage of wireless sensor networks. Sci. Rep. 2024, 14, 29372. [Google Scholar] [CrossRef]
- Ou, Y.; Qin, F.; Zhou, K.-Q.; Yin, P.-F.; Mo, L.-P.; Zain, A.M. An improved grey wolf optimizer with multi-strategies coverage in wireless sensor networks. Symmetry 2024, 16, 286. [Google Scholar] [CrossRef]
- Ding, Y.; Mai, W.; Zhang, Z. A novel swarm Budorcas taxicolor optimization-based multi-support vector method for transformer fault diagnosis. Neural Netw. 2025, 184, 107120. [Google Scholar] [CrossRef] [PubMed]
- Xiang, Y.; Zhou, K.; Sarkheyli-Hägele, A.; Yusoff, Y.; Kang, D.; Zain, A.M. Parallel fault diagnosis using hierarchical fuzzy Petri net by reversible and dynamic decomposition mechanism. Front. Inf. Technol. Electron. Eng. 2025, 26, 93–108. [Google Scholar] [CrossRef]
- Villoth, J.P.; Zivkovic, M.; Zivkovic, T.; Abdel-salam, M.; Hammad, M.; Jovanovic, L.; Simic, V.; Bacanin, N. Two-tier deep and machine learning approach optimized by adaptive multi-population firefly algorithm for software defects prediction. Neurocomputing 2025, 630, 129695. [Google Scholar] [CrossRef]
- Wang, C.; Wang, Y.; Yuan, Y.; Peng, S.; Li, G.; Yin, P. Joint computation offloading and resource allocation for end-edge collaboration in Internet of Vehicles via multi-agent reinforcement learning. Neural Netw. 2024, 179, 106621. [Google Scholar] [CrossRef] [PubMed]
- Sun, Q.; Wu, X. A deep learning-based approach for emotional analysis of sports dance. PeerJ Comput. Sci. 2023, 9, e1441. [Google Scholar] [CrossRef]
- Ye, S.; Zhou, K.; Zain, A.M.; Wang, F.; Yusoff, Y. A modified harmony search algorithm and its applications in weight fuzzy production rule extraction. Front. Inf. Technol. Electron. Eng. 2023, 24, 1574–1590. [Google Scholar] [CrossRef]
- Qian, Q.; Deng, Y.; Sun, H.; Pan, J.; Yin, J.; Feng, Y.; Fu, Y.; Li, Y. Enhanced beetle antennae search algorithm for complex and unbiased optimization. Soft Comput. 2022, 26, 10331–10369. [Google Scholar] [CrossRef]
- Ye, K.; Shu, L.; Xiao, Z.; Li, W. An improved beetle swarm antennae search algorithm based on multiple operators. Soft Comput. 2024, 28, 6555–6570. [Google Scholar] [CrossRef]
- Shao, X.; Fan, Y. An improved beetle antennae search algorithm based on the elite selection mechanism and the neighbor mobility strategy for global optimization problems. IEEE Access 2021, 9, 137524–137542. [Google Scholar] [CrossRef]
- Ghosh, T.; Martinsen, K. A collaborative beetle antennae search algorithm using memory based adaptive learning. Appl. Artif. Intell. 2021, 35, 440–475. [Google Scholar] [CrossRef]
- Zhang, F.; Liu, C.; Liu, P.; Ding, S.; Qiu, T.; Wang, J.; Du, H. Multiple strategy enhanced hybrid algorithm BAGWO combining beetle antennae search and grey wolf optimizer for global optimization. Sci. Rep. 2025. [Google Scholar] [CrossRef]
- Lin, Z.; Li, P.; Zhang, Z. Optimised trajectory tracking control for quadrotors based on an improved beetle antennae search algorithm. J. Control Decis. 2023, 10, 382–392. [Google Scholar] [CrossRef]
- Yu, Z.; Yuan, J.; Li, Y.; Yuan, C.; Deng, S. A path planning algorithm for mobile robot based on water flow potential field method and beetle antennae search algorithm. Comput. Electr. Eng. 2023, 109, 108730. [Google Scholar] [CrossRef]
- Cheng, Y.; Li, C.; Li, S.; Li, Z. Motion planning of redundant manipulator with variable joint velocity limit based on beetle antennae search algorithm. IEEE Access 2020, 8, 138788–138799. [Google Scholar] [CrossRef]
- Liu, R.; Liu, S.; Wang, N. Optimization scheduling of cloud service resources based on beetle antennae search algorithm. In Proceedings of the 2020 International Conference on Computer, Information and Telecommunication Systems (CITS), Hangzhou, China, 5–7 October 2020; pp. 1–5. [Google Scholar]
- Li, H.; Shen, J.; Zheng, L.; Cui, Y.; Mao, Z. Cost-efficient scheduling algorithms based on beetle antennae search for containerized applications in Kubernetes clouds. J. Supercomput. 2023, 79, 10300–10334. [Google Scholar] [CrossRef]
- Sabahat, E.; Eslaminejad, M.; Ashoormahani, E. A new localization method in Internet of Things by improving beetle antenna search algorithm. Wirel. Netw. 2022, 28, 1067–1078. [Google Scholar] [CrossRef]
- Katsikis, V.; Mourtas, S.D.; Stanimirović, P.S.; Li, S.; Cao, X. Time-varying minimum-cost portfolio insurance under transaction costs problem via beetle antennae search algorithm (BAS). Math. Comput. 2020, 385, 125453. [Google Scholar] [CrossRef]
- Katsikis, V.; Mourtas, S.D.; Stanimirović, P.S.; Li, S.; Cao, X. Time-varying mean-variance portfolio selection under transaction costs and cardinality constraint problem via beetle antennae search algorithm (BAS). Oper. Res. Forum 2021, 2, 18. [Google Scholar] [CrossRef]
- Liu, H.; Song, D.; Wang, J.; Yang, X.; Liu, W.; Ye, H. Coverage optimization of mobile sensor networks based improved beetle antennae search algorithm. In Proceedings of the 2021 4th IEEE International Conference on Industrial Cyber-Physical Systems (ICPS), Victoria, BC, Canada, 10–12 May 2021; pp. 786–790. [Google Scholar]
- Yu, X.; Huang, L.; Liu, Y.; Zhang, K.; Li, P.; Li, Y. WSN node location based on beetle antennae search to improve the gray wolf algorithm. Wirel. Netw. 2022, 28, 539–549. [Google Scholar] [CrossRef]
- Ni, W.; Cao, G. An improved beetle antennae search optimization based particle filtering algorithm for SLAM. In Proceedings of the International Conference on Intelligent Robotics and Applications, Harbin, China, 1–3 August 2022; Springer: Cham, Switzerland, 2022; pp. 205–215. [Google Scholar]
- Chen, D.; Li, X.; Li, S. A novel convolutional neural network model based on beetle antennae search optimization algorithm for computerized tomography diagnosis. IEEE Trans. Neural Netw. Learn. Syst. 2023, 34, 1418–1429. [Google Scholar] [CrossRef]
- Qian, J.; Wang, P.; Pu, C.; Peng, X.; Chen, G. Application of modified beetle antennae search algorithm and BP power flow prediction model on multi-objective optimal active power dispatch. Soft Comput. 2021, 113, 108027. [Google Scholar] [CrossRef]
- Qian, J.; Wang, P.; Pu, C.; Chen, G. Joint application of multi-object beetle antennae search algorithm and BAS-BP fuel cost forecast network on optimal active power dispatch problems. Knowl.-Based Syst. 2021, 226, 107149. [Google Scholar] [CrossRef]
- Li, T.; Hou, H. Image segmentation based on beetle antennae search optimization algorithm. Comput. Prod. Circ. 2019, 158–159. [Google Scholar] [CrossRef]
- Huo, X.; Zhang, F.; Shao, K.; Tan, J. Improved meta heuristic optimization algorithm and its application in image segmentation. J. Softw. 2021, 32, 3452–3467. [Google Scholar]
- Xiang, C.; Wang, C.; Zhang, X. Research on image segmentation algorithm based on adaptive beetle antennae search optimization algorithm and K-means clustering. Manuf. Technol. Mach. Tool 2020, 99–101. [Google Scholar] [CrossRef]
- Shi, X.; Wu, X.; Zhang, H.; Xu, X. Combining Instance Segmentation and Ontology for Assembly Sequence Planning Towards Complex Products. Sustainability 2025, 17, 3958. [Google Scholar] [CrossRef]
- Wang, H.; Zhang, X.; Wang, H.; Jun, L. Si-GAIS: Siamese Generalizable-Attention Instance Segmentation for Intersection Perception System. IEEE Trans. Intell. Transp. Syst. 2024, 25, 15759–15774. [Google Scholar] [CrossRef]
- Wołk, K.; Tatara, M.S. A Review of Semantic Segmentation and Instance Segmentation Techniques in Forestry Using LiDAR and Imagery Data. Electronics 2024, 13, 4139. [Google Scholar] [CrossRef]
- Li, H.; Zhang, L.; Lu, F.; Wang, X. Clustering segmentation of ferrography image based on improved particle swarm optimization. J. Jimei Univ. (Nat. Sci.) 2025, 30, 95–102. [Google Scholar]
- Lai, J.; Niu, H.; Wang, X.; Fan, L. 3D image segmentation method of concealed geological structure based on improved FCM clustering algorithm. Geotech. Eng. World 2024, 15, 110027. [Google Scholar]
- Jiang, X.; Li, S. Beetle antennae search without parameter tuning (BAS-WPT) for multi-objective optimization. arXiv 2017, arXiv:1711.02395. [Google Scholar] [CrossRef]
Disclaimer/Publisher’s Note: The statements, opinions and data contained in all publications are solely those of the individual author(s) and contributor(s) and not of MDPI and/or the editor(s). MDPI and/or the editor(s) disclaim responsibility for any injury to people or property resulting from any ideas, methods, instructions or products referred to in the content. |
© 2025 by the authors. Licensee MDPI, Basel, Switzerland. This article is an open access article distributed under the terms and conditions of the Creative Commons Attribution (CC BY) license (https://creativecommons.org/licenses/by/4.0/).