Abstract
This study develops a novel analytical solution for three-dimensional axisymmetric consolidation of unsaturated soils incorporating radial–vertical composite seepage mechanisms and anisotropic permeability characteristics. A groundbreaking dual orthogonal expansion framework is established, utilizing innovative Bessel–trigonometric function coupling to solve the inherently complex spatiotemporal coupled partial differential equations in cylindrical coordinate systems. The mathematical approach synergistically combines modal expansion theory with Laplace transform methodology, achieving simultaneous spatial expansion of gas–liquid two-phase pressure fields through orthogonal function series, thereby transforming the three-dimensional problem into solvable ordinary differential equations. Rigorous validation demonstrates exceptional accuracy with coefficient of determination R2 exceeding 0.999 and relative errors below 2% compared to numerical simulations, confirming theoretical correctness and practical applicability. The analytical solutions reveal four critical findings with quantitative engineering implications: (1) dual-directional drainage achieves 28% higher pressure dissipation efficiency than unidirectional drainage, providing design optimization criteria for vertical drainage systems; (2) normalized matric suction variation exhibits characteristic three-stage evolution featuring rapid decline, plateau stabilization, and slow recovery phases, while water phase follows bidirectional inverted S-curve patterns, enabling accurate consolidation behavior prediction under varying saturation conditions; (3) gas-water permeability ratio ka/kw spanning 0.1 to 1000 produces two orders of magnitude time compression effect from 10−2 s to 10−4 s, offering parametric design methods for construction sequence control; (4) initial pressure gradient parameters λa and λw demonstrate opposite regulatory mechanisms, where increasing λa retards consolidation while λw promotes the process, providing differentiated treatment strategies for various geological conditions. The unified framework accommodates both uniform and gradient initial pore pressure distributions, delivering theoretical support for refined embankment engineering design and construction control.
1. Introduction
The development of unsaturated soil consolidation theory has evolved along multiple theoretical dimensions, each addressing specific engineering challenges with distinct mathematical frameworks and applicable scopes. Based on Biot’s [1] three-dimensional consolidation theory, the axisymmetric consolidation theory successfully simplifies three-dimensional coupled consolidation problems into radial–vertical planar seepage consolidation analysis through axisymmetric assumptions, providing an effective theoretical analysis method for axisymmetric engineering problems such as pile foundations and embankments. A systematic analysis of existing research reveals three primary developmental pathways based on solution dimensions: one-dimensional, axisymmetric, and three-dimensional approaches. This dimensional classification provides essential insights into the theoretical boundaries, computational complexities, and engineering applicability of different methodological frameworks, ultimately revealing critical gaps that limit current analytical capabilities in composite seepage flow conditions.
One-dimensional consolidation approaches represent the foundation of unsaturated soil theory, with Moradi et al. [2] developing semi-analytical solutions for multilayered systems under time-dependent loading. Although these methods offer mathematical simplicity and computational efficiency, they fundamentally neglect radial seepage effects, limiting their applicability to strictly vertical drainage scenarios such as layered foundation systems. The theoretical constraint to unidirectional flow significantly restricts their engineering relevance in complex geotechnical applications where composite drainage pathways dominate. Axisymmetric consolidation methodologies demonstrate varying capabilities in handling boundary conditions and mathematical complexities. The foundational work by Dakshanamurthy et al. [3,4,5] established the coupled three-dimensional consolidation framework for unsaturated porous media, revealing that variations in permeability ratio ka/kw from 0.1 to 10 produce approximately 50% increases in settlement rates, with consolidation curves evolving from single S-shapes to double S-shapes. Building upon this foundation, the three-phase model theory developed by Loret and Khalili [6] provides comprehensive mathematical descriptions for complex unsaturated soil behavior. Conte [7] employed Fourier transform and finite element methods to investigate consolidation behavior under coupled and uncoupled conditions, finding slight initial increases in pore pressure manifesting as weakened Mandel-Cryer effects. The elastoplastic model constructed by Sun et al. [8,9] demonstrated that overconsolidation ratio OCR significantly influences settlement behavior, with clay settlement at OCR = 8 being 2.4 times that at OCR = 1. Furthermore, the three-dimensional model established by Niu et al. [10] based on the SMP criterion demonstrated good simulation capability through true triaxial tests, while Nakai et al. [11] found within a unified model framework that shear strength increases by approximately 25% when OCR increases from 1 to 8. Lu and Zhu [12] developed finite element three-dimensional consolidation models indicating that unsaturated soil settlement rates are significantly slower than saturated conditions.
Advanced axisymmetric approaches address specific engineering challenges with varying degrees of success. Huang et al. [13] developed solutions for impeded drainage boundaries through homogenization transformations, while Ho et al. [14,15,16] established equal-strain analytical frameworks incorporating smear effects. Comparative analysis reveals that Huang’s approach, though general, requires complex mathematical transformations that introduce potential numerical errors, whereas Ho’s series solutions, despite capturing important physical phenomena, are limited to specific strain conditions and single-direction seepage assumptions. Recent developments by Zhao et al. [17] and Shen et al. [18] have, respectively, proposed more refined axisymmetric consolidation models for electro-osmotic consolidation and multilayered anisotropic soils, yet these approaches maintain the fundamental limitation of unidirectional seepage assumptions.
Three-dimensional consolidation approaches achieve theoretical completeness but sacrifice mathematical tractability. Yuan et al. [19] demonstrated through triple Fourier series analysis that three-dimensional conditions exhibit significant spatial pressure non-uniformity, with center-to-edge pressure ratios reaching 4:1 (40 kPa versus 10 kPa), and consolidation rates 30–40% faster than lower-dimensional cases. However, the mathematical complexity of three-dimensional analytical solutions severely limits their practical applicability, with most research relying on numerical approximations rather than closed-form solutions. Qin et al. [20] combined boundary condition homogenization with eigenfunction methods to derive consolidation solutions, finding that when radial-to-vertical permeability ratios exceed 2, vertical seepage influence becomes negligible, suggesting potential for dimensional reduction while maintaining accuracy.
Considering the limitations of analytical methods, numerical modeling has become an important tool for three-dimensional consolidation analysis. The continuous evolution of computational mechanics has significantly advanced the capability to handle complex multi-physics coupling problems across various engineering disciplines. In structural engineering, sophisticated finite element techniques have been successfully developed for analyzing complex systems, such as composite shells with advanced connection mechanisms [21], dynamic structural systems incorporating vibration control devices [22], and advanced material structures requiring specialized computational treatments [23]. These computational advances in related engineering fields have provided valuable methodological insights for addressing the mathematical complexities inherent in unsaturated soil consolidation problems. Building upon these broader computational frameworks, Sheng et al. [24] systematically presented a complete framework from constitutive modeling to numerical algorithms specifically for unsaturated soil analysis, while Riad and Zhang [25] proposed a three-dimensional elastoplastic model considering hydro-mechanical hysteresis effects. The particle finite element model for simulating soil flow with elastoplasticity developed by Wang et al. [26] provides new numerical tools for handling large deformation problems in geotechnical applications, though numerical approaches generally offer less analytical transparency compared to closed-form solutions required for direct parametric design applications.
Seepage flow mechanism analysis reveals fundamental differences in theoretical approaches and their engineering implications. Single-direction vertical seepage models, exemplified by Conte [7] and Lu and Zhu [12], successfully capture coupled and uncoupled consolidation behaviors using Fourier transform methods, demonstrating that unsaturated soil settlement rates are significantly slower than saturated conditions. However, these approaches are inherently limited by their unidirectional seepage assumptions, failing to account for radial drainage effects that are critical in axisymmetric engineering applications. Radial-only seepage models developed by Chen et al. [27] and Zhou et al. [28] effectively incorporate smear and well resistance effects in vertical drain systems but neglect the contribution of vertical seepage components, resulting in incomplete representation of composite flow fields. Composite seepage flow conditions, representing the most realistic engineering scenarios, remain largely unaddressed by existing analytical frameworks despite their prevalence in foundation engineering applications such as pile-supported embankments and combined drainage systems.
Boundary condition treatment methodologies represent a critical differentiator among existing approaches. Traditional homogeneous boundary methods, as employed in early studies by Dakshanamurthy et al. [5], offer mathematical simplicity but severely limit engineering applicability. Advanced approaches by Huang et al. [13] and Zhao et al. [17] attempt to address non-homogeneous boundaries through transformation techniques, but these methods introduce computational complexity and potential numerical instabilities. The fundamental challenge lies in the mathematical requirement for homogenization when dealing with composite boundary conditions, creating a persistent trade-off between theoretical rigor and practical applicability that current methodologies have not successfully resolved. Series expansion convergence characteristics present significant analytical challenges. Semi-analytical methods developed by Ho et al. [14,15,16] and Shen et al. [18] demonstrate solution complexity with convergence and accuracy substantially influenced by series truncation effects. The boundary condition characteristics strongly correlate with convergence behavior, making parameter sensitivity analysis difficult and limiting the robustness of these approaches in engineering applications.
Coordinate system compatibility issues further complicate analytical development. Yuan et al. [19] employed Fourier series expansions suitable for Cartesian coordinates, while Qin et al. [20] utilized eigenfunction methods limited to simplified geometries. The fundamental incompatibility between conventional Fourier expansions and axisymmetric boundary conditions, particularly the mathematical singularity at r = 0, represents a persistent obstacle in cylindrical coordinate system applications. Systematic analysis of existing methodologies reveals four fundamental theoretical bottlenecks that collectively limit current analytical capabilities. (1) Seepage flow modeling limitations: Current analytical frameworks predominantly address unidirectional flow scenarios, with composite radial–vertical seepage remaining largely unresolved despite its prevalence in engineering applications. The quantitative analysis reveals that existing methods achieve acceptable accuracy only under restrictive conditions; for instance, Ho et al.’s equal-strain solutions apply exclusively to uniform loading with single-drainage boundaries [14,15,16], while Huang et al.’s general solutions require permeability ratios within narrow ranges (ka/kw < 5) for numerical stability [13]. (2) Mathematical complexity barriers: Non-homogeneous boundary condition treatment necessitates complex transformations that introduce computational errors and limit solution robustness. The homogenization requirements in current approaches result in solution expressions with 15–20 terms in series expansions, where truncation errors exceed 5% when fewer than 10 terms are retained, creating fundamental trade-offs between computational efficiency and solution accuracy. (3) Anisotropic permeability modeling gaps: Existing theories lack comprehensive frameworks for radial–vertical permeability coupling, preventing accurate representation of realistic soil behavior under composite drainage conditions. Current approaches treat anisotropy through simplified scalar ratios rather than tensor formulations, limiting their ability to capture the complex three-dimensional seepage patterns observed in field conditions where radial and vertical permeabilities exhibit spatial interdependence.
To address these systematic limitations, this study introduces an analytical framework that addresses the geometric constraints of existing methodological approaches. Distinguished from Yuan et al.’s Fourier series expansion for Cartesian coordinate systems and Qin et al.’s eigenfunction methods limited to simplified one-dimensional or radial problems [19,20], the proposed dual Bessel–trigonometric orthogonal expansion method provides a specialized solution for axisymmetric consolidation in cylindrical coordinate systems. The key innovations manifest in four critical aspects: (1) Geometric configuration advancement: While conventional Fourier expansions are inherently incompatible with axisymmetric boundary conditions and cannot handle the mathematical singularity at r = 0, the Bessel function intrinsically satisfies both the boundedness requirement at the cylindrical axis and the orthogonality conditions essential for axisymmetric problems; (2) Composite seepage mechanism treatment: Unlike existing approaches that primarily consider unidirectional flow, this study introduces the combined Bessel–trigonometric expansion to capture the anisotropic permeability effects (kr ≠ kz) in radial–vertical composite seepage coupling, addressing the challenge of simultaneously handling geometric decay characteristics in radial flow and uniform characteristics in vertical flow within the Jacobian-weighted differential equation system of cylindrical coordinates; (3) Mathematical solution methodology enhancement: The hybrid framework combining modal expansion theory with Laplace transforms achieves space-time decoupling—dual orthogonal expansion separates three-dimensional spatial variables while Laplace transforms handle the temporal domain, ultimately transforming spatiotemporal coupled partial differential equation systems into analytically solvable ordinary differential equations; (4) Theoretical scope extension: The unified analytical framework demonstrates broad applicability spanning uniform and gradient initial pore pressure distributions, single- and dual-drainage boundary conditions, and ka/kw ratios ranging from air-dominated to water-dominated seepage regimes, providing a comprehensive theoretical framework for axisymmetric unsaturated soil consolidation that existing Cartesian-based methods cannot directly address.
2. Mathematical Solution for Axisymmetric Consolidation Response to Uniform Loading
2.1. Fundamental Hypotheses
For the axisymmetric consolidation problem in unsaturated soils, soil materials exhibit highly nonlinear response characteristics due to their inherent multi-scale heterogeneous structure and complex coupling mechanisms among gas-water-solid phases, which brings significant difficulties to the theoretical description of consolidation behavior. To establish a mathematically tractable theoretical framework and derive analytical solutions with engineering guidance significance, the following fundamental hypotheses are adopted for the analysis:
(1) The soil exhibits uniform properties throughout the domain, with constant parameters in all directions. This assumption is fundamental to classical soil mechanics theory and essential for analytical solution development [1,29].
(2) Both soil particles and water are treated as incompressible media, maintaining constant volume during the loading process. This is justified by the significantly higher bulk modulus of soil particles and bulk modulus of water compared to constrained modulus of soil skeleton within engineering stress ranges [30,31].
(3) Water flow and air flow in pores move independently, following the continuum medium assumption, and the mutual interactions between them can be neglected. Under high saturation conditions, gas phase relative permeability decreases dramatically, making air-water interactions secondary to the overall seepage process [32,33].
(4) The influences of environmental factors including air diffusion and temperature changes are ignored. For conventional engineering time scales, these effects are secondary compared to primary hydro-mechanical coupling processes [34].
(5) The vertical drain boundaries are treated as fully permeable, without considering the seepage impedance effects at drain surfaces and slip effects at Solid–Liquid interfaces. This assumption is widely validated in well-designed drainage systems where boundary resistance is negligible relative to internal soil resistance [35,36].
(6) Material properties including properties of both fluid phases, consolidation coefficients in different directions, permeability parameters for air and water components, porosity, coefficient of volume change, and saturation degree are assumed constant throughout the analysis, remaining invariant with temporal, spatial, and state variables [29,37]. Although unsaturated soil parameters exhibit nonlinear characteristics, variations in soil-water characteristic curves and permeability functions are relatively gradual within specific water content ranges, particularly near residual or saturated states [38,39]. Linearization treatment is necessary for obtaining analytical solutions and represents the fundamental path of theoretical development from simple to complex systems.
While these assumptions provide a robust theoretical foundation, the model demonstrates optimal applicability under specific conditions. The framework is primarily suitable for: (1) unsaturated soils with relatively high saturation degrees where gas-water interactions are minimal; (2) relatively homogeneous soil layers where spatial variability is limited; (3) consolidation problems under moderate to low stress levels where material nonlinearity is reduced; and (4) preliminary engineering design and theoretical benchmark establishment. For highly unsaturated conditions, heterogeneous materials, or large deformation scenarios, practitioners may consider complementary numerical approaches or refined analytical models to achieve enhanced precision when warranted.
2.2. Mathematical Formulation of Cylindrical Consolidation
The theoretical approach for symmetric settlement analysis employs cylindrical coordinate methodology, with the vertical drain set as an ideal permeable boundary condition for both water and air, located at the central axis of the cylindrical geometry. r1 represents the characteristic radius of the central vertical drain, r2 represents the outer boundary radius of the computational domain, and the effective influence zone for drainage consolidation is the annular computational domain (r1 ≤ r ≤ r2), with the soil layer thickness set as H. The model fully considers the two-dimensional composite seepage mechanism in the radial–vertical directions, where the radial permeability coefficients for water and air phases are denoted respectively, and the vertical permeability coefficients for water and air phases are denoted, respectively. In the one-way drainage system, pore fluid can only dissipate through the top permeable boundary under load-driven conditions, with the bottom impermeable bedrock forming a closed boundary, as shown in Figure 1. Figure 2 illustrates the axisymmetric consolidation model with radial–vertical composite seepage under two-way drainage conditions
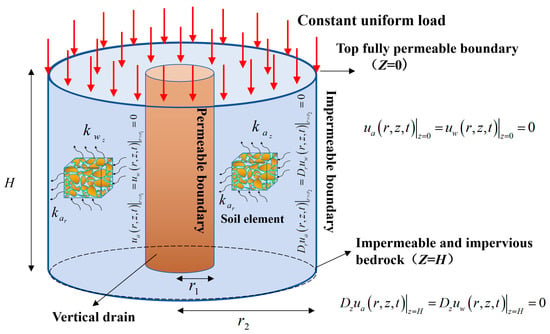
Figure 1.
One-way axisymmetric consolidation model with radial–vertical composite seepage under one-way drainage conditions.
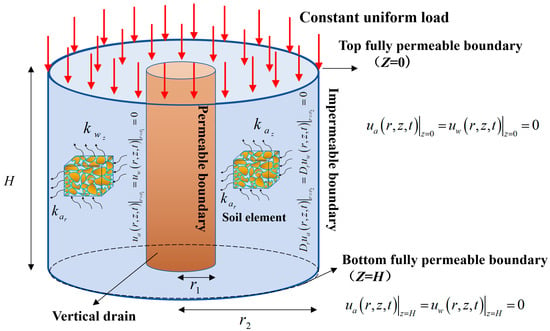
Figure 2.
Two-way axisymmetric consolidation model with radial–vertical composite seepage under two-way drainage conditions.
The seepage of gas and water phases is considered as mutually independent continuous processes [3,4,5,40], with both gas phase and liquid phase flow conforming to Darcy’s law. This study transforms the governing equations established based on Cartesian coordinate system into polar coordinate form to accommodate axisymmetric consolidation analysis, where r represents the radial coordinate (m), z denotes the depth coordinate (m), and t represents time (s). Through mathematical analysis of the net flux of gas and water phases per unit volume and the constitutive relationship of soil deformation, the following consolidation governing equations for radial–vertical combined seepage are finally established:
where , , , .
The variables ua and uw represent excess pore air pressure and excess pore water pressure, respectively. The parameters Ca and Cw represent the volumetric compressibility factors for gaseous and aqueous media, respectively, which quantify the volume change response per unit pressure change, and are expressed as:
The parameters , , and denote the consolidation parameters for gas and water phases in horizontal and vertical directions, respectively, as given by:
where denotes the flow conductivity factor of gaseous medium in horizontal direction. The physical constants R (8.314 J/(mol·K)), Θ (K), g (9.81 m/s2), and M (kg/mol) represent the universal gas law constant, thermodynamic absolute temperature scale, gravitational field acceleration, and molar mass parameter of the gaseous medium, respectively. The volumetric response factors and denote the volumetric response factors of pore gas to effective stress variation and matric potential variation, respectively. The pressure terms and denote the initial pore air pressure and standard atmospheric pressure condition, respectively. The parameters n and Sr indicate void ratio and saturation degree parameters throughout the consolidation process, respectively.
where denotes the flow conductivity factor of gaseous medium in vertical direction, and other parameters are as defined in Equation (4).
where denotes the flow conductivity factor of aqueous medium in horizontal direction, denotes the volumetric response factor of pore water to matric potential variation, and γw represents the specific weight of the aqueous medium.
where denotes the flow conductivity factor of aqueous medium in vertical direction, and other parameters are as defined in Equation (6).
2.3. Temporal and Spatial Constraints
Based on the theoretical approach proposed by Venkatramaiah et al. [41], the analysis adopts uniform initial excess hydraulic pressure conditions.
The inner radius r1 (m) is a permeable boundary allowing fluid flow, while the outer radius r2 (m) is an impermeable boundary, where the radial seepage gradient is zero, as expressed in the following equation:
where r ≥ 0.
(a) One-way drainage conditions:
(b) Two-way drainage conditions:
The present research develops an analytical theoretical system for various consolidation mechanisms under axisymmetric conditions through implementation of two representative initial pore pressure field patterns: constant distribution and gradient distribution. At initial time t = 0, and located at soil depth z may be formulated as follows:
where denotes the depth gradient of distribution, ∈ [0, 1]. represents the depth gradient of distribution, ∈ [0, 1].
2.4. Theoretical Formulation Procedure
The theoretical analytical solutions are derived through manual mathematical methods, with complex algebraic manipulations verified using Mathematica version 12.3 developed by Wolfram Research. Since both ua and uw are expressions of radial direction r, depth z, and time t, orthogonal basis functions and describe the variations in radial direction r and depth z in the polar coordinate system. Temporal variables and are employed to characterize the time-dependent behavior of ua and uw, respectively. These parameters may be expressed through linear superposition of orthogonal basis function series, according to the relations below:
Combined with boundary condition (9), the expressions and can be obtained as follows:
where J0 is the zero-order Bessel function of the first kind.
The eigenvalue is:
The expression for orthogonal basis function is as follows:
The axial eigenvalue is:
The partial derivatives of ua and uw with respect to time are solved based on modal expansion theory. The detailed derivations involving Bessel equation properties for both radial and vertical orthogonal basis functions are presented in Appendix A. Substituting the above partial derivative expressions into Equation (1), we obtain:
Due to the orthogonality of the orthogonal function system, the coefficients of each modal pair (i,j) must independently equal zero. Define the eigenvalues:
For each modal pair (i,j):
The above system of equations can be expressed in matrix form:
The solution of this matrix differential equation system through Laplace transform method, including the application of Cramer’s rule and subsequent inverse transform, is detailed in Appendix B. The initial coefficients are determined through orthogonality properties of the basis functions, with detailed integration calculations presented in Appendix C.
By incorporating the time-domain modal coefficient expressions (A13) and (A14) from Appendix B into Equations (13) and (14) correspondingly, the closed-form solutions for ua and uw under various drainage and air discharge conditions can be derived as follows:
- (a)
- One-way drainage conditions:
- (b)
- Two-way drainage conditions:
The derived distribution functions for ua and uw utilize mathematical expressions in series expansion form. Based on computational verification results, it is demonstrated that the summation parameters i and j in the series need to reach 150 or higher values to ensure convergence stability of the calculation results.
2.5. Average Degree of Consolidation and Settlement Calculation
This section derives the analytical expression for consolidation settlement based on the volume balance principle and mass conservation law. Considering the characteristics of axisymmetry, all physical quantities in the cylindrical coordinate system are independent of the radial angle θ, the circumferential coordinate measured in radians and ranging from 0 to 2π. For an axisymmetric consolidation model with inner radius r1, outer radius r2, and height H, the total volume change at any time is given by:
where is total volumetric strain.
Based on unsaturated soil consolidation theory, the total volumetric strain of unsaturated soil can be decomposed into three mutually independent components: (1) skeletal compression deformation caused by changes in effective stress of the soil skeleton due to external loading; (2) volume deformation caused by changes in pore water pressure; (3) volume deformation induced by changes in pore air pressure. The volumetric strain constitutive relationship of unsaturated soil can be expressed as:
where is the coefficient of volume change of the soil element with respect to net stress variation, which characterizes the volumetric deformation behavior of soil under net stress changes, ; is the coefficient of volume change of the soil element with respect to matric suction variation, which characterizes the volumetric deformation behavior of soil under matric suction changes, .
For axisymmetric characteristics, the relationship between consolidation settlement S(t) and total volume change is:
Introducing dimensionless coordinates, let:
Therefore, the dimensionless consolidation settlement expression is:
When t → ∞, both and approach steady state:
Therefore, the maximum settlement can be expressed as:
where is constant uniformly distributed load.
The average degree of consolidation is given by the following equation:
Combining Equations (34), (36) and (37), the following equations are obtained:
Combined with uniformly distributed loading and initial conditions in axisymmetric consolidation, the above equation can be further simplified as:
2.6. Analytical Solution Verification
The present research performs computational modeling analysis under uniform loading scenarios with a constant static load of q0 = 100 kPa. In order to guarantee the dependability and numerical precision of the axisymmetric consolidation computational model developed in this chapter, the physical properties and mechanical attributes of the soil employed in this section are derived from experimental data obtained from prior relevant investigations [42,43,44,45], n = 0.50, Sr = 0.80, = = 1.0 × 10⁻¹⁰ m/s, = = 1.0 × 10⁻⁹ m/s, H = 5 m, R = 8.314 J/mol·K, M = 0.029 kg/mol, rw = 0.2 m, re = 1.8 m, = −5.64 × 10⁻⁴ kPa−1, = −1.128 × 10⁻⁴ kPa−1, = −1.13 × 10⁻⁴ kPa−1, = −2.034 × 10⁻⁴ kPa−1, = −4.51 × 10⁻⁴ kPa−1, = −9.06 × 10⁻⁵ kPa−1, = 20 °C, = 293.16 K, Patm = q0 = 100 kPa, = = 40 kPa.
This study constructs two numerical models with one-way drainage boundary and two-way drainage boundary using COMSOL Multiphysics version 6.0 developed by COMSOL AB, Sweden, with the subsurface flow module, as shown in Figure 3 and Figure 4 and Figure 5 and Figure 6, respectively. Based on a simulation time domain of 1~107 s, the study covers the temporal evolution characteristics of the entire consolidation process. Through numerical solutions, the spatio-temporal distributions of normalized excess pore air pressure and water pressure are obtained, with contour maps are subsequently employed to quantitatively analyze the propagation and dissipation mechanisms of pressure from drainage boundaries toward the interior of the soil mass in the radial–vertical composite seepage field.
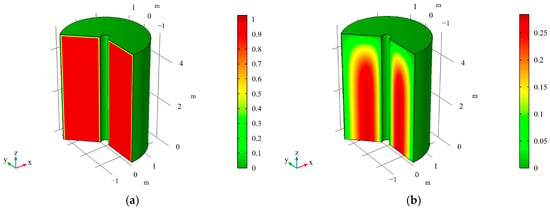
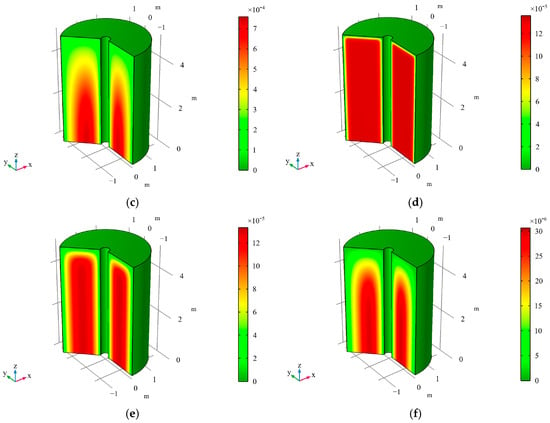
Figure 3.
Contour mapsmaps of at different times for axisymmetric consolidation under one-way drainage conditions. Notes: (a) t = 1 s, (b) t = 104 s, (c) t = 5 × 10⁴ s, (d) t = 105 s, (e) t = 106 s, (f) t = 107 s.
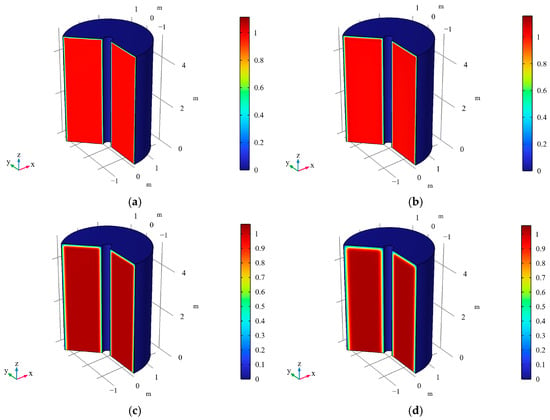
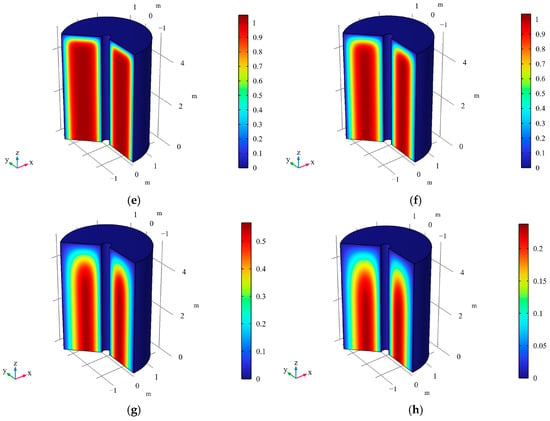
Figure 4.
Contour maps of at different times for axisymmetric consolidation model under one-way drainage conditions. Notes: (a) t = 1 s, (b) t = 104 s, (c) t = 5 × 10⁴ s, (d) t = 105 s, (e) t = 5 × 10⁵ s, (f) t = 106 s, (g) t = 5 × 10⁶ s, (h) t = 107 s.
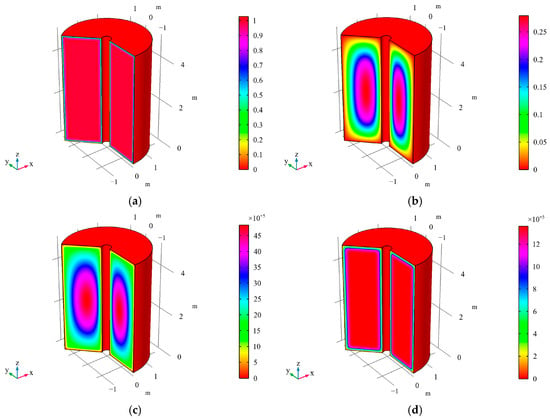
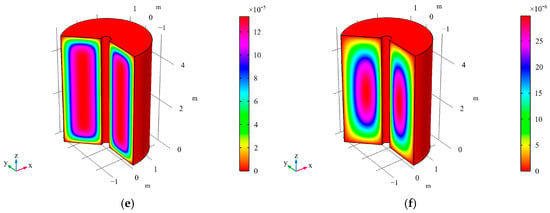
Figure 5.
Contour maps of at different times for axisymmetric consolidation model under two-way drainage conditions. Notes: (a) t = 1 s, (b) t = 104 s, (c) t = 5 × 10⁴ s, (d) t = 105 s, (e) t = 106 s, (f) t = 107 s.
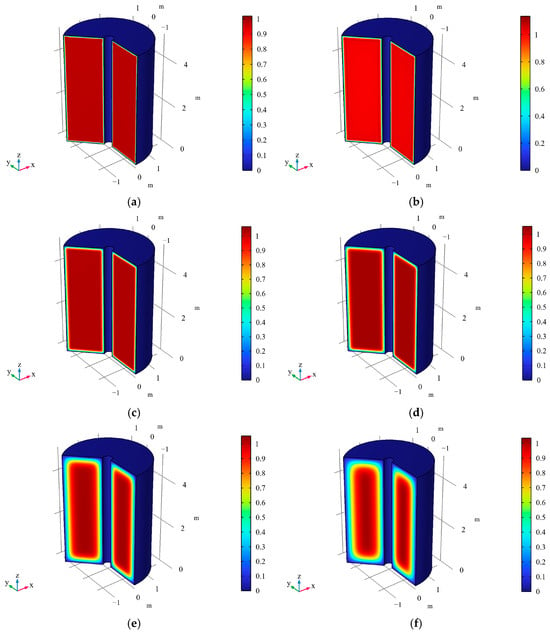
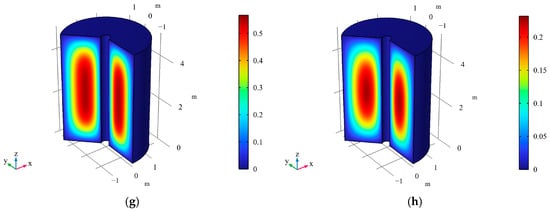
Figure 6.
Contour maps of at different times for axisymmetric consolidation under two-way drainage conditions. Notes: (a) t = 1 s, (b) t = 104 s, (c) t = 5 × 10⁴ s, (d) t = 105 s, (e) t = 5 × 10⁵ s, (f) t = 106 s, (g) t = 5 × 10⁶ s, (h) t = 107 s.
Based on the comparative verification results from Figure 7 and Figure 8, the analytical solutions derived in this study demonstrate high theoretical reliability and computational accuracy. Under one-way drainage conditions, the coefficient of determination R2 between analytical solutions and numerical simulation results exceeds 0.999, with maximum relative errors controlled within 2%. Two-way drainage conditions also exhibit high consistency, validating the applicability of analytical solutions under different boundary conditions. Verification for different ka/kw ratios demonstrates that analytical solutions maintain stable computational accuracy across a broad parameter range from gas-dominated seepage (ka/kw = 100) to water-dominated seepage (ka/kw = 10), reflecting the robustness of the theoretical model. Furthermore, from the nonlinear rapid dissipation in the early consolidation stage to the exponential decay stage in the later period, the analytical solutions accurately capture the complete evolution patterns of normalized excess pore pressure, with time spans covering seven orders of magnitude, fully validating the full-range applicability of the analytical solutions. In summary, the numerical verification results fully confirm the theoretical correctness and engineering reliability of the derived analytical solutions from three dimensions: accuracy, applicability range, and temporal characteristics.
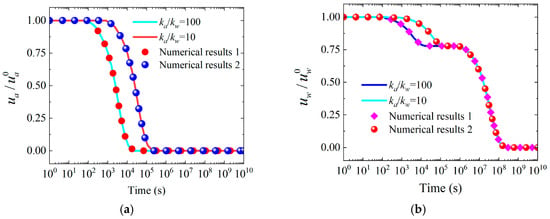
Figure 7.
Evaluation plus authentication regarding mathematical approaches with finite-element findings for and under different ka/kw ratios in radial–vertical composite flow with one-way drainage conditions. Notes: (a) Normalized excess pore air pressure, (b) Normalized excess pore water pressure.
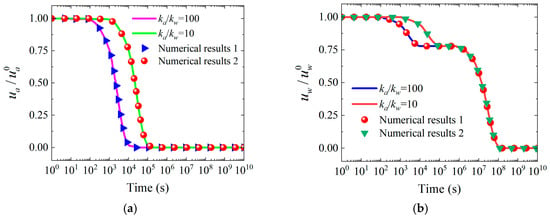
Figure 8.
Evaluation plus authentication regarding mathematical approaches with finite-element findings for and under different ka/kw ratios in radial–vertical composite flow with two-way drainage conditions. Notes: (a) Normalized excess pore air pressure, (b) Normalized excess pore water pressure.
It is noteworthy that this numerical validation approach is widely adopted in the field. The present validation employs high-precision numerical simulations, a rigorous and well-established methodology for verifying analytical solutions in unsaturated soil consolidation research. Huang and Zhao [46], Zhao et al. [17], Yuan et al. [47], Liu et al. [48], Shen et al. [18], Zhou et al. [49], Ho et al. [50], Wang et al. [51], and Moradi et al. [2] have validated their analytical solutions through comparison with numerical solutions, demonstrating that numerical validation is standard practice in this field. The high-precision validation results confirm the robustness and reliability of the proposed solution. While numerical validation establishes theoretical correctness, supplementary experimental and field validation would provide additional insights. Experimental validation of axisymmetric consolidation in unsaturated soils presents considerable technical challenges including simultaneous control of axisymmetric geometry and dual drainage boundaries, non-invasive multi-point pressure measurements, extended test durations of approximately 116 days for kw = 1.0 × 10⁻¹⁰ m/s and ka = 1.0 × 10⁻⁹ m/s, and scale effects when replicating field dimensions H = 5 m and re = 1.8 m. These constraints explain the predominant adoption of numerical validation and represent common limitations in this research field. Future work will pursue scaled laboratory tests and field monitoring data to enhance validation and practical applicability.
3. Consolidation Response Investigation Under Varying Initial Pore Pressure Distribution Conditions
3.1. Initial Uniform Pore Pressure Arrangement
For the constant initial pressure condition, when λa = λw = 0, Equation (12) reduces to:
3.1.1. Influence Regarding ka/kw Toward and and Consolidation Properties
Figure 9 reveals that the pressure dissipation of air-water two-phase flow exhibits significant temporal separation characteristics and geometric control effects. Figure 9a demonstrates that air pressure dissipation nearly overlaps under one-way and two-way drainage conditions. Both conditions complete dissipation within 103 s when ka/kw = 1000. The dissipation time extends to 107 s when ka/kw = 0.1. This suggests the dominant role of radial seepage. The finding is consistent with the numerical study by Wong et al. (1998) [42], confirming the geometric advantage of radial flow paths over vertical paths. Figure 9b presents the typical two-way inverted S-curve pattern of water pressure dissipation. Under ka/kw = 1000 conditions, water pressure rapidly decreases to 0.75 in the initial stage. It then enters a plateau period, subsequently dissipating rapidly to zero within 106~107 s. This forms distinct two-stage dissipation characteristics. Such pattern aligns with the theoretical predictions of Conte (2004) [7]. It reflects the temporal separation effect of air-water two-phase permeability differences in multidimensional seepage fields. The water phase begins its main dissipation process only after the rapid dissipation of the air phase is completed. The high coincidence of one-way and two-way drainage curves validates the conclusions of Fredlund et al. (2012) [45]. Their study shows that the influence of the Mandel-Cryer effect can be neglected in unsaturated soils. The geometric control effect of radial seepage occupies a dominant position, while the contribution of vertical drainage remains relatively limited.
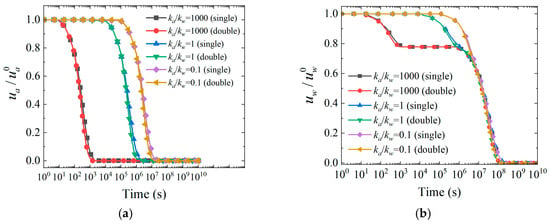
Figure 9.
Evolution of and decay with time for various ka/kw parameters. Notes: (a) Normalized excess pore air pressure, (b) Normalized excess pore water pressure.
Figure 10 demonstrates that matric suction evolution displays three-stage characteristics dominated by radial seepage. The initial decline rate under two-way drainage conditions is slightly faster than one-way drainage. For instance, when ka/kw = 1000, they reach minimum values of approximately −0.32 and −0.3 at 102 s and 103 s, respectively. The later recovery rate is also slightly faster under two-way drainage. However, the matric suction curves for various permeability ratios under one-way and two-way drainage conditions nearly coincide. This suggests that the dominant role of radial seepage significantly weakens the contribution of vertical drainage. The pattern validates the geometric advantage effect of radial flow. As ka/kw increases from 0.1 to 1000, the time for matric suction to reach its minimum value advances significantly from 106~107 s to 102~103 s. This represents approximately four orders of magnitude time scale compression. When ka/kw = 0.1, the minimum value only reaches −0.25. In contrast, under high permeability ratio conditions it reaches −0.3. This reflects the direct regulatory effect of air phase permeability on the magnitude of matric suction evolution.
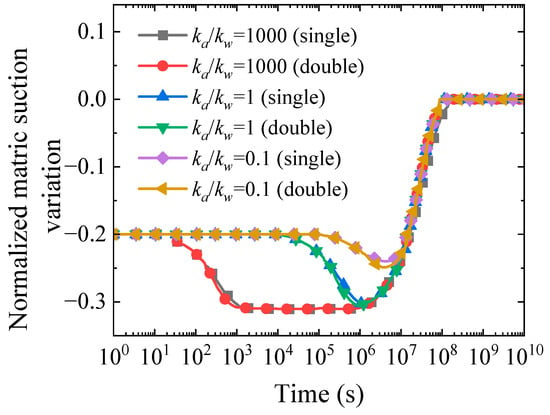
Figure 10.
Time history curves of normalized matric suction variation with ka/kw under different drainage conditions.
In summary, matric suction presents a three-stage evolution pattern of “rapid decline-plateau stabilization-slow recovery”. The initial rapid decline reflects the rapid response dominated by the air phase. The plateau period represents the transitional state after air pressure dissipation completion. The slow recovery stage represents the late-stage adjustment process dominated by the water phase. This three-stage temporal separation characteristic ultimately reaches pressure equilibrium at 108 s. It provides important validation for multiphase seepage consolidation theory. These findings provide critical guidance for embankment construction staging. Specifically, the rapid decline phase permits accelerated initial fill placement rates, the plateau period necessitates mandatory construction pauses to prevent premature loading-induced suction loss and bearing capacity reduction, and the slow recovery phase determines final pavement installation timing. The four-order-of-magnitude time scale compression observed with varying ka/kw ratios enables consolidation duration prediction directly from permeability test results, allowing engineers to establish soil-specific construction schedules and quality checkpoints without relying on empirical correlation charts, thereby improving project timeline accuracy and risk management strategies.
Figure 11 presents the evolution of average degree of consolidation, which displays two-way inverted S characteristics. Two-way drainage conditions demonstrate a slight advantage in the initial stage of consolidation. Particularly when ka/kw = 1000, two-way drainage begins to rise rapidly at 10−4 s, while one-way drainage is slightly delayed. This difference stems from the additional contribution of radial drainage paths. However, as the consolidation process develops, the two drainage methods nearly coincide after 10−1 s. Both ultimately reach the upper limit of degree of consolidation of 1.0. This suggests that the dominant position of radial seepage gradually weakens the contribution of vertical drainage. As ka/kw increases from 0.1 to 1000, the consolidation initiation time advances significantly from 10−2 s to 10−4 s. This represents approximately two orders of magnitude time compression effect. Under ka/kw = 1000 conditions, the first plateau period of 0.75 is reached within 10−3 s. In contrast, when ka/kw = 0.1, it is delayed to 10−1 s to reach a similar degree of consolidation. All curves display the typical two-way inverted S characteristics of “rapid rise-plateau period-rise again”. This reflects the temporal separation between air phase-dominated early rapid consolidation and water phase-dominated late slow consolidation. The pattern validates the multiphase mass transfer theory of unsaturated soil consolidation.
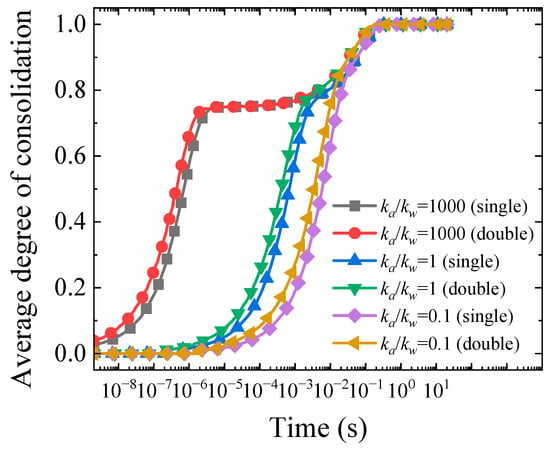
Figure 11.
Comparison curves of average degree of consolidation variation with ka/kw under different drainage conditions.
3.1.2. Analysis of Spatio-Temporal Evolution of and Under One-Way and Two-Way Drainage Conditions
Defining the time factor , Figure 12 demonstrates that the spatiotemporal evolution of and during axisymmetric consolidation exhibits significant multidimensional coupling characteristics. Figure 12a illustrates that under the same time factor, pressure follows a “rapid rise-slow growth-stabilization” pattern with increasing radial ratio. When T = 0.005, the normalized excess pore pressure rapidly rises from 0.1 to 0.4 as the radial ratio increases from 0 to 0.3. It then continues to increase to 0.6 with decelerated growth. The pressure stabilizes around 0.6 after the radial ratio exceeds 0.7. Figure 12b presents a similar pattern in the vertical direction. When T = 0.01, the air pressure in the shallow zone with normalized depth ratio of 0~0.2 rapidly rises from 0.2 to 0.6. It stabilizes at 0.8 level after the depth ratio exceeds 0.6. This asymptotic distribution reveals the strong influence of the radial center as a drainage boundary. Its effect decays with distance, forming a dual structure of boundary effect control zone and internal steady-state zone. On the other hand, when r/R = 0.5, pressure displays exponential decay. It is approximately 0.8 at T = 0.0002 s, decreases to 0.5 at T = 0.005, and reduces to 0.05 at T = 0.02. This demonstrates the nonlinear characteristics of “rapid initial-slow later” phases. When the normalized depth is 0.5, the pressure is approximately 0.9 at T = 0.0005. It decreases to 0.7 at T = 0.01 and stabilizes around 0.1 at T = 0.2. Compared to the radial direction, vertical pressure dissipation is slower. This indicates differences in drainage paths and boundary conditions. The observation is consistent with the characteristics of diffusion equation solutions. Figure 12a suggests that the radial surface exhibits a relatively gentle “wave-like” morphology, with relatively uniform surface slope variations, a maximum value of approximately 1.0, and contour lines showing approximately concentric circular distribution. Figure 12b reveals that the vertical surface also reflects smooth “slope-like” decay, with surface slopes maintaining relatively stable gradient changes throughout the entire domain. The air pressure surfaces in both directions show characteristics of good continuity and gentle slope variations, indicating that the diffusion process of the air phase in porous media is less affected by viscous resistance, with relatively uniform pressure gradient distribution, reflecting the high mobility characteristics of gas diffusion. Water pressure surfaces exhibit steeper “cliff-like” morphology in both radial and vertical directions, with dramatic surface slope variations. The radial water pressure surface shows dramatically increased slopes near boundaries, forming distinct pressure drop steps; the vertical water pressure surface exhibits “waterfall-like” decay, with slopes reaching peak values at drainage boundaries and densely distributed contour lines. In summary, air pressure surface slopes are relatively gentle and continuous, while water pressure surface slope variations are more dramatic, reflecting that water phase seepage is significantly affected by soil skeleton deformation and seepage resistance.
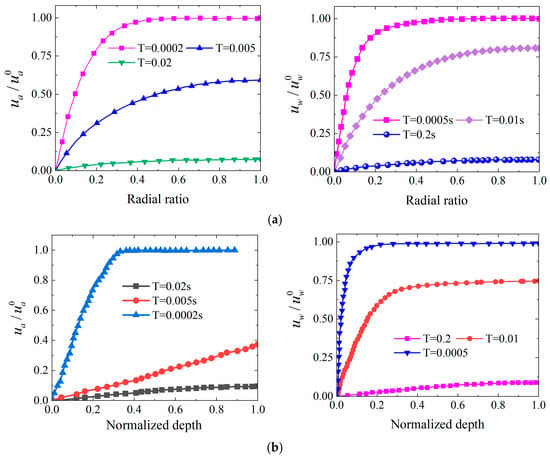
Figure 12.
Distribution of and under different time factors for one-way drainage. Notes: (a) Radial ratio, (b) Normalized depth.
Figure 13a displays that the radial surface exhibits a relatively gentle “wave-like” configuration, with uniform variations in surface slope and a maximum value of approximately 1.0, while the contour lines display an approximately concentric circular distribution. Figure 13b demonstrates that the vertical air pressure surface similarly displays a smooth “slope-like” attenuation. The surface slope maintains relatively stable gradient variations throughout the entire domain. The air pressure surfaces in both directions present characteristics of good continuity and gentle slope variations. This suggests that the diffusion process of the gas phase in porous media is minimally affected by viscous resistance. The surfaces exhibit steeper “cliff-like” configurations in both radial and vertical directions, with dramatic variations in surface slope. The radial water pressure surface shows sharp increases in slope near the boundary, forming distinct pressure drop steps; the vertical water pressure surface presents a “waterfall-like” attenuation, with slope reaching peak values at the drainage boundary and densely distributed contour lines. In summary, the air pressure surface slopes are relatively gentle and continuous, while the water pressure surface slopes exhibit more dramatic variations, reflecting that water phase seepage is significantly affected by soil skeleton deformation and seepage resistance.
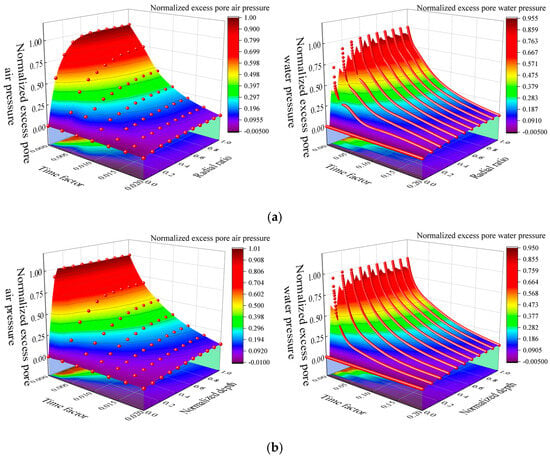
Figure 13.
Three-dimensional graphical representation of and under one-way drainage condition. Notes: (a) Radial ratio, (b) Normalized depth.
Comparing Figure 12a and Figure 14a, pressure evolution at a radial ratio of 0.2 is selected for comparative analysis. Under one-way drainage conditions, the pore air pressure is 0.8 at T = 0.0002, decreases to 0.45 at T = 0.005, and drops to 0.05 at T = 0.02. In contrast, under two-way drainage conditions, the pressure values at the same location are 0.75, 0.25, and close to 0, respectively, indicating that two-way drainage achieves faster pressure dissipation at radial positions compared to one-way drainage. Comparing Figure 12b and Figure 14b at the normalized depth of 0.5. Under one-way drainage, the pressure values at various time parameters are 1.0, 0.5, and 0.05, respectively. Under two-way drainage conditions, this location constitutes the peak point of pressure distribution. The pressure values are 1.0, 0.4, and 0.02, respectively. This further confirms that two-way drainage achieves faster pressure dissipation in the vertical direction compared to one-way drainage. In conclusion, the two-way drainage system fundamentally alters the pore pressure transmission mechanism. It simultaneously provides drainage boundaries at surface and base locations across the soil domain. Based on Darcy’s law and the continuity equation, two-way drainage creates a symmetric potential gradient field. This enables pore fluid to simultaneously seep in both upward and downward directions. The two-way seepage pathway shortens the average seepage distance and reduces seepage impedance. It also creates a hydraulic convergence region within the central portion of the soil mass. Consequently, this redistributes the pressure field distribution pattern and achieves enhanced and optimized consolidation process.
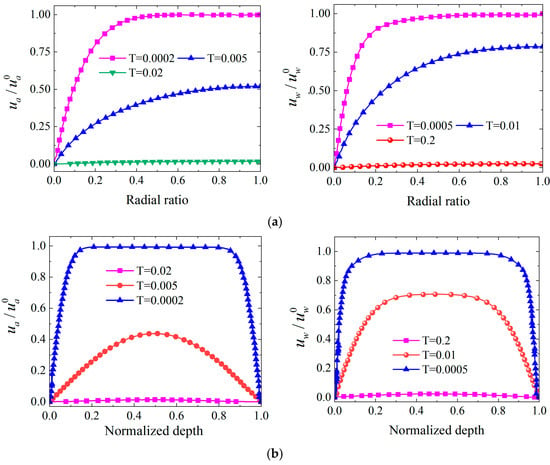
Figure 14.
Distribution of and under different time factors for two-way drainage condition. Notes: (a) Radial ratio, (b) Normalized depth.
Comparison between Figure 13 and Figure 15 reveals that two-way drainage boundary conditions exhibit significant pressure field redistribution effects. Comparing Figure 13a and Figure 15a depict that the pressure surface under two-way drainage conditions Reveals steeper gradient variations, particularly within the radial ratio range of 0.2~0.4, where the surface slope increases significantly, forming distinct pressure attenuation zones. The contour line distributions of and are more densely packed, indicating that the two-way drainage system can achieve rapid pressure dissipation within shorter radial distances, with the diversification of pressure transmission pathways resulting in more regular depression structures in the surface configuration. Comparison between Figure 13b and Figure 15b demonstrates fundamental changes in the vertical pressure surface configuration under two-way drainage. It displays typical bimodal or saddle-shaped distribution characteristics. Unlike the monotonically decreasing surface of one-way drainage, two-way drainage forms pressure peak regions within the normalized depth range of 0.4~0.6. The surface presents relatively gentle gradient variations in these regions. Such boundary arrangement reveals the cooperative behavior between balanced top-bottom flow pathways. The system directs interstitial liquid toward the center within the central soil zone. This achieves enhanced load transfer uniformity and optimized settlement procedures.
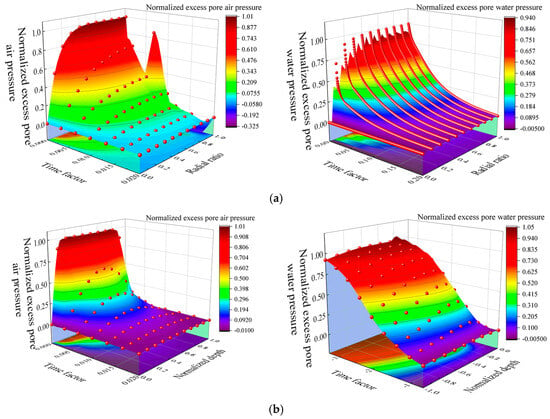
Figure 15.
Three-dimensional graphical representation of and under two-way drainage. Notes: (a) Radial ratio, (b) Normalized depth.
3.1.3. Comparison of Radial Pore Pressure Distribution Properties Under One-Way and Two-Way Drainage Conditions
Figure 16 shows that drainage methods significantly affect the radial distribution characteristics of and . Under one-way drainage conditions, far-field regions maintain high residual pressures that cannot be completely dissipated, while under two-way drainage conditions, pressures at all radial positions can achieve complete dissipation, effectively improving far-field pressure dissipation efficiency. As shown in Figure 16a, the excess pore pressure distribution exhibits distinct radial gradient characteristics. When r = 1.9 m, both and reach peak values close to 1.0, demonstrating the highest pressure levels, the pressure peak at r = 1.0 m is approximately 0.78~0.80, while the pressure peak at r = 0.5 m is only about 0.40~0.42. This pressure distribution pattern indicates that locations farther from the drainage well experience slower pressure dissipation and maintain higher excess pore pressure levels. The pressure dissipation curves at various radial positions exhibit monotonically increasing trends, eventually approaching stable values. Figure 16b illustrates that under two-way drainage conditions, the pressure distribution characteristics undergo fundamental changes. Curves at various radial positions display bell-shaped distributions. Peak values occur within the normalized depth interval of 0.4–0.6, after which they begin to decline. The pressure peaks at r = 1.9 m and r = 1.0 m are approximately 0.95 and 0.78, respectively. At r = 0.5 m, it is about 0.65. Although radial gradients persist, two-way drainage enables complete pressure dissipation to zero at all positions. This contrasts sharply with one-way drainage conditions, where far-field position pressures cannot be fully evacuated. The finding confirms that the introduction of vertical drainage pathways significantly improves pressure dissipation efficiency. Clear advantages are particularly evident in far-field regions regarding evacuation completeness.
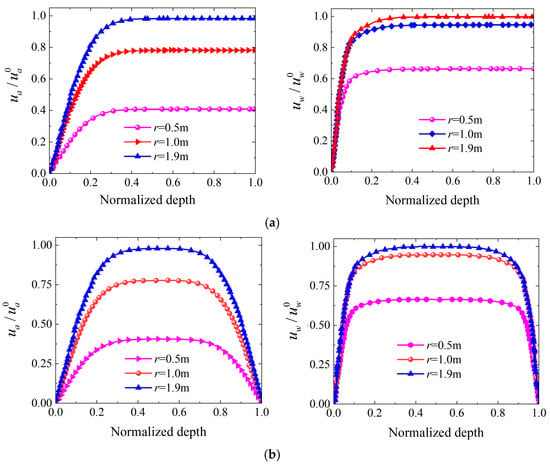
Figure 16.
Comparison of distribution curves of and versus depth at different radial positions. Notes: (a) One-way drainage conditions, (b) Two-way drainage conditions.
Figure 17 demonstrates the control effects of λa on and in unsaturated soil exhibit significant differences, manifested in response patterns, influence degrees, and temporal characteristics. As shown in Figure 17a, during the initial consolidation period of 1~105 s, excess pore air pressure at the same moment decreases in a stepwise manner with increasing λa,, exhibiting “cliff-like” steep decline characteristics particularly during 1 < t < 104 s. When λa gradually increases from 0 to 1.00, pore air pressure exhibits a linear attenuation trend within the time range of 1~103 s, with pressure values decreasing from the initial 1.0 kPa to 0.5 kPa. Analysis indicates that each 0.5-unit increase in λa corresponds to approximately 25% attenuation of pore air pressure, demonstrating that λa exerts a direct linear suppression effect on pore air pressure. The physical mechanism underlying this sensitivity lies in the high compressibility and low viscosity characteristics of gas. Increasing λa directly enhances gas phase connectivity and permeability, with expanded flow channels combined with the inherent characteristics of low density and low flow resistance of gas collectively promoting rapid gas discharge. Furthermore, despite significant differences in initial values, air pressure dissipation under all conditions follows similar temporal evolution patterns, maintaining plateau periods before 103 s and completing the primary dissipation process within the 103~105 s interval, indicating that λa has limited regulatory effects on gas phase dissipation dynamics once the dissipation process initiates. In contrast, the response of pore water pressure to λa in Figure 17b exhibits gradual cumulative characteristics with obvious plateau periods during the initial period 1 < t < 104 s. The variation amplitude of water pressure at the same moment is relatively small; when λa increases from 0 to 1.00, the pressure only decreases from 0.85 to 0.80, representing merely a 6% reduction. Even with increasing λa, the plateau period characteristics remain significant, where the surface is relatively flat and normalized excess pore water pressure maintains high values, only beginning to decline significantly after t > 104 s. It is noteworthy that the influence of parameter λa on dissipation process shows a pronounced delayed response. When t < 103 s, the difference in pore air pressure under different λa values is small, only 0.05. Comprehensive analysis indicates that λa directly controls the initial pressure distribution of the gas phase, producing immediate regulatory effects, while its influence on the water phase is indirectly achieved through gas-water phase coupling interactions, exhibiting time-lag and cumulative characteristics, resulting in its response to λa changes significantly lagging behind the gas phase.
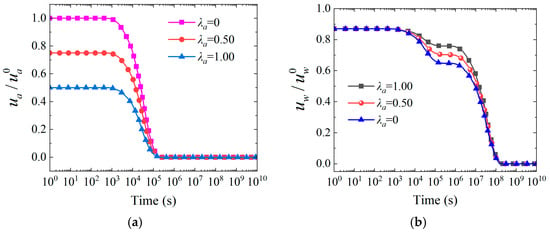
Figure 17.
Time-dependent curves of and varying with pore air pressure gradient λa under one-way drainage conditions. Notes: (a) Normalized excess pore air pressure, (b) Normalized excess pore water pressure.
It is noteworthy that the temporal differences in plateau periods of and reveal different physical mechanisms characterizing fluid-solid coupling behavior. The gas phase exhibits a plateau period at 1~103 s, which originates from the high compressibility characteristics of gas. During soil skeleton adjustment, gas phase connectivity and seepage channels are not fully established, and with effective permeability constrained by water phase distribution, gas must overcome initial resistance to initiate dissipation. The water phase exhibits a plateau period at 105~107 s, with the formation mechanism being that water’s incompressibility makes it sensitive to load changes and responsive from the initial stage. However, when the gas phase undergoes massive dissipation after 103 s, the gas-water two phases begin competing for limited drainage and air discharge channel resources, with rapid gas flow and volumetric expansion effects hindering the water phase, resulting in reduced water phase dissipation rates. This temporal difference essentially reflects the transition from the “water-first, gas-second” initial response mode to the “gas-water competition” intermediate coupling mode in unsaturated soil, revealing the complex interaction mechanisms of two-phase fluids in shared porous media. These findings provide theoretical guidance for determining layered fill construction rates and loading intervals in embankment engineering to avoid excessive pore pressure buildup during the gas-water competition phase.
3.2. Linear Initial Pore Pressure Arrangement
For the linear initial pressure condition, when λa ≠ 0 and λw ≠ 0, Equation (12) represents a linear gradient distribution:
3.2.1. Evaluation of λa and λw Effects on and Variation Pattern and Consolidation Properties
Figure 18 reveals that the influence of pore water pressure gradient λw on two-phase fluid dissipation mechanisms exhibits significant stage-dependent differences. Figure 18a shows that air pressure curves under different λw conditions almost completely overlap, presenting identical “S-shaped” dissipation trajectories. The curves remain horizontal at t <103 s, then exhibit steep linear decline in the 103~105 s interval with essentially consistent slopes. This indicates that gas phase dissipation has low sensitivity to changes in λw. Figure 18b demonstrates that λw produces distinct stratification effects on water pressure dissipation. Increasing λw significantly reduces water pressure during the initial consolidation period, with curves showing different initial plateau heights. During the 103~106 s period, curve slopes differ under different λw conditions, with the steepest slope and fastest dissipation rate occurring at λw = 1.0. However, after t > 108 s, all curves converge to the same endpoint. In summary, λw primarily influences initial water pressure dissipation by altering liquid phase seepage channels and capillary effects, while the gas phase response to water phase gradient changes is relatively small, exhibiting relatively independent dissipation characteristics. The late-stage convergence phenomenon reflects the unified pattern of water phase dissipation during the consolidation process.
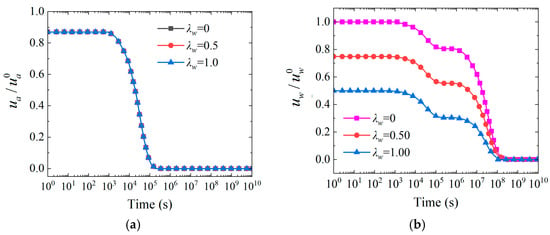
Figure 18.
Time-dependent curves of and varying with pore water pressure gradient λw under one-way drainage conditions. Notes: (a) Normalized excess pore air pressure, (b) Normalized excess pore water pressure.
3.2.2. Analysis of the Effects of λa and λw on Normalized Matric Suction Variation
Both Figure 19a,b exhibit three typical stages: plateau period (1 < t < 103 s), intermediate attenuation period (103 s < t < 106 s), and late-stage reverse growth period (106 s < t < 1010 s). In Figure 19a, increasing λa causes plateau period matric suction to decrease from −0.16 to −0.26, attenuation period minimum values to increase from −0.26 to −0.32, with essentially consistent slopes during the reverse growth period. Similarly, in Figure 19b, increasing λw causes plateau period matric suction to decrease from −0.02 to −0.23, attenuation period valley values to increase from −0.34 to −0.02, but with similar reverse growth initiation times. The plateau period reflects the pore fluid redistribution process during initial consolidation, with increasing λa accelerating gas phase dissipation leading to enhanced negative matric suction, while increasing λw promotes liquid phase discharge and mitigates negative changes. The attenuation period corresponds to suction reduction caused by excess pore pressure dissipation, with λa primarily affecting the magnitude of change and λw primarily affecting the rate of change. The reverse growth period reflects the effective stress recovery process, with λa having limited influence on growth rate, while λw affects the recovery pathway by altering moisture distribution, ultimately resulting in matric suction approaching zero equilibrium state under all conditions.
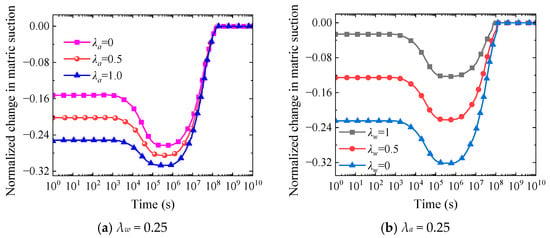
Figure 19.
Time-dependent curves of normalized matric suction variation under different λa and λw parameters for one-way drainage. Notes: (a) λw = 0.25, (b) λa = 0.25.
The parameter sensitivity analysis results in Figure 20 indicate that λa and λw parameters exhibit distinctly different regulatory mechanisms on the consolidation process, manifested through contrasting surface characteristics and sensitivity distribution patterns. As shown in Figure 20a, the increment of λa parameter produces significant retardation effects on the consolidation process, with the surface exhibiting significant negative slope characteristics. When λa increases from 0 to 1.00, the corresponding average degree of consolidation at the same moment significantly decreases during the intermediate consolidation stage (10−4~10−1 s). Specifically, at t = 0.1 s, the degree of consolidation under λa = 0 condition reaches 0.8, while under λa = 1.00 condition it is only 0.6, with a difference of up to 0.2. The maximum surface gradient occurs when λa is within the critical interval of 0.4~0.8, where average degree of consolidation drops sharply from 0.8 to 0.4, with a slope change rate of -1.25, revealing the strong retardation effect. This is because as λa increases, the enhancement of gas phase permeability leads to intensified gas retention effects in the pore network, thereby impeding effective water phase discharge and delaying the excess pore water pressure dissipation process. The downward curvature of the S-shaped surface reflects the incremental characteristics of gas phase retardation effects. In contrast, the λw parameter in Figure 20b exhibits obvious promoting effects, displaying a positive slope distribution pattern. When λw increases from 0 to 1, the enhancement of water phase relative permeability coefficient strengthens the water phase seepage capacity, resulting in approximately 0.15 improvement in corresponding degree of consolidation at the same time points. The peak slope of +0.75 occurs when λw is within the 0.2~0.6 interval, with degree of consolidation improvement reaching 0.3, validating the significant promoting effect of water phase permeability on the consolidation process. This result fully validates the crucial role of water phase permeability in accelerating pore water pressure dissipation and promoting the consolidation process. The upward curvature of the S-shaped surface embodies the incremental trend of water phase promoting effects. On the other hand, during the early stage (10−8~10−4 s), all conditions exhibit synchronous response characteristics, indicating that consolidation behavior at this stage is primarily controlled by total stress transmission mechanisms, with differences in seepage characteristics not yet fully manifested. As time progresses, the influence of permeability differences gradually becomes prominent, leading to significant differentiation during the intermediate stage, while in the late consolidation period of 0.1~1 s, curves under different λa and λw overlap and eventually tend toward the same steady-state equilibrium.
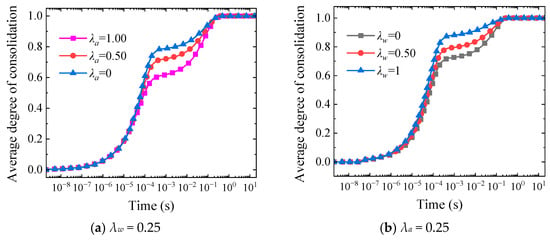
Figure 20.
Time history curves of average degree of consolidation under different λa and λw parameters for one-way drainage. Notes: (a) λw = 0.25, (b) λa = 0.25.
The opposite regulatory mechanisms of λa, which retards consolidation, and λw, which promotes consolidation, provide differentiated foundation treatment strategies for unsaturated soil consolidation under varying initial pore pressure distributions. Specifically, in embankment engineering with high initial air content characterized by large λa values, pre-loading or vacuum preloading techniques can be prioritized to accelerate gas phase evacuation before main construction; conversely, in low-permeability clayey soils where λw is small, vertical drain installation or chemical grouting methods should be implemented to enhance water phase seepage pathways, thereby achieving optimized consolidation efficiency and shortened construction periods through targeted parameter control.
3.2.3. Analysis of Spatial-Temporal Development of and Under One-Way and Two-Way Drainage Conditions
The isochronal diagram Figure 21 based on λa = λw = 0.5 conditions indicates that the spatiotemporal evolution of and exhibit significant directional difference characteristics. Figure 21a illustrates the radial pressure evolution across different time stages. During the early stage at T = 0.0002, the radial pressure gradient is steepest. Pressure values increase linearly with radial ratio to 0.73. As time progresses to T = 0.005, the maximum pressure decreases to 0.43 but still maintains positive gradient distribution. During the late stage at T = 0.02, pressure becomes essentially uniform at 0.05. This suggests that the boundary effects of radial drainage gradually weaken. The pattern reflects the pressure propagation process from the drainage well to the periphery, conforming to the diffusion patterns of radial seepage. Figure 21b presents a more complex bell-shaped distribution pattern. During the early stage at T = 0.0002, the pressure peak reaches 0.9. It concentrates near normalized depth 0.15. The peak position subsequently moves downward and diffuses. During the intermediate stage at T = 0.005, the peak decreases to 0.37. Its position migrates to depth 0.4. During the late stage at T = 0.02, pressure further attenuates to 0.07. This peak migration phenomenon reveals the dynamic mechanism of pressure redistribution during vertical consolidation. It demonstrates obvious pressure propagation lag effects under one-way drainage conditions. Pressure dissipation in deep regions significantly lags behind that in shallow regions.
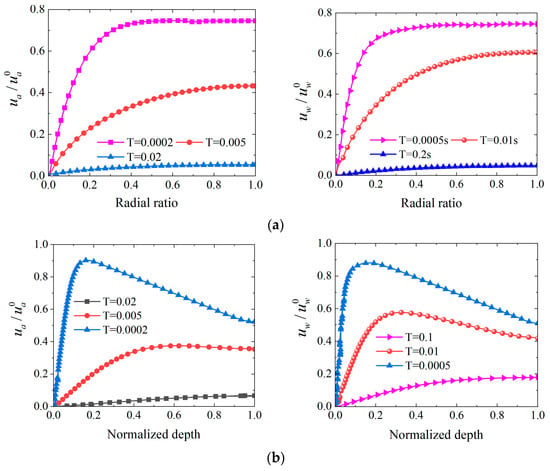
Figure 21.
Distribution of and under different time factors for one-way drainage. Notes: (a) Radial ratio, (b) Normalized depth.
Figure 22 demonstrates significant differences in spatial distribution characteristics and dissipation mechanisms of air pressure and water pressure during radial and vertical consolidation processes. Figure 22a illustrates that the maximum pore air pressure surface reaches 0.746, with water pressure peak at 0.706. Air pressure is approximately 5.7% higher than water pressure. During the early stage, radial gradients are steepest. Deep red high-pressure regions concentrate within the radial ratio range of 0.8–1.0. As time progresses, high-pressure regions gradually contract toward the drainage well direction. This indicates accelerated fluid evacuation. Figure 22b presents a surface maximum that significantly increases to 0.915, with water pressure peak at 0.744. This expands the difference to 23%. The vertical surface displays distinct “ridge-like” distribution. High-pressure regions mainly appear within the normalized depth interval of 0.3~0.7, where surface slopes are most gentle. Notably, the spatial gradient of vertical air pressure is significantly greater than radial distribution. This suggests that gas phase retardation effects are more pronounced during vertical consolidation. The pressure dissipation pathways become more complex. Compared to one-way drainage, two-way drainage conditions substantially improve pressure dissipation efficiency and spatial distribution characteristics.
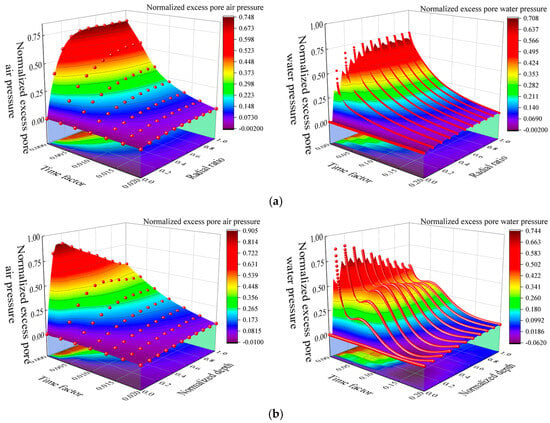
Figure 22.
Three-dimensional graphical representation of spatial-temporal distribution of and under one-way drainage. Notes: (a) Radial ratio, (b) Normalized depth.
Comparing Figure 21a and Figure 23a reveals that pressure dissipation is more rapid under two-way drainage conditions. During the early stage at T = 0.0002, radial pressure still exhibits linear distribution with maximum value of approximately 0.73, essentially consistent with one-way drainage. However, at T = 0.005, maximum pressure has decreased to 0.31, compared to 0.43 for one-way drainage, improving dissipation rate by approximately 28%. During the late stage at T = 0.02, pressure further decreases to 0.02, significantly lower than 0.05 for one-way drainage. Comparing Figure 21b and Figure 23b reveals that vertical pressure distribution tends toward symmetry under two-way drainage conditions. During the early stage at T = 0.0002, pressure peak of 0.9 is comparable to one-way drainage but with more concentrated distribution. During the intermediate stage at T = 0.005, the peak decreases to 0.32, slightly lower than 0.37 for one-way drainage, with position still near depth 0.4. The key difference lies in the late stage, where pressure decreases to 0.02 at T = 0.02 and almost completely dissipates at T = 0.2, indicating that two-way drainage eliminates the pressure retention problem in deep regions characteristic of one-way drainage. In summary, two-way drainage provides additional vertical drainage pathways, forming a radial–vertical dual dissipation mechanism that significantly shortens pressure propagation distances and achieves more efficient consolidation processes.
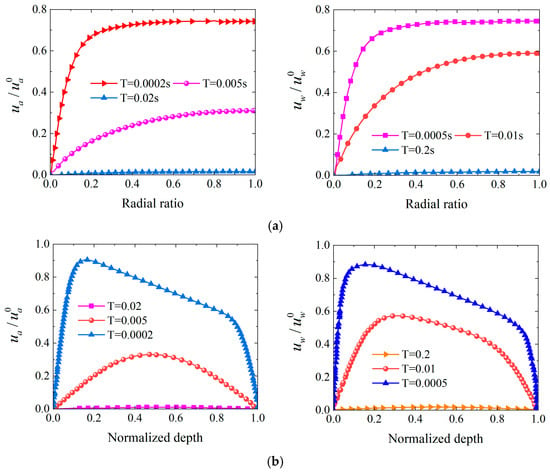
Figure 23.
Distribution of and under different time factors for two-way drainage condition. Notes: (a) Radial ratio, (b) Normalized depth.
Figure 24 reveals the variation patterns of pressure distribution under different drainage boundary conditions. The influence of drainage boundary conditions on pressure distribution demonstrates pronounced radial differential characteristics. Figure 24a presents results under one-way drainage conditions. Pressure curves at various radial positions display asymmetric bell shapes, rising steeply initially and declining gradually after peaks. The curve peaks for r = 1.8 m, r = 1.0 m, and r = 0.4 m are located at normalized depths of 0.35, 0.4, and 0.45, respectively, with peak pressures of 0.8, 0.7, and 0.33. The peak pressure amplification factor from near-well to far-well reaches 2.42. This reflects substantial radial pressure gradients. At depth 1.0, the curves converge to 0.55, 0.5, and 0.22, respectively, forming gradient distribution. This indicates obvious pressure residual in deep regions under one-way drainage conditions. Figure 24b presents results under two-way drainage conditions. Curves display symmetric bell-shaped distribution, with sharp declines after peaks and convergence to zero. Peak positions shift forward, with curve peaks for r = 1.8 m and r = 1.0 m nearly coinciding at 0.3, both reaching approximately 0.85. The radial pressure amplification factor decreases to 1.47, demonstrating that two-way drainage conditions can effectively homogenize pressure distribution. All curves approach zero at depth 1.0, fully eliminating the pressure residual problem of one-way drainage conditions. This radial differential characteristic originates from distance attenuation effects. Near-well regions have short seepage pathways and achieve rapid drainage primarily through radial flow. In contrast, far-well regions have extended seepage pathways and rely on radial–vertical coupled flow. Cumulative resistance along the path forms pressure bottleneck effects. These complex flow pathways delay the pressure dissipation process.
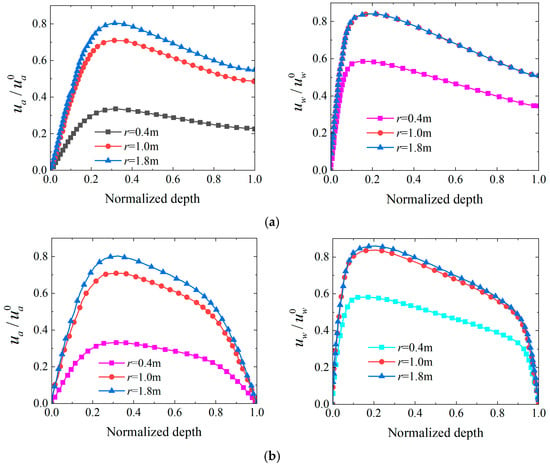
Figure 24.
Distribution curves of and versus depth at different radial positions. Notes: (a) one-way drainage, (b) two-way drainage.
4. Conclusions
Following thorough quantitative analysis and rigorous theoretical derivations for axisymmetric consolidation of unsaturated soils considering radial–vertical composite seepage, the following significant conclusions are obtained:
- (1)
- The proposed hybrid solution technique combining modal expansion theory and Laplace transform establishes a three-dimensional consolidation analytical solution that considers radial–vertical composite seepage mechanisms and anisotropic permeability characteristics. This breakthrough overcomes the limitations of traditional one-dimensional or purely radial theories, with the coefficient of determination between analytical solutions and numerical simulations exceeding 0.999 and relative errors controlled within 2%, significantly improving the accuracy of embankment settlement predictions, thereby confirming the theoretical correctness and practical applicability of this analytical solution for geotechnical engineering applications.
- (2)
- The study reveals that pressure dissipation efficiency under two-way drainage conditions improves by approximately 28% compared to one-way drainage. This finding provides quantitative design criteria for optimizing vertical drainage systems such as sand drains, enabling dual radial–vertical dissipation mechanisms that effectively eliminate deep pressure retention phenomena and shorten preloading treatment periods.
- (3)
- The theoretical framework reveals the characteristic three-stage evolution pattern of normalized matric suction variation featuring rapid decline, plateau stabilization, and slow recovery phases, along with the bidirectional inverted S-curve characteristics of water phase pressure, enabling accurate prediction of consolidation behavior in unsaturated embankment soils under different moisture conditions.
- (4)
- When the permeability coefficient ratio ka/kw increases from 0.1 to 1000, consolidation initiation time compresses from 10−2 s to 10−4 s, exhibiting approximately two orders of magnitude time compression effect, providing a parametric design method for construction sequence control and construction period optimization.
- (5)
- The established analytical framework applies to both uniform and gradient distribution initial pore pressure conditions. The initial pressure gradient parameters λa and λw exhibit opposite regulatory mechanisms on the consolidation process, with increasing λa producing a retarding effect on consolidation while increasing λw significantly promotes the consolidation process, providing differentiated treatment strategies for embankment soils under various geological conditions and achieving theoretical support for refined design and construction control in embankment engineering.
Author Contributions
Conceptualization, methodology, software, Y.H.; validation, formal analysis, investigation, resources, data curation, L.O.; writing—original draft preparation, Y.H. All authors have read and agreed to the published version of the manuscript.
Funding
This work was supported by the National Key Research and Development Program Project (Grant No. 2018YFC1505305), the National Natural Science Foundation of China (Grant No. 51578195, 51608533), the Heilongjiang Province Applied Technology Research and Development Program (Grant No. GA19A501), and the 69th Batch of General Projects of China Postdoctoral Science Foundation (Grant No. 2021M690840).
Data Availability Statement
The original contributions presented in this study are included in the article. Further inquiries can be directed to the corresponding author.
Acknowledgments
We would like to express our respect and gratitude to the anonymous reviewers and editors for their valuable comments and suggestions.
Conflicts of Interest
The authors declare no conflicts of interest.
Nomenclature
| Symbol | Definition | Unit |
| ua | Excess pore air pressure | kPa |
| uw | Excess pore water pressure | kPa |
| r | Radial coordinate | m |
| z | Vertical coordinate (depth) | m |
| t | Time variable | s |
| Ca | Volumetric compressibility coefficient for gas phase | kPa−1 |
| Cw | Volumetric compressibility coefficient for water phase | kPa−1 |
| Consolidation coefficient for gas phase in radial direction | m2/s | |
| Consolidation coefficient for gas phase in vertical direction | m2/s | |
| Consolidation coefficient for water phase in radial direction | m2/s | |
| Consolidation coefficient for water phase in vertical direction | m2/s | |
| Flow conductivity coefficient for gas phase in radial direction | m/s | |
| Flow conductivity coefficient for gas phase in vertical direction | m/s | |
| Coefficient of volume change of soil element with respect to net stress variation | kPa−1 | |
| Coefficient of volume change of soil element with respect to matric suction variation | kPa−1 | |
| R | Universal gas constant | J/(mol·K) |
| Θ | Thermodynamic absolute temperature | K |
| g | Gravitational acceleration | m/s2 |
| M | Molar mass of gas | kg/mol |
| Volumetric response factors of pore gas to effective stress variation | kPa−1 | |
| Volumetric response factors of pore gas to matric potential variation | kPa−1 | |
| Initial excess pore air pressure | kPa | |
| Initial excess pore water pressure | kPa | |
| Standard atmospheric pressure condition | kPa | |
| n | Void ratio | - |
| Sr | Degree of saturation | - |
| Flow conductivity coefficient for water phase in radial direction | m/s | |
| Flow conductivity factor of aqueous medium in vertical direction | m/s | |
| γw | Specific weight of the aqueous medium | kN/m3 |
| r1 | Inner radius (permeable boundary) | m |
| r2 | Outer radius (impermeable boundary) | m |
| H | Thickness of soil layer | m |
| distribution | - | |
| distribution | - | |
| Radial orthogonal basis function (Bessel function) | - | |
| Vertical orthogonal basis function (trigonometric function) | - | |
| J0 | Zero-order Bessel function of the first kind | - |
| J1 | First-order Bessel function of the first kind | - |
| Total volume change at time t | m3 | |
| Total volumetric strain | - | |
| S(t) | Consolidation settlement at time t | m |
| Constant uniformly distributed load | kPa | |
| Maximum settlement | m | |
| Average degree of consolidation | - |
Appendix A. Partial Derivative Derivations
Based on modal expansion theory, the partial derivatives of ua and uw with respect to time are:
According to the properties of the Bessel equation satisfied by the radial orthogonal basis function :
For excess pore air pressure, the following equation applies:
For excess pore water pressure, the following equation applies:
Using the Bessel equation properties of the vertical orthogonal basis function :
For ua, the following equation applies:
Similarly, for uw, the following equation applies:
Appendix B. Laplace Transform Solution Process
Applying the Laplace transform to Equation (19), the following equation is obtained:
where p represents the complex frequency variable in the Laplace domain, with the mathematical form p = σ + jω, in which σ is the real part characterizing the exponential decay of the consolidation response, and ω is the imaginary part reflecting the oscillatory frequency characteristics of the system.
Applying Cramer’s method with subsequent mathematical treatment yields the expression:
where
By employing Laplace inversion on formulas (A10) and (A11), the following equations are obtained:
where , , , , , , , and denote the initial coefficients of and , respectively.
Appendix C. Initial Coefficient Calculations
Given the orthogonality of basis functions Xi(r) and Zj(z), combined with Equations (2), (13), and (14), the values of and can be obtained as follows:
Let:
The following equations are obtained:
Substituting Equations (15) and (17) into Equation (A17), the calculation yields:
where J1 is the first-order Bessel function of the first kind.
Substituting Equation (A20) into Equations (A18) and (A19), the calculation yields:
References
- Biot, M.A. General theory of three-dimensional consolidation. J. Appl. Phys. 1941, 12, 155–164. [Google Scholar] [CrossRef]
- Moradi, M.; Keshavarz, A.; Fazeli, A. One dimensional consolidation of multi-layered unsaturated soil under partially permeable boundary conditions and time-dependent loading. Comput. Geotech. 2019, 107, 45–54. [Google Scholar] [CrossRef]
- Dakshanamurthy, V.; Fredlund, D. Moisture and air flow in an unsaturated soil. In Proceedings of the 4th International Conference on Expansive Soils, ASCE, Denver, CO, USA, 16–18 June 1980; pp. 514–532. [Google Scholar]
- Dakshanamurthy, V.; Fredlund, D. A mathematical model for predicting moisture flow in an unsaturated soil under hydraulic and temperature gradients. Water Resour. Res. 1981, 17, 714–722. [Google Scholar] [CrossRef]
- Dakshanamurthy, V.; Fredlund, D.G.; Rahardjo, H. Coupled three-dimensional consolidation theory of unsaturated porous media. In Proceedings of the 5th International Conference on Expansive Soils, Adelaide, Australia, 21–23 May 1984; pp. 99–103. [Google Scholar]
- Loret, B.; Khalili, N. A three-phase model for unsaturated soils. Int. J. Numer. Anal. Methods Geomech. 2000, 24, 893–927. [Google Scholar] [CrossRef]
- Conte, E. Consolidation analysis for unsaturated soils. Can. Geotech. J. 2004, 41, 599–612. [Google Scholar] [CrossRef]
- Sun, D.A.; Matsuoka, H.; Yao, Y.P.; Ichihara, W. An elasto-plastic model for unsaturated soil in three-dimensional stresses. Soils Found. 2000, 40, 17–28. [Google Scholar] [CrossRef]
- Sun, D.A.; Cui, H.B.; Matsuoka, H.; Sheng, D. A three-dimensional elastoplastic model for unsaturated compacted soils with hydraulic hysteresis. Soils Found. 2007, 47, 253–264. [Google Scholar] [CrossRef]
- Niu, L.; Yao, P.; Cui, W.J.; Wan, Z. Three-dimensional method for constitutive relationship of overconsolidation unsaturated soil. Rock Soil Mech. 2011, 32, 2341–2345. [Google Scholar]
- Nakai, T.; Shahin, H.M.; Kikumoto, M.; Kyokawa, H.; Zhang, F.; Farias, M.M. A simple and unified three-dimensional model to describe various characteristics of soils. Soils Found. 2011, 51, 1149–1168. [Google Scholar] [CrossRef]
- Lu, C.Y.; Zhu, S. Analysis of three-dimensional consolidation of unsaturated soils. Iran. J. Sci. Technol. Trans. Civ. Eng. 2014, 38, 485–496. [Google Scholar]
- Huang, M.; Lv, C.; Zhou, Z. A general analytical solution for axisymmetric consolidation of unsaturated soil with impeded drainage boundaries. Geofluids 2021, 2021, 4610882. [Google Scholar] [CrossRef]
- Ho, L.; Fatahi, B. Analytical solution to axisymmetric consolidation of unsaturated soil stratum under equal strain condition incorporating smear effects. Int. J. Numer. Anal. Methods Geomech. 2018, 42, 1890–1913. [Google Scholar] [CrossRef]
- Ho, L.; Fatahi, B.; Khabbaz, H. Analytical solution to axisymmetric consolidation in unsaturated soils with linearly depth-dependent initial conditions. Comput. Geotech. 2016, 74, 102–121. [Google Scholar] [CrossRef]
- Ho, L.; Fatahi, B.; Khabbaz, H. A closed form analytical solution for two-dimensional plane strain consolidation of unsaturated soil stratum. Int. J. Numer. Anal. Methods Geomech. 2015, 39, 1665–1692. [Google Scholar] [CrossRef]
- Zhao, X.; Ni, J.; Liu, Y.; Gong, W. A general analytical solution for axisymmetric electro-osmotic consolidation of unsaturated soil with semi-permeable boundary. Int. J. Numer. Anal. Methods Geomech. 2024, 48, 2542–2563. [Google Scholar] [CrossRef]
- Shen, L.; Qian, B.; Li, L. Axisymmetric consolidation behavior of multilayered unsaturated soils with transversely isotropic permeability. Front. Earth Sci. 2024, 12, 1483314. [Google Scholar] [CrossRef]
- Yuan, Q.; He, Q.; Tang, H.; Lang, L. Three-dimensional consolidation characteristics of unsaturated soil under the depth- and time-dependent stresses. Geotech. Geol. Eng. 2024, 42, 4934856. [Google Scholar]
- Qin, A.F.; Jiang, L.H.; Xu, W.F.; Mei, G.X. Analytical solution to consolidation of unsaturated soil by vertical drains with continuous permeable boundary. Rock Soil Mech. 2021, 42, 1345–1354. [Google Scholar]
- Nguyen, H.N.; Canh, T.N.; Thanh, T.T.; Van Ke, T.; Phan, V.-D.; Van Thom, D. Finite element modelling of a composite shell with shear connectors. Symmetry 2019, 11, 527. [Google Scholar] [CrossRef]
- Tho, N.C.; Ta, N.T.; Thom, D.V. New numerical results from simulations of beams and space frame systems with a tuned mass damper. Materials 2019, 12, 1329. [Google Scholar] [CrossRef]
- Pham, T.D.; Pham, Q.H.; Phan, V.D.; Nguyen, H.N.; Do, V.T. Free vibration analysis of functionally graded shells using an edge-based smoothed finite element method. Symmetry 2019, 11, 684. [Google Scholar] [CrossRef]
- Sheng, D.; Gens, A.; Fredlund, D.G.; Sloan, S.W. Unsaturated soils: From constitutive modelling to numerical algorithms. Comput. Geotech. 2008, 35, 810–824. [Google Scholar] [CrossRef]
- Riad, B.; Zhang, X. Consistent Three-Dimensional Elasto-Plastic Model to Study Unsaturated Soil Behavior with Considerations of Coupled Hydro-Mechanical Hysteresis. Transp. Res. Rec. 2021, 2675, 346–369. [Google Scholar] [CrossRef]
- Wang, L.; Zhang, X.; Lei, Q.; Panayides, S.; Tinti, S. A three-dimensional particle finite element model for simulating soil flow with elastoplasticity. Acta Geotech. 2022, 17, 5639–5653. [Google Scholar] [CrossRef]
- Chen, Z.; Ni, P.; Zhu, X.; Chen, D.; Mei, G. Consolidation of unsaturated soil by vertical drain considering smear and well resistance. Geosynth. Int. 2022, 29, 270–281. [Google Scholar] [CrossRef]
- Zhou, F.; Chen, Z.; Wang, X. An equal-strain analytical solution for the radial consolidation of unsaturated soils by vertical drains considering drain resistance. Adv. Civ. Eng. 2018, 2018, 5069159. [Google Scholar] [CrossRef]
- Terzaghi, K. Theoretical Soil Mechanics; John Wiley & Sons: New York, NY, USA, 1943. [Google Scholar]
- Lambe, T.W.; Whitman, R.V. Soil Mechanics SI Version; John Wiley & Sons: New York, NY, USA, 2008. [Google Scholar]
- Fredlund, D.G.; Rahardjo, H. Soil Mechanics for Unsaturated Soils; John Wiley & Sons: New York, NY, USA, 1993. [Google Scholar]
- Bear, J.; Bachmat, Y. Introduction to Modeling of Transport Phenomena in Porous Media; Springer: Berlin/Heidelberg, Germany, 2012. [Google Scholar]
- Coussy, O. Poromechanics; John Wiley & Sons: New York, NY, USA, 2004. [Google Scholar]
- Mitchell, J.K.; Soga, K. Fundamentals of Soil Behavior; John Wiley & Sons: New York, NY, USA, 2005. [Google Scholar]
- Hansbo, S. Consolidation of fine-grained soils by prefabricated drains. In Proceedings of the 10th International Conference on Soil Mechanics and Foundation Engineering (ICSMFE), Stockholm, Sweden, 15–19 June 1981; Volume 3, pp. 677–682. [Google Scholar]
- Indraratna, B.; Redana, I.W. Numerical modeling of vertical drains with smear and well resistance installed in soft clay. Can. Geotech. J. 2000, 37, 132–145. [Google Scholar] [CrossRef]
- Shan, Z.; Ling, D.; Ding, H. Exact solutions for one-dimensional consolidation of one-way-layer unsaturated soil. Int. J. Numer. Anal. Methods Geomech. 2012, 36, 708–722. [Google Scholar] [CrossRef]
- Van Genuchten, M.T. A closed-form equation for predicting the hydraulic conductivity of unsaturated soils. Soil Sci. Soc. Am. J. 1980, 44, 892–898. [Google Scholar] [CrossRef]
- Mualem, Y. A new model for predicting the hydraulic conductivity of unsaturated porous media. Water Resour. Res. 1976, 12, 513–522. [Google Scholar] [CrossRef]
- Qin, A.F.; Chen, G.J.; Tan, Y.W.; Sun, D.A. Analytical solution to one-dimensional consolidation in unsaturated soils. Appl. Math. Mech. 2008, 29, 1329–1340. [Google Scholar] [CrossRef]
- Venkatramaiah, C. Geotechnical Engineering; New Age International Publishers: New Delhi, India, 2006. [Google Scholar]
- Wong, T.T.; Fredlund, D.G.; Krahn, J. A numerical study of coupled consolidation in unsaturated soils. Can. Geotech. J. 1998, 35, 926–937. [Google Scholar] [CrossRef]
- Conte, E. Plane strain and axially symmetric consolidation in unsaturated soils. Int. J. Geomech. 2006, 6, 131–135. [Google Scholar] [CrossRef]
- Conte, E.; Troncone, A. Radial consolidation with vertical drains and general time-dependent loading. Can. Geotech. J. 2009, 46, 25–36. [Google Scholar] [CrossRef]
- Fredlund, D.G.; Rahardjo, H.; Fredlund, M.D. Unsaturated Soil Mechanics in Engineering Practice; John Wiley & Sons: Hoboken, NJ, USA, 2012. [Google Scholar]
- Huang, M.; Zhao, M. A general analytical solution for one dimensional consolidation of unsaturated soil incorporating impeded drainage boundaries. Comput. Geotech. 2020, 128, 103801. [Google Scholar] [CrossRef]
- Yuan, Q.; He, Q.; Lang, L.; Yang, X. Analytical solution for Fredlund–Hasan unsaturated consolidation using mode superposition method. Int. J. Numer. Anal. Methods Geomech. 2023, 47, 3234–3247. [Google Scholar] [CrossRef]
- Liu, Y.; Zheng, J.J.; Cao, W.Z. A closed-form solution for 2D plane strain consolidation in unsaturated soils considering the lateral semipermeable drainage boundary. Comput. Geotech. 2021, 140, 104435. [Google Scholar] [CrossRef]
- Zhou, W.H.; Zhao, L.S.; Li, X.B. A simple analytical solution to one-dimensional consolidation for unsaturated soils. Int. J. Numer. Anal. Methods Geomech. 2014, 38, 794–810. [Google Scholar] [CrossRef]
- Ho, L.; Fatahi, B.; Khabbaz, H. Analytical solution for one-dimensional consolidation of unsaturated soils using eigenfunction expansion method. Int. J. Numer. Anal. Methods Geomech. 2014, 38, 1058–1077. [Google Scholar] [CrossRef]
- Wang, L.; Sun, D.; Qin, A. General semi-analytical solutions to one-dimensional consolidation for unsaturated soils. Appl. Math. Mech. 2017, 38, 831–850. [Google Scholar] [CrossRef]
Disclaimer/Publisher’s Note: The statements, opinions and data contained in all publications are solely those of the individual author(s) and contributor(s) and not of MDPI and/or the editor(s). MDPI and/or the editor(s) disclaim responsibility for any injury to people or property resulting from any ideas, methods, instructions or products referred to in the content. |
© 2025 by the authors. Licensee MDPI, Basel, Switzerland. This article is an open access article distributed under the terms and conditions of the Creative Commons Attribution (CC BY) license (https://creativecommons.org/licenses/by/4.0/).