Abstract
The reverse circulation drill bit is the key component for the efficient and smooth implementation of the pneumatic hollow-through down-the-hole (DTH) hammer reverse circulation continuous coring (sampling) technology. To obtain the structural form of a reverse circulation drill bit with better reverse circulation performance, revealing its local flow fields by computational fluid dynamics (CFD) simulation is an effective approach. Taking the inner jet holes-type reverse circulation drill bit as the research object, three kinds of symmetrical and asymmetrical structures of inner jet holes were proposed. The CFD simulation results show that increasing the air volume supply and the number of inner jet holes leads to an increase in the velocity of air flow jet within the inner jet holes, an increase in the negative pressure formed in the central through channel below the inner jet holes, an enhancement of the reverse circulation performance and suction capacity formed by the reverse circulation drill bit, and an acceleration of the upward flow velocity of the rock cores (samples) located at the bottom of the borehole. Additionally, the reverse circulation performance formed by the reverse circulation drill bit with staggered arranged inner jet holes is superior to that of the reverse circulation drill bit with uniformly distributed inner jet holes. Under the same simulation conditions, the static pressure (i.e., negative pressure) and the upward flow velocity formed by the JB6 model are 2.34 kPa and 30.778 m/s higher than those formed by the JB3-3 model, while these two values formed by the JC6 model are 0.197 kPa and 3.689 m/s higher than those formed by the JB6 model, respectively. In conclusion, an asymmetric structural design would be more reasonable for the design of the inner jet holes-type reverse circulation drill bit.
1. Introduction
Undoubtedly, mineral resource exploration and development, deep underground space utilization, geological disaster prevention and control, environmental protection, and sustainable development are critical issues that directly underpin the sustained, stable, and high-quality development of human society. Meanwhile, exploring the universe (i.e., extraterrestrial planetary drilling and sampling), penetrating the Earth (i.e., continental scientific drilling), diving into the sea (i.e., oceanic scientific drilling), and investigating the polar regions (i.e., polar scientific drilling) serve as landmark scientific endeavors. These initiatives enable humanity to gain deeper insights into the Earth, comprehend the universe, acquire resources, and thereafter rationally utilize and conserve the Earth. In all the aforementioned scientific, technological, and engineering fields, drilling technology plays an indispensable role [1,2,3,4,5]. Obtaining rock and mineral cores (samples) from the Earth’s interior via drilling technology is widely recognized as the ultimate technical approach for acquiring accurate subsurface geological information in modern geological prospecting. Furthermore, boreholes obtained through deep scientific drilling—often referred to as “telescopes into the Earth’s interior”—hold great significance for the real-time observation of the Earth’s internal conditions [2]. Compared with conventional drilling methods, gas drilling technology offers a series of distinct advantages: (1) It significantly enhances the rate of penetration (ROP), which can effectively shorten well construction cycles and reduce costs, particularly when drilling in hard rock formations; (2) it reduces drilling fluid consumption, thereby contributing to environmental protection; (3) it effectively addresses challenges associated with drilling in water-sensitive formations; and (4) it maximizes reservoir protection, which in turn boosts single-well oil and gas production and, overall, the recovery rate [6,7].
The pneumatic hollow-through DTH hammer reverse circulation continuous coring (sampling) drilling technology effectively enables continuous subsurface coring (sampling) during drilling operations in complex formations—specifically, formations prone to collapse, fragmentation, and severe leakage, which pose significant drilling challenges. It integrates three drilling techniques: high-speed rock breaking via pneumatic DTH hammer with percussive-rotary drilling, full-hole reverse circulation of fluid medium (i.e., gas–liquid–solid three-phase medium), and continuous acquisition of rock and mineral cores (samples) during drilling [8,9,10,11,12,13,14]. This technology has been widely applied in a wide range of drilling scenarios, including solid mineral resource exploration, water well drilling, oil and gas resource exploration and development, civil engineering construction, etc. The reverse circulation drill bit is a key component that ensures the smooth implementation of pneumatic hollow-through DTH hammer reverse circulation drilling, and its structural parameters exert a decisive impact on the establishment of reverse circulation performance [11,12,13,14,15,16]. Based on the principle of multi-nozzle ejectors, several upward-inclined inner jet holes are arranged in the spline slots to develop a multi-nozzle ejector-type reverse circulation drill bit. Optimizing the structural parameters of these inner jet holes is crucial for ensuring efficient and stable reverse circulation suction performance [17,18,19,20,21,22]. Cao, Cui, et al. [13,14,15,16,17] systematically employed approaches including CFD simulation and orthogonal experiments to investigate the cuttings (rock/ice) transport capacity and reverse circulation suction performance of pneumatic DTH hammer structures with varying structural parameters. Qi et al. [18] conducted a series of simulations using CFD multiphase modeling, supplemented by laboratory experiments, and pointed out that increasing the air supply flow rates and appropriately selecting the diameters of bottom and inner nozzles can effectively enhance the reverse circulation suction drainage capacity of air reverse circulation DTH hammer drill bits to provide valuable insights for the application of air DTH hammer reverse circulation drilling technology in geothermal drilling projects. Bo et al. [19] identified the optimal structural parameters of suction nozzles for large-diameter reverse circulation drill bits in rescue well drilling through orthogonal experiments, CFD simulations, and field tests. Hao [20] and Liu [21] addressed the suboptimal structure of conventional large-diameter reverse circulation drill bits—a flaw that results in inadequate reverse circulation performance. By systematically integrating theoretical analysis, numerical simulation, and experimental research, they analyzed the formation mechanism and process of bottom-hole reverse circulation and optimized the design of key parameters influencing the development of reverse circulation suction performance. This optimization effectively enhanced the reverse circulation suction performance of the bits. Liu [21] and Huang [22] redesigned the inner jet holes to be tangential to the central through channel, respectively proposing spiral-type and cyclone-type reverse circulation drill bits; both of these bit designs exhibited a significant improvement in reverse circulation suction performance.
In this study, the influence of inner jet hole configurations on the reverse circulation performance of reverse circulation drill bits is investigated and evaluated from a novel perspective of symmetry. Three typical inner jet hole configurations are proposed for the pneumatic hollow-through DTH hammer reverse circulation continuous coring (sampling) drilling technology: (1) Three uniformly distributed inner jet holes at the same level; (2) six uniformly distributed inner jet holes at the same level; and (3) six uniformly distributed and staggered inner jet holes arranged on upper and lower planes. The first two configurations feature symmetric distribution, while the third adopts a combined symmetric-asymmetric distribution based on the former two. Through comparative analysis of their local flow fields via CFD simulation, the asymmetric structural design of inner jet holes in reverse circulation drill bits is demonstrated to outperform the existing fully symmetric arrangement. These findings provide some scientific and valuable references for the rational design of inner jet hole structural parameters in reverse circulation drill bits.
2. Inner Jet Holes-Type Reverse Circulation Drill Bit
2.1. The Structure and the Basic Principle of Ejector
An ejector is a fluid machine and mixing-reaction device that relies on the turbulent diffusion effect of a jet to mix two fluids at different pressure levels, thereby facilitating energy exchange between them. It has been widely applied across diverse technical fields, including the chemical industry, aerospace, machinery, energy, building construction, and energy conservation [23,24,25,26,27]. As illustrated in Figure 1, an ejector primarily comprises four core components: a nozzle, a suction chamber, a mixing chamber, and a diffuser. Its operating principle proceeds as follows: Firstly, a high-pressure working fluid flows into the nozzle at high velocity and is ejected through the nozzle outlet, forming a high-speed jet that enters the suction chamber. Subsequently, driven by the turbulent diffusion of this jet, the surrounding fluid is entrained into the suction chamber—initiating momentum exchange. This entrained lower-pressure fluid is referred to as the driven fluid. Within the mixing chamber, the working fluid and driven fluid undergo intensive mixing, accompanied by simultaneous momentum and mass transfer. During this process, their flow velocities gradually equalize, and the combined fluid experiences a gradual pressure rise. Upon exiting the mixing chamber, the mixed fluid enters the diffuser; as the flow velocity decreases due to the diffuser’s expanding cross-sectional area, the fluid undergoes a further pressure elevation. Ultimately, at the diffuser outlet, the pressure of the mixed fluid is significantly higher than the inlet pressure of the driven fluid when it entered the suction chamber [20,21,23,24,25,26,27].
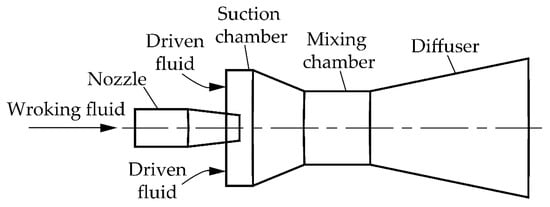
Figure 1.
Schematic diagram of the ejector structure.
2.2. The Structure and Operating Principle of the Inner Jet Holes-Type Reverse Circulation Drill Bit
Figure 2 illustrates an inner jet holes-type reverse circulation drill bit for a pneumatic hollow-through DTH hammer. It primarily consists of a central through channel, splines, spline slots, inner jet holes, cemented carbide spherical teeth, etc. To effectively enhance reverse circulation coring (sampling) efficiency, several upward-inclined inner jet holes are machined into the spline slots of a conventional reverse circulation drill bit. Notably, the extension lines of these inner jet holes intersect the central axis of the central through channel, forming a specific included angle with it. Based on the working principle of multi-nozzle ejectors, when high-pressure air flows diagonally upward from the inner jet holes into the central through channel, the high-velocity airflow generates a strong suction force on the fluid within the central through channel. This suction effect creates a negative pressure region in the segment of the central through channel located below the inner jet holes. Consequently, rock at the borehole bottom is crushed by the impact of cemented carbide spherical teeth mounted on the reverse circulation drill bit’s crown, forming rock cores (samples). Driven by the pressure difference (between the borehole bottom and the negative pressure region), these rock cores enter the central through channel. They are then sucked upwards, accelerated, and ultimately discharged out of the borehole to the surface along the central through channel.
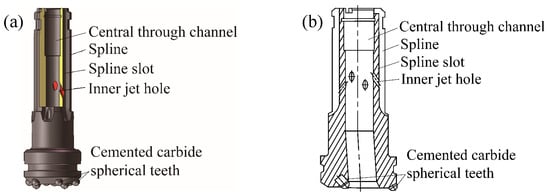
Figure 2.
Schematic diagrams of the inner jet holes-type reverse circulation drill bit structure: (a) The 3D schematic diagram of the inner jet holes-type reverse circulation drill bit structure; (b) the cross-sectional schematic diagram of the inner jet holes-type reverse circulation drill bit structure.
3. Comparison of the Local Fluid Fields Based on CFD Simulation
3.1. Modeling
The specifications of the typical inner jet holes-type reverse circulation drill bit are selected as the research object. The axes of the inner jet holes are all inclined upward and form a certain angle with the axis of the central through channel. The inner jet holes and the central through channel are extracted as the fluid domain for CFD simulation, and the corresponding 3D models are established in the SolidWorks 2021 software. All the models have the same central through channel diameter, inner jet hole diameter, inner jet hole inclination angle, and the length between the central through channel and the midpoint of the inner jet hole inlet, i.e., the diameter of the central through channel is 44 mm, the diameter of the inner jet hole is 6 mm, the inclination angle of the inner jet hole is 30°, and the length between the central through channel and the midpoint of the inner jet hole inlet is 40 mm. However, the main differences among various models lie in the number and arrangement of the inner jet holes. The detailed conditions of various models are listed in Table 1. The cross-sectional schematic diagrams and the three 3D models’ schematic diagrams of the flow domains for CFD simulation are illustrated in Figure 3, Figure 4, Figure 5 and Figure 6, respectively. We find that the inner jet holes in the models of JB3 and JB6 show a symmetrical distribution pattern, but the inner jet holes in the JC6 model in the upper and lower rows are each of a symmetrical distribution, and the two rows are staggered with each other, presenting an asymmetrical distribution.

Table 1.
Detailed conditions of various models of the local fluid fields.
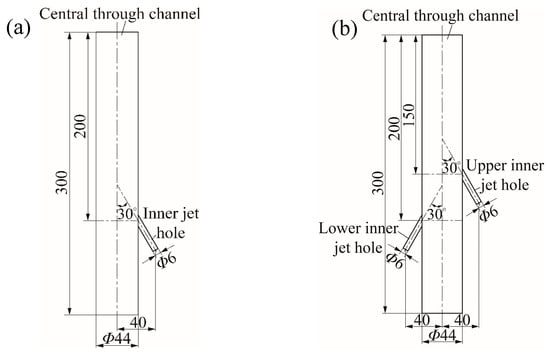
Figure 3.
The cross-sectional schematic diagrams of the flow domains for CFD simulation: (a) The uniformly distributed inner jet holes at the same level (i.e., JB3 and JB6 models); (b) the uniformly distributed and staggered inner jet holes on both the upper and lower planes (i.e., JC6 model).
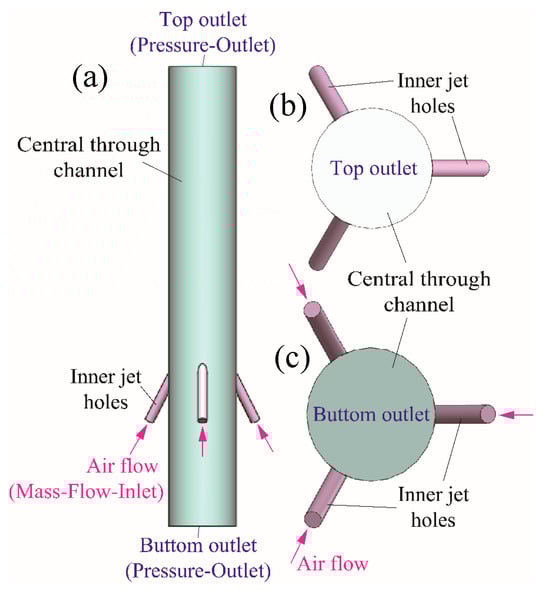
Figure 4.
The 3D model schematic diagrams of the flow domain of the three uniformly distributed inner jet holes at the same level (i.e., JB3 model) for CFD simulation: (a) Front view; (b) top view; (c) bottom view.
Figure 5.
The 3D model schematic diagrams of the flow domain of the six uniformly distributed inner jet holes at the same level (i.e., JB6 model) for CFD simulation: (a) Front view; (b) top view; (c) bottom view.
Figure 6.
The 3D model schematic diagrams of the flow domain of the six uniformly distributed and staggered inner jet holes on both the upper and lower planes (i.e., JC6 model) for CFD simulation: (a) Front view; (b) top view; (c) bottom view.
Moreover, to better monitor and display the flow field conditions within the local fluid fields of each model, starting from the central axis of the central through channel, the profiles along the central axis of the inner jet holes are equally spaced, with the number of these profiles being equal to the number of inner jet holes. As shown in Figure 7, three profiles are equally spaced in the models of JB3, and six profiles are equally spaced in the models of JB6 and JC6.
Figure 7.
The 3D schematic diagrams of monitoring profiles in the three kinds of flow domains for CFD simulation: (a) JB3 model; (b) JB6 model; (c) JC6 model.
3.2. Meshing
A grid serves as the fundamental carrier for numerical simulation and computational analysis, with its quality exerting a direct impact on the accuracy and efficiency of numerical calculations. Poor-quality grids typically introduce significantly larger numerical errors than those inherent to the algorithm itself [15,16,17,18,19,20,21,22]. The computational domain geometry of the local flow fields of the inner jet holes-type reverse circulation drill bit is relatively simple. However, the diameter discrepancy between the inner jet holes and the central through channel is substantial (specifically, 38 mm), rendering meshing at their intersection relatively challenging. Meshing was performed using Gambit 2.4.6 software, and the meshing of the JC6 model is illustrated in Figure 8. To improve CFD simulation accuracy while reducing computational scale, the flow domain was partitioned into blocks. Within blocks satisfying the topological requirements for structural grids, hexahedral grids were employed (encompassing the inner jet holes and the upper/lower parts of the central through channel), whereas tetrahedral grids were employed for other regions (notably, the intersection of inner jet holes and the central through channel). To better characterize the flow field at the intersection of inner jet holes and the central through channel, the density of tetrahedral grids in this region was appropriately increased. Meanwhile, four grids of varying densities (coarse: 2 × 10⁵ elements; medium: 3 × 10⁵ elements; fine: 4 × 10⁵ elements; extra-fine: 5 × 10⁵ elements) were compared under identical simulation conditions. For the JB3, JB6, and JC6 models, when the total number of elements ranged from 4 × 10⁵ to 5 × 10⁵, the simulation results of pressures and velocities remained nearly constant. Within this range, hexahedral grids accounted for approximately 60% to 70% of the total, with tetrahedral grids comprising the remaining 30% to 40%.
Figure 8.
Meshing situation of the JC6 model: (a) Axonometric view; (b) top view; (c) partial enlargement view of the intersection region of inner jet holes and central through channel.
3.3. Boundary Conditions
To make the calculation results of the CFD simulation of various models comparable, the same boundary conditions were set for all models of the inner jet holes-type reverse circulation drill bit. Furthermore, considering that the working medium of the pneumatic hollow-through DTH hammer is compressed air, the fluid property is set as an ideal gas. In addition, as illustrated in Figure 4, Figure 5 and Figure 6, the boundary conditions set at the inlet of the inner jet holes at both ends of the central through channel and on other surfaces are as follows:
(1) The boundary conditions set at the inlet of the inner jet holes are the Mass-Flow-Inlet, i.e., defining the inlet boundary conditions in the form of mass flow rate. They can be calculated by the actual volumetric flow rate of air supply times the air density (i.e., 1.205 kg/m3, under the industrial standard used frequently of 20 °C and 1 atm). Herein, the detailed air volume supply of various models is listed in Table 2. Among them, the models of JB3-1, JB3-2, JB3-3, JB3-4, and JB3-5, respectively, represent the five different air volumes provided for the JB3 model.
Table 2.
The air volume supply of the Mass-Flow-Inlet boundary condition of various models.
(2) The boundary conditions set at both ends of the central through channel are the Pressure-Outlet, i.e., defining the static pressure on the outlet boundaries at both ends of the central through channel. They can be set to the standard atmospheric pressure, i.e., 101,325 Pa.
(3) The boundary conditions set on other surfaces are the Wall, i.e., using the default no-slip boundary condition of the Fluent software.
After importing the 3D model that has been meshing into the Fluent 6.3.26 software, perform grid checking, select the solution format (the adopted scheme is second-order upwind, and the pressure–velocity coupling algorithm is coupled), set material properties (the fluid is in a compressible turbulent state) and boundary conditions, and initialize the flow field. Then, iterative solutions can be carried out until the calculation converges.
3.4. Convergence Monitoring for Iterative Calculation
To judge the convergence of iterative calculation, the curves of the residual variance and the mass flow rate at the outlet of the central through channel are selected to monitor their variation trend; these are illustrated in Figure 9. Generally, a decrease in the residual variance curve indicates convergence in the iterative calculation, while an increase indicates divergence. In most cases, a reduction of the residual variance curve by three orders of magnitude can be considered as convergence of the iterative calculation. Additionally, the mass flow rate at the outlet of the central through channel no longer changes after a period of iterative calculation, which can also be regarded as the convergence of the calculation.
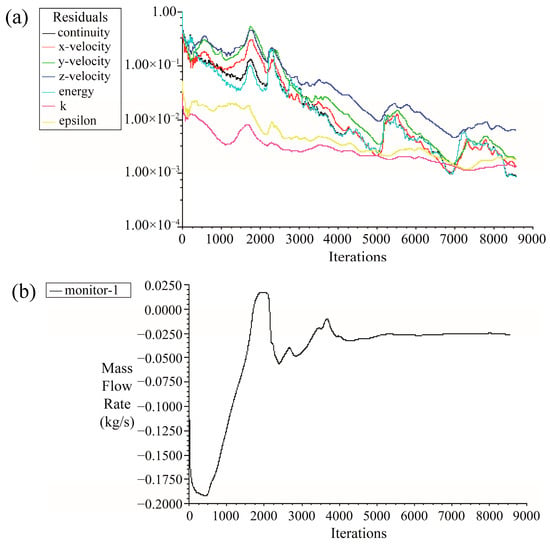
Figure 9.
The monitoring curves of the residual variance and the mass flow rate at the outlet of central through channel: (a) The residual variance curve; (b) the curve of mass flow rate at the outlet of central through channel.
4. Results
To reveal the characteristics of the local flow fields of various models and to analyze the relationship between the differences in the reverse circulation suction capabilities of each model and the internal flow patterns of the models, a uniform path was established along the central axis of the central through channel in each model. The curve charts of static pressure and velocity magnitude at the central axis of the models of JB3-1, JB3-2, JB3-3, JB3-4, JB3-5, JB6, and JC6 are illustrated in Figure 10 and Figure 11, respectively.
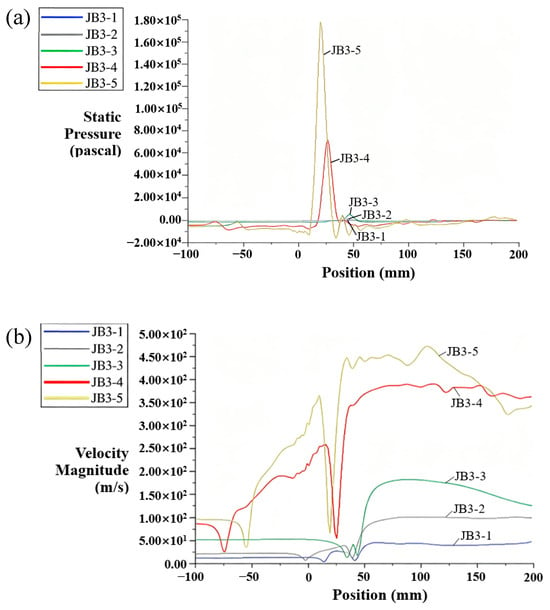
Figure 10.
The curve charts of static pressure and velocity magnitude at the central axis of the five JB3 models: (a) The curve charts of static pressure; (b) the curve charts of velocity magnitude.
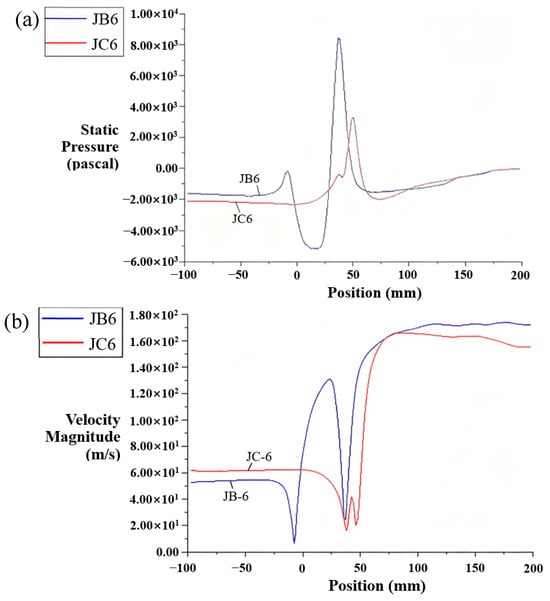
Figure 11.
The curve charts of static pressure and velocity magnitude at the central axis of the JB6 and JC6 models: (a) The curve charts of static pressure; (b) the curve charts of velocity magnitude.
As can be seen from Figure 10, for the local flow field models of the inner jet holes-type reverse circulation drill bit with the same specifications and arrangement, when different mass flow rates are given, the trends of their static pressure and velocity magnitude at the central axis are quite different. Simultaneously, as can be seen from Figure 11, for the local flow field models of the inner jet holes-type reverse circulation drill bit with the same specifications but different arrangements, when the same mass flow rate is given, the trends of their static pressure and velocity magnitude at the central axis are also different. Additionally, the contour plots of local flow fields of the above seven models by CFD simulation are illustrated in Figure 12, Figure 13, Figure 14, Figure 15, Figure 16, Figure 17 and Figure 18, respectively. Each of these figures includes ten parts, as follows: (1) The contour image of static pressure of the whole model; (2) the contour image of static pressure in the three or six evenly distributed profiles; (3) the contour image of dynamic pressure of the whole model; (4) the contour image of dynamic pressure in the three or six evenly distributed profiles; (5) the contour image of total pressure of the whole model; (6) the contour image of total pressure in the three or six evenly distributed profiles; (7) the contour image of velocity of the whole model; (8) the contour image of velocity in the three or six evenly distributed profiles; (9) the contour image of the trajectories of fluid particles at the inlet boundaries of inner jet holes; and (10) the contour image of the trajectories of fluid particles at the outlet boundaries of the central through channel.
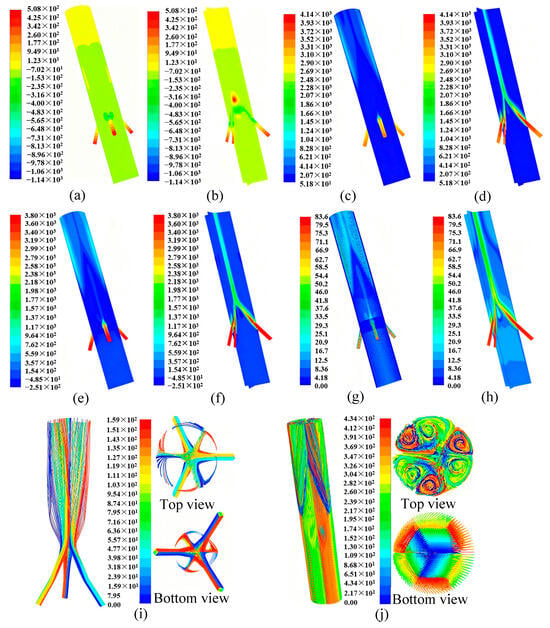
Figure 12.
The contour plots of local flow fields of the JB3-1 model by CFD simulation: (a) Static pressure distribution of the whole model; (b) static pressure distribution across three evenly distributed profiles; (c) dynamic pressure distribution of the whole model; (d) dynamic pressure distribution across three evenly distributed profiles; (e) total pressure distribution of the whole model; (f) total pressure distribution across three evenly distributed profiles; (g) velocity distribution of the whole model; (h) velocity distribution across three evenly distributed profiles; (i) fluid particle trajectories at the inlet boundaries of the inner jet holes; (j) fluid particle trajectories at the outlet boundaries of the central through channel.
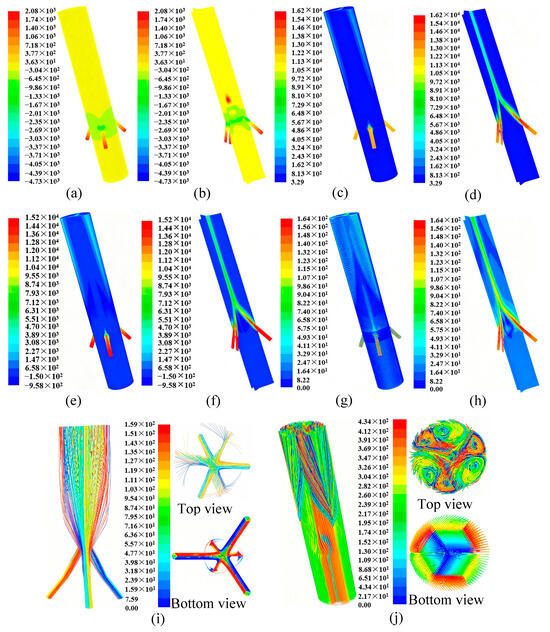
Figure 13.
The contour plots of local flow fields of the JB3-2 model by CFD simulation: (a) Static pressure distribution of the whole model; (b) static pressure distribution across three evenly distributed profiles; (c) dynamic pressure distribution of the whole model; (d) dynamic pressure distribution across three evenly distributed profiles; (e) total pressure distribution of the whole model; (f) total pressure distribution across three evenly distributed profiles; (g) velocity distribution of the whole model; (h) velocity distribution across three evenly distributed profiles; (i) fluid particle trajectories at the inlet boundaries of the inner jet holes; (j) fluid particle trajectories at the outlet boundaries of the central through channel.
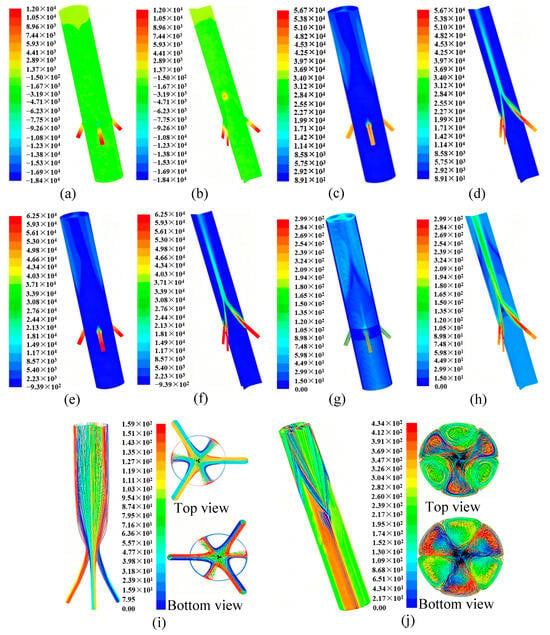
Figure 14.
The contour plots of local flow fields of the JB3-3 model by CFD simulation: (a) Static pressure distribution of the whole model; (b) static pressure distribution across three evenly distributed profiles; (c) dynamic pressure distribution of the whole model; (d) dynamic pressure distribution across three evenly distributed profiles; (e) total pressure distribution of the whole model; (f) total pressure distribution across three evenly distributed profiles; (g) velocity distribution of the whole model; (h) velocity distribution across three evenly distributed profiles; (i) fluid particle trajectories at the inlet boundaries of the inner jet holes; (j) fluid particle trajectories at the outlet boundaries of the central through channel.
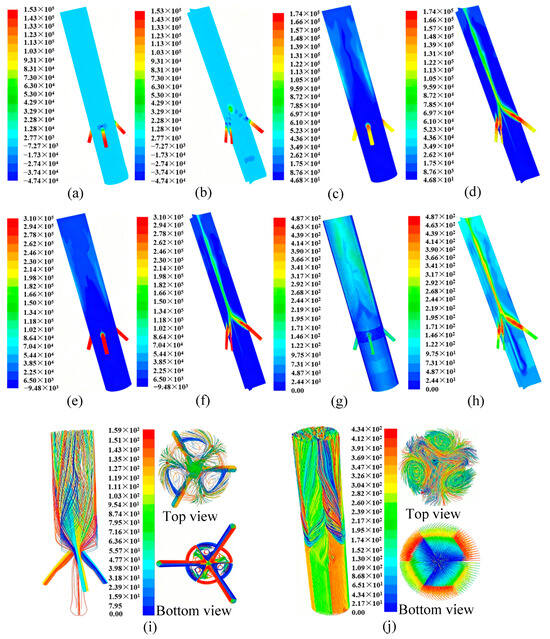
Figure 15.
The contour plots of local flow fields of the JB3-4 model by CFD simulation: (a) Static pressure distribution of the whole model; (b) static pressure distribution across three evenly distributed profiles; (c) dynamic pressure distribution of the whole model; (d) dynamic pressure distribution across three evenly distributed profiles; (e) total pressure distribution of the whole model; (f) total pressure distribution across three evenly distributed profiles; (g) velocity distribution of the whole model; (h) velocity distribution across three evenly distributed profiles; (i) fluid particle trajectories at the inlet boundaries of the inner jet holes; (j) fluid particle trajectories at the outlet boundaries of the central through channel.
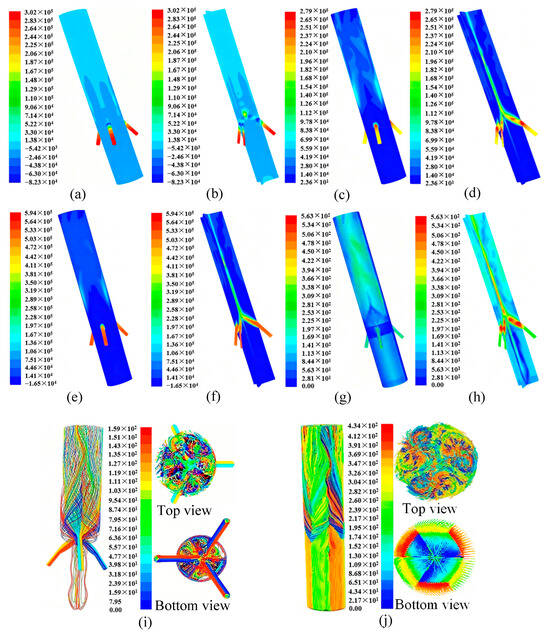
Figure 16.
The contour plots of local flow fields of the JB3-5 model by CFD simulation: (a) Static pressure distribution of the whole model; (b) static pressure distribution across three evenly distributed profiles; (c) dynamic pressure distribution of the whole model; (d) dynamic pressure distribution across three evenly distributed profiles; (e) total pressure distribution of the whole model; (f) total pressure distribution across three evenly distributed profiles; (g) velocity distribution of the whole model; (h) velocity distribution across three evenly distributed profiles; (i) fluid particle trajectories at the inlet boundaries of the inner jet holes; (j) fluid particle trajectories at the outlet boundaries of the central through channel.
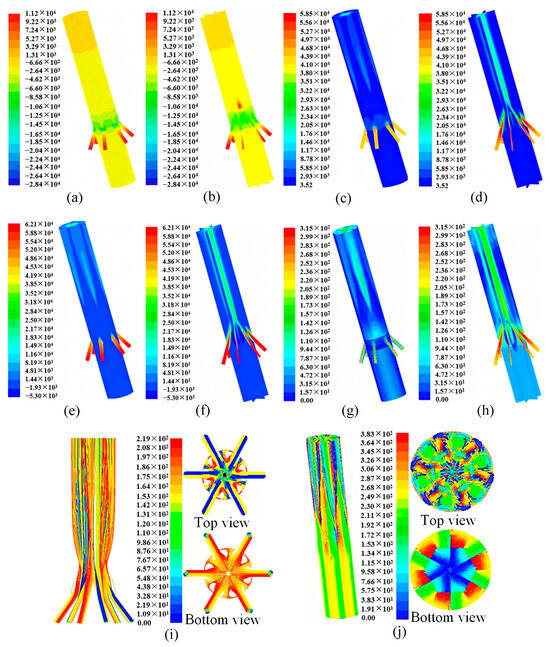
Figure 17.
The contour plots of local flow fields of the JB6 model by CFD simulation: (a) Static pressure distribution of the whole model; (b) static pressure distribution across three evenly distributed profiles; (c) dynamic pressure distribution of the whole model; (d) dynamic pressure distribution across three evenly distributed profiles; (e) total pressure distribution of the whole model; (f) total pressure distribution across three evenly distributed profiles; (g) velocity distribution of the whole model; (h) velocity distribution across three evenly distributed profiles; (i) fluid particle trajectories at the inlet boundaries of the inner jet holes; (j) fluid particle trajectories at the outlet boundaries of the central through channel.
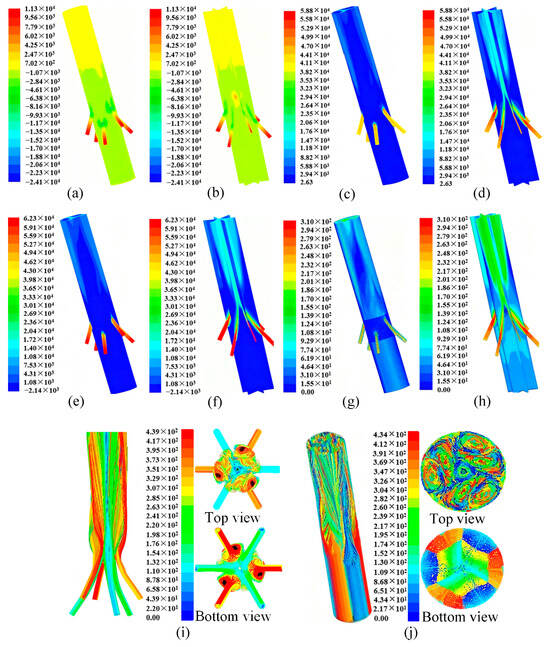
Figure 18.
The contour plots of the local flow fields of the JC6 model by CFD simulation: (a) Static pressure distribution of the whole model; (b) static pressure distribution across three evenly distributed profiles; (c) dynamic pressure distribution of the whole model; (d) dynamic pressure distribution across three evenly distributed profiles; (e) total pressure distribution of the whole model; (f) total pressure distribution across three evenly distributed profiles; (g) velocity distribution of the whole model; (h) velocity distribution across three evenly distributed profiles; (i) fluid particle trajectories at the inlet boundaries of the inner jet holes; (j) fluid particle trajectories at the outlet boundaries of the central through channel.
5. Discussion
5.1. The Influence of Air Volume Supply on the Reverse Circulation Performance Formed by the Inner Jet Holes-Type Reverse Circulation Drill Bit
To discuss the influence of air volume supply on the reverse circulation performance formed by the inner jet holes-type reverse circulation drill bit under the conditions of the same flow field model with different air volume supplies, we compared and analyzed the relationship between the air volume supply and the jet velocity in the inner jet holes, the relationship between the air volume supply and the static pressure in the central through channel below the inner jet holes, and the relationship between the air volume supply and the upward air flow velocity in the central through channel below the inner jet holes. Among them, by measuring the static pressure in the central through channel below the inner jet holes, the situation of negative pressure areas formed in the lower part of the flow field in different models. If the negative pressure effect formed is more significant, then the flow field model will have a stronger suction capacity for the rock cores (samples) located at the bottom of the borehole, and the reverse circulation performance formed by the inner jet holes-type reverse circulation drill bit will also be better. Concurrently, by measuring the upward flow velocity in the central through channel below the inner jet holes, it can also indicate the suction capacity for the rock cores (samples) located at the bottom of the borehole. If the upward flow velocity is greater, it indicates that the reverse circulation performance formed by the inner jet holes-type reverse circulation drill bit is better. The detailed values of the jet velocity in the inner jet holes, the static pressure, and the upward flow velocity in the central through channel below the inner jet holes of local flow field models of JB3-1, JB3-2, JB3-3, JB3-4, and JB3-5 based on the results of CFD simulation are listed in Table 3.
Table 3.
The results of local flow fields of the five JB3 models based on CFD simulation.
Moreover, the curve charts of the local flow fields of the above five JB3 models based on CFD simulation results are illustrated in Figure 19. As can be seen from Figure 12, Figure 13, Figure 14, Figure 15, Figure 16 and Figure 19, with the increase in the volumetric flow rate of air supply, the jet velocity in the inner jet holes increases, and the static pressure (i.e., negative pressure) in the central through channel below the inner jet holes also increases. The upward flow velocity in the central through channel below the inner jet holes (i.e., indicating the upward return velocity of the rock cores (samples) located at the bottom of the borehole) also increases. The reverse circulation performance and suction capacity formed by the inner jet holes-type reverse circulation drill bit have both been enhanced. These findings are consistent with the relevant content mentioned in References [20,21]. Additionally, three fitting relationship equations of the volumetric flow rate of air supply and the jet velocity in the inner jet holes, the volumetric flow rate of air supply and the static pressure in the central through channel below the inner jet holes, and the volumetric flow rate of air supply and the upward flow velocity in the central through channel below the inner jet holes can also be obtained, as shown in Equations (1)–(3), and their coefficients of determination, R2, are 0.9984, 0.9998, and 0.9972, respectively, indicating that these three fitting relationship equations can well represent the relationships among them.
where y1 denotes the jet velocity in the inner jet holes (m/s), y2 denotes the static pressure in the central through channel below the inner jet holes (kPa), y3 denotes the upward flow velocity in the central through channel below the inner jet holes (m/s), and x denotes the volumetric flow rate of air supply (m3/min).
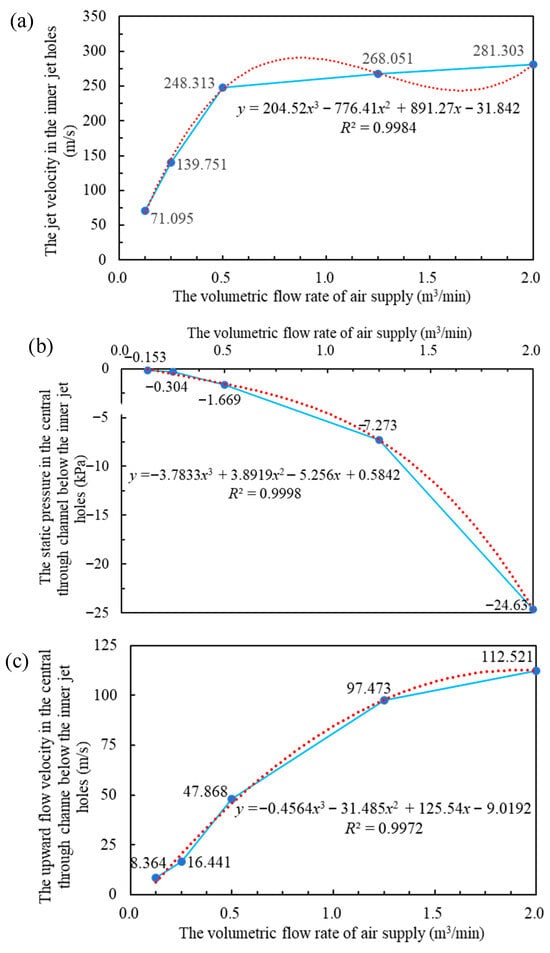
Figure 19.
The relationship curve charts of local flow fields of five JB3 models based on CFD simulation results: (a) The relationship between the volumetric flow rate of air supply and the jet velocity in the inner jet holes; (b) the relationship between the volumetric flow rate of air supply and the static pressure in the central through channel below the inner jet holes; (c) the relationship between the volumetric flow rate of air supply and the upward flow velocity in the central through channel below the inner jet holes.
5.2. The Influence of the Number and Distribution Pattern of the Inner Jet Holes on the Reverse Circulation Performance Formed by the Inner Jet Holes-Type Reverse Circulation Drill Bit
Per the comparative analysis of the CFD simulation results of local flow fields of JB3-3, JB6, and JC6 models, we discuss the influence of the number and distribution pattern of the inner jet holes on the reverse circulation performance formed by the inner jet holes-type reverse circulation drill bit. The curve charts of static pressure and upward flow velocity at the central axis of the JB3-3, JB6, and JC6 models are shown in Figure 20. As can be seen from Figure 20, the sequence of static pressure (i.e., negative pressure) and upward flow velocity (i.e., the upward return velocity of the rock cores (samples) located at the bottom of the borehole) formed by these three models is as follows: JC6 > JB6 > JB3-3. To more visually reveal the laws governing the negative pressure and the upward flow velocity formed by these three models, a point is selected at the same position within the region of the central through channel below the inner jet holes of each model. The values of static pressure and upward flow velocity at these three points are listed in Table 4, and the corresponding histograms are illustrated in Figure 21.
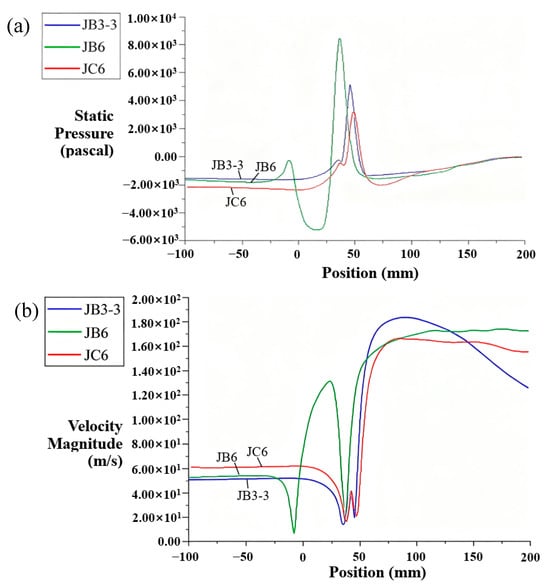
Figure 20.
The curve charts of static pressure and upward flow velocity at the central axis of the JB3-3, JB6, and JC6 models: (a) The curve charts of static pressure; (b) the curve charts of upward flow velocity.
Table 4.
The results of local flow fields of JB3-3, JB6, and JC6 models based on CFD simulation.
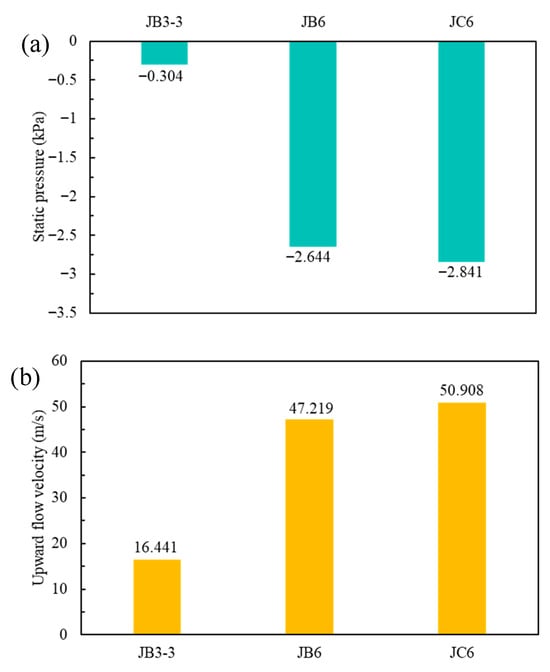
Figure 21.
The histograms of static pressure and upward flow velocity at the central axis of the JB3-3, JB6, and JC6 models: (a) The histogram of static pressure; (a) the histogram of upward flow velocity.
By comparing and analyzing the CFD simulation results of local flow fields of the JB3-3 and JB6 models based on Figure 14, Figure 17, Figure 18 and Figure 21 and Table 4, it can be seen that the static pressure (i.e., negative pressure) and the upward flow velocity formed by the JB6 model are 2.34 kPa and 30.778 m/s higher than those formed by the JB3-3 model, respectively. Thus, in terms of the number of inner jet holes, the six inner jet holes are uniformly distributed (JB6 model), the reverse circulation performance formed by the inner jet holes-type reverse circulation drill bit is better than the three inner jet holes that are uniformly distributed (JB3-3 model). Consequently, the JB6 model’s suction capacity of the rock cores (samples) located at the bottom of the borehole is also stronger. Once again, it indicates that increasing the number of inner jet holes can increase the amount of air volume supply from the inner jet holes into the central through channel within a unit of time, thereby effectively enhancing the reverse circulation performance formed by the inner jet holes-type reverse circulation drill bit. Additionally, the static pressure (i.e., negative pressure) and the upward flow velocity formed by the JC6 model are 0.197 kPa and 3.689 m/s higher than those formed by the JB6 model, respectively. Thus, in terms of the arrangement of inner jet holes, the six inner jet holes are uniformly distributed and staggered on both the upper and lower planes (JC6 model), and the reverse circulation performance formed by the inner jet holes-type reverse circulation drill bit is better than the six inner jet holes that are uniformly distributed (JB6 model). Consequently, the JC6 model’s suction capacity of the rock cores (samples) located at the bottom of the borehole is also stronger. To analyze the reasons behind this, there are mainly two aspects: (1) When several inner jet holes are symmetrically arranged at the same level (e.g., JB6 and JB 3), several high-speed air flows equal in number to the number of inner jet holes emerging from the inner jet holes and jetting upwards at an angle converge into the central through channel of the models of JB6 and JB3. On the one hand, this is due to the fact that multiple air flow jets are drawn towards the inner wall of the central through channel under the effect of adhesion. On the other hand, it is due to the mutual attraction caused by the entraining effect of the air flow jets. When multiple air flow jets extend to a certain position within the central through channel, they will intersect and collide, resulting in a decrease in the velocity and static pressure of the air flow jets. This causes an increase in the energy loss of the air flow jets in this area, and at the same time, a local low-pressure zone will be formed, generating the effect of a wind curtain, which hinders the formation of the reverse circulation. (2) Due to the fact that the inner jet holes in the upper and lower rows are not at the same level, that is, the inner jet holes have an asymmetric structure (e.g., JC6 model), the energy of the air flow jets ejected from these inner jet holes can be superimposed. Meanwhile, the generated negative pressure can repeatedly draw in the stable surrounding fluids (i.e., ambient air), facilitating the acceleration of the surrounding fluids (i.e., driven fluids). This is similar to the principle of multiple ejectors, thereby enabling the air flow jets to achieve higher velocity and facilitating upward suction of the rock cores (samples) at the bottom of the borehole to the surface. In conclusion, changing the arrangement of inner jet holes can enhance the reverse circulation performance formed by the inner jet holes-type reverse circulation drill bit. Therefore, when designing the arrangement of inner jet holes, it is best to adopt an asymmetrical structural design form and avoid a completely symmetrical arrangement of inner jet holes.
6. Conclusions
Based on CFD simulations, comparative analyses of the three typical inner jet holes-type reverse circulation drill bits for pneumatic hollow-through DTH hammer yield the following key conclusions:
(1) With all other parameters held constant, varying only the air volume supply at the inlets of inner jet holes leads to the following trends: As the air volume supply increases, the velocity of air flow jet in the inner jet holes rises, and the negative pressure formed in the central through channel below the inner jet holes concurrently increases. This enhancement improves both the reverse circulation performance and suction capacity of the inner jet holes-type reverse circulation drill bit, as well as the upward transport velocity of rock samples at the borehole bottom. Consequently, the reverse circulation performance of the local flow field models follows the order JB3-5 > JB3-4 > JB3-3 > JB3-2 > JB3-1. Additionally, fitting equations are derived to describe the relationships between (i) the volumetric flow rate of air supply and the jet velocity in the inner jet holes; (ii) the volumetric flow rate of air supply and the static pressure in the central through channel below the inner jet holes; and (iii) the volumetric flow rate of air supply and the upward flow velocity in the central through channel below the inner jet holes.
(2) Regarding the number of inner jet holes: The greater the number of inner jet holes, the higher the negative pressure formed in the central through channel below the inner jet holes, and the faster rock samples at the borehole bottom are suction-lifted to the surface—indicating superior reverse circulation performance formed by the inner jet holes-type reverse circulation drill bit. Under identical simulation conditions, the JB6 model exhibits a static pressure (i.e., negative pressure) and an upward flow velocity that are 2.34 kPa and 30.778 m/s higher than those of the JB3-3 model, respectively. Regarding the arrangement of inner jet holes, a staggered arrangement of inner jet holes results in better reverse circulation performance than a uniform arrangement at the same level. Under identical simulation conditions, the JC6 model exhibits a static pressure (i.e., negative pressure) and upward flow velocity that are 0.197 kPa and 3.689 m/s higher than those of the JB6 model, respectively. Collectively, the reverse circulation performance of the models follows the order JC6 > JB6 > JB3-3.
(3) For the structural design of an inner jet holes-type reverse circulation drill bit for a pneumatic hollow-through DTH hammer, an asymmetric arrangement of inner jet holes is preferable to a fully symmetric one.
Author Contributions
Conceptualization, J.W.; methodology, J.W.; software, J.W. and F.Z.; formal analysis, J.W. and F.Z.; investigation, J.C. and F.Z.; writing—original draft preparation, J.W., J.C. and F.Z.; writing—review and editing, J.W. and F.Z.; supervision, J.W.; funding acquisition, J.W. All authors have read and agreed to the published version of the manuscript.
Funding
This research was funded by the National Natural Science Foundation of China (Grant No. 42172348); the Hebei Natural Science Foundation (Grant No. E2023210022); the 2025 Science Foundation for Distinguished Young Scholars of Shijiazhuang Tiedao University; and the Open Research Fund Program of Engineering Research Center of Geothermal Resources Development Technology and Equipment, Ministry of Education, Jilin University (Grant No. 22014).
Data Availability Statement
All the data are contained within the article.
Conflicts of Interest
Author Fengtao Zhang was employed by the company Shijiazhuang Coal Mining Machinery Co. Ltd. The remaining authors declare that the research was conducted in the absence of any commercial or financial relationships that could be construed as a potential conflict of interest.
References
- Wang, Y.H.; Wang, J.P.; Zhang, G.Q.; Gao, M.Z.; Zhang, X.; Xie, H.P. Advances in drill-based sampling technology for extraterrestrial bodies. Space Sci. Rev. 2024, 220, 66. [Google Scholar] [CrossRef]
- Sun, Y.H.; Zhang, F.Y.; Wang, Q.Y.; Gao, K. Application of “Crust 1” 10k ultra-deep scientific drilling rig in Songliao Basin Drilling Project (CCSD-SKII). J. Pet. Sci. Eng. 2016, 145, 222–229. [Google Scholar] [CrossRef]
- Robinson, R.S.; Tikoo, S.; Fulton, P. Sea changes for scientific ocean drilling. Phys. Today 2024, 77, 28–34. [Google Scholar] [CrossRef]
- Zhang, N.; An, C.L.; Fan, X.P.; Shi, G.T.; Li, C.J.; Liu, J.F.; Hu, Z.Y.; Talalay, P.; Sun, Y.H.; Li, Y.S. Chinese First Deep Ice-Core Drilling Project DK-1 at Dome A, Antarctica (2011–2013): Progress and performance. Ann. Glaciol. 2014, 55, 88–98. [Google Scholar] [CrossRef]
- Christiansen, F.G.; Whitehead, D.; Bojesen-Koefoed, J.A.; Boserup, J.; Christiansen, O.C.A. Drilling history of Greenland—Exploration for minerals and petroleum, and scientific projects. Extr. Ind. Soc. 2024, 17, 101417. [Google Scholar] [CrossRef]
- Lian, Z.H.; Zhang, Q.; Lin, T.J.; Wang, F.H. Experimental and numerical study of drill string dynamics in gas drilling of horizontal wells. J. Nat. Gas Sci. Eng. 2015, 27, 1412–1420. [Google Scholar] [CrossRef]
- Yang, X.; Guo, B.Y.; Timiyan, T.A. Analytical and numerical simulation of asymmetric converging flow of gas under drill bits in reverse circulation gas drilling. J. Energy Resour. Technol.-Trans. ASME 2022, 144, 043201. [Google Scholar] [CrossRef]
- Zhang, X.X.; Luo, Y.J.; Gan, X.; Yin, K. Design and numerical analysis of a large-diameter air reverse circulation drill bit for reverse circulation down-the-hole air hammer drilling. Energy Sci. Eng. 2019, 7, 921–929. [Google Scholar] [CrossRef]
- Luo, Y.; Shi, E.X.; Feng, Y.; Guo, B.Y.; Zhang, L.H. Finite element investigation of flow field below asymmetric drill bits for reverse circulation in drilling tight oil and gas reservoirs. CMES-Comput. Model. Eng. Sci. 2019, 121, 105–122. [Google Scholar] [CrossRef]
- Zhang, X.X.; Wu, Z.H.; Zhao, Z.Q.; Sun, P.H.; Tang, L.B.; Shabir, U. Insight into dust control performance of a reverse circulation drill bit using multiphase flow simulation. Eng. Appl. Comput. Fluid Mech. 2022, 16, 841–857. [Google Scholar] [CrossRef]
- He, J.F.; Sun, B.X.; Liang, Y.P.; Luo, Y.J. Research on suction capacity and dust suppression performance of a reverse circulation air hammer in tunnel drilling. Tunn. Undergr. Space Technol. 2018, 71, 391–402. [Google Scholar] [CrossRef]
- Chen, D.M.; Qu, B.H.; Long, W.; Li, Y.Y. Design optimization of a coal seam annular air reverse circulation bit. Energy Sci. Eng. 2023, 11, 1998–2021. [Google Scholar] [CrossRef]
- Cao, P.L.; Cui, G.Q.; Qi, B.; Yao, S.S.; Zheng, Z.C.; Bo, K. Investigation on the cuttings carrying capacity of a novel retractable drill bit used in casing while drilling with air reverse circulation. J. Pet. Sci. Eng. 2022, 219, 111079. [Google Scholar] [CrossRef]
- Cao, P.L.; Cao, H.Y.; Cao, J.E.; Wen, C.D.; Chen, B.Y.; Yao, S.S. Performance of large-diameter pneumatic down-the-hole (DTH) hammers: A focus on influences of the hammer structure. Pet. Sci. 2023, 20, 2399–2412. [Google Scholar] [CrossRef]
- Cao, P.L.; Zhao, Q.; Chen, Z.; Cao, H.Y. Orthogonal experimental research on the structural parameters of a novel drill bit used for ice core drilling with air reverse circulation. J. Glaciol. 2019, 65, 1011–1022. [Google Scholar] [CrossRef]
- Cao, J.E.; Cao, H.Y.; Zhang, H.Y.; Bai, J.H.; Cao, P.L. A novel self-rotating down-the-hole hammer with impact and rotary functions for directional drilling: Design, modeling, and experiments. Pet. Sci. 2025, 22, 413–429. [Google Scholar] [CrossRef]
- Cui, G.Q.; Cao, P.L.; Wang, M.Q.; Wang, X.Q.; Chen, D.X.; Qi, B. Investigation of cuttings transport in a reverse circulation drill bit during direction drilling using two-phase flow simulation. ACS Omega 2025, 10, 30295–30312. [Google Scholar] [CrossRef]
- Qi, B.; Cao, Y.; Cui, G.Q.; Liu, H.A.; Zhai, L.H.; Cao, P.L.; Wu, J.H. A comprehensive study on evaluating drainage capability of air reverse circulation down-the-hole hammer drill bits via numerical simulation and experimentation. Geoenergy Sci. Eng. 2025, 252, 213918. [Google Scholar] [CrossRef]
- Bo, K.; Ji, F.Z.; Zhao, Z.Q.; Fan, L.M.; Wang, M.S. Optimum design of large-diameter reverse circulation drill bit for drilling rescue wells using orthogonal experimental method and CFD simulation. Energies 2023, 16, 3913. [Google Scholar] [CrossRef]
- Hao, S.Q. Simulation and Experimental Study on Down-the-Hole Drilling Fluid Field of the Hollow DTH Hammer Reverse Circulation Coring and Sampling Technology. Ph.D. Dissertation, Jilin University, Changchun, China, 2007. (In Chinese). [Google Scholar]
- Liu, J.L. Research on the Key Technologies of Hollow-Through DTH Hammer Used in Gas Drilling. Ph.D. Dissertation, Jilin University, Changchun, China, 2009. (In Chinese). [Google Scholar]
- Huang, Y. Numerical Simulation and Experimental Study on Gas-Solid Flow Field of DTH Hammer Reverse Circulation Drilling. Ph.D. Dissertation, Jilin University, Changchun, China, 2013. (In Chinese). [Google Scholar]
- Gokhul, K.; Sundaram, S.S. Numerical analysis on ejector performance with varying geometric parameters of chevrons. Int. J. Refrig. 2025, 178, 180–191. [Google Scholar] [CrossRef]
- Zhou, F.; Yao, K.W.; Ma, G.Y. Entrainment and flow performance study of a novel shark-gill bionic ejector for a PEMFC hydrogen supply system. Renew. Energy 2025, 255, 123700. [Google Scholar] [CrossRef]
- Zheng, H.F.; Wang, J.B.; Tian, G.J.; Zhang, X.Y.; Li, M.Y.; Yang, C.W. Study of the performance of a photovoltaic-driven solar ejector refrigeration system. J. Build. Eng. 2025, 108, 112782. [Google Scholar] [CrossRef]
- Wang, Y.B.; Guo, X.X.; Liu, X.H.; Shi, C. Jet performance exploration of an ejector for multi-parallel ejector air curtain. Int. Commun. Heat Mass Transf. 2025, 164, 108868. [Google Scholar] [CrossRef]
- Wang, M.; Niu, Z.H.; Yong, L. Study on the key parameters of ice particle air jet ejector structure. Sci. Rep. 2024, 14, 17831. [Google Scholar] [CrossRef] [PubMed]
Disclaimer/Publisher’s Note: The statements, opinions and data contained in all publications are solely those of the individual author(s) and contributor(s) and not of MDPI and/or the editor(s). MDPI and/or the editor(s) disclaim responsibility for any injury to people or property resulting from any ideas, methods, instructions or products referred to in the content. |
© 2025 by the authors. Licensee MDPI, Basel, Switzerland. This article is an open access article distributed under the terms and conditions of the Creative Commons Attribution (CC BY) license (https://creativecommons.org/licenses/by/4.0/).