Article

A Multistage Algorithm for Phase Load Balancing in Low-Voltage Electricity Distribution Networks Operated in Asymmetrical Conditions

by
Ovidiu Ivanov
*,
Florin-Constantin Băiceanu
,
Ciprian-Mircea Nemeș
,
Gheorghe Grigoraș
,
Bianca-Elena Țuchendria
and
Mihai Gavrilaș
Power Engineering Department, Gheorghe Asachi Technical University of Iasi, 700050 Iasi, Romania
*
Author to whom correspondence should be addressed.
Symmetry 2025, 17(10), 1589; https://doi.org/10.3390/sym17101589
Submission received: 15 August 2025 / Revised: 4 September 2025 / Accepted: 10 September 2025 / Published: 23 September 2025
(This article belongs to the Special Issue Symmetry in Power System Dynamics and Control)

Abstract

In many countries, most one-phase residential electricity consumers are supplied from three-phase, four-wire local networks operated in radial tree-like configurations. Uneven consumer placement on the wires of the three-phase circuit leads to unbalanced phase loads that break the voltage symmetry and increase the energy losses. One way to mitigate these problems is to balance the phase loads on the feeders by choosing the optimal phase of connection of the consumers. The authors proposed earlier a phase balancing algorithm based on metaheuristic optimization. For networks with a high number of supply nodes, this algorithm requires finding a solution for all the consumers simultaneously. Two alternative approaches are proposed in this paper that use the tree-like structure of the network to divide the optimization between a main distribution feeder and several branches, creating a multistage process, with the aim of minimizing energy losses. A case study is performed using a real low-voltage distribution network and a comparison is made between the three algorithms. The resulting losses have marginal variations between the proposed approaches, with a maximum of 1.3% difference.

1. Introduction

Electricity is one of the key energy resources that is powering our society today. Its importance is increasing as the world is moving away from fossil fuels in an effort to protect the environment and preserve the planet’s natural resources for future generations. But what sets apart electricity from other resources is the lack of means for storage in large quantities for a long period of time. This is why electricity must be consumed mainly at the time when it is produced. To do this, national, regional, and local systems were built, which provide the infrastructure needed for generating electricity and delivering it across significant geographical distances, all the way to remote consumers.
These systems are divided into long-distance transmission (high voltage, HV) and short-distance distribution (medium and low voltage, MV, LV) alternating current (AC) systems, each having their own characteristics and requirements. Regardless of their type and size, these systems must comply with rigorous technical and economic constraints regulated by laws and standards regarding the quality [1], efficiency [2], and security [3] of supply.
In the area of efficiency, one key problem is represented by energy losses, defined as the difference between electricity generation and import and actual consumption and export within a specified time interval. Most losses occur in electricity distribution systems [4], especially in LV distribution networks (LVDNs), as the majority of consumers and most of the electricity demand are located here, and the losses are directly proportional to the square current, which is higher for the same power flow when the voltage is lower.
Losses can be divided into technical and non-technical [5]. The two components have different causes and solving each problem requires distinct types of corrective measures and methodologies. The main causes of non-technical or commercial losses are theft, incorrect billing, or meter reading errors [6]. The focus in this paper is on technical losses, which can be influenced by several factors. The first is the nature of the material used for wires and other equipment and its electric conductivity properties. Another is the technical solution used in building the electrical network. The use of three-phase circuits splits the current between phases, reducing losses with the squared value of the current. Also, the way in which the network is operated plays an important role. HV and LV three-phase networks are operated in balanced and symmetrical conditions. The load on the three phases is always balanced, leading to a symmetrical voltage system (equal voltage phase angle of 120 degrees between the a, b, and c phases of the electrical circuit). However, in a LV three-phase, four-wire electrical network, the presence of prosumers who generate electricity locally [7] and the unbalanced load [8] can result in a significant increase in losses. Multiple one-phase loads distributed unevenly on the three phases creates unbalanced phase loads, which cannot ensure the symmetry of the three-phase voltage system and leads to increased energy losses. The goal of the utility that manages the LVDN, known as the electricity distribution network operator (DNO), is to operate the network as close as possible to its balanced phase (angle) load and phase (circuit) voltage symmetry conditions as possible. The reduction in losses through phase load balancing (PLB) is, thus, an important topic of study, well represented in the literature.

1.1. Literature Review

Electricity distribution networks are affected by the significant changes in their operating conditions brought by the proliferation of prosumers and electric vehicles (EVs). Prosumers inject unpredictable quantities of electricity into the local grid, while EVs act as a load. Moreover, LVDNs are built as three-phase, four-wire feeders that supply mostly one-phase consumers, which creates uneven phase load. This pattern of consumption, with all these overlapped components, can lead to highly unbalanced phase power flows, which are known to worsen both the losses [8] and the voltage profiles and symmetry [9] of distribution networks.
The first step in obtaining energy loss reduction is to assess the real operational state of the network. Since local factors such as the uncoordinated distributed generation and demand [10] can lead to inefficient operation, an advanced metering and monitoring system is required for obtaining a quick and accurate assessment of the state of the network and determining the appropriate measures to be taken, and their location, when they are needed [11].
Loss reduction can be achieved using several methods. Researchers have proposed, in all types of distribution networks, multiple approaches for this purpose, such as the reduction in consumer demand (electricity consumption) [12], reactive power flow control by capacitor banks [13], or network topology reconfiguration [14]. When renewables in the form of distributed generation or prosumers are present other approaches are as follows: the optimal allocation of distributed generation (DG) sources [15], local electricity trading between peers connected in the same microgrid [16], intelligent var control at photovoltaic (PV) inverter level [17], and intelligent placement of storage batteries at chosen buses in the network [18]. If EVs are present in the network, their charge can be coordinated with the demand [19] or PV generation [20] to decrease losses.
In LVDNs, the main approach to loss reduction is the balancing of the load on the three phases. This reduces the losses on the most loaded phases and on the neutral wire, contributing to the general loss reduction. This endeavor often faces difficulties because of the lack of data regarding load measurements and phase identification for each consumer in the network. The optimization of losses can be preceded by phase identification for the consumers [21], wind forecast [22] or solar generation planning [23], and capacity waste assessment due to imbalance [24].
Phase balancing is achieved next by various methods, including optimally placed capacitors [25], custom PV inverters [26], controllable loads [27], phase-distributed storage batteries [28], and phase switching for individual consumers [29]. Phase switching can be effective even if it is applied to a fraction of the consumers in the network [30]. Local load balancing performed at bus level can be coordinated with other changes at network level, such as compensation at MV/LV substation level [31].
Loss minimization and phase balancing are optimization problems. They are solved using tools such as optimal power flow (OPF) [27], nonlinear optimization algorithms, including the following non-convex optimization [27], mixed-integer linear programming (MILP) [21], and multi-agent deep deterministic policy gradient (MADDPG) [28], or metaheuristics, including particle swarm optimization (PSO) [15], slime mold algorithm (SMA) [17], genetic algorithm (GA) [23,30], and whale optimization algorithm (WOA) [29]. Where insufficient data is available, statistical methods can be used [24]. Forecasted values can be obtained using machine learning tools such as artificial neural networks (ANNs) [22]. For complex tasks, the optimization is performed in stages or layers. In [32], PV output is optimized using storage, followed by power flow optimization by network equipment setting. In [27], a low-voltage grid is controlled both at bus level and at network level. Table 1 presents a summary of the current approaches in LVDN loss minimization.

1.2. Research Motivation and Contributions

A survey of the latest literature shows that studies on loss minimization are performed in MV test networks with a small number of buses (IEEE 33, 30, 13, 19, 25 bus test networks) [13,15,18,19,21,22,32], where the imbalance refers mostly to uneven demand in different areas of the network. There are studies where small LV networks are used [9]. Lately, more complex networks are considered, with a high number of buses or consumers [16,23,27,30]. Using real networks with many consumers is often difficult because of the lack of real measured data and network information, especially in older networks and at low voltage level [33]. But using real networks is a valuable approach, because it allows one to gain insight into the real operation conditions encountered by utilities in the field.
Considering these aspects, the authors have further developed the algorithm first published in [34,35] to use a multistage approach in balancing the phase loads in radial LV distribution networks by phase swapping or redistributing one-phase consumers, with the aim of minimizing the energy losses over a 24 h period. Because large LVDNs are operated in radial tree configuration, with one main feeder and several branches, and the highest losses are found in the main feeder, due to its high load, the paper presents a comparison between the following three approaches using phase balancing:
Table 1. Current approaches for LVDN loss minimization.
ApproachMethodAdvantagesLimitations
Limitation of
neutral wire current
Hardware solution [8]ScalabilityLack of optimization
Multi-agent deep reinforcement learning [28]Use of distributed single-phase storageSmall test system
PV inverter management [31]Distributed and local PV inverter controlHIL model
Management of battery storage and electric vehicle chargingSimulation [10]Multiple scenario analysisNo individual phase analysis
Mixed-integer linear optimization [20]Simultaneous optimization of EV charging, PV output, and LVDN managementSmall test system and no individual phase analysis
Local peer-to-peer electricity trading and communicationGale–Shapley algorithm [16]DSO-independent network congestion solvingNo individual phase analysis, trading based solely on distance
Stratified optimization and control [27]Usable in real-time operationComplex model, requiring multiple concurrent tools and the need for forecasted data
Phase load balancingBenders decomposition (MILP and LP) [21]Phase identification of individual consumersHigh number of iterations
Whale optimization algorithm [29]The detailed three-phase model of the LVDN is consideredSmall test system and consumers modeled as typical load profiles
Deterministic crowding algorithm (genetic algorithm variant) [30]Efficient even with a low count of measured consumersNo explicit diagram of the LVDN and consumers modeled as typical load profiles
Particle swarm optimization [36]Initial and continuous optimization
Mixed-integer second-order optimization [37]Works with partial information from the LVDNNeeds accurate control of phase-switching devices
Simulation [38]Can outperform the use of energy storageUses a theoretical active asymmetry energy-absorbing device
Estimation of phase peak currentStatistical method, cluster-wise probability assessment [24]Minimal input dataLack of precision
Reactive power compensation using
capacitor banks
Mathematical computation [25]Flexible capacitor bank configurationsSmall, theoretical test system and restrictive initial assumptions
Interior-point nonlinear optimization [39]Consideration of special types of loadsSmall test system
PV generation
management
Custom PV inverter simulation [26]Flexible scenario generationSmall, theoretical test system
Particle swarm optimization [40]DG optimizationSmall test system
Demand response, on-load transformer tap changersParticle swarm optimization [41]Voltage symmetry optimizationUser comfort settings can reduce the efficiency of the approach
  • The reference case, used in [34,35], where the phase swapping is performed at network level, including the main feeder and branches.
  • A multistage swapping approach where the swapping is performed first separately on each branch, and then their aggregate load is used subsequently to optimize the main feeder (the branch–main feeder multistage method).
  • A multistage swapping approach where the phase swapping is performed first on the main feeder and the branches are considered as aggregate three-phase loads, and the phase distribution of these aggregated loads is used subsequently as reference for swapping the loads on the branches (the main feeder–branch multistage method).
The objective function in each study is the minimization of active energy losses over 24 h. A real three-phase, four-wire LVDN that supplies almost 200 one-phase consumers is used as a case study, with a configuration consisting of one main branch and two branches with significant loads. The results are of practical interest for future developments of this type of network, encountered frequently in the real operation of electricity distribution grids.

2. Materials and Methods

2.1. Theoretical Considerations

Electricity distribution networks are designed to operate symmetrically and remain balanced across all phases. This includes elements such as lines, transformers, and DGs with identical electrical characteristics. Ideally, the current and voltage at each node of the LVDN should be equal in magnitude, with a 120-degree phase difference between phases. However, perfect symmetry in currents and voltages is nearly impossible in real-world LVDNs. This is mainly due to imbalances introduced by network components such as lines, transformers, and the connection of single-phase end-users. Consequently, the system becomes asymmetric, resulting in unbalanced voltage and current conditions [42].
Imbalances in distribution networks can be divided into two categories: (i) imbalances caused by the spatial arrangement of phase conductors in electrical lines and the transformers’ windings from the electricity distribution substations; (ii) imbalances that occur when single-phase end-users are connected between two phases or between a phase and the neutral point. These include domestic and tertiary end-users having a demand up to 100 kVA, as well as single-phase industrial consumers with higher power demands at MV level. In MV distribution networks, typical single-phase loads include welding installations, arc furnaces, and other similar industrial facilities [43].
Current and voltage imbalances are interconnected and should not be addressed separately. Voltage imbalances can cause current imbalances, resulting in financial and technical losses for both end-users and distribution network operators. Figure 1 illustrates how current imbalances lead to technical issues in the LVDNs of the DNOs. It emphasizes the challenges in voltage control, the management of the distribution process associated with the increasing energy efficiency, as well as the risk that this imbalance could propagate throughout the MV distribution networks [43,44].
The current imbalances cause higher energy losses in electricity distribution networks, reducing the efficiency of the distribution process. In certain cases, sustained imbalanced conditions lead to additional current flows in the neutral conductor, which negatively impact energy losses by increasing their values. They can also cause false malfunction diagnoses. This may trigger the circuit breaker to trip, resulting in power outages. Ensuring balanced phases helps prevent these unnecessary trips and outages. Similarly, current imbalances generate extra heat in the insulation of machine windings and other three-phase equipment or devices installed at the end-users, causing insulation damage and a shorter lifespan. In such cases, a balanced system improves power quality by maintaining equal voltages and currents across all three phases, which is crucial for the stable and reliable operation of sensitive electrical devices. At the same time, correcting these imbalances increases the dependability of three-phase equipment.
Generally, it is simpler for DNOs to adopt measures that reduce current imbalances. The primary benefit of balancing current is the decrease in current flowing through the neutral conductor, which helps to lower overall losses in the LVDNs.
Most research focuses on phase load balancing devices installed at the supply point, represented by the distribution system, or at the connection point between end-users and the network. Various technical solutions, including different balancing mechanisms such as static transfer systems, microcontroller-based devices, and relays with contactors, are utilized. However, deploying phase load balancing devices at end-users to reduce current imbalances in the LVDNs involves a significant investment by the DNOs. Additionally, it relies on centralized control, which becomes increasingly challenging to implement as the number of devices increases. The idea of using phase balancing at the level of the lateral branches during the PLB process has not been extensively examined.
Numerous research papers have explored different balancing devices with controllable switches. Devices based on static transfer systems, with various costs and technical features [45,46,47], are already in use. These solutions aim to reduce purchase expenses and switching times. Other devices include a control system for three-phase load imbalance [48], which features two parallel components (magnetic holding relay and thyristor), allowing quick switching of loads among phases a, b, or c. The main benefits are low cost, high real-time performance, and lower imbalance levels. An automatic phase load balancing device using a microcontroller and three relays was proposed in [49,50,51], where relay operating time is essential for switching. The results show that this method is both practical and economical. Paper [52] proposed an alternative device for three-phase balancing, which involves six relays and contactors to maintain balanced loads. In [53], solid-state relays and contactors per phase were utilized, with three triacs in each relay. It was designed so that no two triacs were active simultaneously, thereby preventing phase short circuits. Paper [54] proposed a phase-swapping device with magnetic latching relays, offering a cost-effective and technically sound solution that also employed high-speed data transmission for remote control capabilities.
Regarding the optimization models linked to the PLB problem, various objectives have been considered, with the most significant involving minimizing energy losses, F O W [55,56], squared deviation between hourly phase currents and their average value, FOCD [57], or the average current unbalance degree, FOCUD [58]. These are calculated at a low voltage level of an electric distribution substation supplying an LVDN over an analysis period (usually, H = 24 h) using the following equation:
min F O W = m i n h   =   1 H s   =   1 S p h     { a , b , c } P p h , s h   + P 0 , s ( h )
min F O C D = m i n h = 1 H p h     { a , b , c } I p h ( h ) p h { a , b , c } I p h ( h ) n p h 2
min F O C U D = m i n 1 H h = 1 H 1 n p h p h     { a , b , c } n p h · I p h ( h ) p h     { a , b , c } I p h ( h ) 2
where P p h , s h is the power losses in the phase conductors ph, with ph  {a,b,c}, from section s, where s = 1, …, S, and S represents the total number of the sections forming the LVDN at hour h, where h = 1, …, H; P 0 , s h is the hourly power losses in the neutral conductor from branch s and at hour h; I p h ( h ) is the current in the phase conductor ph at hour h; nph is the total number of the phases (generally, nph = 3); and H is the analysis period.
These objectives are subject to technical constraints regarding:
  • Balance of the end-users at the level of LVDN in the PLB process, which can be represented as follows:
N e u = u a = 1 N a ( h ) n u a ( h ) + u b = 1 N b ( h ) n u b ( h ) + u c = 1 N c ( h ) n u c ( h ) ,   h = 1 , ,   H
  • Balance of the phase currents at the level of the control nodes (poles/lateral branches), which can be represented as follows:
I c n , p h ( h ) = p h     a , b , c u = 1 N c n , p h I u , p h ( h ) + I d , p h ( h ) , d c n ,   h = 1 , ,   H ; c n = 1 , ,   N C N
  • Thermal limit currents of phase conductors from each section of the LVDN, which are as follows:
I p h , s ( h ) I t l , s ,   s = 1 , ,   S ;   h = 1 ,   ,   H ;   p h     { a , b , c }  
where Neu is the total number of the single-phase end-users from the LVDN; N(h)a is the total number of the single-phase end-users connected to the phase a of the LVDN at hour h, h = 1, …, H; N(h)b is the total number of the single-phase end-users connected to the phase b of the LVDN at hour h, h = 1, …, H; N(h)c is the total number of the single-phase end-users connected to the phase c of the LVDN at hour h, h = 1, …, H; I u , p h ( h ) is the current of the end-user u connected at the phase ph, with p h a , b , c ,   at the level of the control node (poles/lateral branches) cn, where cn = 1,…, NCN, and NCN represents the total control nodes considered in the phase load balancing process; I d , p h ( h ) is the current flows on the phases ph, with p h a , b , c , towards the pole d (located downstream by the control node (poles/lateral branches) cn), and hour h; I p h , s ( h ) is the current in the phase conductors ph, from section s, at hour h; and I t l , s is the thermal limit current of the phase conductors ph, from section s of the LVDN.
Depending on the decision maker’s strategy, any of the three objectives (energy losses, squared deviation between hourly phase currents and their average value, or the average current unbalance degree calculated at the low voltage level of the electric distribution substation supplying the LVDN) as specified by Equations (1)–(3) can be selected, provided they meet the constraints (4)–(6). The optimization variables are defined by the connection points of each single-phase end-user at each hour during the analyzed period.
Depending on the desired strategy, a DNO can choose any of the three objective functions, solving a single objective optimization problem. The first, which relates to minimizing power losses in the phase and neutral conductors, is commonly used by the DNOs to assess the efficiency of the distribution process in both balanced and unbalanced states. It enables the easy identification of network areas with loss issues, allowing for the implementation of technical measures to reduce them (phase load balancing, voltage control, etc.). Equations (2) and (3) are used exclusively for unbalanced operating states, where the distribution operator addresses phase load balancing issues. While the objective associated with Equation (2) can be seen as a general goal to keep phase current values as equal as possible, the objective tied to Equation (3) serves as a performance indicator of a low-voltage network’s degree of imbalance. Ideally, this imbalance degree should be 1, but the DNO aims for it to be as low as possible (around 1.1 in Romanian EDNs [59]).

2.2. Methodology

As described above, low-voltage distribution networks usually supply many one-phase consumers and a small number of larger, three-phase consumers, through three-phase, four-wire feeders in a tree-like structure. Each consumer is connected to its supply point through an individual connection, according to its type (one- or three-phase). In rural or suburban areas, these networks are usually aerial, with consumers connected at poles. In urban areas, underground cables are used, and individual consumers are connected to the grid through distribution boxes. The length of the network and the number of consumers connected to each pole or box change over time as the network develops over months or years of operation. The demand of each consumer is variable during the day, according to its needs and preferences. A basic diagram of such a network is presented in Figure 2a.
As a result, the load on each of the three phases is almost always unbalanced and variable in time (Figure 3). This imbalance, as discussed earlier, is a main source of additional energy losses in the network which increase when the imbalance is higher.
In this paper, the LVDN presented in Figure 2a is seen as being divided into several sections, as in Figure 2b. This division considers one main feeder from which one or more branches diverge. The main feeder has the particularity that on it flows the energy needed to supply its consumers, and also the demand required by the branches (including losses). Thus, the loading on this section is the highest and most losses occur here. On the other hand, each individual branch requires a lower amount of power, which supplies only its consumers and thus generates less loss. The main feeder and its branches have the same main characteristics in the network (phase configuration, consumer type and phase of connection, and the existence of a main supply point), which means that the same method of analysis can be used for evaluating their state of operation. Although they are not considered directly in this study, prosumers and/or storage can by modeled by changing accordingly the load measurements in specific buses.
The authors have proposed previously in [34,35] a phase balancing solution based on the particle swarm optimization algorithm [60] which performs the phase swapping of one-phase consumers with the objective of minimizing the current imbalance factor (CIF) defined in Romanian regulations and [34] as follows:
C I F b r = 1 3 I b r , a I b r , a b c a v e r a g e 2 + I b r , b I b r , a b c a v e r a g e 2 + I b r , c I b r , a b c a v e r a g e 2
which is computed with phase currents Ibr, phase and average abc currents I b r , a b c a v e r a g e , and power and energy losses on branches [35].
The structure of a solution optimized by the PSO solution was chosen to encode in a straightforward manner the distribution of the consumers on the phases. The principle from Figure 4 is used. The length of the solution vector is equal to the number of consumers from the network, and each element has the value 1, 2, 3, or 0, denoting the phase of connection (1–3) or a three-phase consumer (0). This approach prevents the shifting of consumers between poles and allows only changing the phase of connection for each individual consumer. In this way, constraints (4) and (5) are always fulfilled. The fulfillment of constraint (6) is a consequence of finding the phase load distribution with minimal losses, which is one where the phase loads are balanced.
The results were shown to improve the desired objectives. However, this method uses the entire network and pool of consumers in the optimization process. As a result, the solution must include all the consumers at once and the possibility of finding the optimal solution decreases when the solution consists of a vector in which the number of possible combinations of valid values (phases assignments) is high.
This paper changes the approach by considering the possibility of decreasing the length of the solution, splitting the optimization into multiple stages in which only a fraction of the consumers is optimized at once. The placement of the consumers on the phases is determined separately on the main feeder and on each branch. The following methods are proposed:
(A)
Consumer phase swap is performed first on each branch separately (the branch–main feeder multistage method).
This case aims to assess to what degree a better balancing of the extremities of the network would contribute to an improved overall solution. When the entire network is used in the optimization, and the vector from Figure 4 is large, it is possible that the algorithm could “miss” solutions where improvements are marginal because an end of a small branch is better optimized but the overall solution is worse because a small number of consumers poorly placed in the main branch are contributing to a higher overall imbalance (a small number of elements from a long vector have non-optimal values).
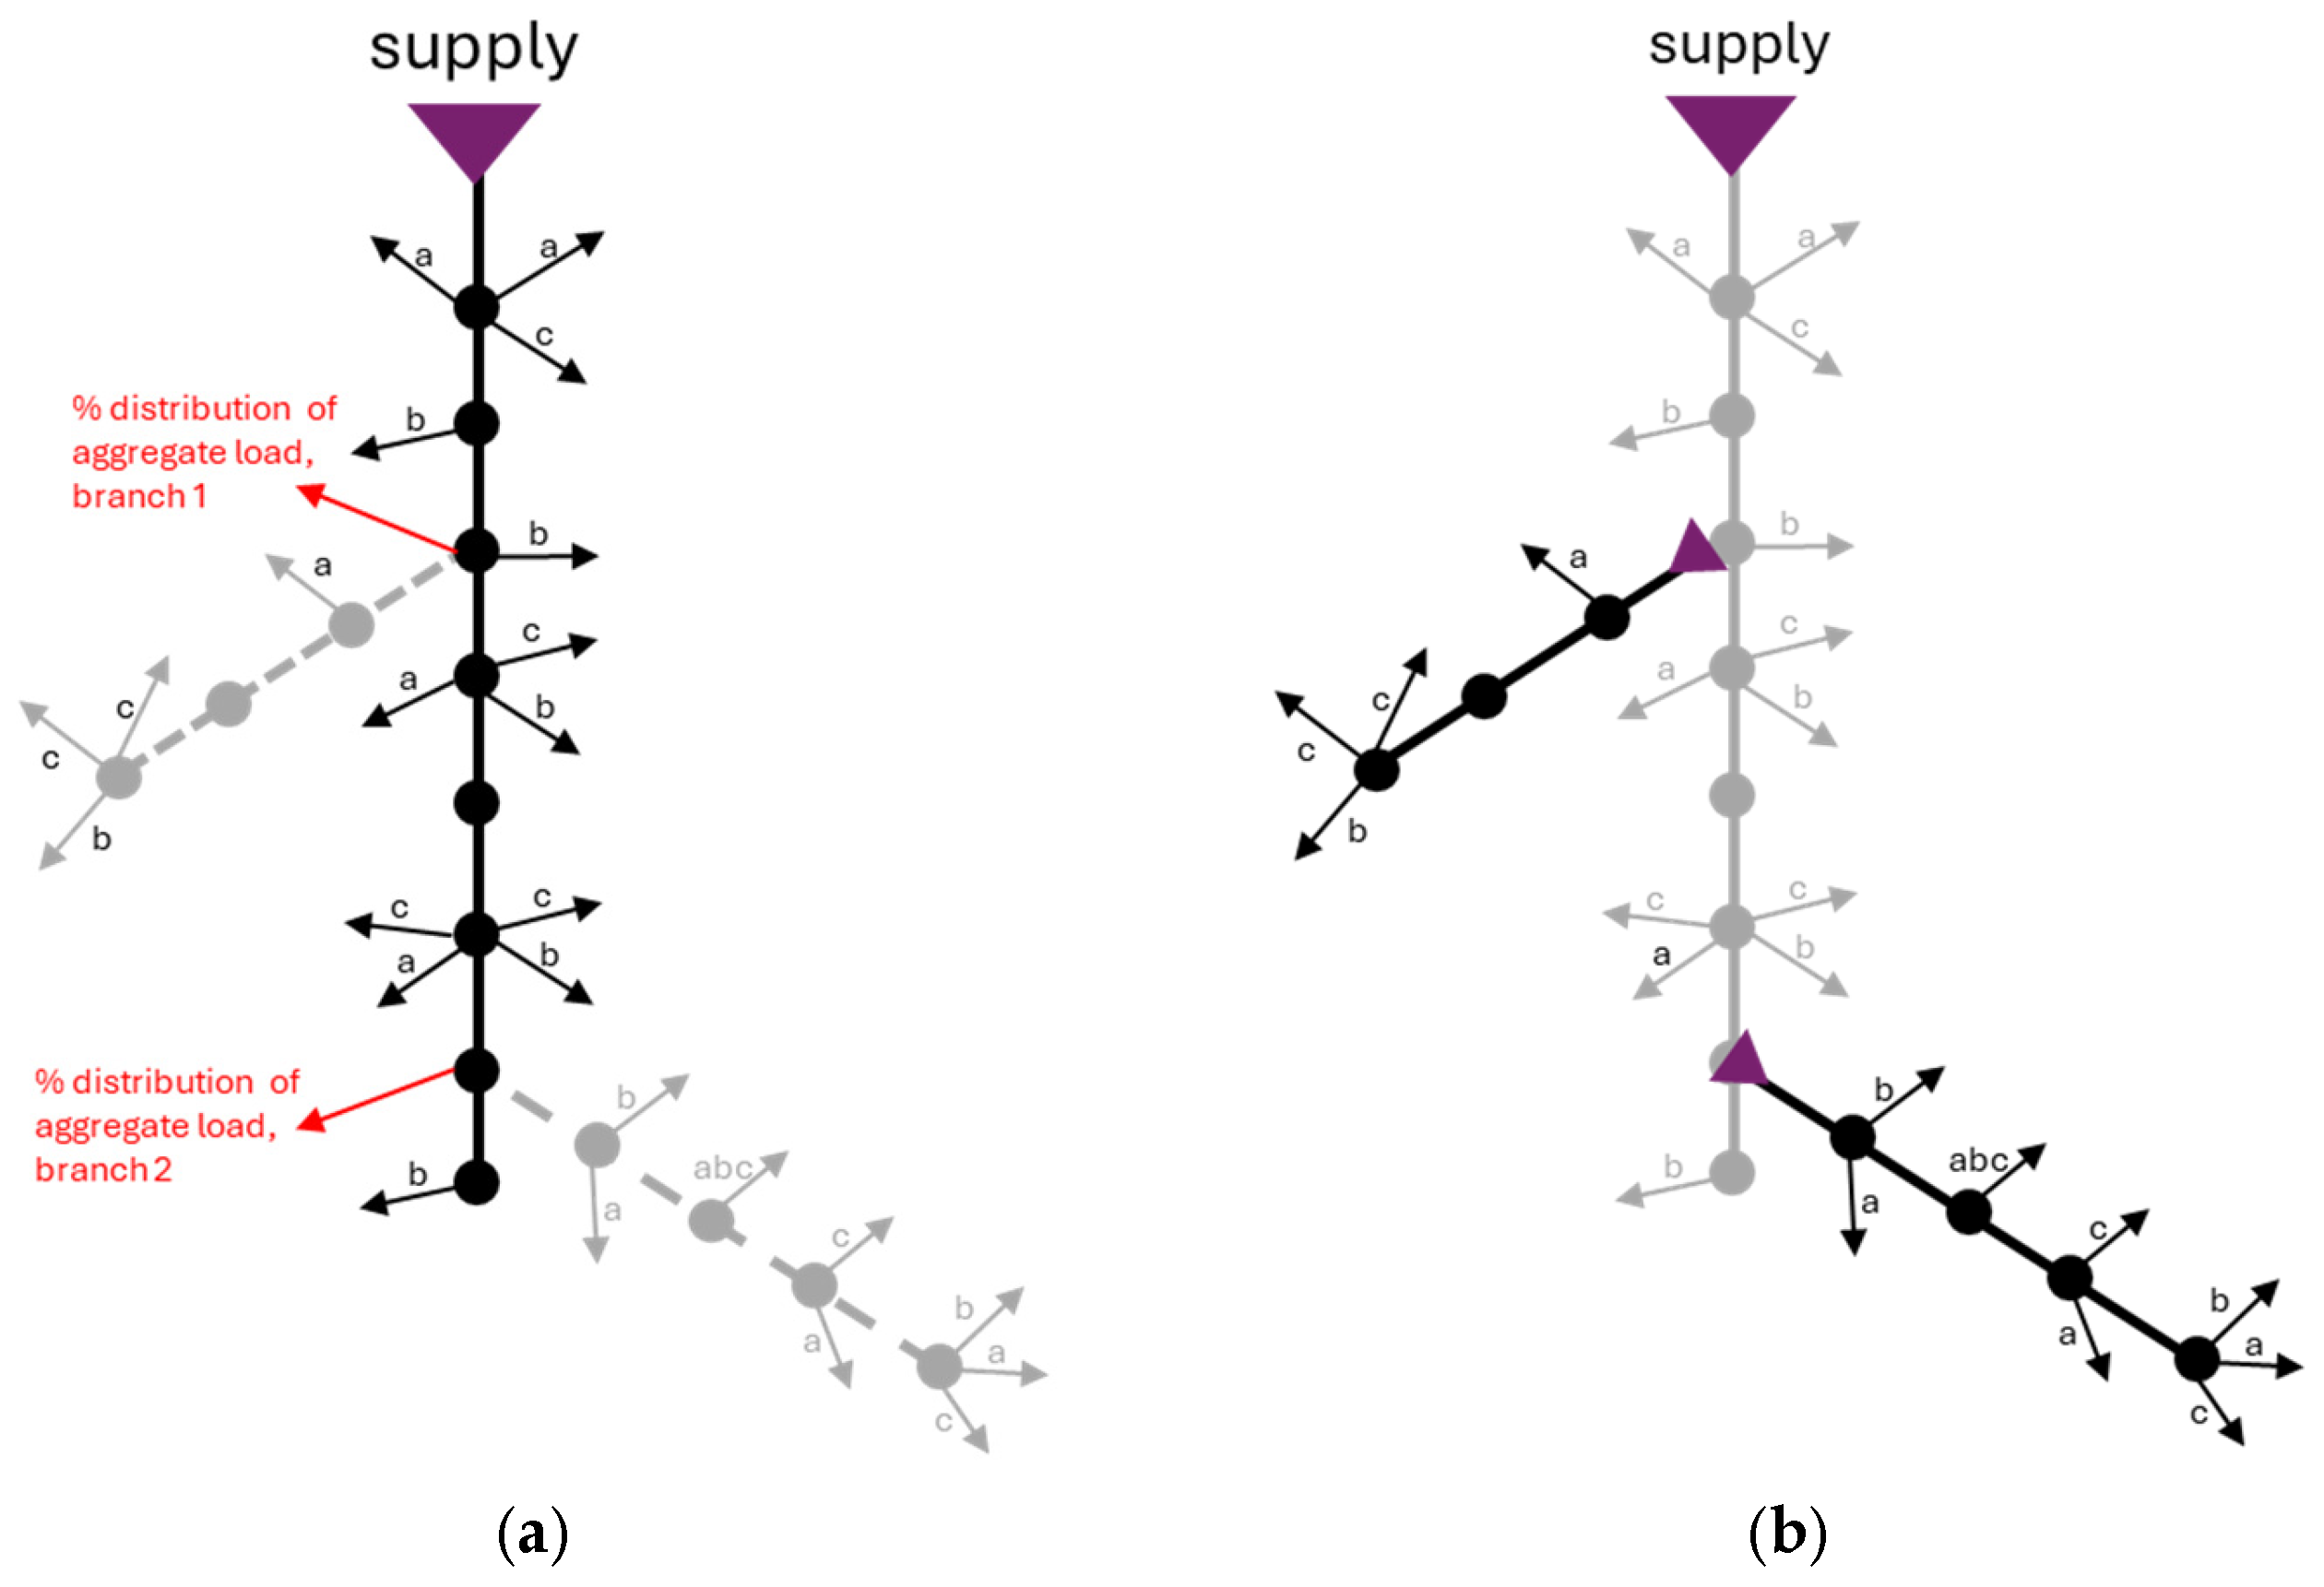
The approach considers first each branch as a separate network, in which the optimization is performed with the objective of minimizing losses, resulting in phase reassignment only for the consumers belonging to the respective branch (Figure 5a). As a result, it is expected that the load on the three phases at the beginning of each branch will result in being as balanced as possible, since this is the behavior observed when the entire network is optimized (balanced phase loads on feeders with the highest loads leads to minimal energy losses).
In the last stage of the algorithm, the phase balancing is performed on the main feeder, where the branches are considered as aggregate phase loads of all consumers from the respective branch plus losses (Figure 5b). A branch is thus modeled as a single, possibly unbalanced three-phase consumer. In this way, the optimization is performed using the same principle as in [34,35].
(B)
Consumer phase swap is performed first on the main feeder (the main feeder–branch multistage method).
In a tree network, the main feeder supports the maximum loading, because it must supply its own consumers and the aggregate load of the branches and the energy required to cover the losses in the entire network. Thus, the current flow at the beginning of this feeder is the maximum, and the contribution of this feeder to the overall losses in the network is the highest. By balancing the load on this feeder first the solution vector becomes smaller, and by optimal phase reassignment of the consumers the best loss reduction can be achieved. In this case, the effect of preferring an optimal load balance on the main feeder, in comparison to the reference optimization or case (A), can be assessed.
This approach first optimizes the losses on the main feeder, chosen by the DNO, followed by optimizing each of the branches, as represented in Figure 6. In the main feeder optimization phase, the contribution of each branch is given as an aggregate load that must be distributed on the three phases (Figure 6a). As results from the main feeder, the algorithm will provide the phase allocation of each consumer and the phase percentage of the total load of each branch at the connection point. Each solution of the type represented in Figure 4 is accompanied in this phase of the algorithm by a second vector, in which for each branch it is given the percentage distribution of the total load on the three phases, using the model from Figure 7. The computation of the fitness function (performance) of each solution requires the decoding of both components.
In the subsequent stages (Figure 6b) on each feeder, the percentage distribution of its total load on the phases is considered as objective when choosing the optimal connection phase for each consumer, together with the minimization of losses, which can be represented as follows:
F O   = h   = 1 n h p h   = 1 3 a b s ( P h , p h , s o l P h , p h , b r a n c h ) / n h
where nh is the number of time intervals used in the analysis; h is the current time interval; ph is phase a, b, or c; Ph,ph,sol is the active power at interval h, on phase ph, according to the optimal solution for a given branch; and Ph,ph,branch is the aggregate active power at time h, on phase ph, for a given branch determined in the main feeder optimization phase.
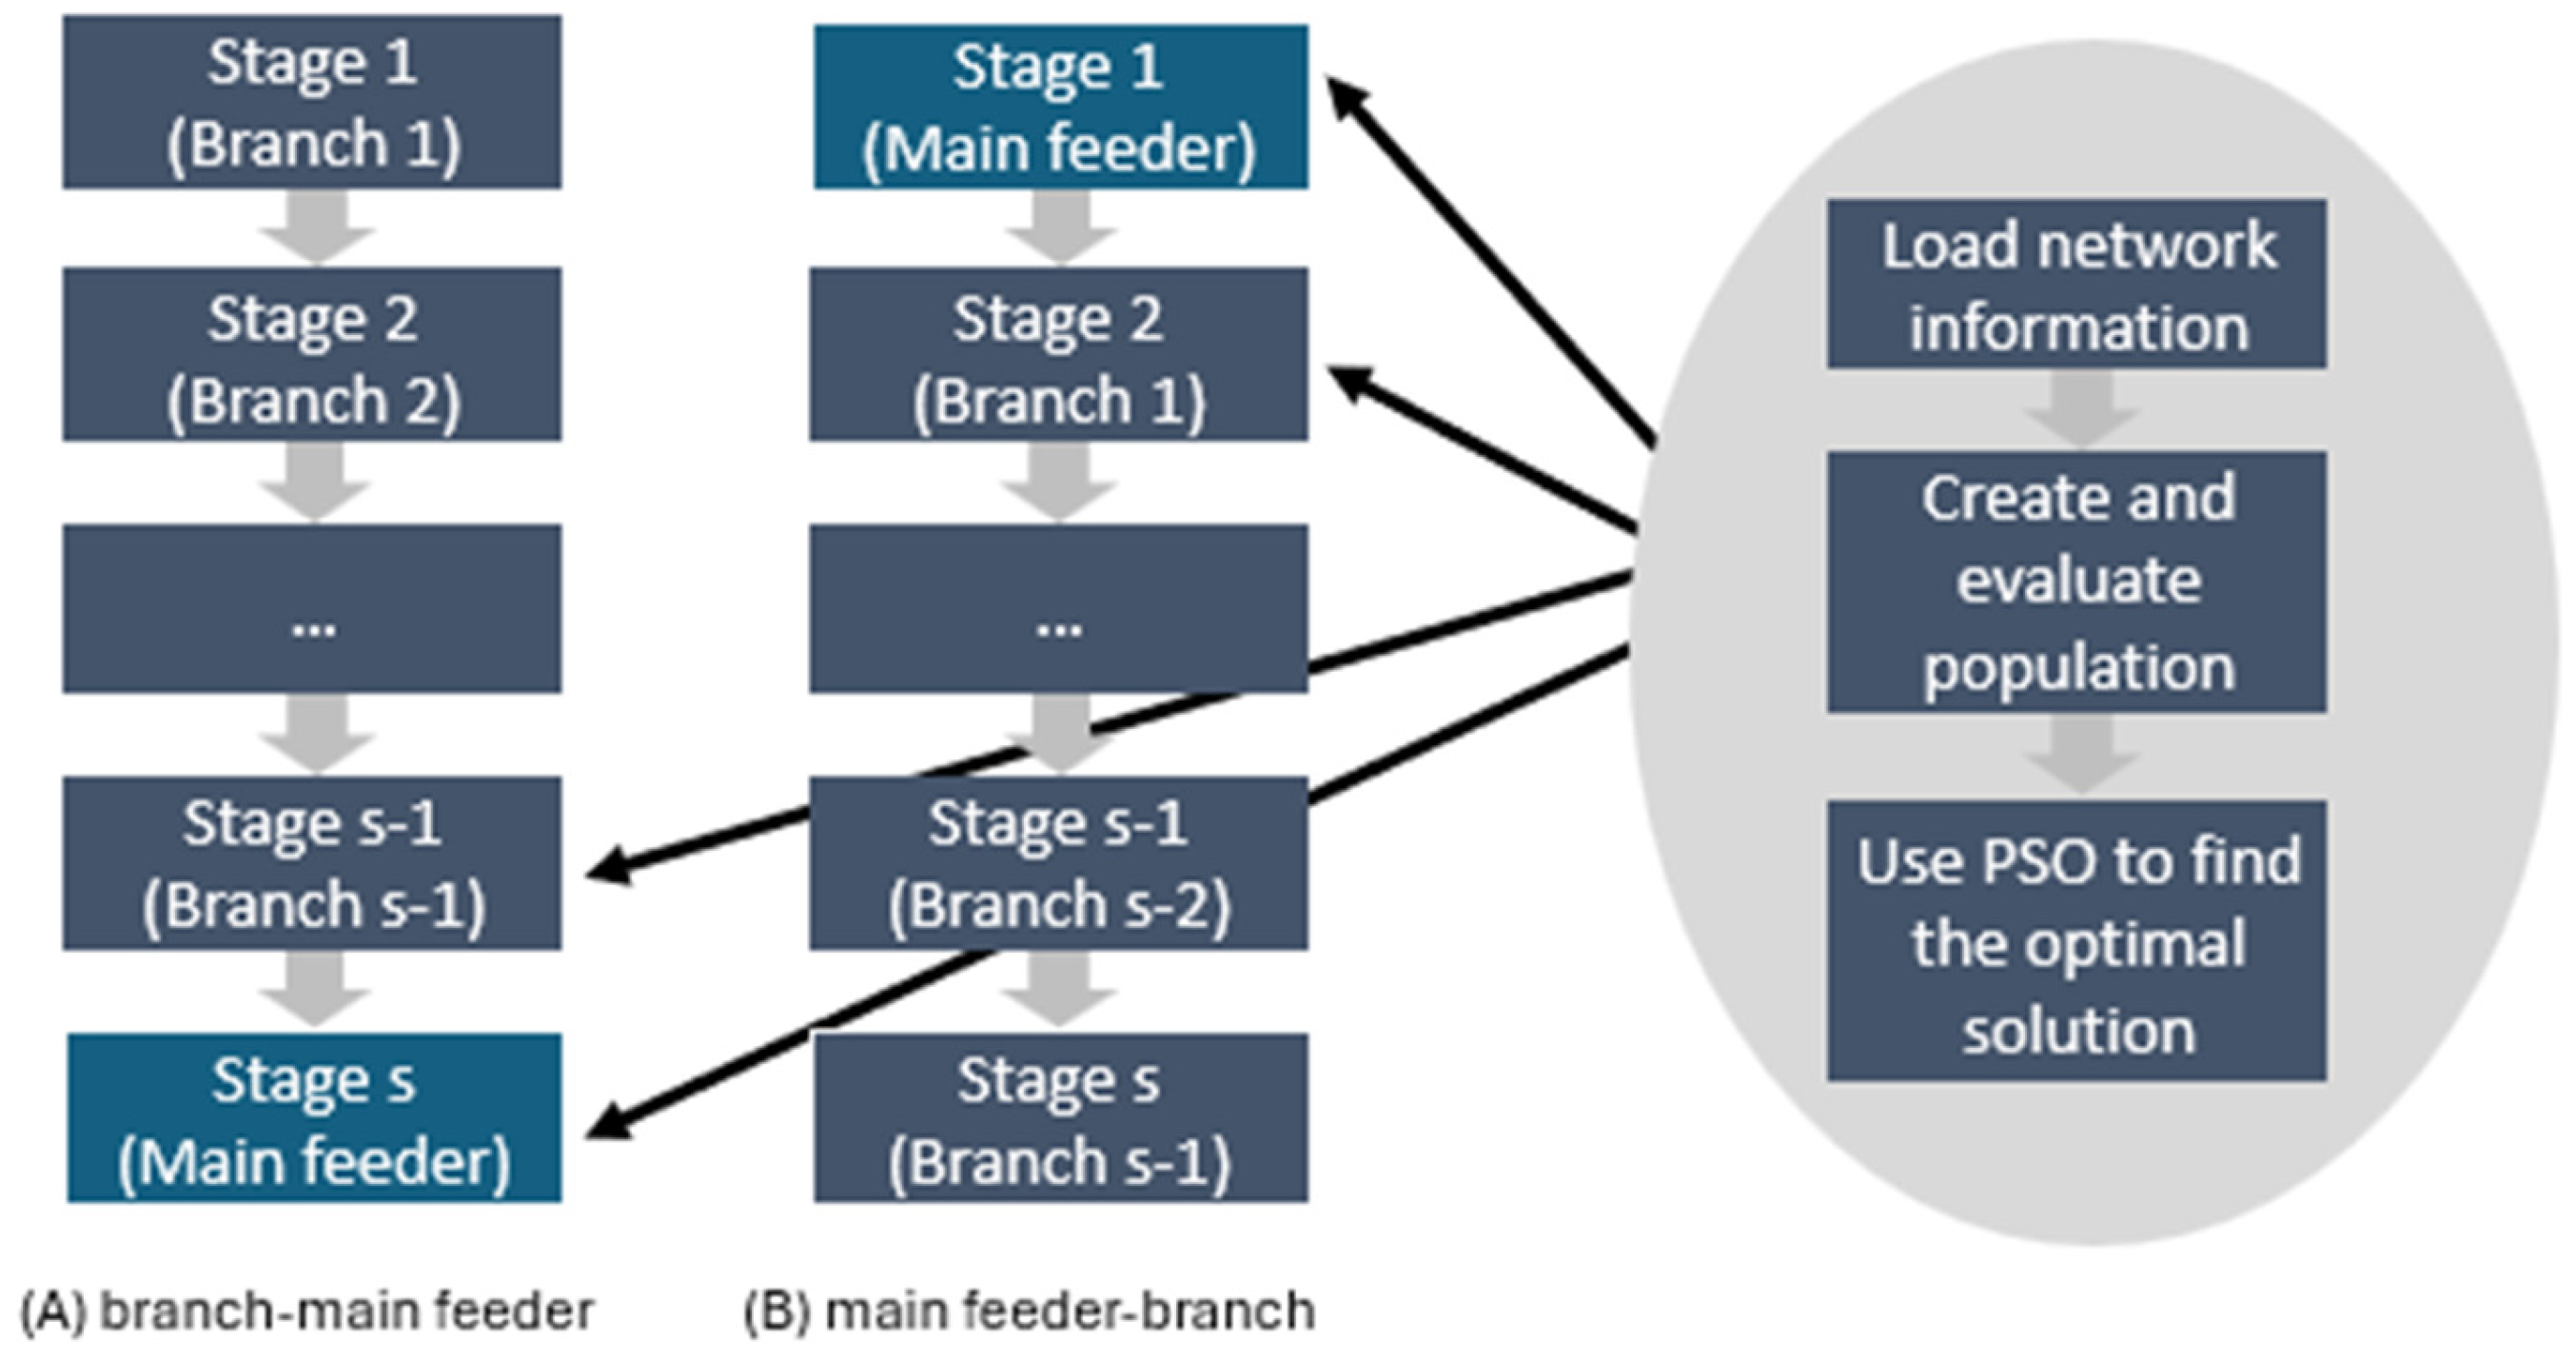
A comparative flowchart of the two multistage methods is presented in Figure 8. The number of stages, denoted with s, is network- and user-dependent, with s-1 stages for the branches and 1 stage for the main feeder. Each stage uses the PSO algorithm to find the optimal phase distribution of consumers. The branch optimization stages can be executed in parallel. The fitness function requires a load-flow computation that determines the losses in the network, using a direct three-phase load-flow algorithm as described in [34,35] that uses graph theory and the branch current imbalance factor (CIF) from Equation (7). The time interval of the analysis is scalable by the user. In accordance with the available data, in this paper H = 24 samples (hours).

3. Results

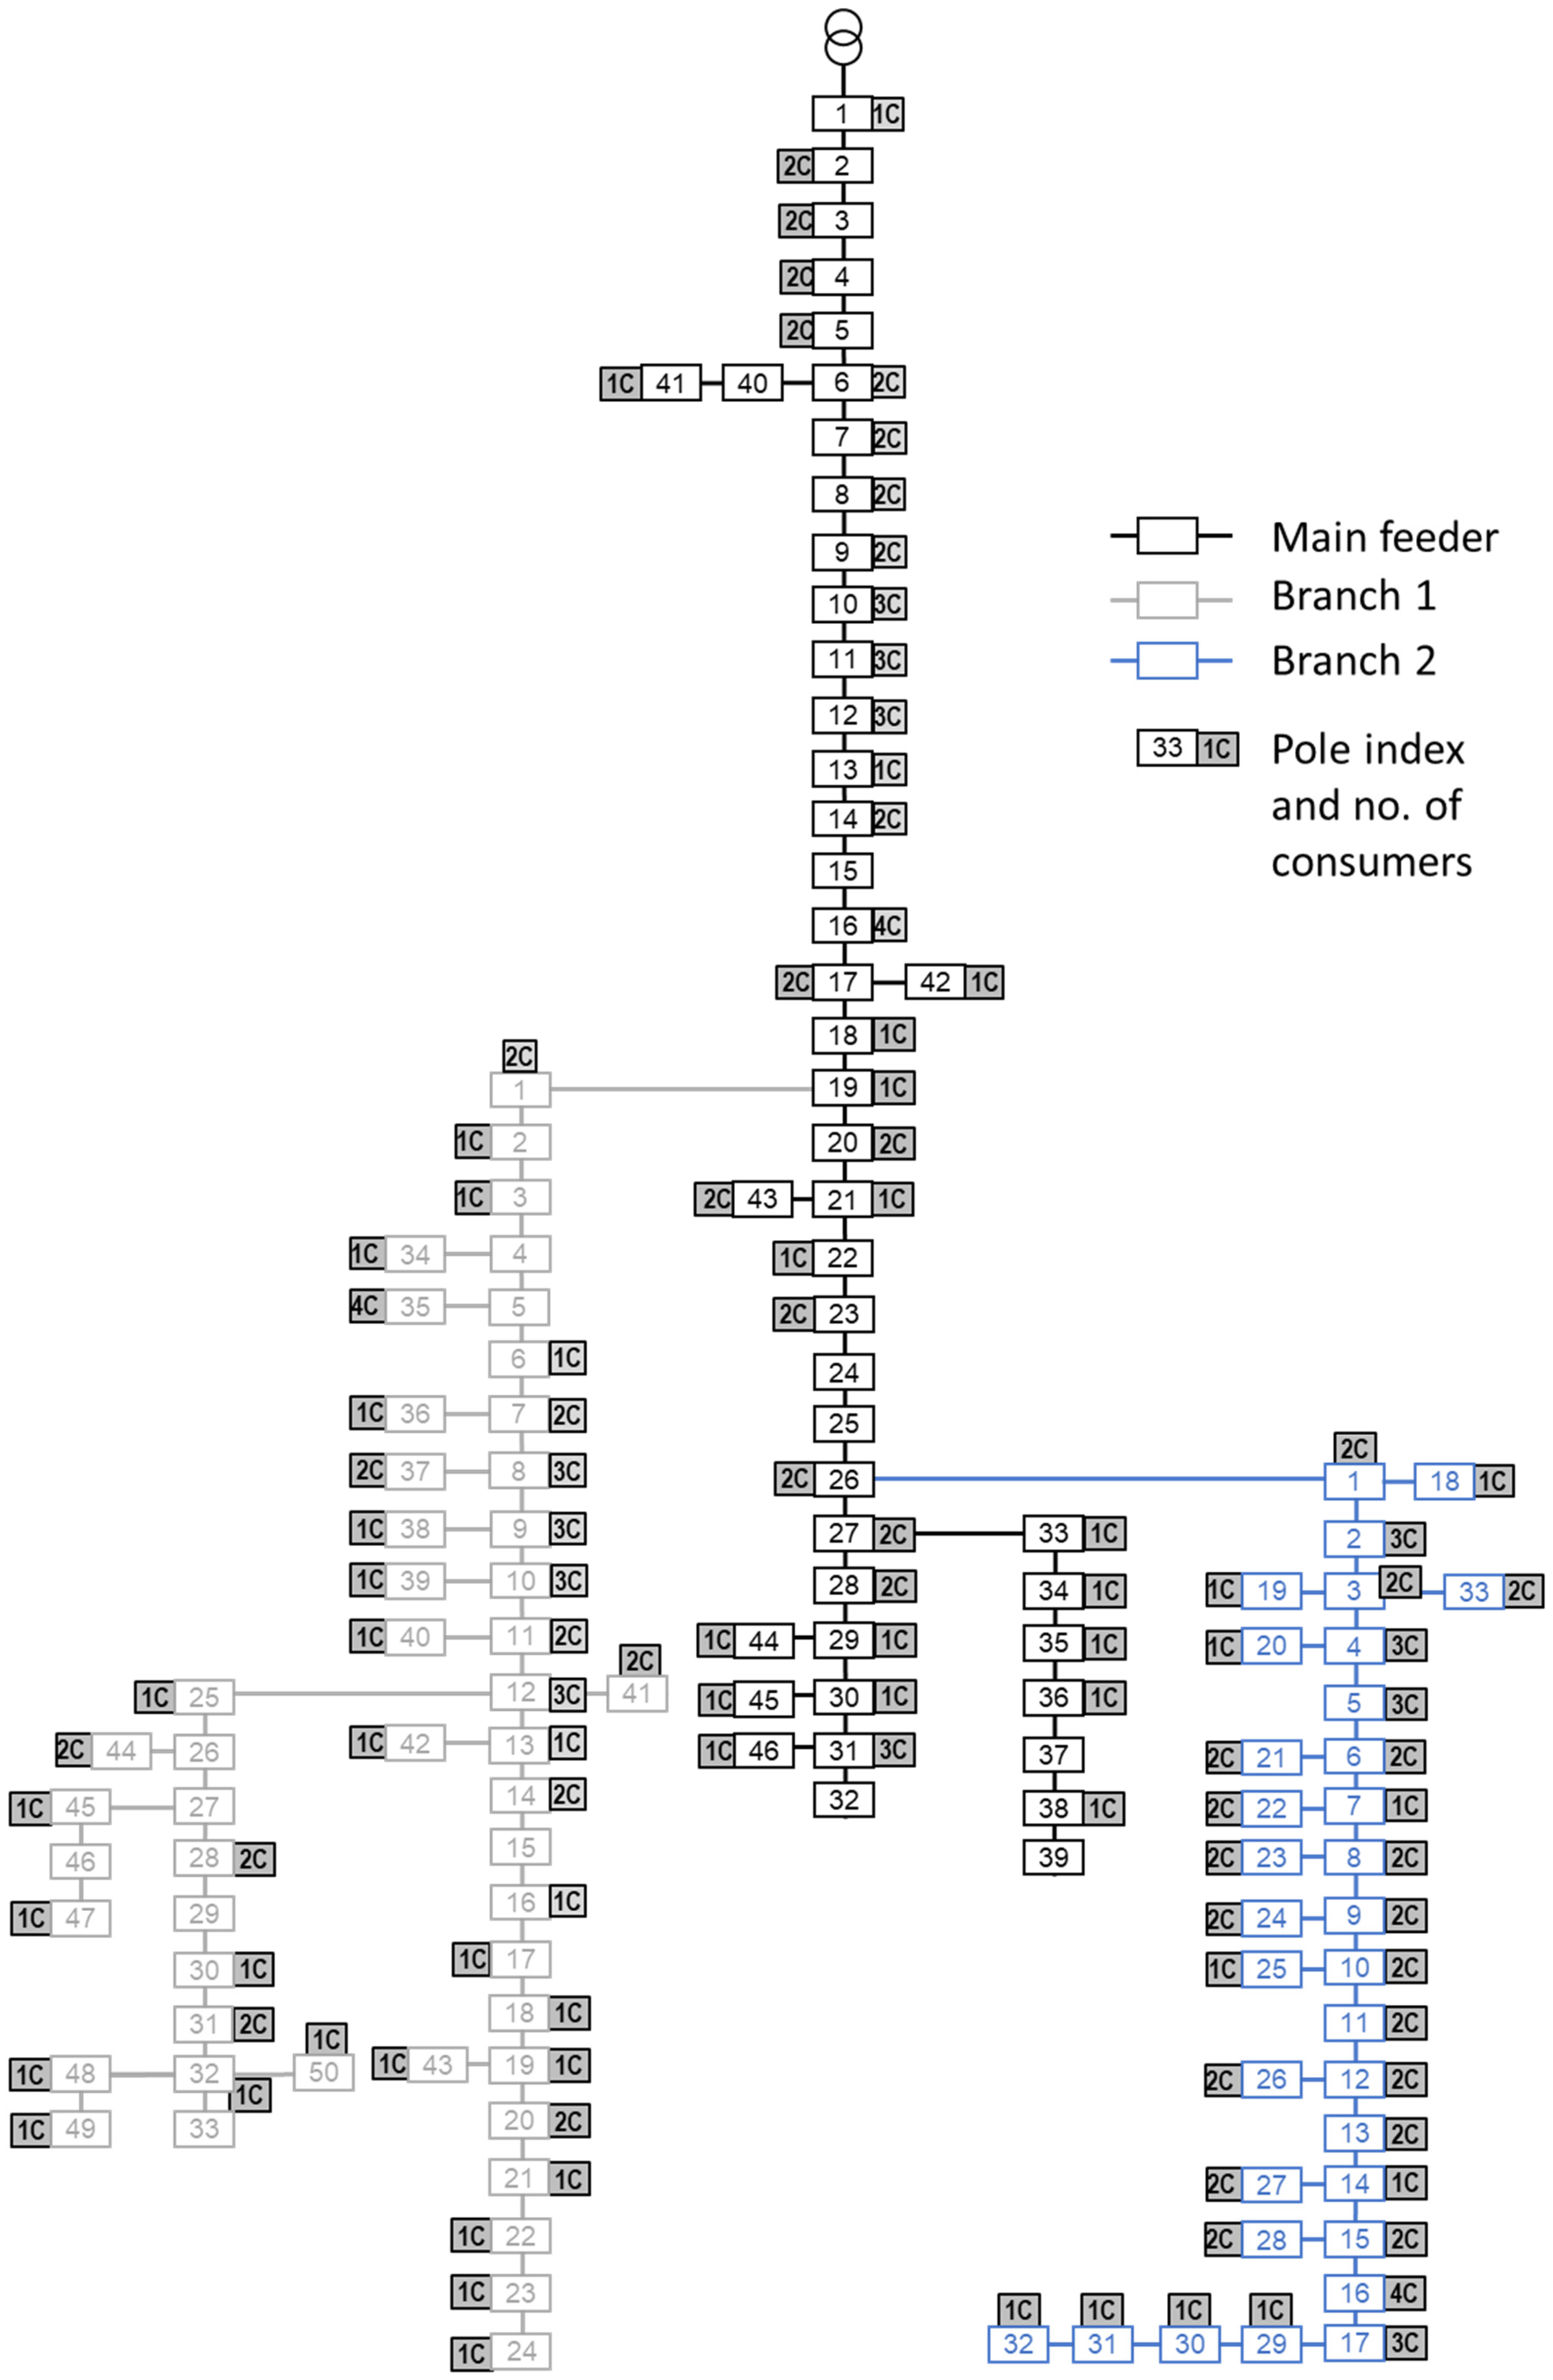
The two multistage methods described above were tested using a real LVDN from northern Romania, which supplies 190 one-phase residential consumers in a rural area. The LVDN was divided into one main feeder and two branches (Figure 9, Table 2). Its total active load over a 24 h interval is 486.89 kWh, and with its default consumer-phase allocation the active energy losses amount to 36.149 kWh (6.91%). The branches and the main feeder have comparable demand (Figure 10, Table 2), but the losses on the main feeder (32.64 kWh) are considerably higher than on the branches (2,8 and 0.73 kWh). Consumers have a demand ranging from 0 to 5 kWh, but 28% have a very low demand of under 0.5 kWh per day. Of the 22 consumers that exceed 5 kWh, 4 have a demand of more than 10 kWh, with 1 peaking at 38 kWh (consumer 48 at pole 26 on the main feeder). More details on the consumer distribution according to their demand can be seen in Table 3 and Figure 11.
If the reference balancing method is used, a solution has a length of 190 elements. The multistage methods split the optimization into processes that use solutions of length 68, 61, and 61 elements, respectively.
The load data from Table 2 shows that consumer demand is unbalanced in the three phases, particularly in the main feeder and branch 1. Each of the optimization methods have the potential to reduce energy losses and improve the operation state of the LVDN. Table 4, Table 5 and Table 6 summarize the results obtained with each optimization method: the reference approach from [34,35] (Table 4), branch–main feeder (A) (Table 5), and main feeder–branch (B) (Table 6).
For the main feeder–branch method (B), the first stage must consider in the input data as mentioned above the aggregate loads of each feeder, which includes the energy demand of the consumers and the losses. Since the real value of the losses is to be determined in the second stage, an estimation was used instead. The most favorable case was chosen with minimal values, which was determined with the previous method branch–main feeder (A).
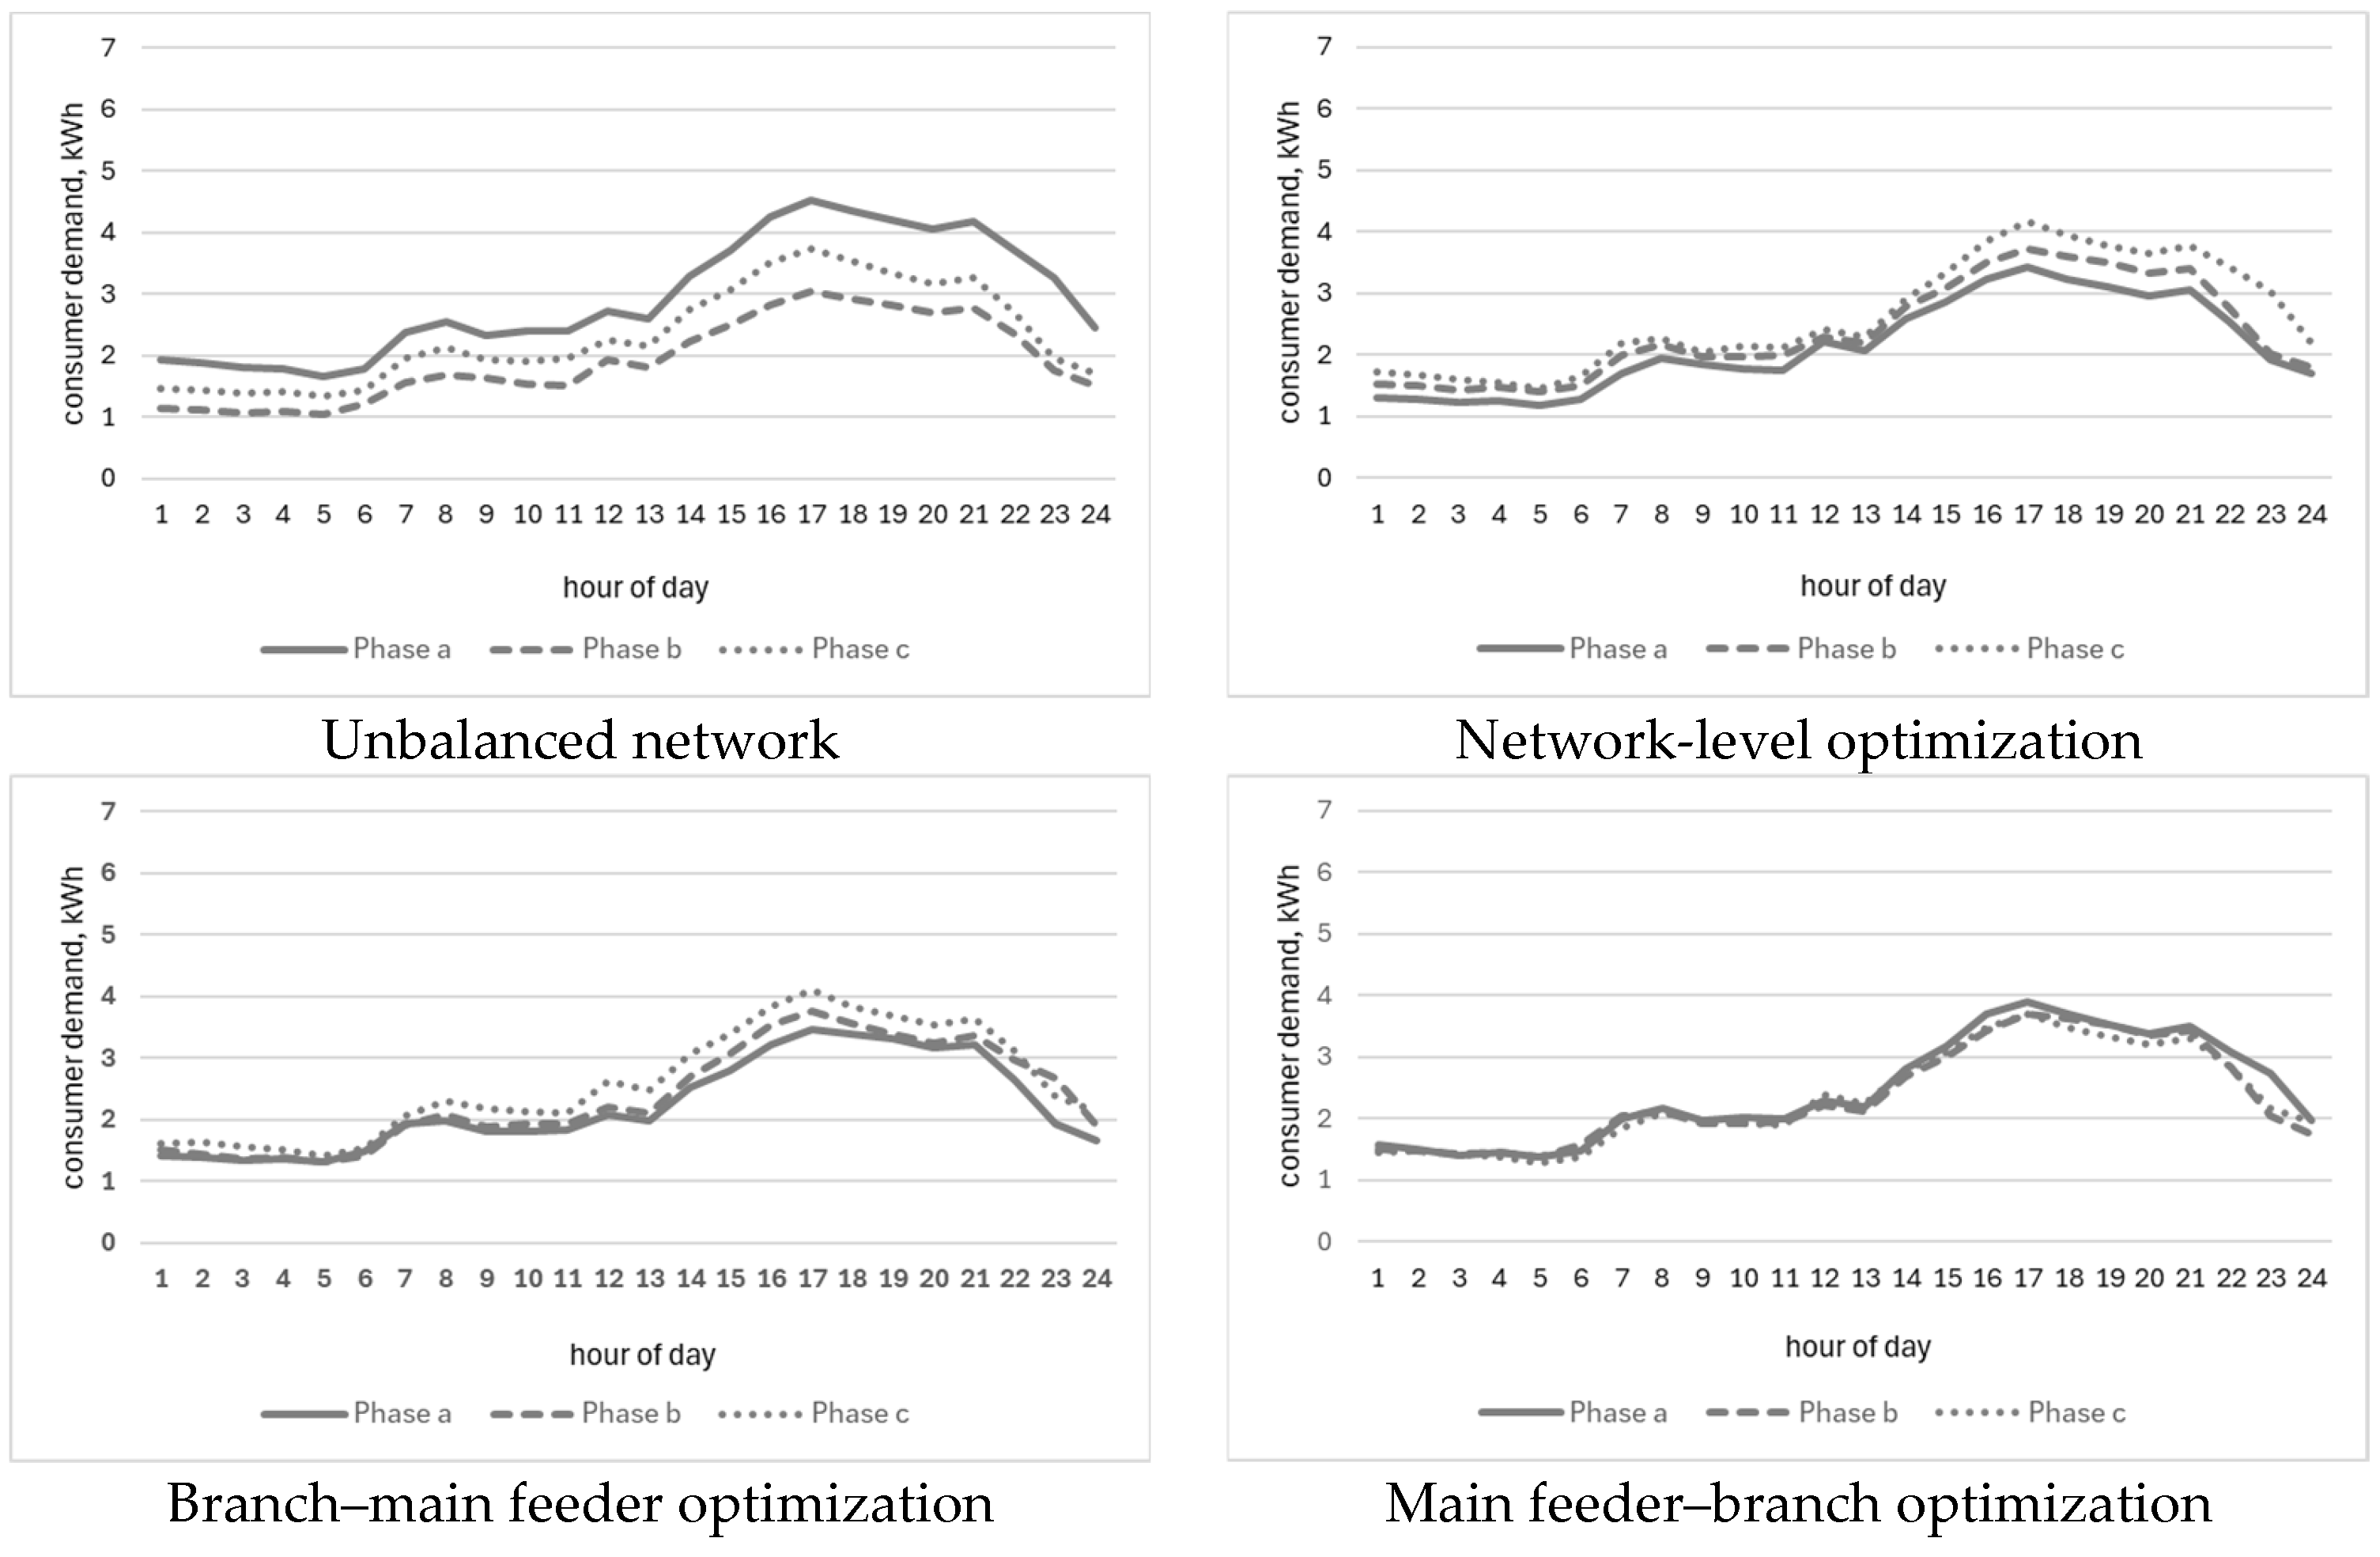
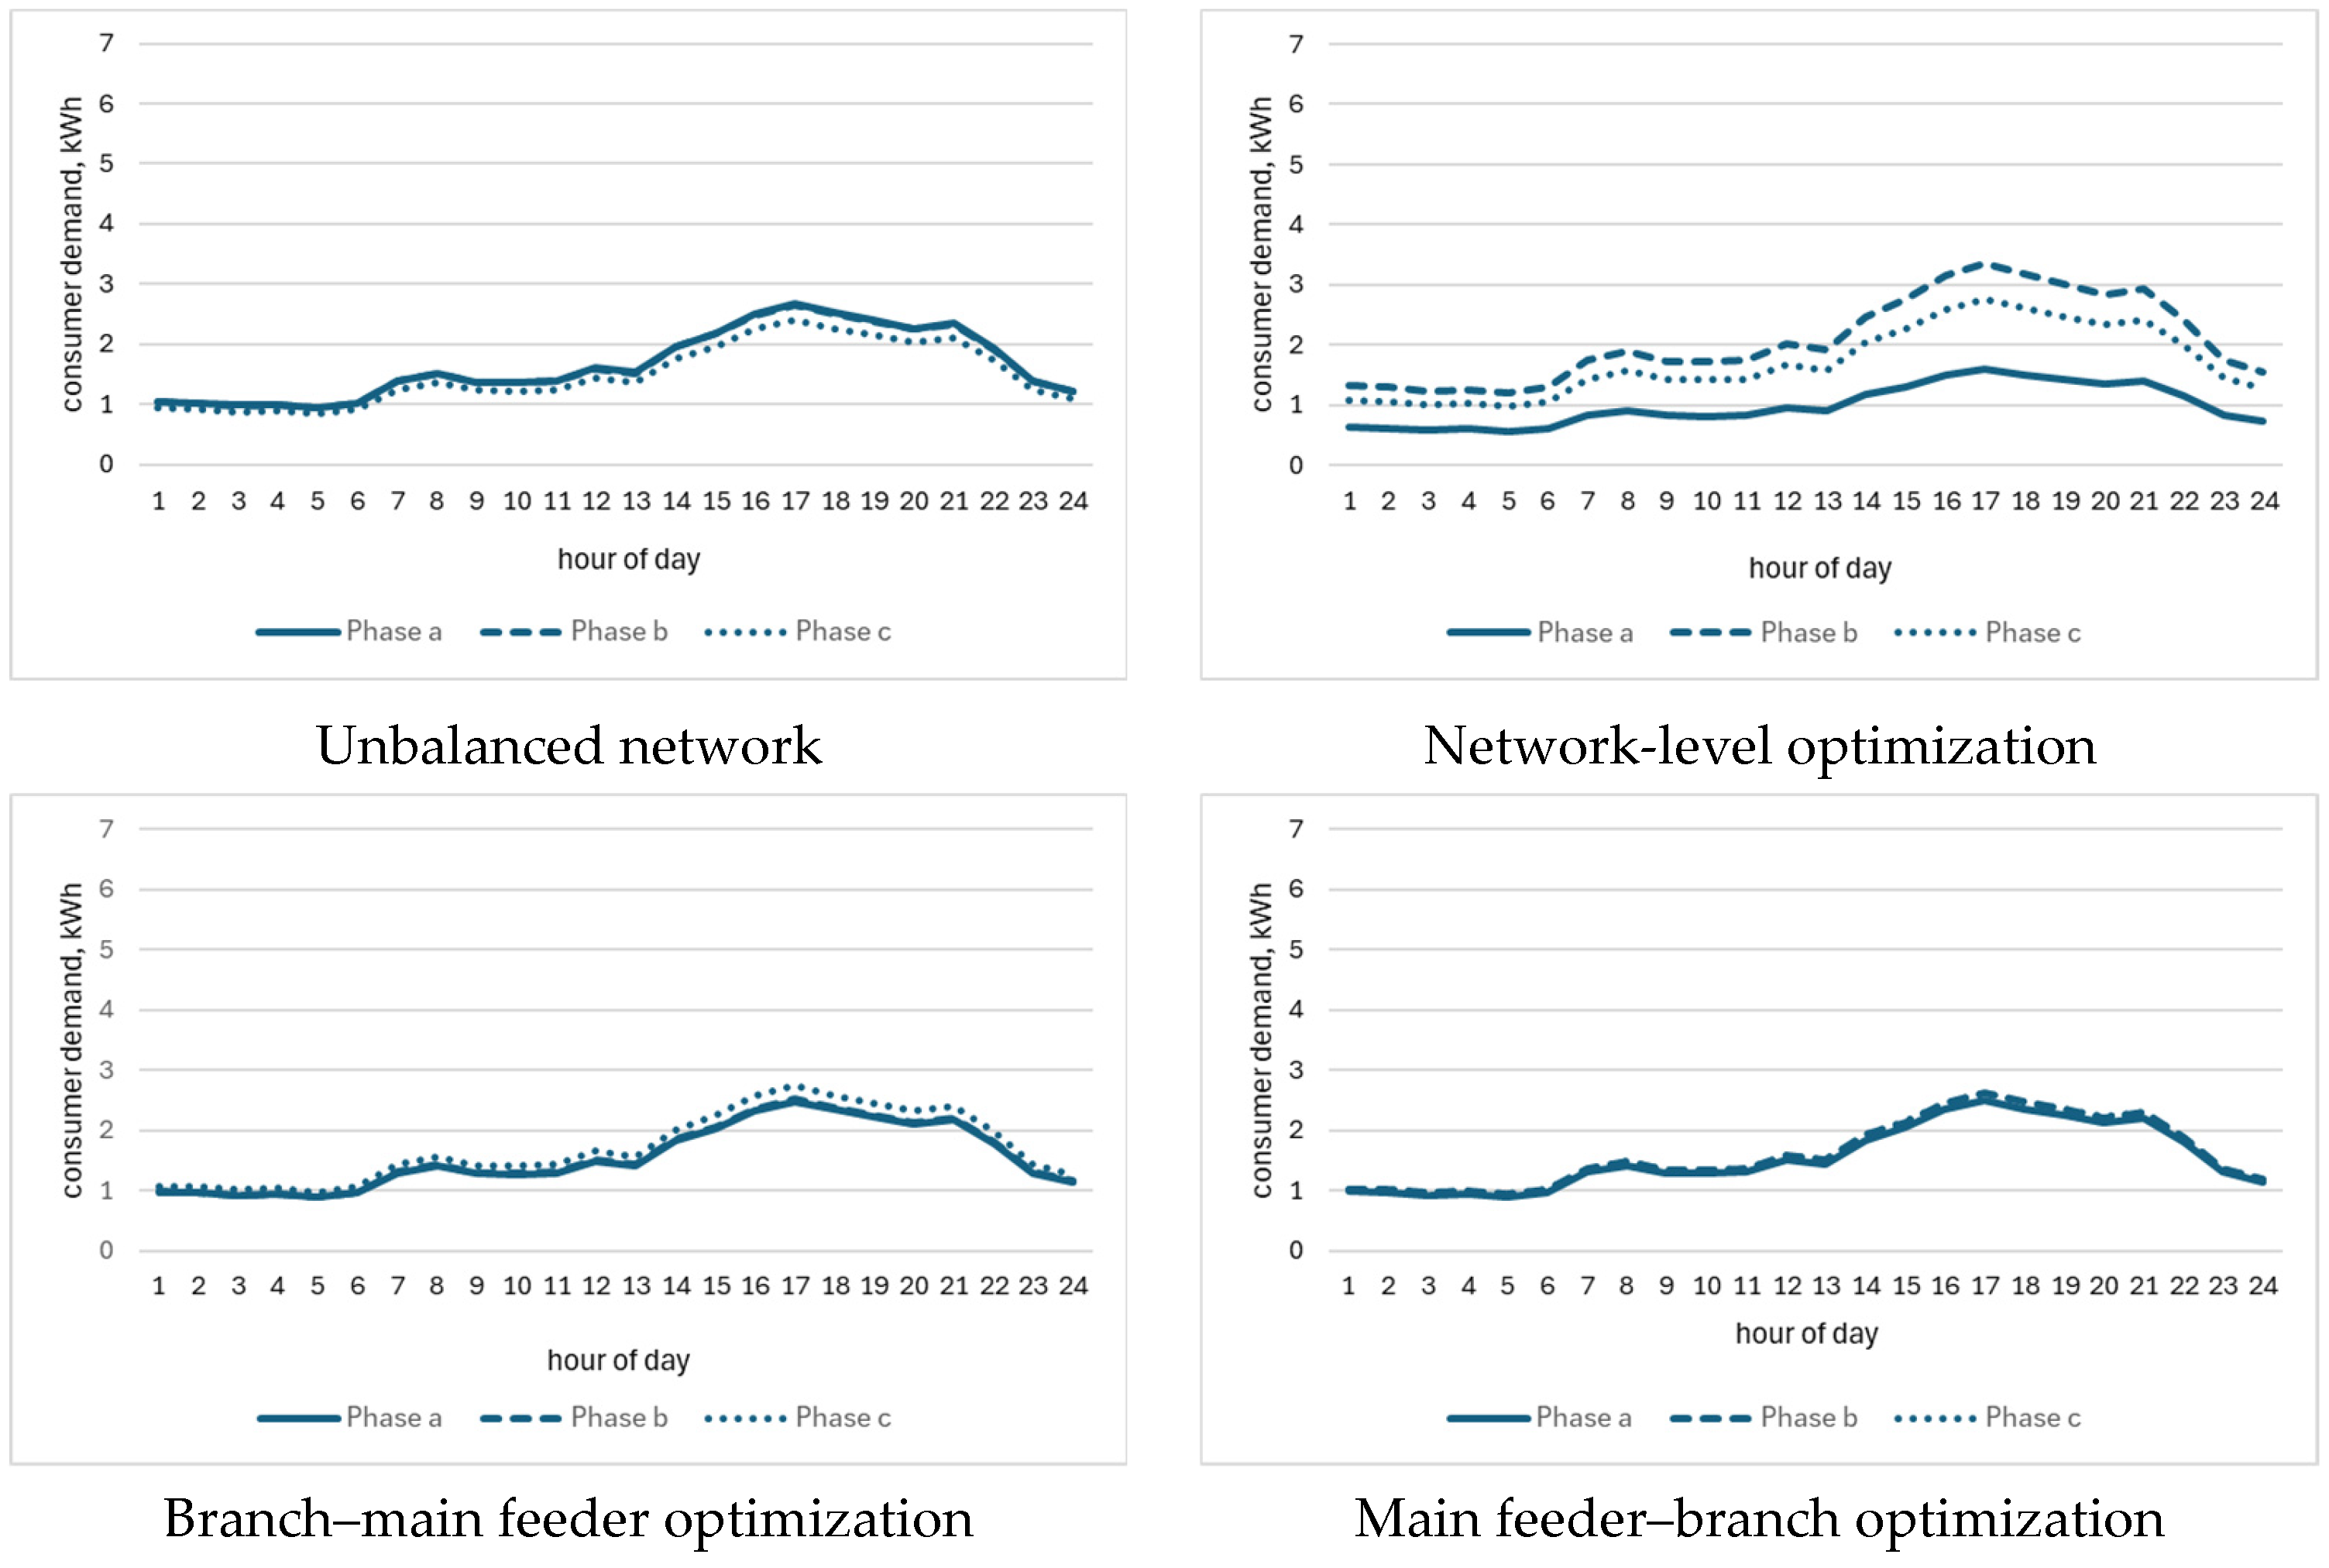
Figure 12, Figure 13, Figure 14 and Figure 15 follow with a comparison of the consumer demand profiles for the three phases and each section of the LVDN. These were obtained using the three optimization methods against the initial case, where the consumer placement on the phases matches the existing situation of the real LVDN (non-optimal consumer-phase distribution). Colors matching those from Figure 9 are used to highlight the results.

4. Discussion

Based on previous work [34,35] in which the authors developed a phase balancing method based on the particle swarm optimization algorithm, this paper proposes another two multistage methods aimed at determining the optimal placement of consumers on the phases to minimize total energy losses in a low-voltage electricity distribution network. The first method (branch–main feeder) considers consumer phase swap based on the minimization of the losses on each branch as separate networks, followed by the optimization of the main feeder; whereas the second method (main feeder–branch) considers consumer phase reassignment based on the minimization of the losses on the main feeder, followed by optimization on each branch.
As shown in the results section, especially in Table 4, Table 5 and Table 6, the proposed methods have different outcomes in terms of consumer phase reassignment. From the perspective of loss minimization, the active energy losses are reduced from 36.025 kWh (6.91%) in the unbalanced network to 32.888 kWh (6.33%) in the balanced network when the referenced network-level method is used. This decrease of approximately 0.58% proves the opportunity for load balancing.
When comparing the multistage methods with the reference network-level method, the active energy losses are comparable, namely 33.037 kWh (+0.4%) and 33.312 kWh (+1.2%) compared to the optimal value of 32.888 kWh. These results show that each of the two methods have good performance in loss minimization, reducing at the same time the complexity of the problem by dividing the network into several sections. The proposed methods lead to a clear reduction in energy losses and a better balance of phase loads, thus improving the operational efficiency of the distribution network.
Nevertheless, if the multistage optimization methods are ranked in comparison to the reference method they lead to slightly higher losses, with better performance being achieved by the branch–main feeder method (A), followed by the main feeder–branch method (B). However, each method unveiled interesting behaviors in the optimization process.
The branch–main feeder method (A) achieved slightly lower losses compared to the main feeder–branch method (B), suggesting that the order of optimization stages can influence the overall performance. The losses obtained on each branch are lower than the same values obtained with the reference network-level optimization—1.845 kWh on branch 1 and 0.557 kWh on branch 2 with method (A) compared to the values of 1.941 and 0.665 kWh obtained with the reference optimization method, an improvement of 4.94% on branch 1 and 16.2% on branch 2—and the phase balancing is improved. However, since the overall result for losses is marginally higher after the contribution of the main feeder, this case shows that there are scenarios where well-balanced branches or network extremities do not lead automatically to lower losses in the entire network. If there are large consumers on the main feeder, as is the case here (consumer 48 from bus 26), a small imbalance on the branches can improve the results on the main feeder, where the majority of losses occur. Thus, method (A) can be preferred if the optimization is limited to only a section of the network.
The main feeder–branch method (B) resulted in inferior results, both in optimizing losses on the main feeder and in the entire network, compared to the reference algorithm. This can be attributed to the fact that it requires the knowledge of estimated energy losses on branches to correctly allocate the consumers to the main feeder and minimize total energy losses. These estimated values must be as accurate as possible, since the differences in optimization results between the three methods are very small and minimal errors can alter the results of the comparison.

5. Conclusions

The proposed multistage optimization methods successfully achieve optimal allocations of consumers on the phases while effectively minimizing energy losses in the LVDN used in the case study. Each proposed method results in a decrease in energy losses and a more balanced distribution of phase loads, thereby enhancing the overall efficiency of operation. Moreover, these methods reduce the complexity of the problem by dividing the network into several sections.
Among the three alternatives, the authors consider that the most suitable method that can be used for optimization depends on the main objective of the problem. Thus, if the main goal is absolute loss minimization, the reference network-level approach is the best choice, with the advantage of absolute loss minimization and the disadvantage of high complexity and long solution vector (the length of the vector is equal to the total number of consumers).
If the optimization is limited to a section of the network, then the branch–main feeder method (A) is the suitable method, with the advantages of (1) dividing the problem into smaller sections and reducing the computation time because of the reduced network used for optimization; (2) the possibility of obtaining lower loss values, with an improvement of 5–15% compared to the case when the entire network is optimized simultaneously.
Since the main feeder–branch method (B) requires an initial estimation of the losses on the branches, and therefore the accuracy of the final optimization results depends on the accuracy of the loss estimation, the main feeder–branch method would be recommended only if the losses on the branches can be accurately estimated and the main feeder is the obvious source of the imbalance and has much higher losses than the branches.

Author Contributions

Conceptualization, O.I.; methodology, O.I., C.-M.N. and G.G.; software, O.I. and G.G.; validation, F.-C.B. and B.-E.Ț.; formal analysis, M.G.; investigation, C.-M.N.; resources, O.I. and B.-E.Ț.; data curation, B.-E.Ț.; writing—original draft preparation, O.I.; writing—review and editing, F.-C.B.; visualization, M.G.; supervision, M.G.; project administration, O.I. All authors have read and agreed to the published version of the manuscript.

Funding

This research received no external funding.

Data Availability Statement

The data presented in this study are available on request from the corresponding author due to confidentiality agreement bindings.

Conflicts of Interest

The authors declare no conflicts of interest.

Abbreviations

The following abbreviations are used in this manuscript:
MVMedium Voltage
LVLow Voltage
DNODistribution Network Operator
LVDNLow Voltage Distribution Network
EVElectric Vehicle
DGDistributed Generation
PLBPhase Load Balancing
PVPhotovoltaic
PSOParticle Swarm Optimization

References

  1. Das, S.R.; Ray, P.K.; Sahoo, A.K.; Ramasubbareddy, S.; Babu, T.S.; Kumar, N.M.; Elavarasan, R.M.; Mihet-Popa, L. A Comprehensive Survey on Different Control Strategies and Applications of Active Power Filters for Power Quality Improvement. Energies 2021, 14, 4589. [Google Scholar] [CrossRef]
  2. Shabalov, M.Y.; Zhukovskiy, Y.L.; Buldysko, A.D.; Gil, B.; Starshaia, V.V. The influence of technological changes in energy efficiency on the infrastructure deterioration in the energy sector. Energy Rep. 2021, 7, 2664–2680. [Google Scholar] [CrossRef]
  3. Gitelman, L.; Magaril, E.; Kozhevnikov, M. Energy security: New threats and solutions. Energies 2023, 16, 2869. [Google Scholar] [CrossRef]
  4. CEER. CEER Report on Power Losses; C17-EQS-80-03; Council of European Energy Regulators: Brussels, Belgium, 2017. [Google Scholar]
  5. Kazymov, I.; Kompaneets, B. Definition of fact and place of losses in low voltage electric networks. In Proceedings of the 2019 International Conference on Industrial Engineering, Applications and Manufacturing (ICIEAM), Sochi, Russia, 25–29 March 2019. [Google Scholar] [CrossRef]
  6. Carr, D.; Thomson, M. Non-technical electricity losses. Energies 2022, 15, 2218. [Google Scholar] [CrossRef]
  7. Diahovchenko, I.; Petrichenko, L. Assessment of energy losses in power distribution systems with individual prosumers and energy communities. J. Eng. 2023, 2023, e12243. [Google Scholar] [CrossRef]
  8. Naumov, I. Additional power losses in low-voltage electrical networks and their influence on people. In Research Paradigms Transformation in Social Sciences; Ardashkin, I.B., Iosifovich, B.V., Martyushev, N.V., Eds.; European Proceedings of Social and Behavioural Sciences; Future Academy: Cairo, Egypt; London, UK, 2018; Volume 50, pp. 844–853. [Google Scholar] [CrossRef]
  9. Matanov, N.; Angelov, I.; Stoev, P. A study of load unbalance on low voltage grid. In Proceedings of the 16th Electrical Engineering Faculty Conference (BulEF), Varna, Bulgaria, 19–22 September 2024. [Google Scholar] [CrossRef]
  10. Reibsch, R.; Blechinger, P.; Kowal, J. The importance of battery storage systems in reducing grid issues in sector-coupled and renewable low-voltage grids. J. Energy Storage 2023, 72, 08726. [Google Scholar] [CrossRef]
  11. Pandraju, T.K.S.; Samal, S.; Saravanakumar, R.; Yaseen, S.M.; Nandal, R.; Dhabliya, D. Advanced metering infrastructure for low voltage distribution system in smart grid based monitoring applications. Sustain. Comput. Inform. Syst. 2022, 35, 100691. [Google Scholar] [CrossRef]
  12. Gatta, F.M.; Geri, A.; Maccioni, M.; Palazzoli, A.; Sancioni, P. Low voltage electric distribution network planning with demand control. Electr. Power Syst. Res. 2024, 226, 109950. [Google Scholar] [CrossRef]
  13. Ahmadi Kamarposhti, M.; Ghandour, R.; Abdel-Aty, M.; Hafez, M.; Alfiras, M.; Alkhazaleh, S.; Colak, I.; Solyman, A. Optimizing capacitor bank placement in distribution networks using a multi-objective particle swarm optimization approach for energy efficiency and cost reduction. Sci. Rep. 2025, 15, 12332. [Google Scholar] [CrossRef]
  14. Musaruddin, M.; Tambi, T.; Zulkaidah, W.; Masikki, G.A.N.; Lolok, A.; Djohar, A.; Marwan, M. Optimizing network reconfiguration to reduce power loss and improve the voltage profile in the distribution system: A practical case study. E-Prime-Adv. Electr. Eng. Electron. Energy 2024, 8, 100599. [Google Scholar] [CrossRef]
  15. Werkie, Y.G.; Kefale, H.A. Optimal allocation of multiple distributed generation units in power distribution networks for voltage profile improvement and power losses minimization. Cogent Eng. 2022, 9, 2091668. [Google Scholar] [CrossRef]
  16. Guerrero, J.; Sok, B.; Chapman, A.C.; Verbič, G. Electrical-distance driven peer-to-peer energy trading in a low-voltage network. Appl. Energy 2021, 287, 116598. [Google Scholar] [CrossRef]
  17. Shaheen, A.M.; Elattar, E.E.; Nagem, N.A.; Nasef, A.F. Allocation of PV systems with Volt/Var control based on automatic voltage regulators in active distribution networks. Sustainability 2023, 15, 15634. [Google Scholar] [CrossRef]
  18. Wu, X.; Yang, C.; Han, G.; Ye, Z.; Hu, Y. Energy loss reduction for distribution networks with energy storage systems via loss sensitive factor method. Energies 2022, 15, 5453. [Google Scholar] [CrossRef]
  19. Sadat, S.M.; Shourkaei, H.M.; Soleymani, S. Electrical vehicles impact on unbalanced distribution networks considering different loads and energy prices. Heliyon 2024, 10, e39233. [Google Scholar] [CrossRef]
  20. Grammenou, C.V.; Dragatsika, M.; Bouhouras, A.S. Optimal EV charging and PV siting in prosumers towards loss reduction and voltage profile improvement in distribution networks. World Electr. Veh. J. 2024, 15, 462. [Google Scholar] [CrossRef]
  21. Heidari-Akhijahani, A.; Safdarian, A.; Aminifar, F. Phase identification of single-phase customers and PV panels via smart meter data. IEEE Trans. Smart Grid 2021, 12, 4543–4552. [Google Scholar] [CrossRef]
  22. Routray, A.; Mistry, K.D.; Arya, S.R.; Chittibabu, B. Applied machine learning in wind speed prediction and loss minimization in unbalanced radial distribution system. Energy Sources Part A Recovery Util. Environ. Eff. 2025, 47, 3790–3810. [Google Scholar] [CrossRef]
  23. Ghatak, S.R.; Sannigrahi, S.; Acharjee, P. Multiobjective framework for optimal integration of solar energy source in three-phase unbalanced distribution network. IEEE Trans. Ind. Appl. 2020, 56, 3068–3078. [Google Scholar] [CrossRef]
  24. Fang, L.; Ma, K.; Zhang, Z. A statistical methodology to identify imbalance-induced capacity wastes for LV networks. Electr. Power Syst. Res. 2021, 199, 107388. [Google Scholar] [CrossRef]
  25. Blasco, P.A.; Montoya-Mira, R.; Diez, J.M.; Montoya, R. Algorithm for passive reactive power compensation of an unbalanced three-phase four-wire system using capacitors ensuring minimum line losses. Electr. Power Syst. Res. 2024, 227, 109972. [Google Scholar] [CrossRef]
  26. Fernão Pires, V.; Cordeiro, A.; Foito, D.; José Pires, A.; Hao, C.; Francisco Martins, J.; Castro, R. Compensation of unbalanced low-voltage grids using a photovoltaic generation system with a dual four-leg, two-level inverter. Electronics 2022, 11, 320. [Google Scholar] [CrossRef]
  27. Rao, B.V.; Stefan, M.; Schwalbe, R.; Karl, R.; Kupzog, F.; Kozek, M. Stratified control applied to a three-phase unbalanced low voltage distribution grid in a local peer-to-peer energy community. Energies 2021, 14, 3290. [Google Scholar] [CrossRef]
  28. Pinthurat, W.; Hredzak, B. Multi-agent deep reinforcement learning for mitigation of unbalanced active powers using distributed batteries in low voltage residential distribution system. Electr. Power Syst. Res. 2025, 245, 111599. [Google Scholar] [CrossRef]
  29. Zhou, F.; Chen, X.D.; Shi, H.R.; Yang, C.; Zhou, S.Q.; Hao, T. Research on three-phase unbalance control of low-voltage distribution network based on load commutation. J. Electr. Eng. Technol. 2024, 19, 4027–4043. [Google Scholar] [CrossRef]
  30. Jimenez, V.A.; Will, A.L.E.; Lizondo, D.F. Phase reassignment for load balance in low-voltage distribution networks. Int. J. Electr. Power Energy Syst. 2022, 137, 107691. [Google Scholar] [CrossRef]
  31. Feng, Q.; Xia, Y.; Yang, P.; Wei, W. Unbalance compensation for PV-dominated 3P-4W distribution networks. IEEE Trans. Power Deliv. 2024, 39, 1983–1996. [Google Scholar] [CrossRef]
  32. Ji, B.-X.; Liu, H.-H.; Cheng, P.; Ren, X.-Y.; Pi, H.-D.; Li, L.-L. Phased optimization of active distribution networks incorporating distributed photovoltaic storage system: A multi-objective coati optimization algorithm. J. Energy Storage 2024, 91, 112093. [Google Scholar] [CrossRef]
  33. Ibrahim, I.A.; Hossain, M.J. Low voltage distribution networks modeling and unbalanced (optimal) power flow: A comprehensive review. IEEE Access 2021, 9, 143026–143084. [Google Scholar] [CrossRef]
  34. Toma, N.; Ivanov, O.; Neagu, B.; Gavrilas, M. A PSO algorithm for phase load balancing in low voltage distribution networks. In Proceedings of the 2018 International Conference and Exposition on Electrical And Power Engineering (EPE), Iasi, Romania, 18–19 October 2018. [Google Scholar] [CrossRef]
  35. Ivanov, O.; Neagu, B.C.; Gavrilas, M.; Grigoras, G.; Sfintes, C.V. Phase load balancing in low voltage distribution networks using metaheuristic algorithms. In Proceedings of the 2019 International Conference on Electromechanical and Energy Systems (SIELMEN), Craiova, Romania, 9–11 October 2019. [Google Scholar] [CrossRef]
  36. Zhong, K.; Tang, Y.; Zhang, S.; Zhang, Y.; Deng, W. A predictive rolling optimization method of load balancing in low-voltage active distribution network. In Proceedings of the 2021 IEEE 5th Conference on Energy Internet and Energy System Integration (EI2), Taiyuan, China, 22–24 October 2021. [Google Scholar] [CrossRef]
  37. Liu, B.; Meng, K.; Dong, Z.Y.; Wong, P.K.C.; Li, X. Load balancing in low-voltage distribution network via phase reconfiguration: An efficient sensitivity-based approach. IEEE Trans. Power Deliv. 2020, 36, 2174–2185. [Google Scholar] [CrossRef]
  38. Xiao, M.; Wang, S.; Ullah, Z. D-PMU and 5G-Network-Based Coordination Control Method for Three-Phase Imbalance Mitigation Units in the LVDN. Energies 2021, 14, 2754. [Google Scholar] [CrossRef]
  39. Yanghua, L.I.U.; Shunjiang, L.I.N. Optimal allocation of distributed reactive power compensation for low voltage distribution network considering pump loads’ characteristics. In Proceedings of the 2018 International Conference on Power System Technology (POWERCON), Guangzhou, China, 6–8 November 2018. [Google Scholar] [CrossRef]
  40. Majeed, A.A.; Abderrahim, M.; Alkhazraji, A.A. Optimal allocation of photovoltaic-green distributed generation for maximizing the performance of electrical distribution networks. Energies 2024, 17, 1376. [Google Scholar] [CrossRef]
  41. Rahman, M.M.; Arefi, A.; Shafiullah, G.M.; Hettiwatte, S. A new approach to voltage management in unbalanced low voltage networks using demand response and OLTC considering consumer preference. Int. J. Electr. Power Energy Syst. 2018, 99, 11–27. [Google Scholar] [CrossRef]
  42. Grigoraș, G.; Noroc, L.; Chelaru, E.; Scarlatache, F.; Neagu, B.-C.; Ivanov, O.; Gavrilaș, M. Coordinated control of single-phase end-users for phase load balancing in active electric distribution networks. Mathematics 2021, 9, 2662. [Google Scholar] [CrossRef]
  43. Toader, C.; Porumb, R.; Bulac, C.; Tristiu, I. A perspective on current unbalance in low voltage distribution networks. In Proceedings of the 2015 9th International Symposium on Advanced Topics in Electrical Engineering (ATEE), Bucharest, Romania, 7–9 May 2015. [Google Scholar] [CrossRef]
  44. Nour, A.M.; Helal, A.A.; El-Saadawi, M.M.; Hatata, A.Y. Voltage imbalance mitigation in an active distribution network using decentralized current control. Prot. Control Mod. Power Syst. 2023, 8, 20. [Google Scholar] [CrossRef]
  45. Calin. Single Phase STS Prepaid Meter. Available online: https://www.prepayment-meter.com/supplier-109289-sts-prepaid-meters (accessed on 27 August 2025).
  46. Londian. Smart Prepaid Meter. Available online: https://londianglobal.com/product-category/prepaid-electricity-meter (accessed on 27 August 2025).
  47. Novatek-Electro. Universal Automatic Electronic Phase Switch Pef-319. Available online: https://novatek-electro.in/pef-319/ (accessed on 27 August 2025).
  48. Yongxia, L.; Yulei, G. Design of three phase load unbalance automatic regulating system for low voltage power distribution grids. In Proceedings of the 2018 International Conference on Smart Materials, Intelligent Manufacturing and Automation (SMIMA 2018), Nanjing, China, 24–26 May 2018; Volume 173, p. 02040. [Google Scholar] [CrossRef]
  49. Haq, S.U.; Arif, B.; Khan, A.; Ahmed, J. Automatic three phase load balancing system by using fast switching relay in three phase distribution system. In Proceedings of the 1st International Conference on Power, Energy and Smart Grid (ICPESG), Mirpur, Pakistan, 9–10 April 2018. [Google Scholar] [CrossRef]
  50. Iyappan, M.; Karpagam, M.; Raviram, P. Automatic load sharing in industrial plant with monitoring system using microcontroller. Int. J. App. Eng. Res. 2015, 10, 114–120. [Google Scholar]
  51. Ofualagba, G.; Udoha, E.E. Design and simulation of automatic phase selector and changeover switch for 3-phase supply. Int. J. Nov. Res. Electr. Mech. Eng. 2017, 4, 28–35. [Google Scholar]
  52. Rashid, A.T.; Rashid, M.T. Design and implementation of load balancing system for a smart home. In Proceedings of the International Scientific Conference for Renewable Energy (ISCRE’ 2018), Basrah, Iraq, 14–15March 2018; pp. 1–6. [Google Scholar]
  53. Shakeel, M.O.B.; Jaffar, S.A.; Ali, M.F.; Zaidi, S.S. LV three phase automatic load balancing system. In Proceedings of the International Conference on Energy, Environment and Sustainable Development 2016 (EESD 2016), Jamshoro, Pakistan, 1–3 November 2016. [Google Scholar]
  54. Bao, G.; Ke, S. Load transfer device for solving a three-phase unbalance problem under a low-voltage distribution network. Energies 2019, 12, 2842. [Google Scholar] [CrossRef]
  55. Homaee, O.; Mirzaei, M.J.; Najafi, A.; Leonowicz, Z.; Jasinski, M. A practical probabilistic approach for load balancing in data-scarce LV distribution systems using Discrete PSO and 2 m + 1 PEM. Int. J. Electr. Power Energy Syst. 2022, 135, 107530. [Google Scholar] [CrossRef]
  56. Zanjani, P.N.; Javadi, S.; Aliabadi, M.H.; Gharehpetian, G. A novel approach for mitigating electrical losses and current unbalance in low voltage distribution networks. IET Gener. Transm. Distrib. 2025, 19, e70072. [Google Scholar] [CrossRef]
  57. Hassan, M.; Najjar, M.; Tohme, R. A practical way to balance single phase loads in a three phase system at distribution and unit level. In Proceedings of the 20th International Conference on Renewable Energies and Power Quality (ICREPQ’22), Vigo, Spain, 27–29 July 2022; pp. 173–177. [Google Scholar] [CrossRef]
  58. Grigoras, G.; Gavrilas, M.; Neagu, B.C.; Ivanov, O.; Triștiu, I.; Bulac, C. An efficient method to optimal phase load balancing in low voltage distribution network. In Proceedings of the 2019 International Conference on ENERGY and ENVIRONMENT (CIEM), Timisoara, Romania, 17–18 October 2019; pp. 323–327. [Google Scholar] [CrossRef]
  59. Grigoraș, G.; Gavrilaș, M.; Scarlatache, F.; Cazacu, M.; Cosarca, M. Assessing energy losses in unbalanced low voltage electric distribution networks. Energetica 2016, 64, 53–59. [Google Scholar]
  60. Kennedy, J.; Eberhart, R. Particle Swarm Optimization. In Proceedings of the IEEE International Conference on Neural Networks, Perth, WA, Australia, 27 November–1 December 1995; IEEE Press: Piscataway, NJ, USA, 1995; pp. 1942–1947. [Google Scholar] [CrossRef]
Figure 1. The technical issues caused by the current imbalance.
Symmetry 17 01589 g001
Figure 2. The basic diagram of an LVDN with unbalanced phase load—(a) entire network; (b) the network divided into the main feeder and branches.
Symmetry 17 01589 g002
Figure 3. The unbalanced load in a 3-phase, 4-wire LVDN.
Symmetry 17 01589 g003
Figure 4. The encoding of a solution in the optimization process.
Symmetry 17 01589 g004
Figure 5. Multistage phase balancing—method A (branch–main feeder optimization): branch optimization (a), followed by main feeder optimization (b).
Symmetry 17 01589 g005
Figure 6. Multistage phase balancing—method B (main feeder—branch optimization): main feeder optimization (a), followed by branch optimization (b).
Symmetry 17 01589 g006
Figure 7. The encoding of branch percentage load distribution in the optimization process, method (B).
Symmetry 17 01589 g007
Figure 8. The multistage approach used by the branch–main feeder and main feeder–branch algorithms.
Symmetry 17 01589 g008
Figure 9. The one-line diagram of the LVDN used in the case study.
Symmetry 17 01589 g009
Figure 10. The consumer energy demand of the LVDN in 24 h, aggregated on the three phases.
Symmetry 17 01589 g010
Figure 11. The daily consumer energy demand in the entire network.
Symmetry 17 01589 g011
Figure 12. The phase loads on the entire LVDN, in 24 h.
Symmetry 17 01589 g012
Figure 13. The phase loads on the main feeder, in 24 h.
Symmetry 17 01589 g013
Figure 14. The phase loads on branch 1, in 24 h.
Symmetry 17 01589 g014
Figure 15. The phase loads on branch 2, in 24 h.
Symmetry 17 01589 g015
Table 2. Data for the LVDN used in the case study—the unbalanced network.
ParameterEntire NetworkMain Feeder
(Cons. 1–68)
Branch 1
(Cons.69–129)
Branch 2
(Cons.130–190)
No. of poles128464933
No. of consumers190686161
Phase a68262121
Phase b62242117
Phase c60181923
Active energy demand, kWh486.89201171.26114.63
Phase a192.6982.8770.1439.68
Phase b159.8974.7745.7539.37
Phase c134.3143.3655.3735.58
Active energy losses, kWh36.14932.6412.7750.734
Feeder length, km5.161.8421.32
Wire typeOHL 3 × 50 mm2 + 50 mm2
Table 3. Consumer grouping based on their daily demand.
<0.5 kWh0.5–1 kWh1–5 kWh5–10 kWh>10 kWh
548106184
Table 4. Data for the LVDN after optimization—reference, network-level algorithm.
ParameterEntire NetworkMain FeederBranch 1Branch 2
No. of poles128464933
No. of consumers190686161
Phase a38151211
Phase b76302620
Phase c76232330
Active energy demand, kWh486.89201171.26114.63
Phase a161.0585.8951.3823.78
Phase b161.1154.4956.7949.83
Phase c164.7360.6163.1041.02
Active energy losses, kWh32.88830.2831.9410.665
Feeder length, km5.161.8421.32
Table 5. Data for the LVDN after optimization—multistage optimization, method 1 (branch–main feeder).
ParameterEntire NetworkMain FeederBranch 1Branch 2
No. of poles128464933
No. of consumers190686161
Phase a33101013
Phase b65211925
Phase c92373223
Active energy demand, kWh486.89201171.26114.63
Phase a159.7470.0752.9336.74
Phase b162.9669.0956.5337.34
Phase c164.1961.8461.8040.55
Active energy losses, kWh33.03730.6351.8450.557
Feeder length, km5.161.8421.32
Table 6. Data for the LVDN after optimization—multistage optimization, method 2 (main feeder–branch).
ParameterEntire NetworkMain FeederBranch 1Branch 2
No. of poles128464933
No. of consumers190686161
Phase a3891514
Phase b61222217
Phase c91372430
Active energy demand, kWh486.89201171.26114.63
Phase a160.7364.7758.8737.09
Phase b161.8166.6856.3838.75
Phase c164.3669.5656.0138.79
Active energy losses, kWh33.31230.6432.0740.595
Feeder length, km5.161.8421.32
Disclaimer/Publisher’s Note: The statements, opinions and data contained in all publications are solely those of the individual author(s) and contributor(s) and not of MDPI and/or the editor(s). MDPI and/or the editor(s) disclaim responsibility for any injury to people or property resulting from any ideas, methods, instructions or products referred to in the content.