Abstract
It is known that a correlation in either the service or interarrival times causes a deterioration in the performance of a queuing system. This study aimed to determine which of the two correlations—in the service times or in the interarrival times—has a stronger influence on the expected queue length, assuming an identical autocorrelation function in both cases. To achieve this goal, a formula for the expected queue length in a system with correlated arrivals was derived first. This new formula, along with a known formula for the expected queue length in a system with correlated service, was used to compare the influence of the two correlations. Various scenarios were studied, such as cases where the common correlation was positive or negative, where the variance of the service or interarrival time was low or high, and where the system load was low or high. Furthermore, both the time-dependent and the steady-state behaviors of the systems were compared. The following two key observations were made. If the impact of other factors on the queue length is minor, then a positive correlation has a worse effect on the queue length when present in service times than in arrival times. On the contrary, a negative correlation has a worse effect on the queue length when present in arrival times than in service times.
1. Introduction
In many practical realizations of queuing systems, the correlated interarrival times and/or correlated service times of jobs (e.g., customers, packets) can be encountered. Correlated interarrival times between packets in computer networks were first identified in the early 1990s [1,2]. Since then, this phenomenon has been widely studied (see, for instance, the excellent monograph [3] and the references therein). Clearly, correlated interarrival times are not specific to networking and occur in many other fields. For example, in transportation networks, passenger interarrival times at bus or train stops can be correlated due to the arrivals of other buses or trains. In call centers, inter-call times may be correlated due to external events, such as advertisements. In retail, customer arrivals may show a correlation during sales events, etc.
Correlated service times are equally common in queuing systems. In computer networking, the transmission times of consecutive packets can be correlated due to the correlation of consecutive packet sizes [4]. In healthcare systems, patient service times may be correlated due to external factors like disasters or accidents. In some cases, the correlations of interarrival times and service times may share the same origin. For instance, a large fire in a city could simultaneously impact both the interarrival times of patients to hospitals and their treatment times due to the similarity in the nature of their injuries.
It is well understood among researchers that both correlated service times and correlated interarrival times separately degrade the performance of a system. Queue lengths increase, waiting times grow, buffer overflows become more frequent, and job losses rise. This degradation has been demonstrated many times in the literature and will also be evident in the results presented here, but showing this degradation is not the purpose of this study. Instead, the question addressed here is the following: which of the two—correlated service times or correlated interarrival times—has a stronger influence on the system performance?
Therefore, the purpose of this paper was to compare the performance of a system with correlated service times to that of a system with correlated interarrival times, assuming both possessed an identical autocorrelation function. To ensure a fair comparison, the other parameters of the two systems were kept identical, including the distributions of service and interarrival times, as well as the system load. Additionally, both the time-dependent and the steady-state behaviors of the systems were analyzed.
The comparison was conducted with respect to a key performance metric: the expected queue length. This requires two formulas for the expected queue length—one for the system with correlated arrivals and another for the system with correlated service. The formula for the latter has already been established, while the formula for the system with correlated arrivals was derived in this study, constituting another contribution of the study.
Both formulas are computationally efficient, meaning they are relatively simple to evaluate numerically and allow for the effective calculation of expected queue lengths at any given time, t, or in the steady state. Unfortunately, these formulas take highly complex forms. This complexity precludes a direct analytical comparison to derive rigorous conditions under which one formula predicts a larger expected queue length than the other. Instead, a numerical approach was adopted here. It was based on selecting representative scenarios (parameterizations) to compute and compare the expected queue lengths.
In these scenarios, besides the correlation, other parameters known to affect the expected queue length were varied as well. These included the variance of the interarrival and service times and the system load.
Summarizing, the contributions of this study are as follows:
- The derivation of a formula for the expected queue length in a system with correlated interarrival times (Theorem 1). This formula accounts for both the time-dependent and steady-state expected queue lengths and supports arbitrary service time distributions (enabling, e.g., arbitrary variance).
- A comparison of the expected queue length in systems with correlated arrivals and systems with correlated service, under the assumption that both possess an identical autocorrelation function and other system parameters, across various scenarios.
Cases with positively and negatively correlated arrival or service processes were treated separately. A positively correlated arrival (service) process refers to an arrival (service) process in which the coefficient of correlation between two consecutive interarrival (service) times is greater than zero. Similarly, a negatively correlated arrival (service) process refers to a process in which the coefficient of correlation between two consecutive interarrival (service) times is less than zero.
The simplest approach to modeling correlated interarrival or service times is by using a modulating Markov chain of the continuous type, which governs the behavior of the arrival or service process, respectively. This approach yields the well-known Markovian arrival process (MAP) and Markovian service process (MSP), both of which were utilized in this study.
It is essential to note that while the MAP and MSP are similar, they are not identical. Specifically, the modulating Markov chain in the MAP evolves continuously without any interruptions. In contrast, the evolution of the modulating Markov chain in the MSP is occasionally suspended when the queue length is zero. This distinction introduces a design asymmetry between the two models. Without this difference, a model with MAP arrivals and a buffer of capacity, B, would be fully symmetric to a model with MSP service and the same buffer along the symmetry axis . In such a case, the stochastic behavior of the queue length process in a model with MAP arrivals would mirror the stochastic behavior of the queue length process in a model with MSP service, given a reflection along the line . However, the aforementioned difference between the MAP and MSP disrupts this symmetry. This will become more evident after the definitions of the models are presented in Section 3 and Section 4, respectively.
The rest of the study is organized as follows. In Section 2, the related work is characterized. In Section 3, a model with correlated arrivals, a finite buffer, and an arbitrary service distribution is recalled. In Section 4, an analogous model with correlated service is recalled. Then, in Section 5, the theorem on the expected queue length in the model with correlated arrivals is proven. The theorem is general in the sense that it enables the computation of both the time-dependent and steady-state expected lengths of the queue. In Section 6, the previously proven theorem on the expected queue length in the model with correlated service is recalled. In Section 7, the performance of systems with correlated arrivals and correlated service are compared in eight scenarios: where the correlation is positive or negative, where the variance of the service/interarrival time is low or high, and where the system load is low or high. In each scenario, the steady-state and time-dependent expected queue lengths are presented and discussed. Furthermore, in each scenario, the results for an analogous system with uncorrelated arrivals and uncorrelated service are provided. Lastly, the key conclusions from the performed comparisons are gathered in Section 8.
2. Related Work
To the author’s knowledge, all the results of this study are new, except for Theorem 2 in Section 6, which was included to make the paper self-contained.
There are many separate studies on systems with correlated service (see [5,6,7,8,9,10,11,12,13,14,15,16,17,18,19,20]) and correlated arrivals (see the monograph [3] and the references therein). None of the previous papers, however, compare the impact of a correlation in the service process with the impact of a correlation in the arrival process, assuming the same autocorrelation function but in different components of the system. Such a comparison was the primary goal of this paper.
The comparison was carried out with respect to a natural characteristic: the expected queue length. Moreover, it was comprehensive in the sense that it included the queue length at an arbitrary time, t, and in the steady state (). Therefore, it required two time-dependent formulas for the expected queue lengths, i.e, in systems of both types. Unfortunately, a suitable formula for the system with correlated arrivals had not been derived before.
Specifically, previous studies on systems with correlated arrivals were carried out either for the steady state, or for a specific service time distribution, or under an infinite buffer assumption, or with regard to different performance characteristics than the expected queue length (see [3] and the references). Therefore, no suitable formula had been obtained before.
Herein, a new such formula is proved (Theorem 1). It expresses the expected queue length at the arbitrary time t and in the steady state in a system with correlated arrivals, general service times, and a finite buffer. This formula itself constitutes another contribution of the paper.
An analogous formula for a system with correlated service is already known and is recalled in Section 6.
The study of systems with correlated service (MSP) began with [5], where the queue size in a finite buffer model was analyzed. In [6], the tail distribution of the queue was studied under the infinite buffer assumption. Subsequently, ref. [7] derived the queue size at arrival epochs and the response time for both finite and infinite buffer models. In [8], the finite buffer model was extended to include group service, with the queue length and response time distributions obtained. Another extension, involving multiple service stations, was explored in [9], where the distributions of the busy periods, idle periods, and queue size were analyzed.
Article [10] focused on the finite buffer model, investigating the limiting value of the loss probability as the buffer capacity approaches infinity. In [11], group arrivals were incorporated into the finite buffer model. Two group acceptance rules were considered: partial group rejection and total group rejection. For both variants, the loss probability, waiting time, queue size, and special metrics such as the probability of losing the last or first customer of a group were examined. Group service was revisited in [12], assuming an infinite buffer, with calculations of the queue size at arbitrary and arrival epochs, as well as expected response times.
An alternative approach to analyzing the queue size, based on the characteristic equation and its roots, was proposed in [13]. Study [14] focused on characterizing the departure process and the waiting time. Models with group arrivals under the infinite buffer assumption were analyzed in [15,16]. The former centered on the queue size and idle and busy periods, while the latter focused on the waiting time. In [17], a model with group arrivals and a finite buffer was examined, yielding results on the overall loss probability, the expected waiting time, and the probability of a specific number of consecutive losses during busy periods.
In [18], a finite buffer model with group service was revisited, with the study focusing on optimizing a profit function combining key performance metrics, including the expected queue size, loss probability, and waiting time. Study [19] analyzed the queue length in two variants of the service process, deriving the queue size distribution and expected queue size for a finite buffer model. Finally, ref. [20] provided full, time-dependent solutions and steady-state results for the queue size distribution and expected queue size in a finite buffer model.
This study did not incorporate group service or group arrivals in the analyzed models. While group structures significantly influence the system performance, their effects are challenging to separate from the impact of correlations, which is the primary focus of this work.
Additionally, the models considered here have finite buffers. While infinite buffer models are important theoretically, finite buffer models have several practical advantages. Most real-world queuing systems operate with finite waiting rooms or buffers. When the system load is low or the buffer capacity is large, finite buffer systems behave similarly to their infinite buffer counterparts, allowing the latter to be approximated by the former. However, the reverse is not true. Finite buffer models capture critical phenomena, such as buffer overflows and job losses, that are absent in infinite buffer models. These phenomena profoundly affect the system performance, as will be evident in Section 7.
7. Comparison of Systems with Correlated Arrivals and Correlated Service
It is well established that not only may the correlation of the arrival/service process influence the expected queue length, but other factors may as well, including the variance of the service/interarrival time and the system load.
Therefore, scenarios where these other factors have a relatively low impact on the expected queue, i.e., when and the variances are low, will be considered first. Later, cases with a high and/or high variances will be studied as well, to examine the combined impact of the correlation and one or two other factors. Moreover, the cases with positive and negative correlations of the arrival/service processes will be treated separately. Thus, eight scenarios will be considered in total, in separate subsections, all combinations of cases where the correlation is positive or negative, the variance of the service/interarrival time is low or high, and the system load is low or high.
To guarantee fair comparisons, the matrices for the arrival process and the service process were identical in each comparison, i.e., and , which provided identical autocorrelation functions in both systems. The remaining distributions, and , were also identical, perhaps with the correction of scaling necessary to ensure the same in both systems, if needed. The buffer capacity in all scenarios was the same, , as was the number of modulating states, . Finally, the specific impact of different initial conditions on the expected queue was not of interest here. Therefore, in every scenario, only cases where initially the queue was zero while the modulating state was one, i.e., , were considered.
In each scenario, three systems were parameterized and compared: a system with correlated arrivals (System A), a system with correlated service (System B), and an uncorrelated system (System C).
The matrices and were generated randomly to obtain a coefficient of correlation of the consecutive interarrival (or service) times of 0.43 in scenarios with a positive correlation and of -0.43 in scenarios with a negative correlation.
7.1. Positive Correlation, Low Load, and Low Variances
In this scenario, the three systems of interest are parameterized as follows.
- System A: Correlated arrivals with and an autocorrelation function are shown in Figure 1. Parameters:Uncorrelated service with hypoexponential distribution:which provides a low load, , and a low variance of the service time, .
- System B: Correlated service with the same parameters as in (64), i.e.,Uncorrelated arrivals with the hypoexponential distribution of (65), scaled to . A low variance of the interarrival time, .
- System C: Uncorrelated Poisson arrivals with . Uncorrelated service with and the hypoexponential distribution of (65). A low load, , and a low variance of the service time, .
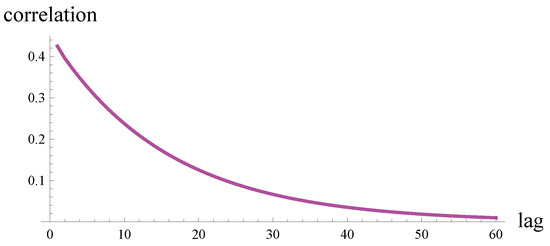
Figure 1.
Correlation versus lag of arrival/service process parameterized in (64).
This is perhaps the most important scenario because the load and variances have a faint impact on the queue length here. Thus, the sole impact of the correlation can be studied. Moreover, in real-world queuing systems, the correlation is much more often positive than negative.
The autocorrelation function shown in Figure 1 assumes a value of 0.43 for two consecutive interarrival/service times (lag = one). It also decays to zero when the lag is about 60. Therefore, it represents a moderate and certainly realistic correlation strength.
The time-dependent expected queue lengths in this scenario are shown in Figure 2, while the steady-state expected queue lengths are given in the first row of Table 1. The vertical axis of Figure 2 represents the expected queue length at time t, assuming the initial queue length at was zero and the initial modulating state was one. The time axis is unitless because the rate matrices are unitless as well. If the rate matrices were assigned a unit, say [1/s], then the time axis would have a reciprocal unit, i.e., [s].
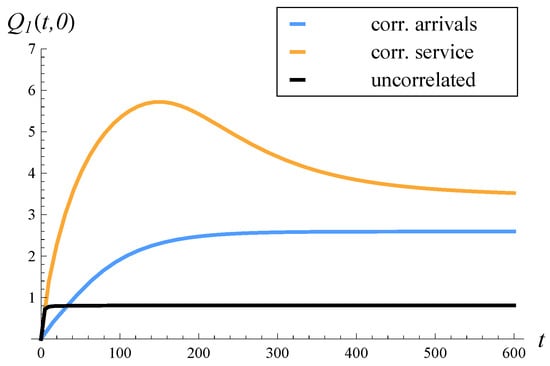
Figure 2.
Expected queue length, in time, in three systems. Scenario with positive correlation (if any), load of , and low variances.

Table 1.
Expected queue length in the steady state in all considered scenarios and systems.
First of all, the significant impact of the correlation can be seen in Figure 2, regardless of whether it is present in the arrivals or the service. The expected queue length is almost always greater when a correlation is present. Moreover, the presence of a correlation profoundly influences the time required to reach the steady state, which, in the uncorrelated system, is about 20 s, while in the correlated systems, it is 300–600 s.
Now, the most important observation is that positively correlated service induces longer queues than positively correlated arrivals, both in the time-dependent and the steady-state regimes, given that the strength of the correlation is identical in both cases and other factors are unimportant. This is evident in Figure 2 and the first row of Table 1. In other words, positively correlated arrivals cause a smaller problem than positively correlated service.
An intuitive explanation of this observation is very difficult to figure out, because the expected queue length computed from Theorems 1 and 2 depends in a very complex way on the correlation hidden in the parameter matrices.
7.2. Negative Correlation, Low Load, and Low Variances
In the second scenario, the load and the variances are kept low to observe the sole impact of the correlation, which is now negative between two successive interarrival or service times. The three systems of interest are parameterized as follows.
- System A: Correlated arrivals with and an autocorrelation function are shown in Figure 3. Parameters:Uncorrelated service with the hypoexponential distribution of (65). A low load, , and a low variance of the service time, .
- System C: Uncorrelated Poisson arrivals with . Uncorrelated service with and the hypoexponential distribution of (65). A low load, , and a low variance of the service time, .
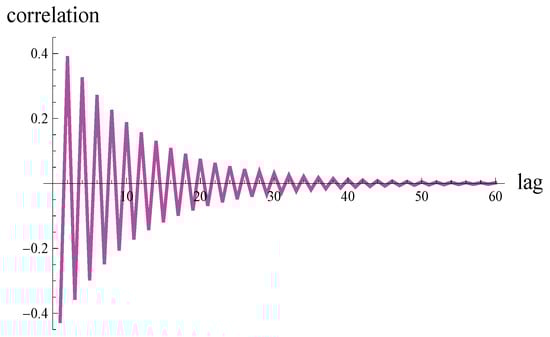
Figure 3.
Correlation versus lag of arrival/service process parameterized in (67).
The autocorrelation function shown in Figure 3 assumes a value of −0.43 for two consecutive interarrival/service times (lag = one). It also decays to zero when the lag is about 60. Therefore, it represents a moderate correlation, similar in strength to that shown in Figure 1, but with a negative sign, rather than a positive one, at lag = one.
The time-dependent expected queue lengths in this scenario are shown in Figure 4, while the steady-state expected queue lengths are provided in the second row of Table 1.
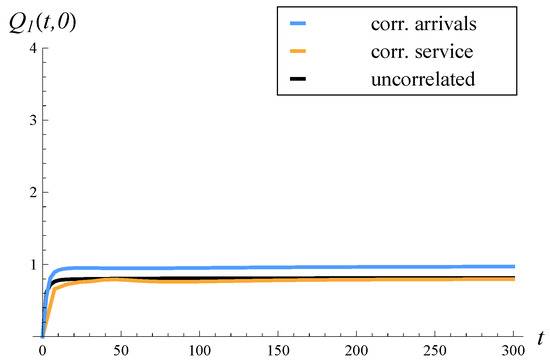
Figure 4.
Expected queue length, in time, in three systems. Scenario with negative correlation (if any), load of , and low variances.
One can now see a completely different picture in Figure 4 compared to the previous scenario. Most importantly, the expected queue length is greater in the system with negatively correlated arrivals than in the system with negatively correlated service, which is the reverse effect of what was observed in the previous section.
Additionally, three other points can be noted. Firstly, the expected queue lengths are generally much lower than in the scenario with a positive correlation, both in the time-dependent case and in the steady state. Secondly, convergence to the steady state lasts for far less time than in the scenario with a positive correlation. Thirdly, the expected queues in the system with negatively correlated service are almost identical to those in the uncorrelated system.
7.3. Positive Correlation, High Load, and Low Variances
From now on, scenarios in which some other factor(s), besides the correlation, may significantly impact the expected queue lengths will be considered. Therefore, no general conclusions can be drawn from the results, as it is unclear in each particular case which factor plays a dominant role in shaping the queue length. Nevertheless, it is interesting to observe what happens in several scenarios of this type.
A high load and positive correlation is assumed first. The three systems of interest are parameterized as follows.
- System C: Uncorrelated Poisson arrivals with . Uncorrelated service with the hypoexponential distribution of (65) scaled to a high load, . A low variance of the service time, .
The time-dependent expected queue lengths in this scenario are shown in Figure 5, while the steady-state expected queue lengths are provided in the third row of Table 1. Figure 5 needs to be compared with Figure 2—the only difference between them is , which is in Figure 2 and 1 in Figure 5.
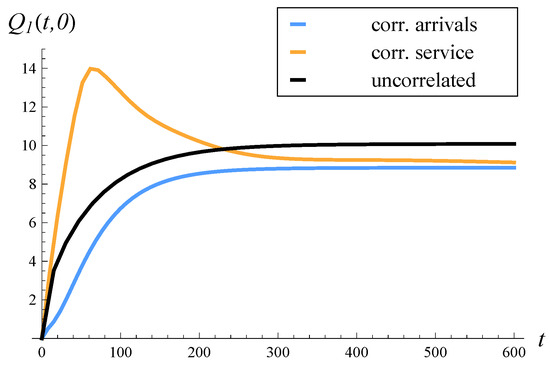
Figure 5.
Expected queue length, in time, in three systems. Scenario with positive correlation (if any), load of , and low variances.
As observed in Figure 5, the expected queue length is still greater in the case with correlated service than in the case with correlated arrivals. However, the difference between the two is much smaller in Figure 5 than in Figure 2, especially when the steady state is approached. This is due to the high load, which now starts to play an important role.
Another important observation is that the expected queue is longer in the uncorrelated system than in the two correlated ones in the steady state. A naïve conclusion here would be that a positive correlation, either in arrivals or service, somehow improves the performance of the system. Such a conclusion is false in the following sense.
A positive correlation, together with a high load, causes very high job losses in both correlated systems. Specifically, the loss ratio in the system with correlated arrivals is as high as 27.6%, which can be calculated using formula (3.30) of [25]. The loss ratio in the system with correlated service is as high as 21.7%. This can be calculated using Theorem 1 of [20], together with the well-known formula for the loss ratio, namely , where is the empty system probability. In contrast, the loss ratio in the uncorrelated system is only 3.0%.
Therefore, the lower queue lengths in systems with correlated interarrival or service times are, in fact, a consequence of the large number of jobs lost due to the buffer overflow. A large number of losses result in a relatively low real load carried by these systems, i.e., far below 1, compared to the carried load of 0.97 in the case of the uncorrelated system.
All of these underline the importance of using a finite buffer model for every system, where the real waiting room is finite.
7.4. Negative Correlation, High Load, and Low Variances
In this scenario, the three systems of interest are parameterized as follows.
- System C: Uncorrelated Poisson arrivals with . Uncorrelated service with the hypoexponential distribution of (65) scaled to a high load, . A low variance of the service time, .
The time-dependent expected queue lengths in this scenario are shown in Figure 6, while the steady-state expected queue lengths are provided in the fourth row of Table 1. As observed, the high load now has such a strong impact on the expected queue that it makes other factors, including a negative correlation, less significant. In the steady state, the expected queue is almost identical, regardless of whether the arrivals, service, or neither are correlated.
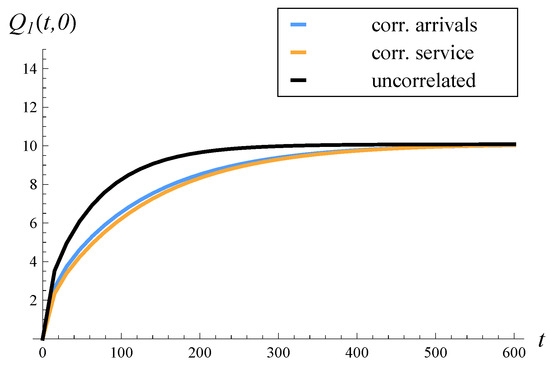
Figure 6.
Expected queue length, in time, in three systems. Scenario with negative correlation (if any), , and low variances.
The only noticeable difference is in the speed at which the steady state is reached. In the case of the uncorrelated system, the steady state is reached slightly faster than in the other two cases.
7.5. Positive Correlation, Low Load, and High Variances
In this scenario, the three systems of interest are parameterized as follows.
- System C: Uncorrelated Poisson arrivals with . Uncorrelated service with and the hyperexponential distribution of (68). A low load, , and a high variance of the service time, .
The time-dependent expected queue lengths in this scenario are shown in Figure 7, while the steady-state expected queue lengths are provided in the fifth row of Table 1. The results depicted in Figure 7 can be compared with Figure 2 and the first row of Table 1, where the same parameterizations were used, except for the variance of the interarrival/service times, which is much higher here. As observed, all the expected queues are longer in Figure 7, both at any t and in the steady state. This was to be expected, given the well-known effect of a large variance in the interarrival/service times on queue lengths.
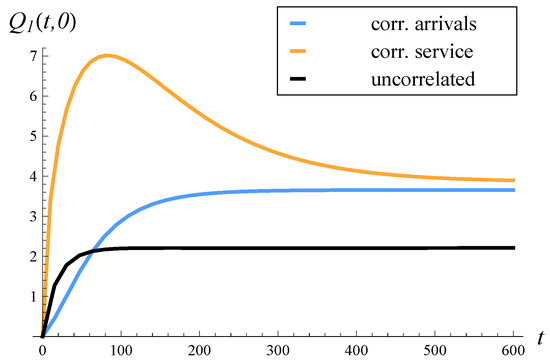
Figure 7.
Expected queue length, in time, in three systems. Scenario with positive correlation (if any), load of , and high variances.
7.6. Negative Correlation, Low Load, and High Variances
In this scenario, the three systems of interest are parameterized as follows.
- System C: Uncorrelated Poisson arrivals with . Uncorrelated service with and the hyperexponential distribution of (68). A low load, , and a high variance of the service time, .
The time-dependent expected queue lengths in this scenario are shown in Figure 8, while the steady-state expected queue lengths are given in the sixth row of Table 1. As observed, the high variances have a dominant effect on the expected queues and reverse the results of Section 7.2. Specifically, in the case of correlated service, the queues are now longer than in the case of correlated arrivals.
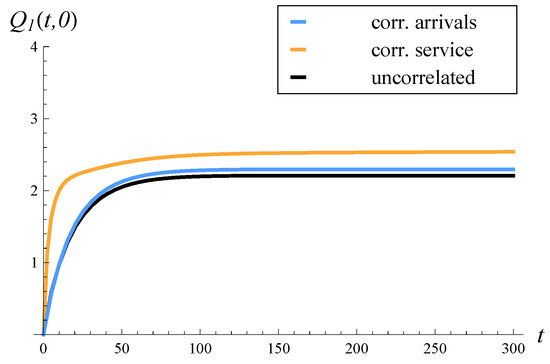
Figure 8.
Expected queue length, in time, in three systems. Scenario with negative correlation (if any), load of , and high variances.
7.7. Positive Correlation, High Load, and High Variances
In this scenario, the three systems of interest are parameterized as follows.
- System C: Uncorrelated Poisson arrivals with . Uncorrelated service with the hyperexponential distribution of (68) scaled to a high load, . A high variance of the service time, .
The time-dependent expected queue lengths in this scenario are shown in Figure 9, while the steady-state expected queue lengths are given in the seventh row of Table 1. One can again observe in Figure 9 the effect of losses on the expected queues, as thoroughly explained in Section 7.3. As a result of the large number of losses in both correlated systems, the steady-state expected queue is longer in the uncorrelated system than in the two correlated ones. When comparing the two correlated systems, longer expected queues in the system with correlated service can be seen.
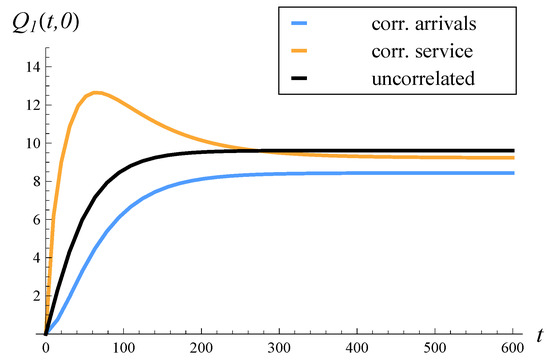
Figure 9.
Expected queue length, in time, in three systems. Scenario with positive correlation (if any), , and high variances.
7.8. Negative Correlation, High Load, and High Variances
In this final scenario, the three systems of interest are parameterized as follows.
- System C: Uncorrelated Poisson arrivals with . Uncorrelated service with the hyperexponential distribution of (68) scaled to a high load, . A high variance of the service time, .
The time-dependent expected queue lengths in this scenario are shown in Figure 10, while the steady-state expected queue lengths are given in the eighth row of Table 1. As observed in Figure 10, the high load and high variances have a significant impact on the expected queue, making the negative correlation less important. In the steady state, the expected queue is almost the same in all three cases: with correlated arrivals, with correlated service, and in the uncorrelated system. The only difference is in the rate of convergence to the steady state, which is slightly faster in the case of correlated service than in the other two cases.
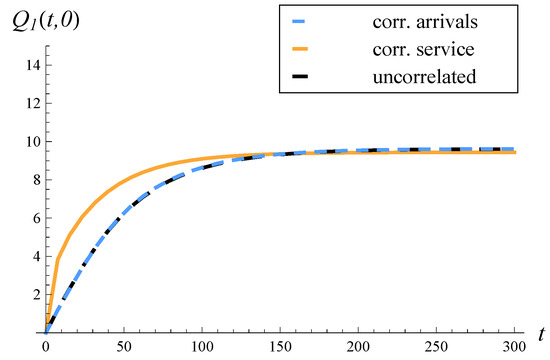
Figure 10.
Expected queue length, in time, in three systems. Scenario with negative correlation (if any), , and high variances.
8. Conclusions
This study aimed to determine which of the two correlations—in the service times or in the interarrival times—caused a greater deterioration in the expected queue length, given that the strength of the correlation was identical in both cases. To the author’s knowledge, this had not been established yet in any previous study.
To perform the comparison, a formula for the expected queue length in a system with correlated arrivals was derived first. The formula accounts for both the time-dependent and steady-state expected queue lengths and supports arbitrary service time distributions (enabling, e.g., arbitrary variance). Furthermore, it is rather easy to use in numeric computations. The formula itself constitutes a contribution of this paper. In the comparison, the new formula was used against the already known formula for the expected queue length in a system with correlated service.
Various scenarios were studied, where the common correlation was positive or negative, the variance of the service or interarrival times was low or high, and the system load was low or high.
The following two key observations were made:
When the impact of other factors (load, variances of interarrival/service times) is minor, then the following apply:
- A positive correlation has a worse effect on the queue length when present in service times than in arrival times;
- A negative correlation has a worse effect on the queue length when present in arrival times than in service times.
In reality, a positive correlation is encountered much more often than a negative correlation, and this applies to both arrival and service processes. Therefore, when other factors are negligible, it is better to have correlated arrivals than service, given that the strength of the correlation is identical in both cases.
An intuitive explanation of this observation is not easy, because the expected queue length, as computed from the theorems, depends in a thoroughly complicated way on the correlation embedded in the parameter matrices.
If one or more other factors influencing the queue length (such as the load or variances) are non-negligible, the picture becomes more complex. This must obviously be the case, because in each particular scenario, one cannot be sure which factor has the dominant effect on the queue length—the correlation, the load, or the variance of the interarrival/service times.
The main limitation of this study is that it did not incorporate group service or group arrivals in the analyzed models. While group structures significantly influence the system performance, their effects are challenging to separate from the impact of correlations, which was the primary focus of this work. This problem can be addressed in future work.
Another direction for future work is to determine which of the two—correlated service times or correlated interarrival times—has a stronger influence on other performance characteristics. Herein, we compared the two types of systems with respect to the expected queue length only. Similar comparisons can be made with respect to the waiting time, throughput, and other characteristics.
Funding
This research received no external funding.
Data Availability Statement
The data are contained within the article.
Conflicts of Interest
The author declares no conflicts of interest.
References
- Leland, W.; Taqqu, M.; Willinger, W.; Wilson, D. On the self-similar nature of ethernet traffic (extended version). IEEE/ACM Trans. Netw. 1994, 2, 1–15. [Google Scholar] [CrossRef]
- Crovella, M.; Bestavros, A. Self-similarity in World Wide Web traffic: Evidence and possible causes. IEEE/ACM Trans. Netw. 1997, 5, 835–846. [Google Scholar] [CrossRef]
- Dudin, A.N.; Klimenok, V.I.; Vishnevsky, V.M. The Theory of Queuing Systems with Correlated Flows; Springer: Cham, Switzerland, 2020. [Google Scholar]
- Emmert, B.; Binzenhöfer, A.; Schlosser, D.; Weiß, M. Source traffic characterization for thin client based office applications. Lect. Notes Comput. Sci. 2007, 4606, 86–94. [Google Scholar]
- Bocharov, P.P. Stationary distribution of a finite queue with recurrent flow and Markovian service. Autom. Remote Control 1996, 9, 66–78. (In Russian) [Google Scholar]
- Alfa, A.S.; Xue, J.; Ye, Q. Perturbation theory for the asymptotic decay rates in the queues with Markovian arrival process and/or Markovian service process. Queueing Syst. 2000, 36, 287–301. [Google Scholar] [CrossRef]
- Bocharov, P.P.; D’Apice, C.; Pechinkin, A.V.; Salerno, S. The stationary characteristics of the G/MSP/1/r queueing system. Autom. Remote Control 2003, 64, 288–301. [Google Scholar] [CrossRef]
- Chaplygin, V.V. The mass-service G/BMSP/1/r. Inf. Process. 2003, 3, 97–108. (In Russian) [Google Scholar]
- Albores-Velasco, F.J.; Tajonar-Sanabria, F.S. Analysis of the GI/MSP/c/r queueing system. Inf. Process. 2004, 4, 46–57. [Google Scholar]
- Kim, J.; Kim, B. Asymptotic analysis for loss probability of queues with finite GI/M/1 type structure. Queueing Syst. 2007, 57, 47–55. [Google Scholar] [CrossRef]
- Banik, A.D.; Gupta, U.C. Analyzing the finite buffer batch arrival queue under Markovian service process: GIX/MSP/1/N. Top 2007, 15, 146–160. [Google Scholar] [CrossRef]
- Banik, A.D. Analyzing state-dependent arrival in GI/BMSP/1/∞ queues. Math. Comput. Model. 2011, 53, 1229–1246. [Google Scholar] [CrossRef]
- Chaudhry, M.L.; Samanta, S.K.; Pacheco, A. Analytically explicit results for the GI/C-MSP/1/∞ queueing system using roots. Probab. Eng. Informational Sci. 2012, 26, 221–244. [Google Scholar] [CrossRef]
- Samanta, S.K. Sojourn-time distribution of the GI/MSP/1 queueing system. Opsearch 2015, 52, 756–770. [Google Scholar] [CrossRef]
- Chaudhry, M.L.; Banik, A.D.; Pacheco, A. A simple analysis of the batch arrival queue with infinite-buffer and Markovian service process using roots method: GIX/C-MSP/1/∞. Ann. Oper. Res. 2017, 252, 135–173. [Google Scholar] [CrossRef]
- Banik, A.D.; Chaudhry, M.L.; Kim, J.J. A Note on the Waiting-Time Distribution in an Infinite-Buffer GI[X]/C-MSP/1 Queueing System. J. Probab. Stat. 2018, 2018, 7462439. [Google Scholar] [CrossRef]
- Banik, A.D.; Ghosh, S.; Chaudhry, M.L. On the consecutive customer loss probabilities in a finite-buffer renewal batch input queue with different batch acceptance/rejection strategies under non-renewal service. In Soft Computing for Problem Solving: SocProS 2017; Springer: Singapore, 2019; Volume 1, pp. 45–62. [Google Scholar]
- Banik, A.D.; Ghosh, S.; Chaudhry, M.L. On the optimal control of loss probability and profit in a GI/C-BMSP/1/N queueing system. Opsearch 2020, 57, 144–162. [Google Scholar] [CrossRef]
- Samanta, S.K.; Bank, B. Modelling and Analysis of GI/BMSP/1 Queueing System. Bull. Malays. Math. Sci. Soc. 2021, 44, 3777–3807. [Google Scholar] [CrossRef]
- Chydzinski, A. Transient GI/MSP/1/N Queue. Entropy 2024, 26, 807. [Google Scholar] [CrossRef]
- Chakravarthy, S. The Batch Markovian Arrival Process: A Review and Future Work. Adv. Probab. Stoch. Process. 2001, 1, 21–49. [Google Scholar]
- Chydzinski, A. Time to reach buffer capacity in a BMAP queue. Stoch. Model. 2007, 23, 195–209. [Google Scholar] [CrossRef]
- Zakian, V. Numerical inversion of Laplace transform. Electron. Lett. 1969, 5, 120–121. [Google Scholar] [CrossRef]
- Schiff, J.L. The Laplace Transform: Theory and Applications; Springer: New York, NY, USA, 1999. [Google Scholar]
- Chydzinski, A.; Adamczyk, B. Transient and stationary losses in a finite-buffer queue with batch arrivals. Math. Probl. Eng. 2012, 2012, 326830. [Google Scholar] [CrossRef]
Disclaimer/Publisher’s Note: The statements, opinions and data contained in all publications are solely those of the individual author(s) and contributor(s) and not of MDPI and/or the editor(s). MDPI and/or the editor(s) disclaim responsibility for any injury to people or property resulting from any ideas, methods, instructions or products referred to in the content. |
© 2025 by the author. Licensee MDPI, Basel, Switzerland. This article is an open access article distributed under the terms and conditions of the Creative Commons Attribution (CC BY) license (https://creativecommons.org/licenses/by/4.0/).