Abstract
Small Li+Arn clusters are employed in this work as model systems to study microsolvation. Although first and second solvation shells are expected to be the most relevant ones for this type of atomic solvents, it is also interesting to explore larger clusters in order to identify the influence of external atoms on structural and thermodynamic properties. In this work, we perform a global geometry optimization for clusters (with n = 41–100) and parallel tempering Monte Carlo (PTMC) simulations for some selected sizes. The results show that global minimum structures of large clusters always have 6 argon atoms in the first solvation shell while maintaining the number of 14 or 16 argon atoms in the second one. By contrast, third and fourth solvation shells vary significantly the number of argon atoms with the cluster size, and other shells can hardly be assigned due to the reduced influence of on the external argon atoms for large clusters. In turn, PTMC calculations show that the melting of the most external solvation shells of large microsolvation clusters occurs at , which is independent of cluster size. Structural transitions can be observed between quasi-degenerated structures at low temperatures. Moreover, the present results highlight the fluxional character of the external solvation shells of these large clusters, which may be seen as typical “snowball” structures.
1. Introduction
The study of microsolvation is intimately related with the evaluation of the relative stability of clusters resulting from the stepwise addition of solvent to the solute. Energetic and thermodynamics properties of the clusters as well as their structural characterization are thus expected to offer detailed insight about the organization of the solvent around the solute. Since all those properties depend on the nature of the chemical entities of the microsolvation system, the development of a sufficiently accurate potential energy surface (PES) that encodes the relevant interactions among the particles of each cluster it is of primarily importance. Using the PES, the energy and low-energy structures of the clusters may be obtained by employing global optimization methods, while the effect of temperature on the stability of microsolvation aggregates can be assessed through parallel tempering Monte Carlo calculations.
The development of efficient global optimization algorithms [1,2,3,4,5,6,7,8] has been the endeavor of several research groups over the past decades, and some of those methods have been applied to the study microsolvation clusters [9,10,11,12,13,14,15,16,17]. In particular, genetic algorithms [18,19,20] have been applied to search for the global minimum structures of clusters resulting from the microsolvation of alkali metal ions with rare-gas atoms. This kind of systems present distinct solute–solvent and solvent–solvent interactions, because the former are established between the ion and the rare-gas atoms while the others are dominated by dispersion, and hence it is expected that they are weaker. Thus, global optimization results have shown the formation of a first solvation shell with a total number of argon atoms that depend on cation [21]. For instance, a six-atom octahedral structure constitutes the first solvation shell in the case of clusters. Using the interaction potential based only on two-body terms [21], it has also been shown that the number of argon atoms in the first solvation shell increases to 8 and 12 when considering the microsolvation of and , respectively. These results are in agreement with those of a previous study on using an analytical potential that includes three-body terms [14], and they are corroborated by a recent work on applying density functional theory [22]. Additionally, the closure of the first solvation shell in these systems is characterized by strong magic numbers [21,23], which may be attenuated by including three-body terms in the potential energy surface [23]. Another fingerprint for identifying structural features of the microsolvation clusters is heat capacity, which indicates [24] distinct temperatures for melting the first and the second solvation shells of . In fact, it has been shown that clusters show a rigid first solvation shell in comparison with the fluxional character of the second solvation shell [25].
In this work, we perform a global optimization search of = 41–100) using our genetic algorithm. The study is complemented for some specific cluster sizes with the analysis of the heat capacity as a function of temperature, which is calculated employing the parallel tempering Monte Carlo method. The potential energy surface that models the interactions arising in the clusters is the so-called PES II from our previous work [23]. We aim to investigate whether other solvation shells beyond the second one can be observed for large clusters. In addition, PTMC calculations allow assessment of structural transitions and the temperature of dissociation of the clusters. Our main goal is to shed light on the organization of argon atoms around in terms of solvation shells and characterize melting and premelting phenomena that may occur in these large microsolvation clusters.
2. Methods
2.1. Potential Energy Surface
We assume that the energy of each cluster composed by and n argon atoms may be given by a sum over all two-body contributions, i.e.,
where and are, respectively, the -Ar and Ar-Ar pair potentials that depend on the corresponding internuclear distances (). The analytical expressions for both pair potentials are the same as in our previous work [23], since they are accurate and also allow a fair comparative analysis of the present results; for completeness, the analytical expressions for the pair potentials are described in Supplementary Information. The -Ar potential is fitted to ab initio points calculated with the CCSD(T) method and quadruple-zeta basis sets (i.e., the cc-pVQZ basis set for the ion [26] and the aug-cc-pVQZ for argon [27]); the -Ar equilibrium distance is 4.484 and the corresponding well depth is −10.6156 . For the term, the Rydberg–London potential proposed by Cahill and Parsegian [28] is employed, the parameters of which are obtained by fitting to the accurate HFDID1 model of Aziz [29] for . The minimum of the Ar-Ar potential is located at ∼ and it has the value of about −0.4554 , which is more than 20 times weaker than that of the abovementioned -Ar interaction.
Although we have shown [23,25] that three-body interactions are especially relevant for establishing the correct structural and energetic features of small-size clusters, the essential trends are expected to be reproduced by a PES based on pair potentials as the microsolvation system grows up. The reason for that relies on the obvious predominance of weak interactions among argon atoms for larger clusters when compared with the high-energy contribution of the terms involving which dominate for small systems. Thus, we believe that the PES employed in the present work is sufficiently accurate to capture the main structural and thermodynamic features of the clusters beyond the second solvation shell. In fact, we observed, in a previous work [23], that global minimum structures are not overly affected by including three-body interactions in the PES for clusters with . Further evidence supporting this assumption is revealed in Figure S1 of Supplementary Information, where we can observe a decreasing contribution of three-body interactions for the binding energy as the clusters become large.
2.2. Evolutionary Algorithm for Structure Optimization
The evolutionary algorithm (EA) used for the geometry optimization of the clusters was developed in our group during more than one decade [18,19,20,30,31]. Across the years, it has been successfully applied to discover the global minima of several challenging systems involving different types of interactions. Among these, we especially refer to the works on Morse clusters [18,20], rare gases [20], transition metal alloys [21,32], charged colloids [31,33], and aggregates resulting from the microsolvation of alkali metal ions with rare-gas atoms [21,23,25,34,35].
The EA described below is applied for each cluster size. The initial step of the algorithm consists of generating a random population of structures; a set of 100 cluster structures is employed in this work. All the structures of the population are relaxed to the bottom of the corresponding attraction basin applying the local optimization method of Broyden–Fletcher–Goldfarb–Shanno (usually designated as the L-BFGS method [36,37]). Then, the global optimization cycle begins with the choice of the structures among the whole population that are the “parents” of the new generation. For that, the EA applies tournament selection with a tourney size of five. This means that each “parent” is chosen to be the best structure among a set of five randomly picked up from the population. The selected parent structures are modified by the application of genetic operators, i.e., crossover and mutation. Crossover combines pairs of structures to form offspring structures, and these can then undergo mutation, which consists of modifying the position of an atom of the cluster. For crossover, which is applied with a probability of 0.7, we rely on a generalized version [30] of the Cut and Splice proposed many years ago by Deaven and Ho [38]. In turn, the present calculations apply the Sigma mutation with a probability of 0.05, whereas 0.1 is the standard deviation () of the Gaussian distribution from which the new location of the atom can be randomly sampled. Offspring structures are subject to local optimization with the L-BFGS method. In the replacement strategy of the EA, “offspring” and “parents” compete to constitute part of the population for the next generation: low-energy structures have the advantage to enter the pool, but a certain degree of structural diversity is enforced [19] to avoid a premature convergence to a local minimum. Finally, the whole cycle is repeated until the number of potential energy evaluations reaches . Since the EA is a stochastic algorithm, it is necessary to run it several times in order to obtain an adequate statistical treatment of the global optimization results. We accomplish 30 runs of the EA for each cluster size, and the lowest energy structure so obtained is the corresponding putative global minimum.
2.3. Parallel Tempering Monte Carlo Method
We employ our own implementation of the parallel tempering Monte Carlo (PTMC) method to calculate the heat capacity as a function of temperature for some specific cluster sizes. Since the method has been previously described [24,39], here, we just offer an overview of the main features and present some modifications introduced for this study.
The reduced heat capacity (or adimensional heat capacity per particle) can be calculated as
where and are the average values of the potential and the squared potential, respectively, computed by the Metropolis algorithm in a Monte Carlo simulation. In Equation (2), , k, and T are, respectively, the number of atoms of the cluster, the Boltzmann constant, and the temperature.
The PTMC method considers M independent simulations for exploring the configuration space of the cluster system through random walks generated according to Boltzmann’s probability distribution. The simulations are run in parallel, each one at a different temperature, and exchanges between configurations of pairs of neighboring temperatures are attempted after a specified number of Monte Carlo steps (); in this work, we consider and a total number of Monte Carlo moves of . The acceptance probability for exchanging configurations of different simulations is given by expression
In this equation, and are the configurations at the ith step of the Metropolis random walk for temperatures and , respectively. The deterministic even-odd (DEO) procedure [40,41] was employed for exchanging structures of simulations at different temperatures. In turn, the step-size adjustment of Swendsen [42] was carried out on the fly to guarantee an acceptance rate of ∼ for the MC moves in each simulation. In addition, we should also mention that the PTMC calculation begins with the random selection of a cluster geometry among the five lowest-energy structures obtained from global optimization, and a subsequent thermalization process is performed by employing Monte Carlo moves.
Moreover, the set of temperatures () was chosen from constant steps in two predefined intervals that cover low- and high-temperature ranges. Typically, we use steps of 0.5 K in the low-temperature range and for temperatures above 200 K (or 150 K, for and ).
In order to avoid prompt evaporation of the argon atoms that are less bounded, we add the following rigid-wall potential to the interaction energy:
In Equation (4), distance vector is referred to the vector of the center of mass coordinates of the cluster () and is a parameter that establishes the volume of the available configurational space. As in our previous work [24], we define , where and is the distance of the farthest atom from the center of mass of the initial structure. Since five low-energy minima are considered as possible departing structures for each simulation, one has five values for . From these, we select the largest value for the calculation of , which guarantees that the relevant volume of the configurational space for all departing structures can be sampled in the simulation. The values of are shown in Table S1, where we also represent other relevant parameters of PTMC calculations.
The main structures arising in the simulations are identified by storing hundreds of non-correlated geometries for all the temperatures. These geometries are then submitted to local optimization so that minimum-energy structures can be obtained.
3. Results and Discussion
3.1. Global Optimization
We employed the EA described in Section 2.2 to discover all the putative global minimum structures of the clusters; the corresponding Cartesian coordinates are given in Supplementary Information. In a previous work [23], we already found out the putative global minima for the lower-size clusters. By using such previous results [23], we illustrate in Figure S2 how the different solvation shells are building up around the lithium ion as the size of the cluster increases. Although the definition of a solvation shell used here (which is solely based on the -Ar distance) may be somehow arbitrary, Figure S2 offers at least an idea about the organization of the argon atoms around ; further details about the distribution of argon atoms by different solvation shells are given in Table S2. Whilst the first solvation shell closes at and the corresponding octahedral motif is kept for larger sizes, second and third solvation shells show more variable shapes among the clusters. For instance, a single argon atom appears in the third solvation shell at and 21, but none are shown for , which has the greatest number of atoms in the second solvation shell. Also, structural changes in the second solvation shell can be observed in many cases, including the appearance of a perfect cubic shape for . It is also interesting to notice the formation of an incipient fourth solvation shell at and 37, with one and three argon atoms, respectively. This disappears at to form the more compact octahedral structure and arises again for larger clusters.
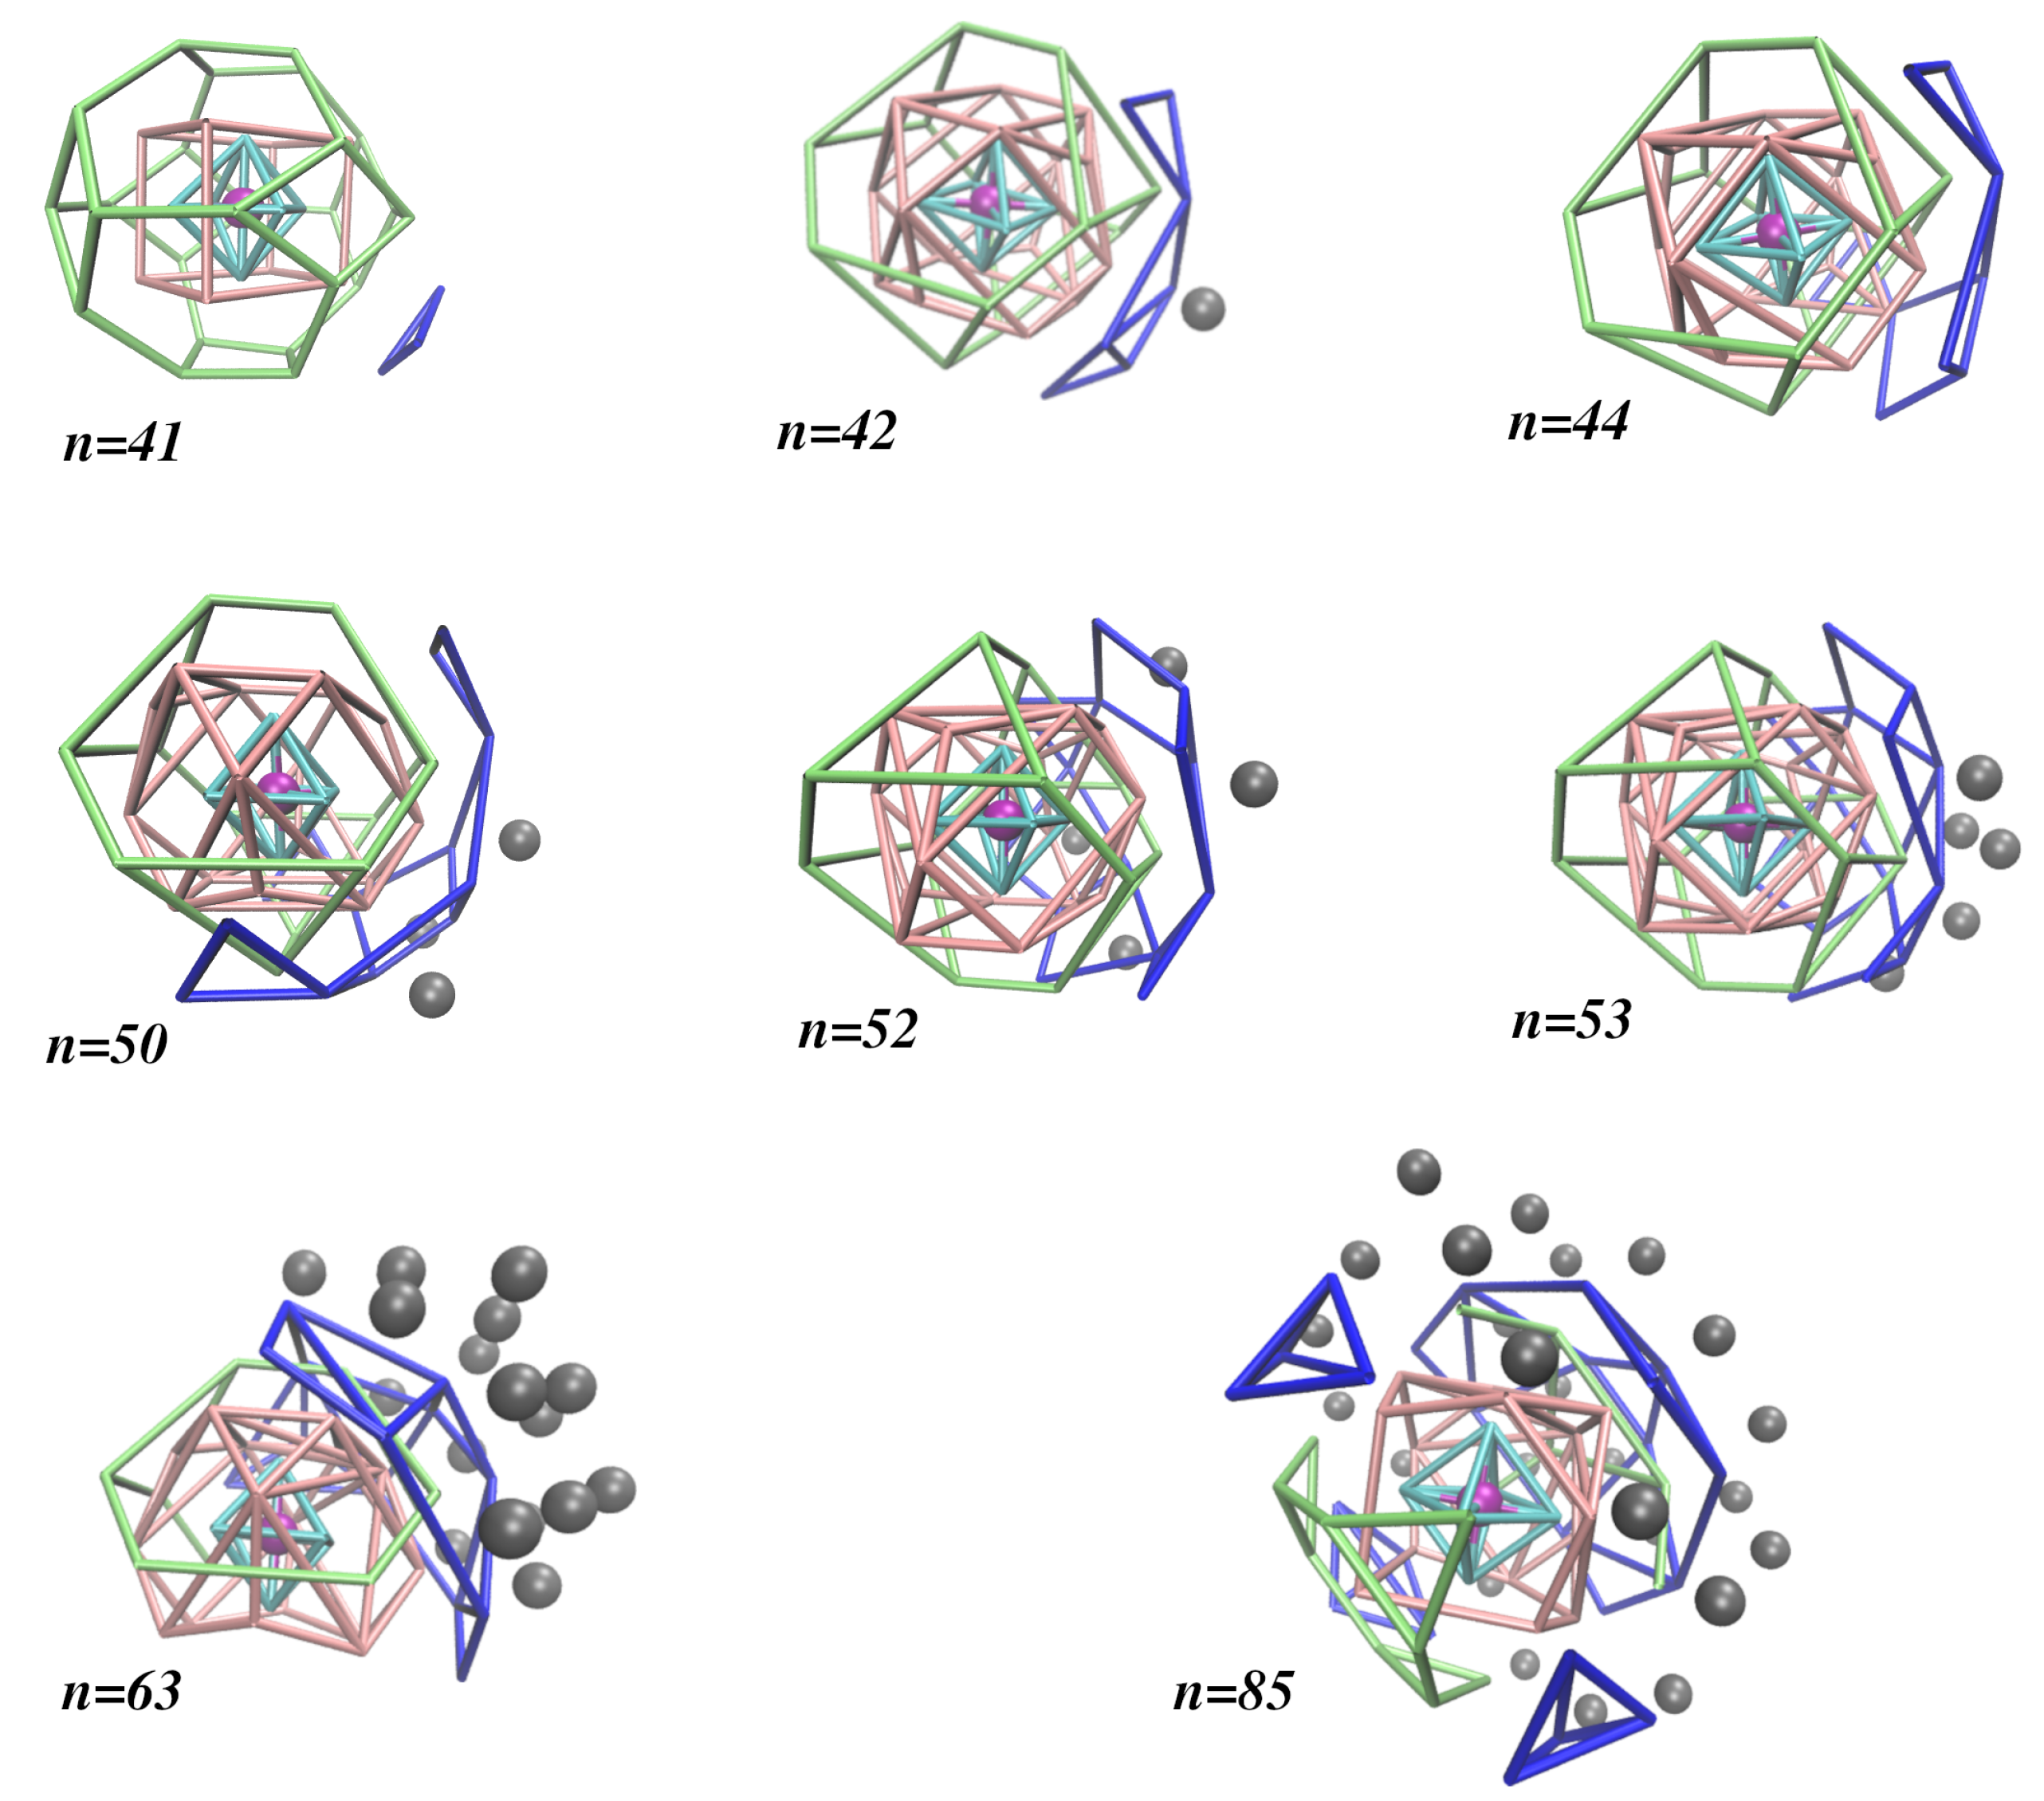
Moreover, we show in Figure 1 how the different solvation shells are organized for eight selected sizes of the large clusters studied in this work (i.e., ); the distribution of argon atoms by different solvation shells are displayed in Table S3. The global minimum maintains the shell structure observed for (by just adding a third atom to the fourth solvation shell), 8 and 24 atoms in the second and third solvation shells, respectively. A significant change is observed for larger clusters whose second and third solvation shells have, in general, 16 and 12 atoms, respectively. These values may slightly vary for some cluster sizes. For instance, keeps 16 atoms in the second solvation shell, but it has only 10 atoms in the third one; as for , the corresponding numbers of atoms are 14 and 15. Indeed, it is apparent from Figure 1 and Table S3 that the maximum numbers of argon atoms in the second and third solvation shells are 16 and 15, respectively, and such values do not change too much for large clusters (i.e., ). Conversely, the number of argon atoms in the fourth solvation shell can rise up to 24 (and keeps at this value for ), but it shows a great variation for specific cluster sizes, which is an indication of a very small influence of the ion. This means that one can hardly distinguish among solvation shells beyond the fourth one. Because of this, in the last column of Table S3, we collect the number of atoms that are more external (i.e., ). It is worth noting that, for , the first four solvation shells do not change their structure, while the number of external argon atoms increases. Nonetheless, we can find sets of consecutive clusters with similar numbers of external argon atoms for .
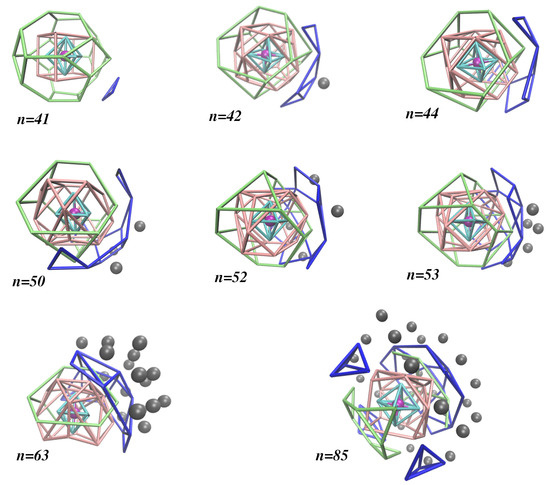
Figure 1.
Global minimum structures of large clusters, where the organization of the argon atoms around the lithium ion (in magenta) are indicated by different colors according to the -Ar distance (-Ar): (cyan tubes); (pink tubes); (green tubes); (blue tubes); (grey balls).
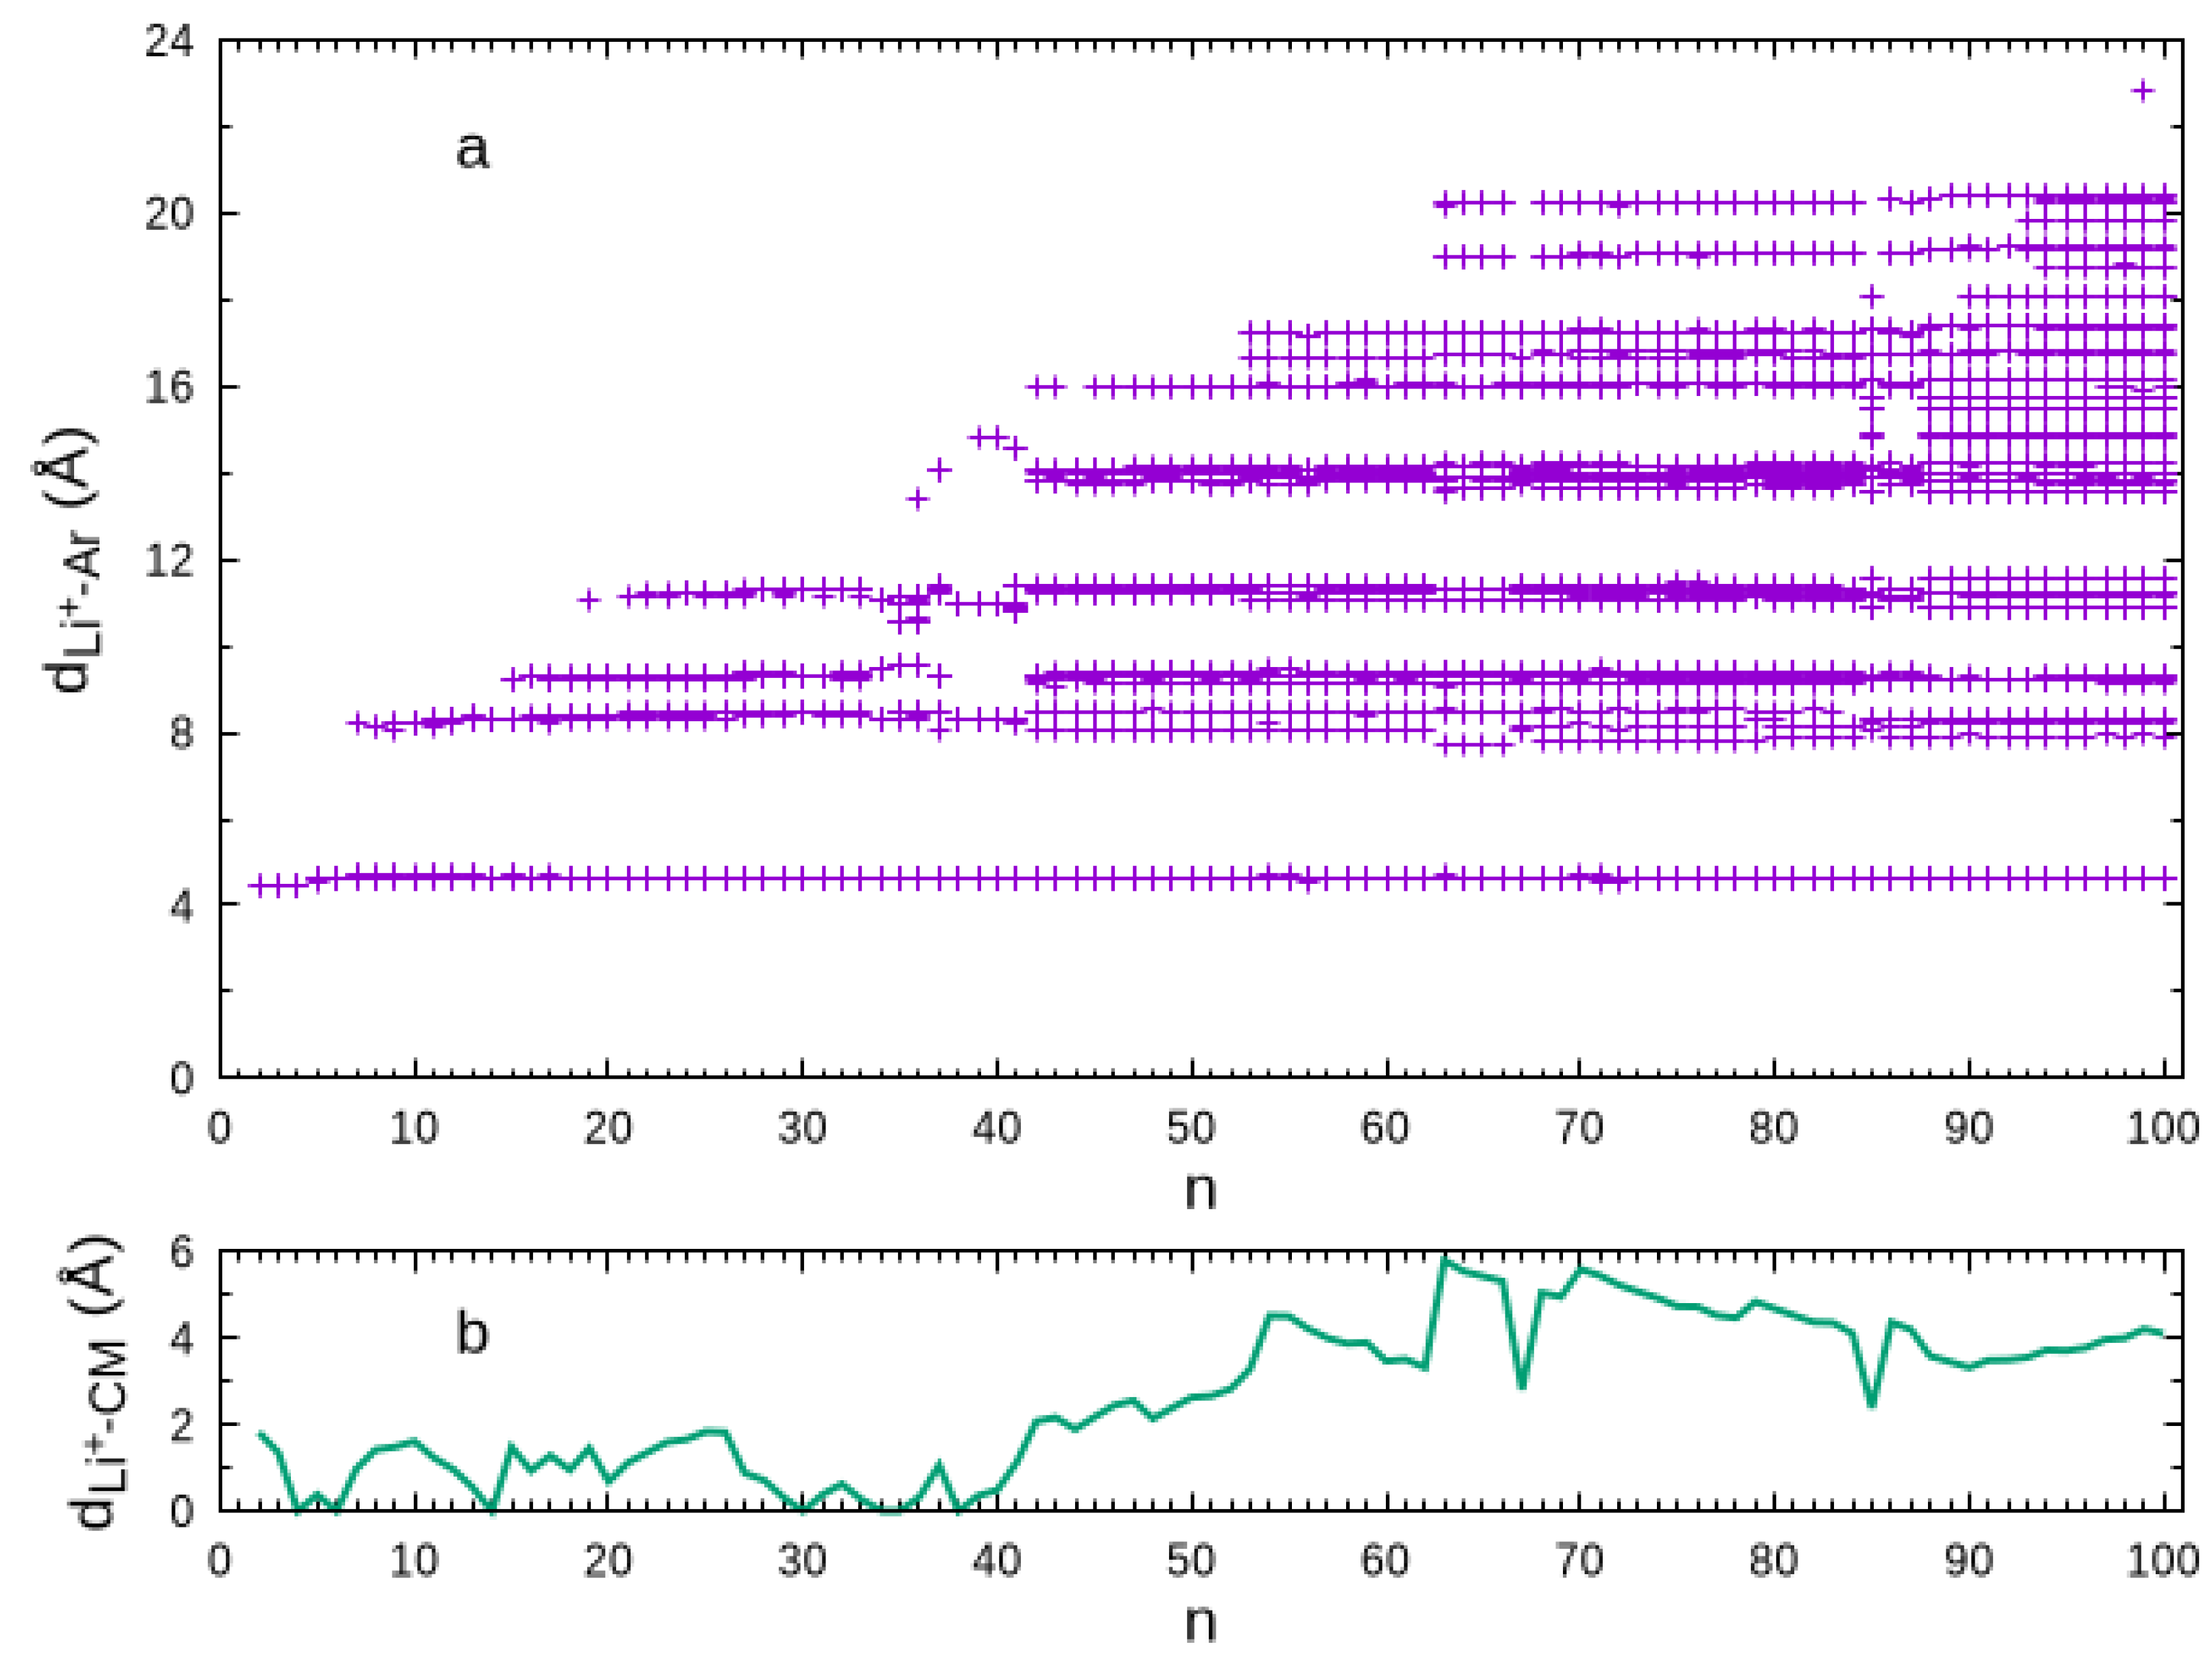
This behavior is perhaps better highlighted by the scatter plot of the -Ar distances displayed in Figure 2. Clearly, the first solvation shell is defined by the set of -Ar distances slightly above for all cluster sizes. Conversely, the -Ar distances of atoms in the second solvation shell are shown to vary from ∼ to ∼. The variation of the -Ar distances in the third solvation shell is smaller, but the separation between this shell and the second one is less than for most of the global minimum structures. The first argon atom in the fourth solvation shell arises for at a -Ar distance visibly longer than those for the atoms in the third solvation shell, and such separation is maintained for larger cluster sizes. The construction of the fourth solvation shell is suddenly interrupted for , the global minimum of which is a very compact fcc structure. This compact structure proceeds up to , while the fourth solvation shell begins again to be built up. Furthermore, we may observe, in Figure 1, that an even more external argon atom appears for . As the microsolvation cluster grows up, these external argon atoms tend to accumulate on one part of the surface (instead of spreading around the structure), mainly nearby the fourth solvation shell so that one can be hardly distinguished from the other. In a certain way, it is legitimate to consider such external argon atoms as forming a subcluster on the surface of the microsolvation cluster, which is essentially not affected by the ion. As shown in Figure 2b, such accumulation of external argon atoms contributes to the lithium ion becoming more off-center in the cluster for .
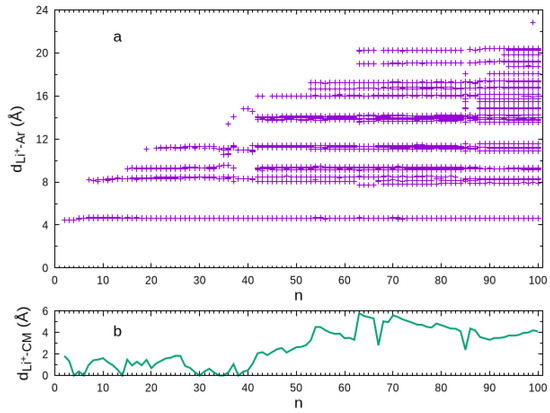
Figure 2.
Scatter plot of the -Ar distances (Panel a) and the -center of the cluster distance (Panel b) as a function of the size.
Another interesting feature of these large clusters that can be observed in Figure 2a is the quasi-continuous distribution of the -Ar distances for the external argon atoms. Indeed, it is apparent from this figure for clusters above that the external atoms spawn -Ar distances very close to each other for . Thus, it becomes impossible to assign a fourth solvation shell for such large clusters.
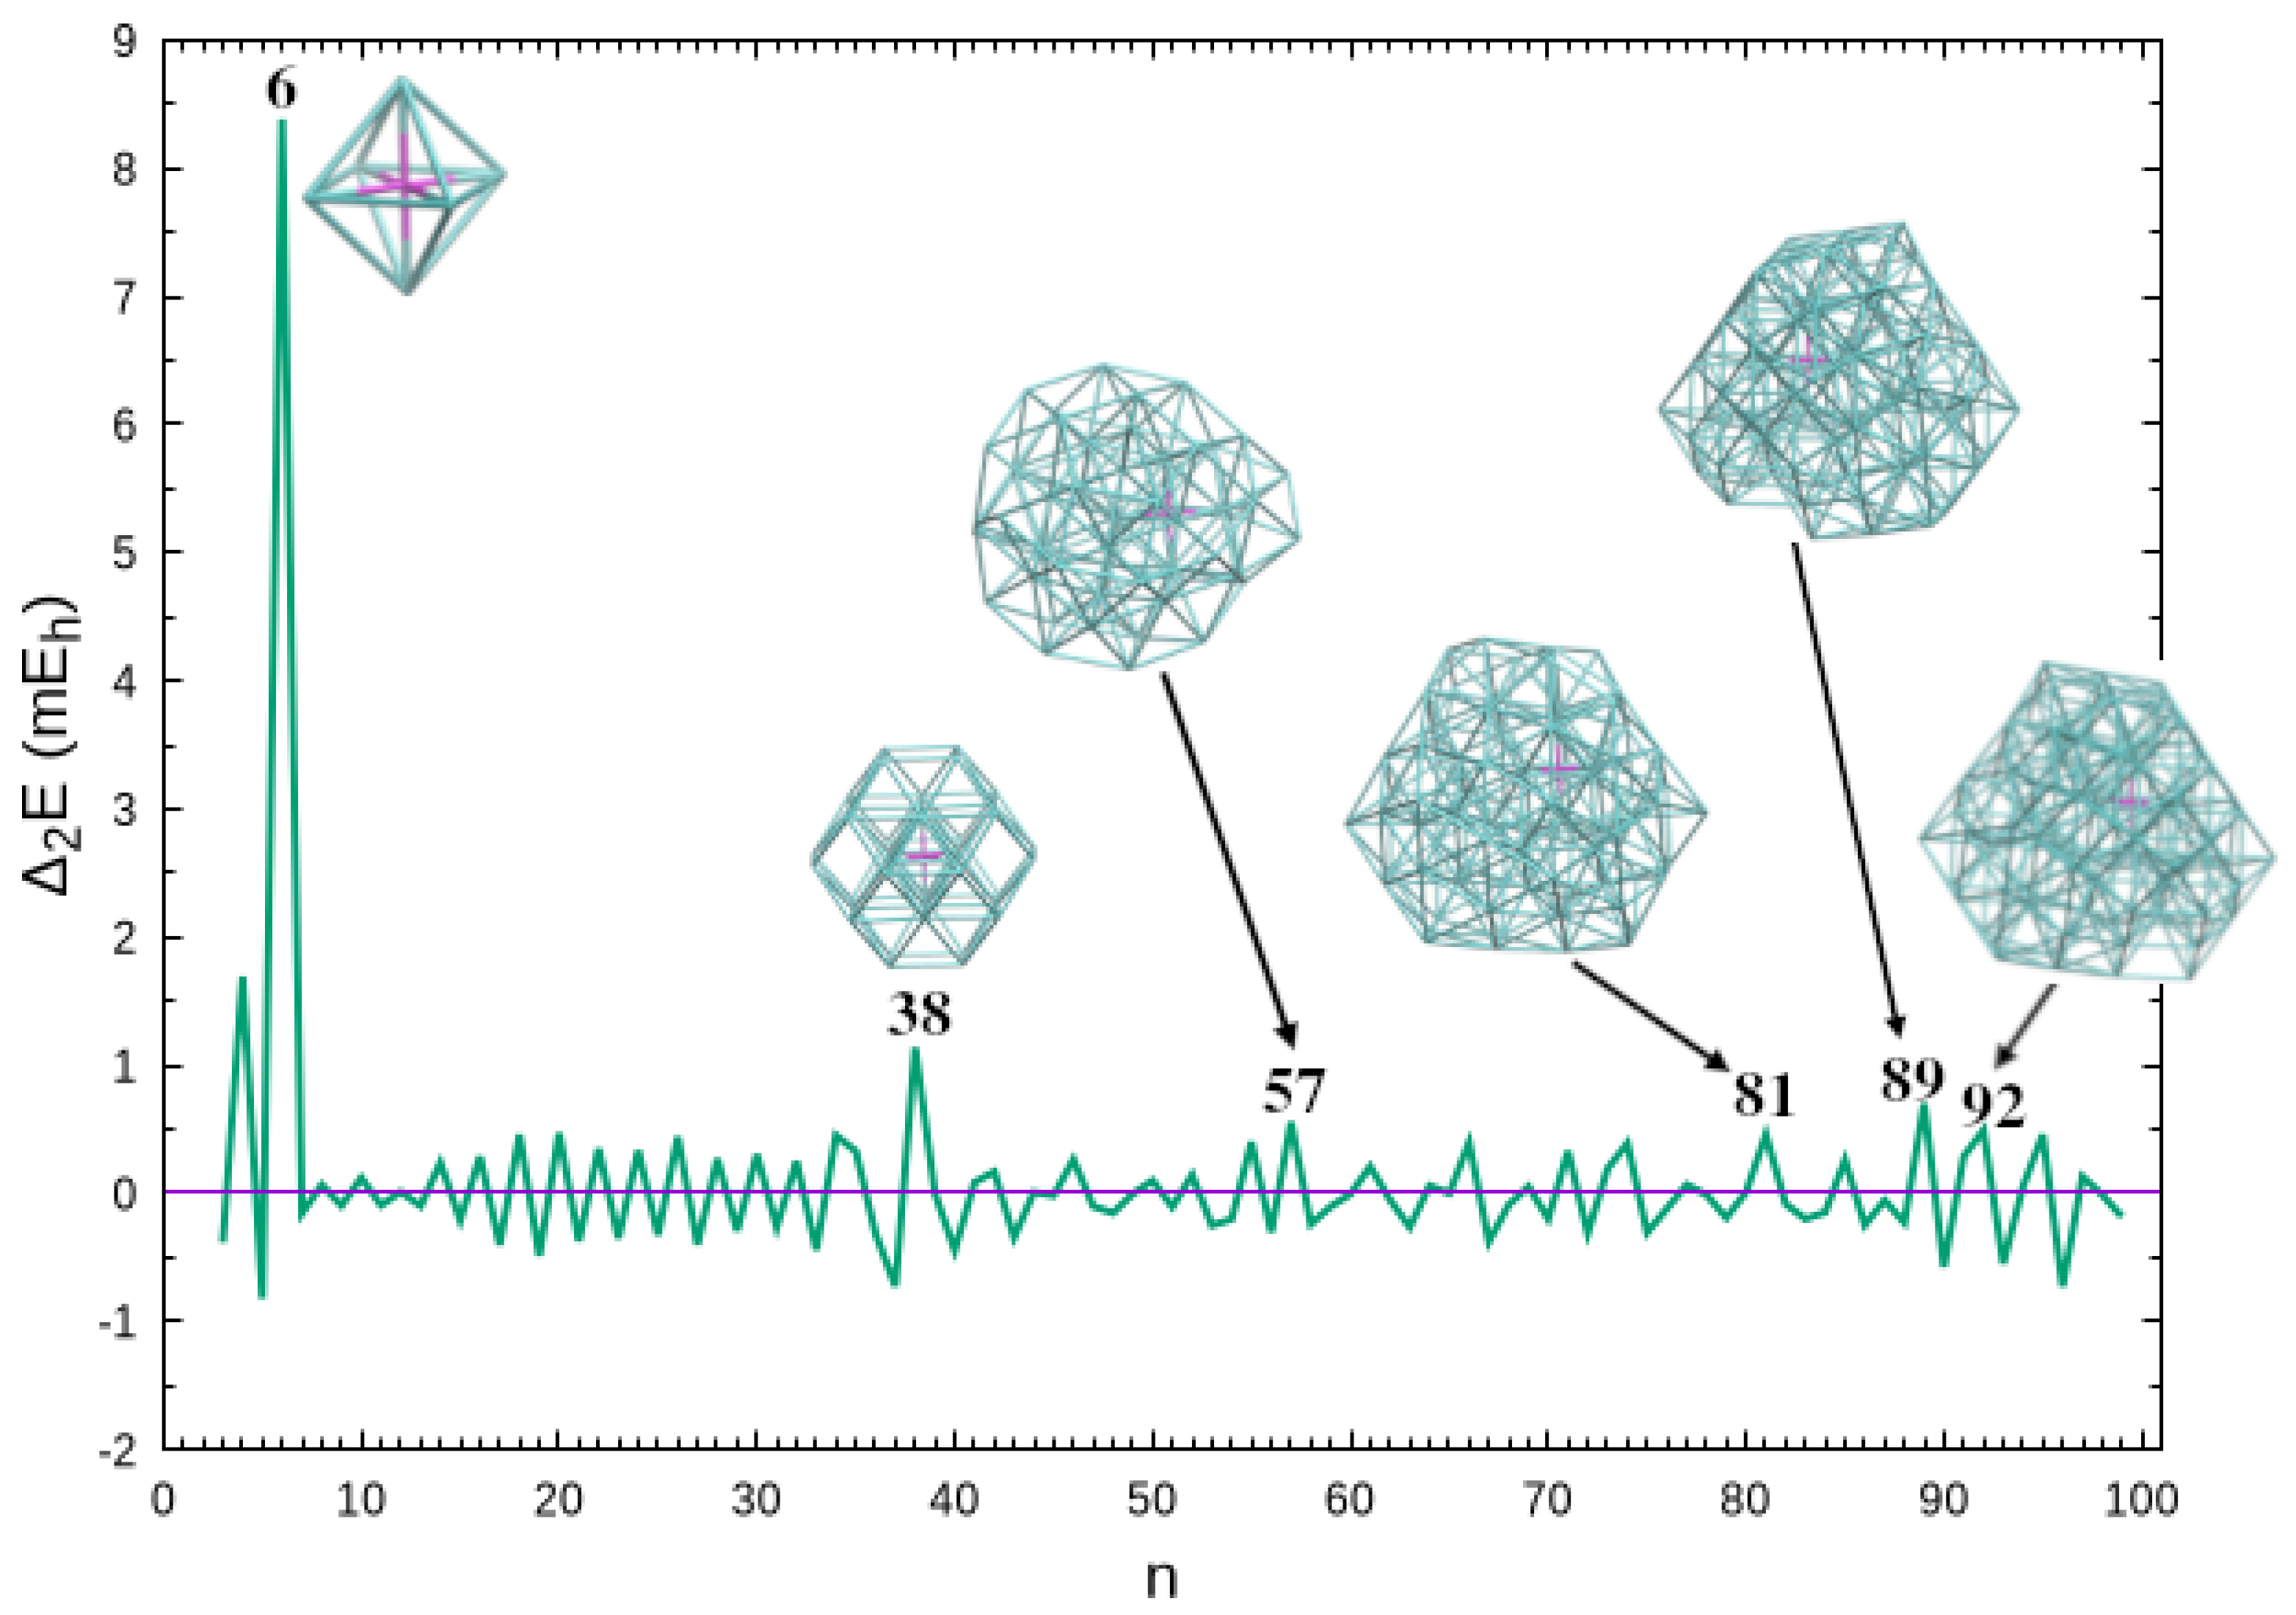
Now, we turn the discussion to the relative stability of clusters. The maxima of the second energy difference, that is,
are usually designated as “magic numbers”, since they correspond to clusters that are particularly stable in comparison with the corresponding neighbor sizes; in Equation (5), , , are the energies of clusters with n, , and argon atoms, respectively. We observe in Figure 3 that the highest value of arises for closure of the first solvation shell at . As previously reported [23], another significant magic number appears for the octahedral structure of the cluster. Whereas the neighbor and clusters have atoms in the fourth solvation shell (three and one, respectively), shows a closed third solvation shell (cf. Figure S2 in Supplementary Information), which may justify its relative stability. It is also apparent from Figure 3 that other important magic numbers arise for larger clusters: , , and . It is interesting to notice that the magic number for appears to be also present in the mass spectrum of clusters reported by Froudakis et al. [43]. In contrast to and where is at the geometric center of the cluster, the magic numbers of larger systems are assigned to structures with an off-center ion (in comparison with a corresponding neighbor size cluster); see also Figure 2b. Nonetheless, it is interesting to notice that, within the present approximation for PES, symmetry appears to play a role in relative stability, even for large clusters. In fact, all the magic number structures in Figure 3 are more symmetric than the neighbor counterparts (see also the corresponding symmetry point groups given along with the energies and coordinates in Supplementary Information).
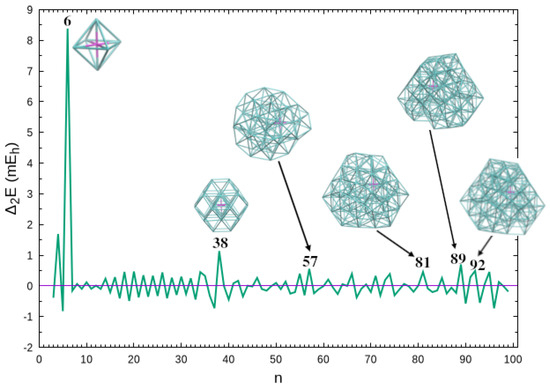
Figure 3.
Second energy difference as a function of cluster size. Also shown are the structures corresponding to the most significant “magic numbers”, i.e., , and 92. The corresponding symmetry point groups are ( and 38), (), () and ( and 92).
3.2. PTMC Calculations
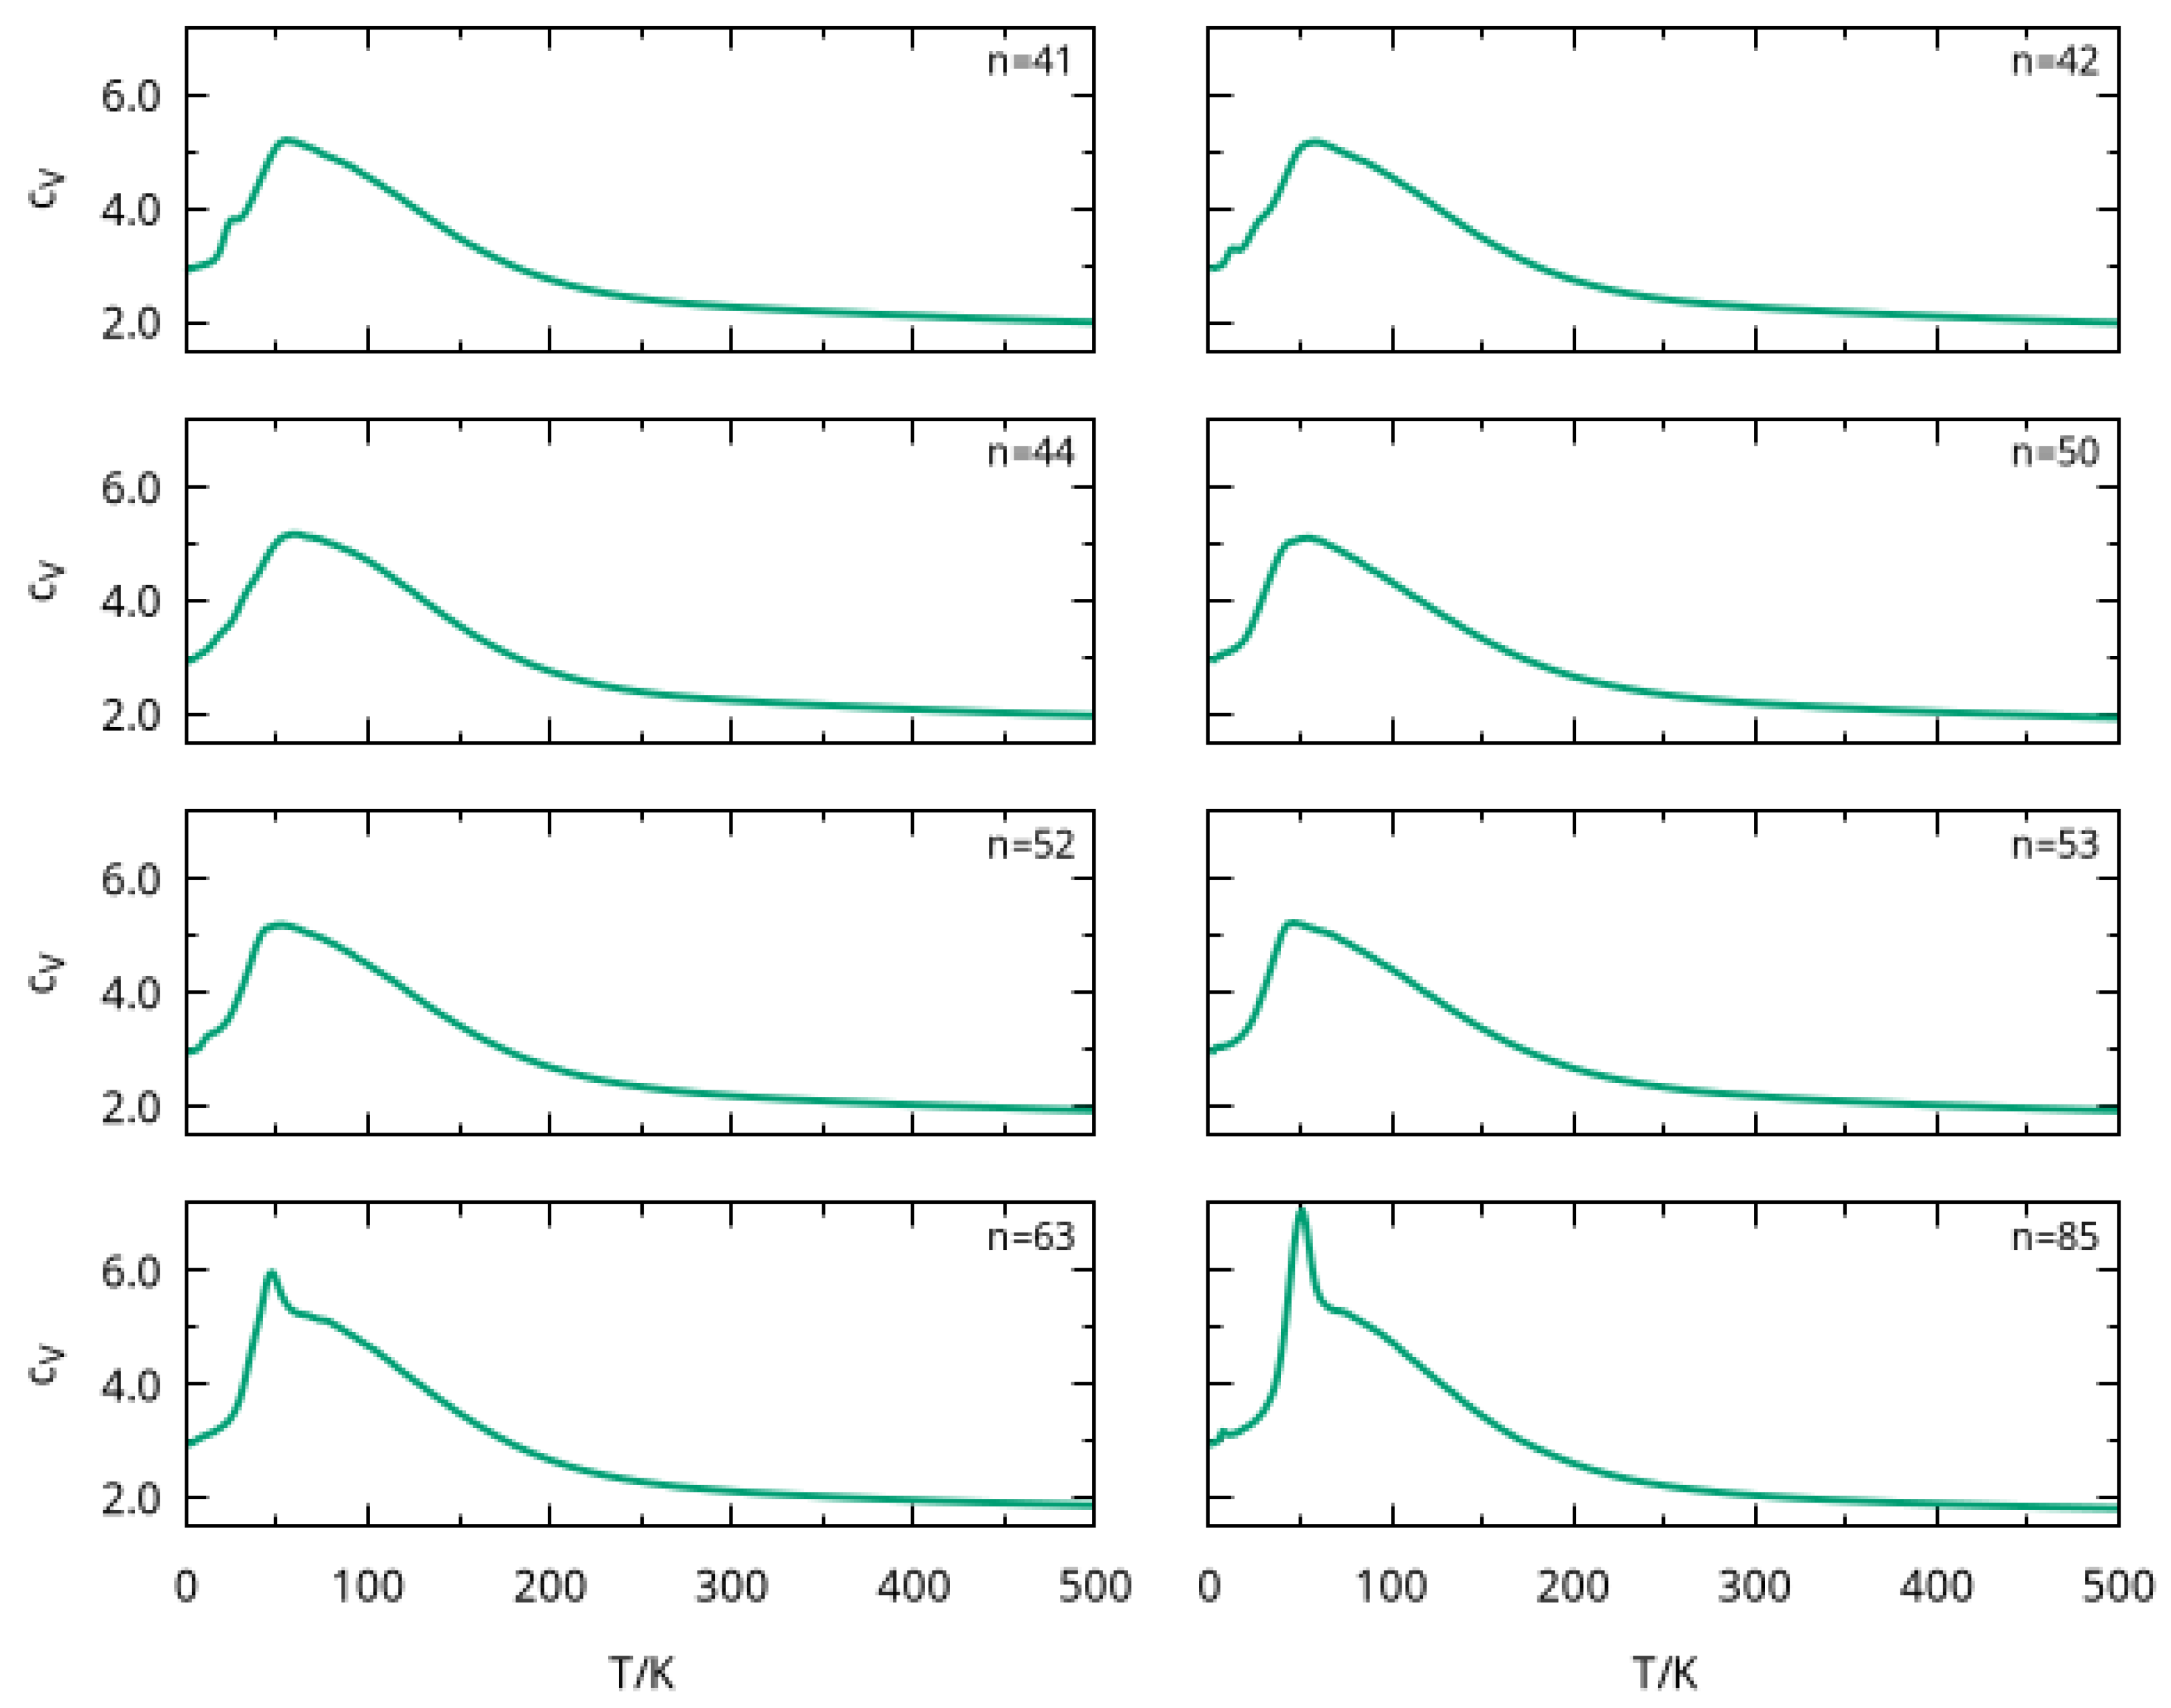
In order to gain insight about structural transitions and dissociation of large clusters, we calculated the heat capacity at constant volume as a function of temperature by employing parallel tempering Monte Carlo simulations. The values were obtained by averaging over two runs of the PTMC program (as described in Section 2). The curves so obtained are represented in Figure 4 for six cluster sizes, i.e., , 42, 44, 50, 52, 53, 63, and 85. We noticed from this figure that a strong peak arises at for all cluster sizes, which may be attributed to the melting of the most external solvation shells. In fact, external argon atoms were loosely attracted by the ion and, as their number increased with cluster size, the corresponding peaks showed a larger amplitude for and . A similar trend was observed in a PTMC calculation for rare-gas clusters (including ), where the melting peak became sharper with the increasing size of the cluster [44].
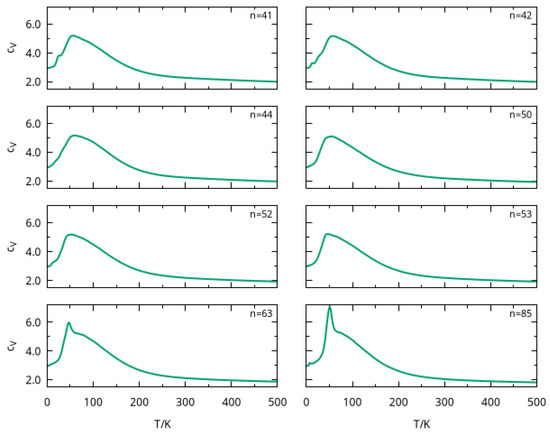
Figure 4.
Heat capacity as a function of temperature for large clusters, with , 42, 44, 50, 52, 53, 63, and 85.
In turn, this behavior in the curve was observed in a previous work [24], where the clusters with , 34 and 38 also presented a peak around . In that paper [24], the peak was associated to the melting of the external solvation shell, which is likely to be similar for the clusters studied here. Furthermore, the amplitude of such peak for smaller cluster sizes in Figure 4 is similar to that previously reported [24] for , whose global minimum structure has a completed third solvation shell with 24 argon atoms (see Table S2 and Figure S2). Indeed, the total number of argon atoms in the external solvation shells for , 42, 44, 50, 52, and 53 did not differ too much from that value (cf. Table S2).
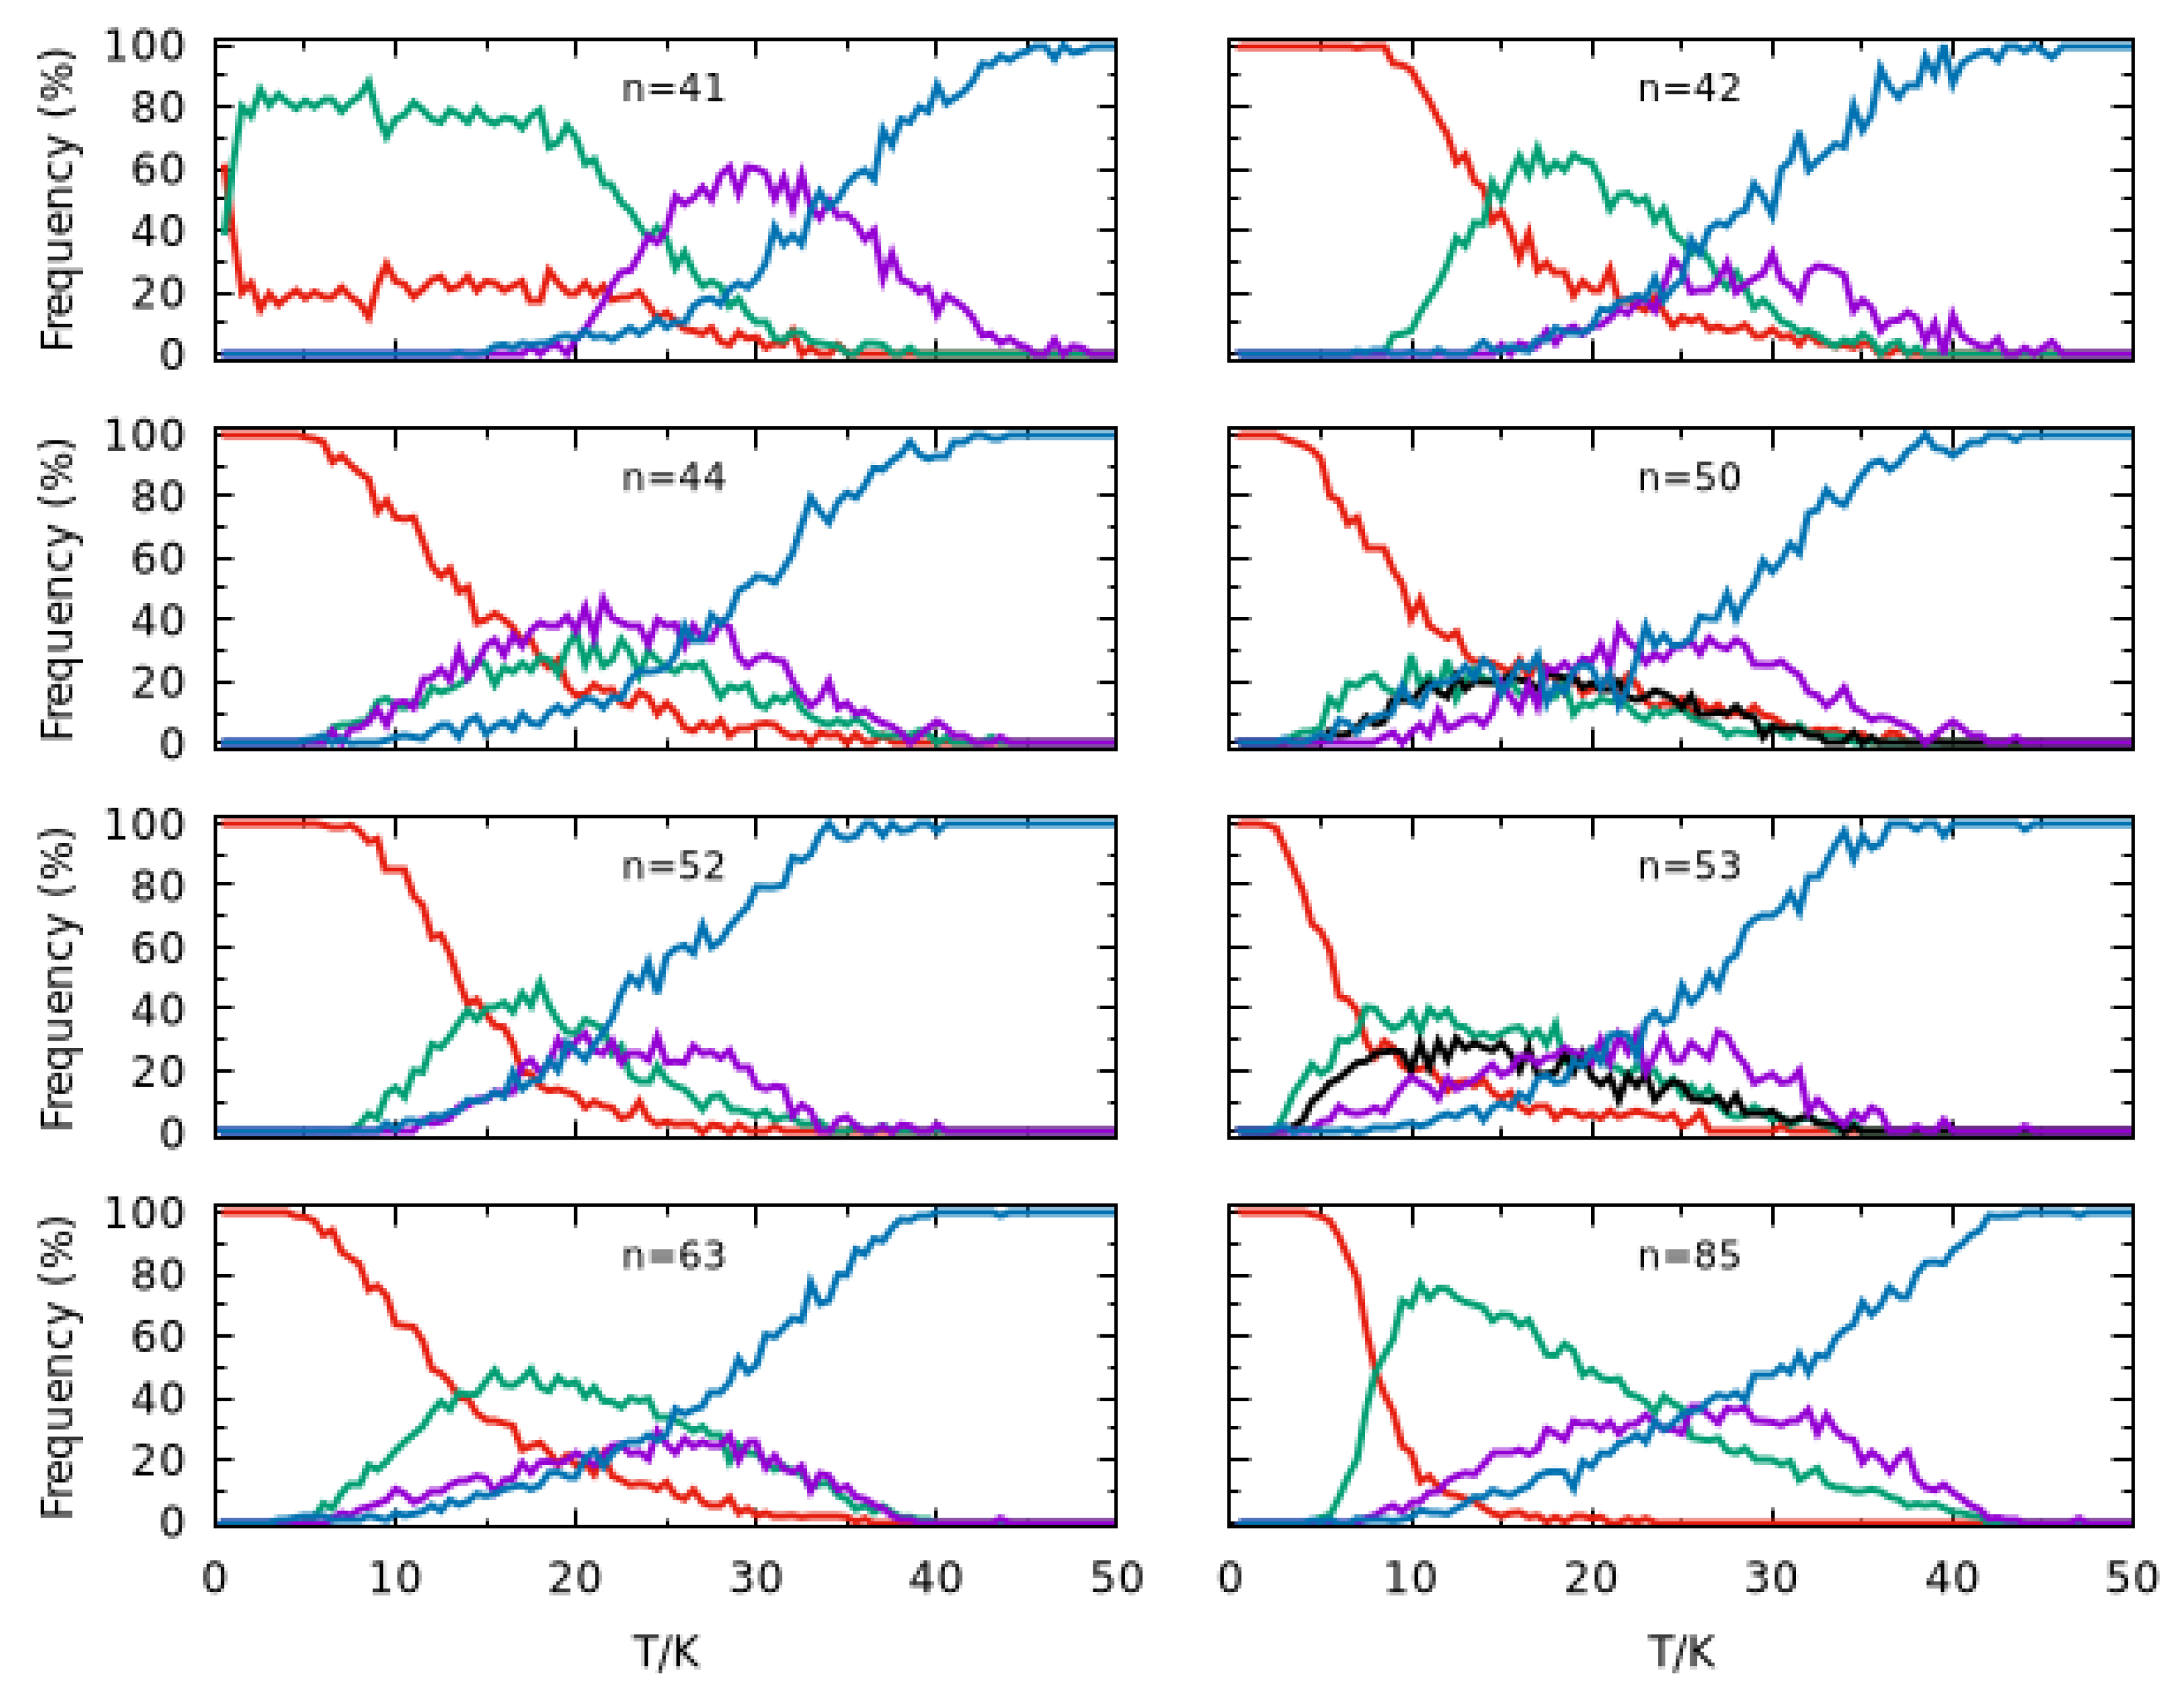
This prominent peak as well as other significant features that arise in the heat capacity curves can be rationalized by plotting the frequency of appearance of different structural motifs in the simulations as a function of temperature for each cluster size. Thus, we display in Figure 5 the frequency of appearance of various types of structures, namely the global minimum, the second-lowest minimum and, for and , the third-lowest minimum detected in the PTMC simulations; such main configurations are shown in Figure 6 for each cluster size. Also included in each panel of Figure 5 are two additional lines, which report the cumulative values of frequency of the structures that appear in the simulation less than 2% of the time (blue curve) and those arising between 2% and 20% of the time at least at one temperature (magenta curve). The former corresponds to structures that present a certain degree of fragmentation (i.e., with atoms separated from the other ones). This curve reaches essentially 100% for all cluster sizes when the temperature approaches , which is compatible with the position of the heat capacity prominent peak (Figure 4) already attributed to the melting of external solvation shells.

Figure 5.
Frequency of main configurations arising in the PTMC calculations for (n = 41, 42, 44, 50, 52, 53, 63 and 85) clusters. The red curve refers to the global minimum structure (labeled by A in Figure 6), while the green one is for the second lowest energy minimum (labeled by B in Figure 6). In turn, the black curve for n = 50 and 53 refers to another minimum structure with a frequency maximum around 20% (labeled by C in Figure 6). Finally, the magenta curve represents other structures which appear with frequencies between 2% and 20%, while the blue curve represents the total frequency of the remaining structures (all having frequencies lower than 2%), i.e., those not included in the other curves.
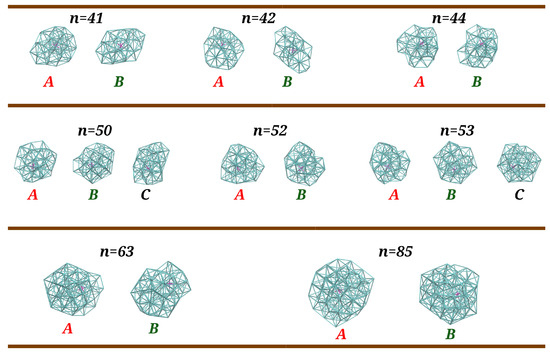
Figure 6.
Main configurations arising in the PTMC calculations for (n = 41, 42, 44, 50, 52, 53, 63, and 85) clusters whose frequencies of appearance are represented in Figure 5. The corresponding RMSD values for the best overlap between structures A and B are 2.2 Å, 3.0 Å, 2.1 Å, 2.9 Å, 2.6 Å, 1.4 Å, and 2.7 Å, while energy differences (in ) are 0.01, 0.73, 0.21, 0.12, 0.58, 0.13, 0.28, and 0.47, respectively. For and , the RMSD values for the best overlap between structures A and C (B and C) are 3.2 Å (2.6 Å) and 2.4 Å (1.6 Å), respectively, while the corresponding energy differences between structures A and C are and .
We observe, in Figure 5, that, in general, the global minimum is the dominant structure at low temperatures. An exception arises for , where the two lowest-energy structures (A and B in Figure 6) have similar probabilities at and, after a small increase in temperature, structure B becomes the dominant one; a similar feature was previously observed for [24]. Despite an unambiguous structural difference between A and B, i.e., the root mean square deviation (RMSD) is 2.2 Å (see also Figure 6), it should be mentioned that the two structures are energetically quasi-degenerated (). This is compatible with a solid–solid transition involving mainly the atoms on the surface, similar to what has been also reported for Lennard–Jones clusters [45]; by contrast with , structural transitions in pure argon clusters, such as , , and , have been associated to strong peaks in the corresponding heat capacity curves [46]. Then, structures A and B maintain approximately the same frequencies (∼ for A and ∼ for B) up to , when a set of other structures with relatively small probability (represented by the magenta curve) begin to appear. At , such structures become dominant over A and B (whose frequencies fall down), which justifies the small shoulder that arises in the corresponding heat capacity curve. A similar structural transition is also perceived in the heat capacity at for , which corresponds to a dropping value of the frequency of structure A whereas structure B becomes the dominant one (cf. Figure 5). A different situation occurs for , where no shoulder (or small maximum) is visible in the heat capacity curve prior the melting peak at around . In contrast to , the decrease in global minimum frequency at low temperatures is now more gradual and there is not a clear dominance of one type of structure over the others. In addition, the frequency of fragmented structures increases at a slow rate and is already non-negligible at ∼, the temperature at which structure B and other low-frequency structures reach their maximum frequency of appearance.
Regarding cluster sizes and 53, a structural transition between A and B is only observed for (i.e., a very small shoulder in the heat capacity curve at ). Indeed, the frequency of Structure B increases as the frequency of Structure A decreases, but its maximum value does not reach 50% due to the concomitant appearance of other structures (magenta and blue curves in Figure 5), which explains the very smooth shoulder for in comparison to those for and (cf. Figure 4). As for and , a third distinct structure that reaches frequencies above 20% (designated as C in Figure 6) is observed in PTMC simulations at low temperatures. However, none of Structures B and C become dominant as the frequency of Structure A drops down. In fact, low-frequency and dissociated structures (magenta and blue curves in Figure 5) begin to arise at very low temperatures, which leads the corresponding heat capacity curves to increase at a higher rate for .
It is apparent from Figure 5 that the frequency of Structure A decays at a slower rate for than for . Such rapid decrease in is accompanied by a prompt appearance of Structure B, which becomes dominant (i.e., with a frequency greater than 50%) at , thus leading to a small peak in the corresponding heat capacity curve (see Figure 4). By inspection of Figure 6, we may conclude that the structural transitions reported here correspond to slight rearrangements of the most external argon atoms, which is compatible with small RMSD values and energy differences (less than ) among such structures. It is worth noting that similar premelting transitions, which are also associated to surface rearrangements, have been reported for Lennard–Jones clusters by several authors [47,48,49,50].
Finally, we notice in Figure 4 that the curve becomes broader after the prominent dissociation peak, which is independent from the cluster size. A similar feature has been observed for smaller clusters and it has been attributed to the melting of the first solvation shell, which is expected to occur at higher temperatures [24].
4. Conclusions
We performed a global optimization study of the clusters resulting from the microsolvation of by argon. Putative global minimum structures were obtained for cluster sizes between and . In addition, we also employed the PTMC method to calculate the heat capacity as a function of temperature for some specific cluster sizes (namely , and 85).
We concluded from the present study that global minimum structures of large clusters essentially maintain the number of argon atoms in the second solvation shell (i.e., 16 argon atoms). However, a different organization of the argon atoms around occurs for (with 8 argon atoms in the second solvation shell) and, mainly, for (with 14). Conversely, the third and especially the fourth solvation shells show significant variations in the number of argon atoms with cluster size, which is compatible with very fluxional structures. It is also clear that the third and fourth solvation shells are not totally fulfilled for clusters up to . For large clusters, the argon atoms are mainly located on specific regions of the cluster instead of spreading all around the structure, and the ion becomes quite off-centered. This effect results from the fact that, at large -Ar distances, the influence of the ion is not relevant in comparison with the Ar-Ar interaction, and hence those argon atoms tend to accumulate as close as possible to each other. As expected, this becomes more acute for the most external argon atoms. Thus, we can hardly define a true fourth solvation shell as well as other more external shells. Nonetheless, magic number structures tend to be more symmetric than their neighbor-size clusters.
Regarding PTMC calculations, we noticed that the melting of the most external solvation shells (from the second shell forward) occurs at around 50 K for all the large cluster sizes analyzed in this work. Due to the larger number of external argon atoms, the intensity of the corresponding heat capacity peak was greater for and than for the smaller sizes. Moreover, such a prominent peak of the heat capacity became broader for high temperatures, which is a clear thermodynamic signature of a gradual fusion of the most internal solvation shells. In turn, it was possible to identify two or three (for and ) most prevalent structures in the simulations at very low temperatures, and structural transitions could be observed for some cluster sizes. Such structures are, however, quasi-degenerated, since the energy difference among them is less than . In turn, tiny changes in the slope of the curve that occurred at pre-melting (low) temperatures for some clusters can be essentially associated to rearrangements on the surface of the clusters, which lead to the appearance of structures that mainly differ in the position of argon atoms from the most external solvation shells. In general, the global minimum structure is the prevalent one at very low temperatures, but it is essentially absent from the simulation for , whereas dissociated clusters begin to appear and dominate the simulation. For low temperatures (typically, below 30 K), it was possible to observe a great amount of structures, each one with low prevalence in the simulation, which is another clear signature of the fluxional character of these large clusters.
The results from this work corroborate the idea previously advanced [24] that the first solvation shell of the clusters has a rigid-like character, while external solvation shells (including the second one) are essentially fluid-like. In other words, the cluster may be seen as a “snowball”, i.e., similarly to the solid-like sphere of helium atoms surrounding an ion that was proposed many years ago by Johnson and Glaberson [51]. Indeed, the concept of a “snowball” has been applied in the last years not only for the solvation of ions with helium atoms [52]; it has also been extended for the interpretation of ion solvation by molecular solvents [53].
As a final remark, we must say that the study of large clusters suggests the possibility of reaching a value of n from which the presence of the ion becomes irrelevant. The identification of such cluster size may be achieved comparing the melting temperatures of with those obtained for pure clusters. We observe, from this work and our previous calculations [24], that the melting temperature decreased from for to for and remains at this latter value for larger clusters; was the largest cluster size for which the melting temperature was obtained. By contrast, the PTMC results of Pahl et al. [44] for clusters showed increasing values of the melting temperature with cluster size (from for up to for , with the experimental melting temperature of the bulk being [54]). In addition, our melting peaks were not so sharp as those for for the same cluster size. Thus, we expect that the presence of is irrelevant at sizes beyond the range studied in this work, i.e., for cluster sizes with sharper peaks and melting temperatures approaching those for clusters with similar sizes.
Supplementary Materials
The following are available at https://www.mdpi.com/article/10.3390/sym16020229/s1, Figure S1: Fraction of the total binding energy corresponding to three-body interactions in clusters, Figure S2: Solvation shells in small clusters, Table S1: Values of the parameters employed in the parallel-tempering Monte Carlo calculations, Table S2 and Table S3: Distribution of argon atoms by different solvation shells. References [55,56,57] are cited in the supplementary materials.
Author Contributions
Conceptualization, J.M.C.M. and F.V.P.; methodology, J.M.C.M. and F.V.P.; software, J.M.C.M. and F.V.P.; validation, J.M.C.M.; formal analysis, J.M.C.M. and F.V.P.; investigation, J.M.C.M.; resources, J.M.C.M. and F.V.P.; data curation, J.M.C.M. and F.V.P.; writing—original draft preparation, J.M.C.M.; writing—review and editing, J.M.C.M. and F.V.P.; visualization, J.M.C.M. and F.V.P.; project administration, J.M.C.M.; funding acquisition, J.M.C.M. and F.V.P. All authors have read and agreed to the published version of the manuscript.
Funding
This research was funded by Fundação para a Ciência e a Tecnologia (FCT) through the programmes UIDB/00313/2020 and COMPETE.
Data Availability Statement
Data are contained within the article and supplementary material.
Acknowledgments
We acknowledge the financial support provided by the Coimbra Chemistry Centre (CQC-IMS), which is financed by the Portuguese “Fundação para a Ciência e a Tecnologia” (FCT) through the programmes UIDB/00313/2020 and COMPETE, and the Brazilian “Coordenação de Aperfeiçoamento de Pessoal de Nível Superior” (CAPES) - Finance Code 001. This publication is also based upon the work of COST Action CA21101 “Confined molecular systems: from a new generation of materials to the stars” (COSY) supported by COST (European Cooperation in Science and Technology). This work was mostly carried out with the computational resources hosted at the Molecular Modeling and Computational Simulation Laboratory (Department of Chemistry, University of Coimbra). We are also grateful for the provision of computational time in the supercomputer resources hosted at Laboratório de Computação Avançada, Universidade de Coimbra, and Centro Nacional de Computação (CESUP), Universidade Federal do Rio Grande do Sul.
Conflicts of Interest
The authors declare no conflict of interest. The funders had no role in the design of the study; in the collection, analyses, or interpretation of data; in the writing of the manuscript, or in the decision to publish the results.
References
- Bäck, T.; Schwefel, H.P. An Overview of Evolutionary Algorithms for Parameter Optimization. Evol. Comput. 1993, 1, 1–23. [Google Scholar] [CrossRef]
- Hartke, B. Global Geometry Optimization of Clusters Using Genetic Algorithms. J. Phys. Chem. 1993, 97, 9973–9976. [Google Scholar] [CrossRef]
- Gregurick, S.K.; Alexander, M.H.; Hartke, B. Global geometry optimization of (Ar)n and B(Ar)n clusters using a modified genetic algorithm. J. Chem. Phys. 1996, 104, 2684–2691. [Google Scholar] [CrossRef]
- Wales, D.J.; Doye, J.P.K. Global Optimization by Basin-Hopping and the Lowest Energy Structures of Lennard-Jones Clusters Containing up to 110 Atoms. J. Phys. Chem. A 1997, 101, 5111–5116. [Google Scholar] [CrossRef]
- Li, Z.; Scheraga, H.A. Structure and free energy of complex thermodynamic systems. J. Mol. Struct. THEOCHEM 1988, 179, 333–352. [Google Scholar] [CrossRef]
- Iwamatsu, M. Applying evolutionary programming to structural optimization of atomic clusters. Comput. Phys. Commun. 2001, 142, 214–218. [Google Scholar] [CrossRef]
- Alexandrova, A.N.; Boldyrev, A.I. Search for the (n = 5–7) Lowest-Energy Structures Using the ab Initio Gradient Embedded Genetic Algorithm (GEGA). Elucidation of the Chemical Bonding in the Lithium Clusters. J. Chem. Theory Comput. 2005, 1, 566–580. [Google Scholar] [CrossRef] [PubMed]
- Alexandrova, A.N.; Boldyrev, A.I.; Fu, Y.J.; Yang, X.; Wang, X.B.; Wang, L.S. Structure of the Nax (x = 1–4) clusters via ab initio genetic algorithm and photoelectron spectroscopy. J. Chem. Phys. 2004, 121, 5709–5719. [Google Scholar] [CrossRef] [PubMed]
- Schulz, F.; Hartke, B. Dodecahedral Clathrate Structures and Magic Numbers in Alkali Cation Microhydration Clusters. ChemPhysChem 2002, 3, 98–106. [Google Scholar] [CrossRef] [PubMed]
- Hartke, B.; Charvat, A.; Reich, M.; Abel, B. Experimental and theoretical investigation of microsolvation of Na+-ions in the gas phase by high resolution mass spectrometry and global cluster geometry optimization. J. Chem. Phys. 2002, 116, 3588–3600. [Google Scholar] [CrossRef]
- Hernández-Rojas, J.; Wales, D.J. Global minima for rare gas clusters containing one alkali metal ion. J. Chem. Phys. 2003, 119, 7800. [Google Scholar] [CrossRef]
- Schulz, F.; Hartke, B. A new proposal for the reason of magic numbers in alkali cation microhydration clusters. Theor. Chem. Acc. 2005, 114, 357. [Google Scholar] [CrossRef]
- González, B.S.; Hernández-Rojas, J.; Wales, D.J. Global Minima and Energetics of Li+(H2O), and Ca2+(H2O)(n) Clusters for n <= 20. Chem. Phys. Lett. 2005, 412, 23–28. [Google Scholar]
- Rhouma, M.B.H.; Calvo, F.; Spiegelman, F. Solvation of Na+ in argon clusters. J. Phys. Chem. A 2006, 110, 5010. [Google Scholar] [CrossRef]
- Marinetti, F.; Bodo, E.; Gianturco, F.A. Microsolvation of an Ionic Dopant in Small 4He Clusters: OH+(3Σ)(4He)N via Genetic Algorithm Optimizations. ChemPhysChem 2007, 8, 93–100. [Google Scholar] [CrossRef] [PubMed]
- Alexandrova, A.N. H·(H2O)n Clusters: Microsolvation of the Hydrogen Atom via Molecular ab Initio Gradient Embedded Genetic Algorithm (GEGA). J. Phys. Chem. A 2010, 114, 12591–12599. [Google Scholar] [CrossRef] [PubMed]
- Llanio-Trujillo, J.L.; Marques, J.M.C.; Pereira, F.B. New Insights on Lithium-Cation Microsolvation by Solvents Forming Hydrogen-Bonds: Water Versus Methanol. Comput. Theor. Chem. 2013, 1021, 124–134. [Google Scholar] [CrossRef]
- Pereira, F.B.; Marques, J.M.C.; Leitão, T.; Tavares, J. Analysis of Locality in Hybrid Evolutionary Cluster Optimization. In Proceedings of the 2006 IEEE Congress on Evolutionary Computation, Vancouver, BC, Canada, 16–21 July 2006; Volume 1–6, pp. 2270–2277. [Google Scholar]
- Pereira, F.B.; Marques, J.M.C. A Study on Diversity for Cluster Geometry Optimization. Evol. Intell. 2009, 2, 121–140. [Google Scholar] [CrossRef]
- Marques, J.M.C.; Pereira, F.B. An Evolutionary Algorithm for Global Minimum Search of Binary Atomic Clusters. Chem. Phys. Lett. 2010, 485, 211–216. [Google Scholar] [CrossRef]
- Marques, J.M.C.; Jesus, W.S.; Prudente, F.V.; Pereira, F.B.; Lourenço, N. Revealing Energy Landscapes of Atomic Clusters by Applying Adaptive Bio-Inspired Algorithms. In Physical Chemistry for Chemists and Chemical Engineers: Multidisciplinary Research Perspectives; Vakhrushev, A.V., R. Haghi, J.V.J., Eds.; Apple Academic Press: Oakville, ON, Canada, 2018; pp. 47–74. [Google Scholar]
- Slama, M.; Laajimi, M.; Ghalla, H.; Ben El Hadj Rhouma, M. Structures and stability of K+ cation solvated in Arn clusters. J. Mol. Graph. Model. 2024, 127, 108692. [Google Scholar] [CrossRef] [PubMed]
- Prudente, F.V.; Marques, J.M.C.; Pereira, F.B. Solvation of Li+ by Argon: How Important are Three-Body Forces? Phys. Chem. Chem. Phys. 2017, 19, 25707–25716, Erratum in Phys. Chem. Chem. Phys. 2018, 20, 16877–16882. [Google Scholar] [CrossRef]
- Guimarães, M.N.; de Almeida, M.M.; Marques, J.M.C.; Prudente, F.V. A thermodynamic view on the microsolvation of ions by rare gas: Application to Li+ with argon. Phys. Chem. Chem. Phys. 2020, 22, 10882–10892. [Google Scholar] [CrossRef]
- Jesus, W.S.; Marques, J.M.C.; Prudente, F.V.; Pereira, F.B. Exploring the First-Shell and Second-Shell Structures Arising in the Microsolvation of Li+ by Rare Gases. Int. J. Quantum Chem. 2019, 119, e25860. [Google Scholar] [CrossRef]
- Dunning, T.H., Jr. Gaussian Basis Sets for Use in Correlated Molecular Calculations. I. The Atoms Boron Through Neon and Hydrogen. J. Chem. Phys. 1989, 90, 1007–1023. [Google Scholar] [CrossRef]
- Woon, D.E.; Dunning, T.H., Jr. Gaussian Basis Sets for Use in Correlated Molecular Calculations. III. The Atoms Aluminum Through Argon. J. Chem. Phys. 1993, 98, 1358–1371. [Google Scholar] [CrossRef]
- Cahill, K.; Parsegian, V.A. Rydberg–London Potential for Diatomic Molecules and Unbonded Atom Pairs. J. Chem. Phys. 2004, 121, 10839. [Google Scholar] [CrossRef]
- Aziz, R.A. A highly accurate interatomic potential for argon. J. Chem. Phys. 1993, 99, 4518–4525. [Google Scholar] [CrossRef]
- Pereira, F.B.; Marques, J.M.C.; Leitão, T.; Tavares, J. Designing Efficient Evolutionary Algorithms for Cluster Optimization: A Study on Locality. In Advances in Metaheuristics for Hard Optimization; Springer Natural Computing, Series; Siarry, P., Michalewicz, Z., Eds.; Springer: Berlin, Germany, 2008; pp. 223–250. [Google Scholar]
- Cruz, S.M.A.; Marques, J.M.C.; Pereira, F.B. Improved evolutionary algorithm for the global optimization of clusters with competing attractive and repulsive interactions. J. Chem. Phys. 2016, 145, 154109. [Google Scholar] [CrossRef] [PubMed]
- Zanvettor, C.M.A.; Marques, J.M.C. On the lowest-energy structure of binary Zn-Cd nanoparticles: Size and composition. Chem. Phys. Lett. 2014, 608, 373–379. [Google Scholar] [CrossRef]
- Rodrigues, S.G.; Pais, A.A.C.C.; Marques, J.M.C. Two-dimensional clusters from the self-assembly of oppositely charged particles. Chem. Phys. Lett. 2018, 706, 586–593. [Google Scholar] [CrossRef]
- Jesus, W.S.; Marques, J.M.C.; Prudente, F.V. Microsolvation of Li+ in a Mixture of Argon and Krypton: Unveiling the Most Stable Structures of the Clusters. J. Phys. Chem. A 2019, 123, 2867–2873. [Google Scholar] [CrossRef] [PubMed]
- Andrade, M.D.d.; Jesus, W.S.; Prudente, F.V.; Marques, J.M.C. On the stabilization of the Li+-Li+ interaction by microsolvation with rare-gas atoms. Theor. Chem. Acc. 2021, 140, 65. [Google Scholar] [CrossRef]
- Nocedal, J. Updating quasi-Newton matrices with Limited storage. Math. Comp. 1980, 35, 773–782. [Google Scholar] [CrossRef]
- Liu, D.; Nocedal, J. On the limited memory BFGS method for large scale optimization. Math. Program. B 1989, 45, 503–528. [Google Scholar] [CrossRef]
- Deaven, D.M.; Ho, K.M. Molecular Geometry Optimization with a Genetic Algorithm. Phys. Rev. Lett. 1995, 75, 288–291. [Google Scholar] [CrossRef]
- Prudente, F.V.; Marques, J.M.C. Thermodynamic Signatures of Structural Transitions and Dissociation of Charged Colloidal Clusters: A Parallel Tempering Monte Carlo Study. Molecules 2022, 27, 2581. [Google Scholar] [CrossRef]
- Okabe, T.; Kawata, M.; Okamoto, Y.; Mikami, M. Replica-exchange Monte Carlo method for the isobaric-isothermal ensemble. Chem. Phys. Lett. 2001, 335, 435–439. [Google Scholar] [CrossRef]
- Lingenheil, M.; Denschlag, R.; Mathias, G.; Tavan, P. Efficiency of exchange schemes in replica exchange. Chem. Phys. Lett. 2009, 478, 80–84. [Google Scholar] [CrossRef]
- Swendsen, R.H. How the maximum step size in Monte Carlo simulations should be adjusted. Phys. Procedia 2011, 15, 81–86. [Google Scholar] [CrossRef]
- Froudakis, G.E.; Farantos, S.C.; Velegrakis, M. Mass spectra and theoretical modeling of Li+Nen, Li+Arn and Li+Krn clusters. Chem. Phys. 2000, 258, 13–20. [Google Scholar] [CrossRef]
- Pahl, E.; Calvo, F.; Koči, L.; Schwerdtfeger, P. Accurate Melting Temperatures for Neon and Argon from Ab Initio Monte Carlo Simulations. Angew. Chem. Int. Ed. 2008, 47, 8207–8210. [Google Scholar] [CrossRef]
- Mandelshtam, V.A.; Frantsuzov, P.A. Multiple structural transformations in Lennard-Jones clusters: Generic versus size-specific behavior. J. Chem. Phys. 2006, 124, 204511. [Google Scholar] [CrossRef]
- Senn, F.; Wiebke, J.; Schumann, O.; Gohr, S.; Schwerdtfeger, P.; Pahl, E. Melting of “non-magic” argon clusters and extrapolation to the bulk limit. J. Chem. Phys. 2014, 140, 044325. [Google Scholar] [CrossRef]
- Neirotti, J.P.; Calvo, F.; Freeman, D.L.; Doll, J.D. Phase changes in 38-atom Lennard-Jones clusters. I. A parallel tempering study in the canonical ensemble. J. Chem. Phys. 2000, 112, 10340–10349. [Google Scholar] [CrossRef]
- Mandelshtam, V.A.; Frantsuzov, P.A.; Calvo, F. Structural Transitions and Melting in LJ74-78 Lennard-Jones Clusters from Adaptive Exchange Monte Carlo Simulations. J. Phys. Chem. A 2006, 110, 5326–5332. [Google Scholar] [CrossRef]
- Noya, E.G.; Doye, J.P.K. Structural transitions in the 309-atom magic number Lennard-Jones cluster. J. Chem. Phys. 2006, 124, 104503. [Google Scholar] [CrossRef]
- Cezar, H.M.; Rondina, G.G.; da Silva, J.L.F. Parallel tempering Monte Carlo combined with clustering Euclidean metric analysis to study the thermodynamic stability of Lennard-Jones nanoclusters. J. Chem. Phys. 2017, 146, 064114. [Google Scholar] [CrossRef] [PubMed]
- Johnson, W.W.; Glaberson, W.I. Positive Impurity Ions in He II. Phys. Rev. Lett. 1972, 29, 214–217. [Google Scholar] [CrossRef]
- González-Lezana, T.; Echt, O.; Gatchell, M.; Bartolomei, M.; Campos-Martínez, J.; Scheier, P. Solvation of ions in helium. Int. Rev. Phys. Chem. 2020, 39, 465–516. [Google Scholar] [CrossRef]
- Ortiz de Zárate, J.; Bartolomei, M.; González-Lezana, T.; Campos-Martínez, J.; Hernández, M.I.; Pérez de Tudela, R.; Hernández-Rojas, J.; Bretón, J.; Pirani, F.; Kranabetter, L.; et al. Snowball formation for Cs+ solvation in molecular hydrogen and deuterium. Phys. Chem. Chem. Phys. 2019, 21, 15662–15668. [Google Scholar] [CrossRef] [PubMed]
- Lide, D.R. (Ed.) CRC Handbook of Chemistry and Physics, 85th ed.; CRC Press Inc.: Boca Raton, FL, USA, 2005. [Google Scholar]
- Axilrod, B.M.; Teller, E. Interaction of the Van Der Waals Type Between Three Atoms. J. Chem. Phys. 1943, 11, 299–300. [Google Scholar] [CrossRef]
- Muto, Y. Force Between Nonpolar Molecules. Proc. Phys. Math. Soc. Jpn. 1943, 17, 629–631. [Google Scholar] [CrossRef]
- Axilrod, B.M. Triple-Dipole Interaction. I. Theory. J. Chem. Phys. 1951, 19, 719–724. [Google Scholar] [CrossRef]

Disclaimer/Publisher’s Note: The statements, opinions and data contained in all publications are solely those of the individual author(s) and contributor(s) and not of MDPI and/or the editor(s). MDPI and/or the editor(s) disclaim responsibility for any injury to people or property resulting from any ideas, methods, instructions or products referred to in the content. |
© 2024 by the authors. Licensee MDPI, Basel, Switzerland. This article is an open access article distributed under the terms and conditions of the Creative Commons Attribution (CC BY) license (https://creativecommons.org/licenses/by/4.0/).