

Quantifying the Nonadiabaticity Strength Constant in Recently Discovered Highly Compressed Superconductors


Abstract
:1. Introduction
- (1)
- the Debye temperature, ;
- (2)
- the electron–phonon coupling constant, ;
- (3)
- the ground-state coherence length, ;
- (4)
- the Fermi temperature, ;
- (5)
- the nonadiabaticity strength constant, ;
- (6)
- and the ratio, ;
2. Utilized Models and Data Analysis Tools
2.1. Debye Temperature
2.2. The Electron–Phonon Coupling Constant
2.3. Ground-State Coherence Length
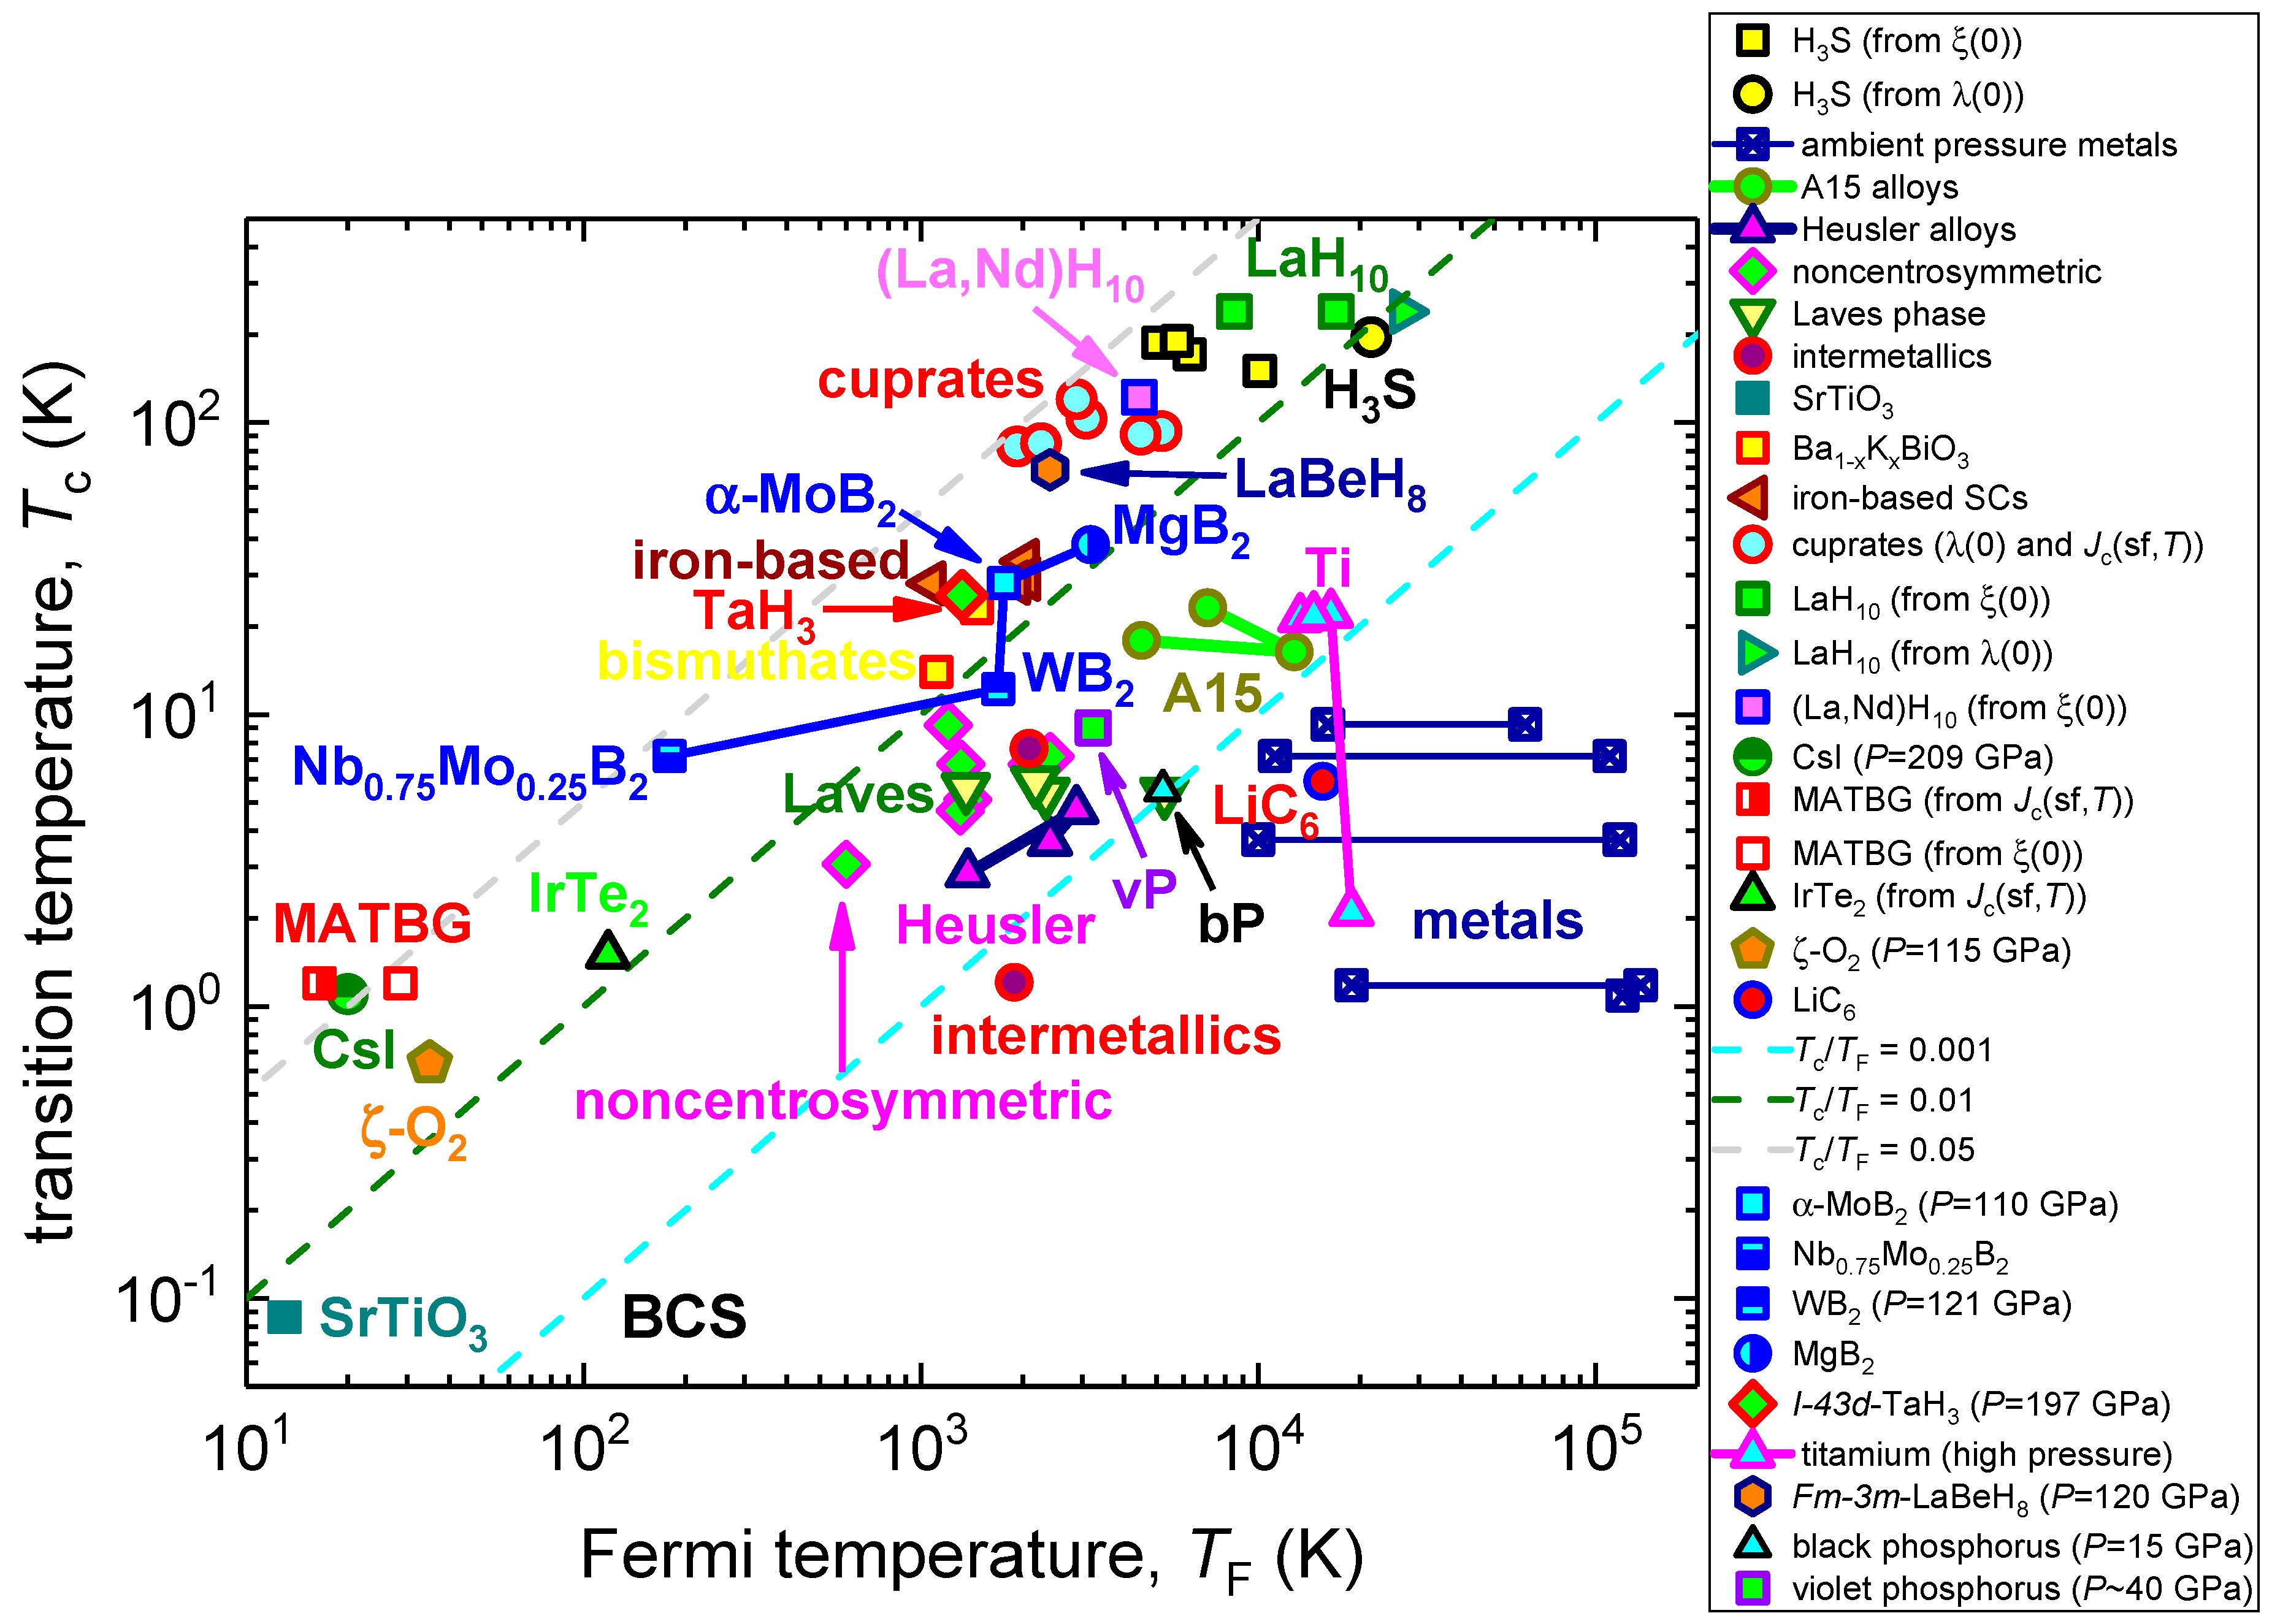
2.4. The Fermi Temperature
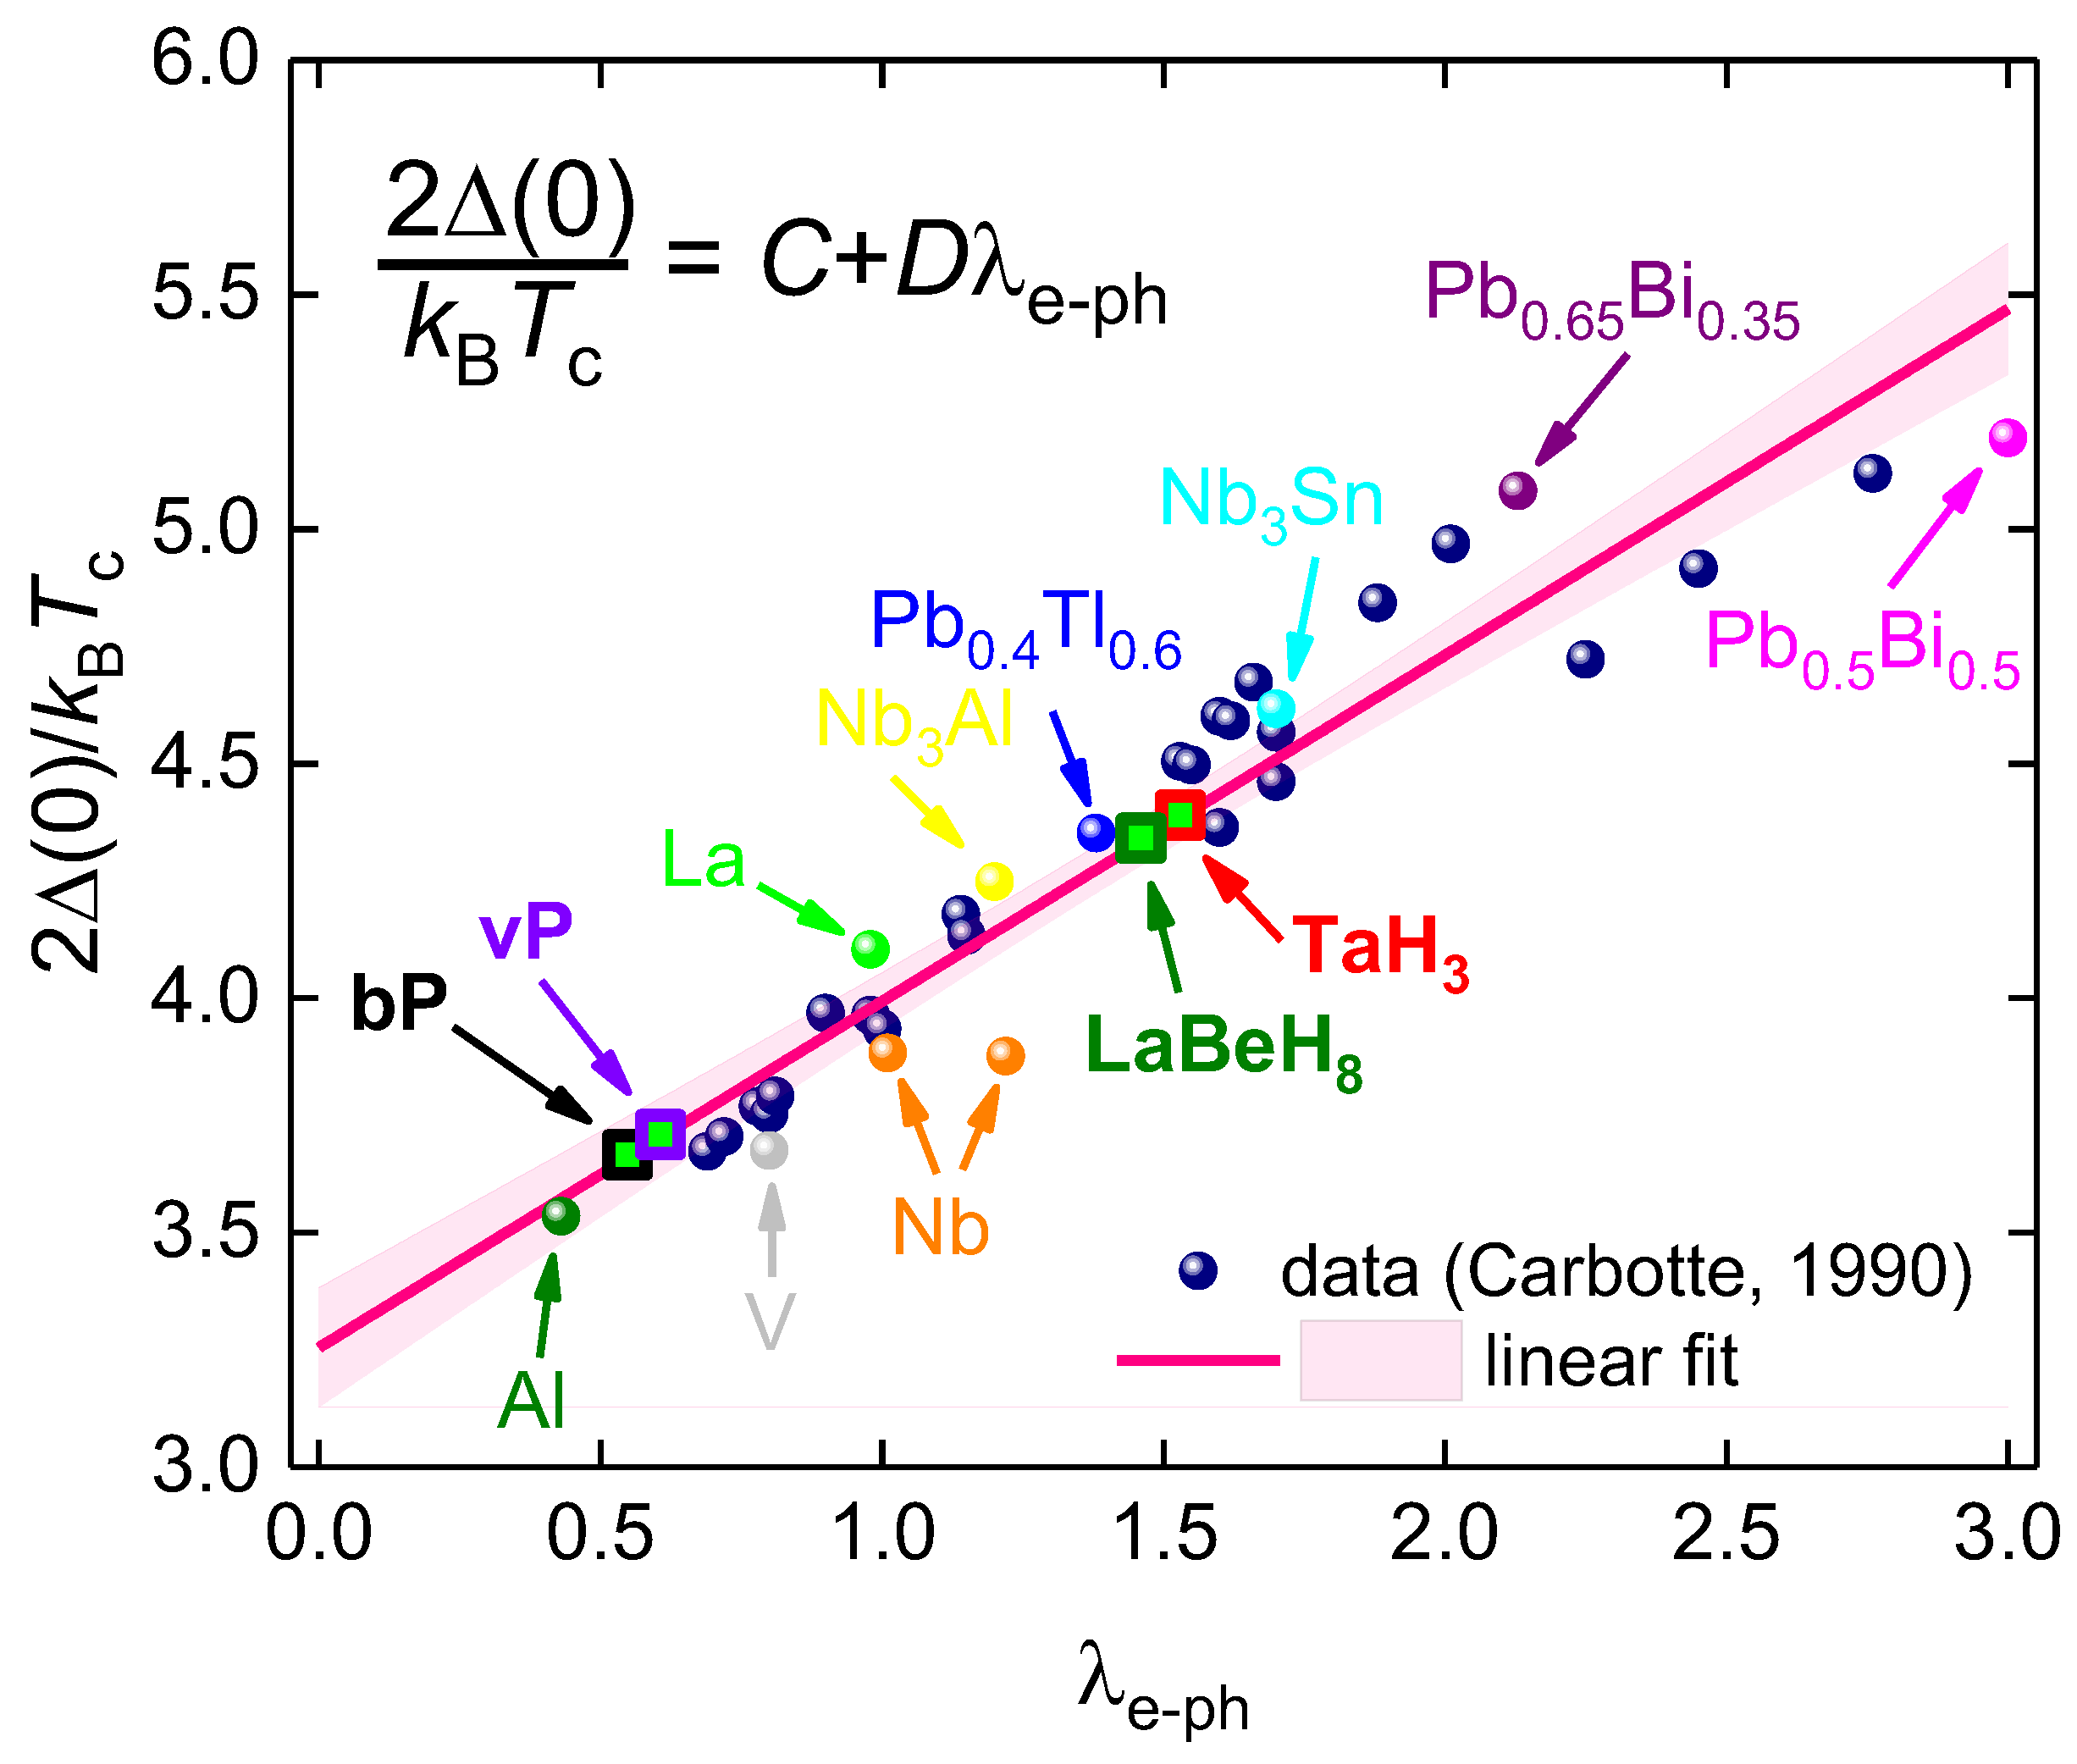
2.5. The Gap-to-Transition Temperature Ratio
3. Results
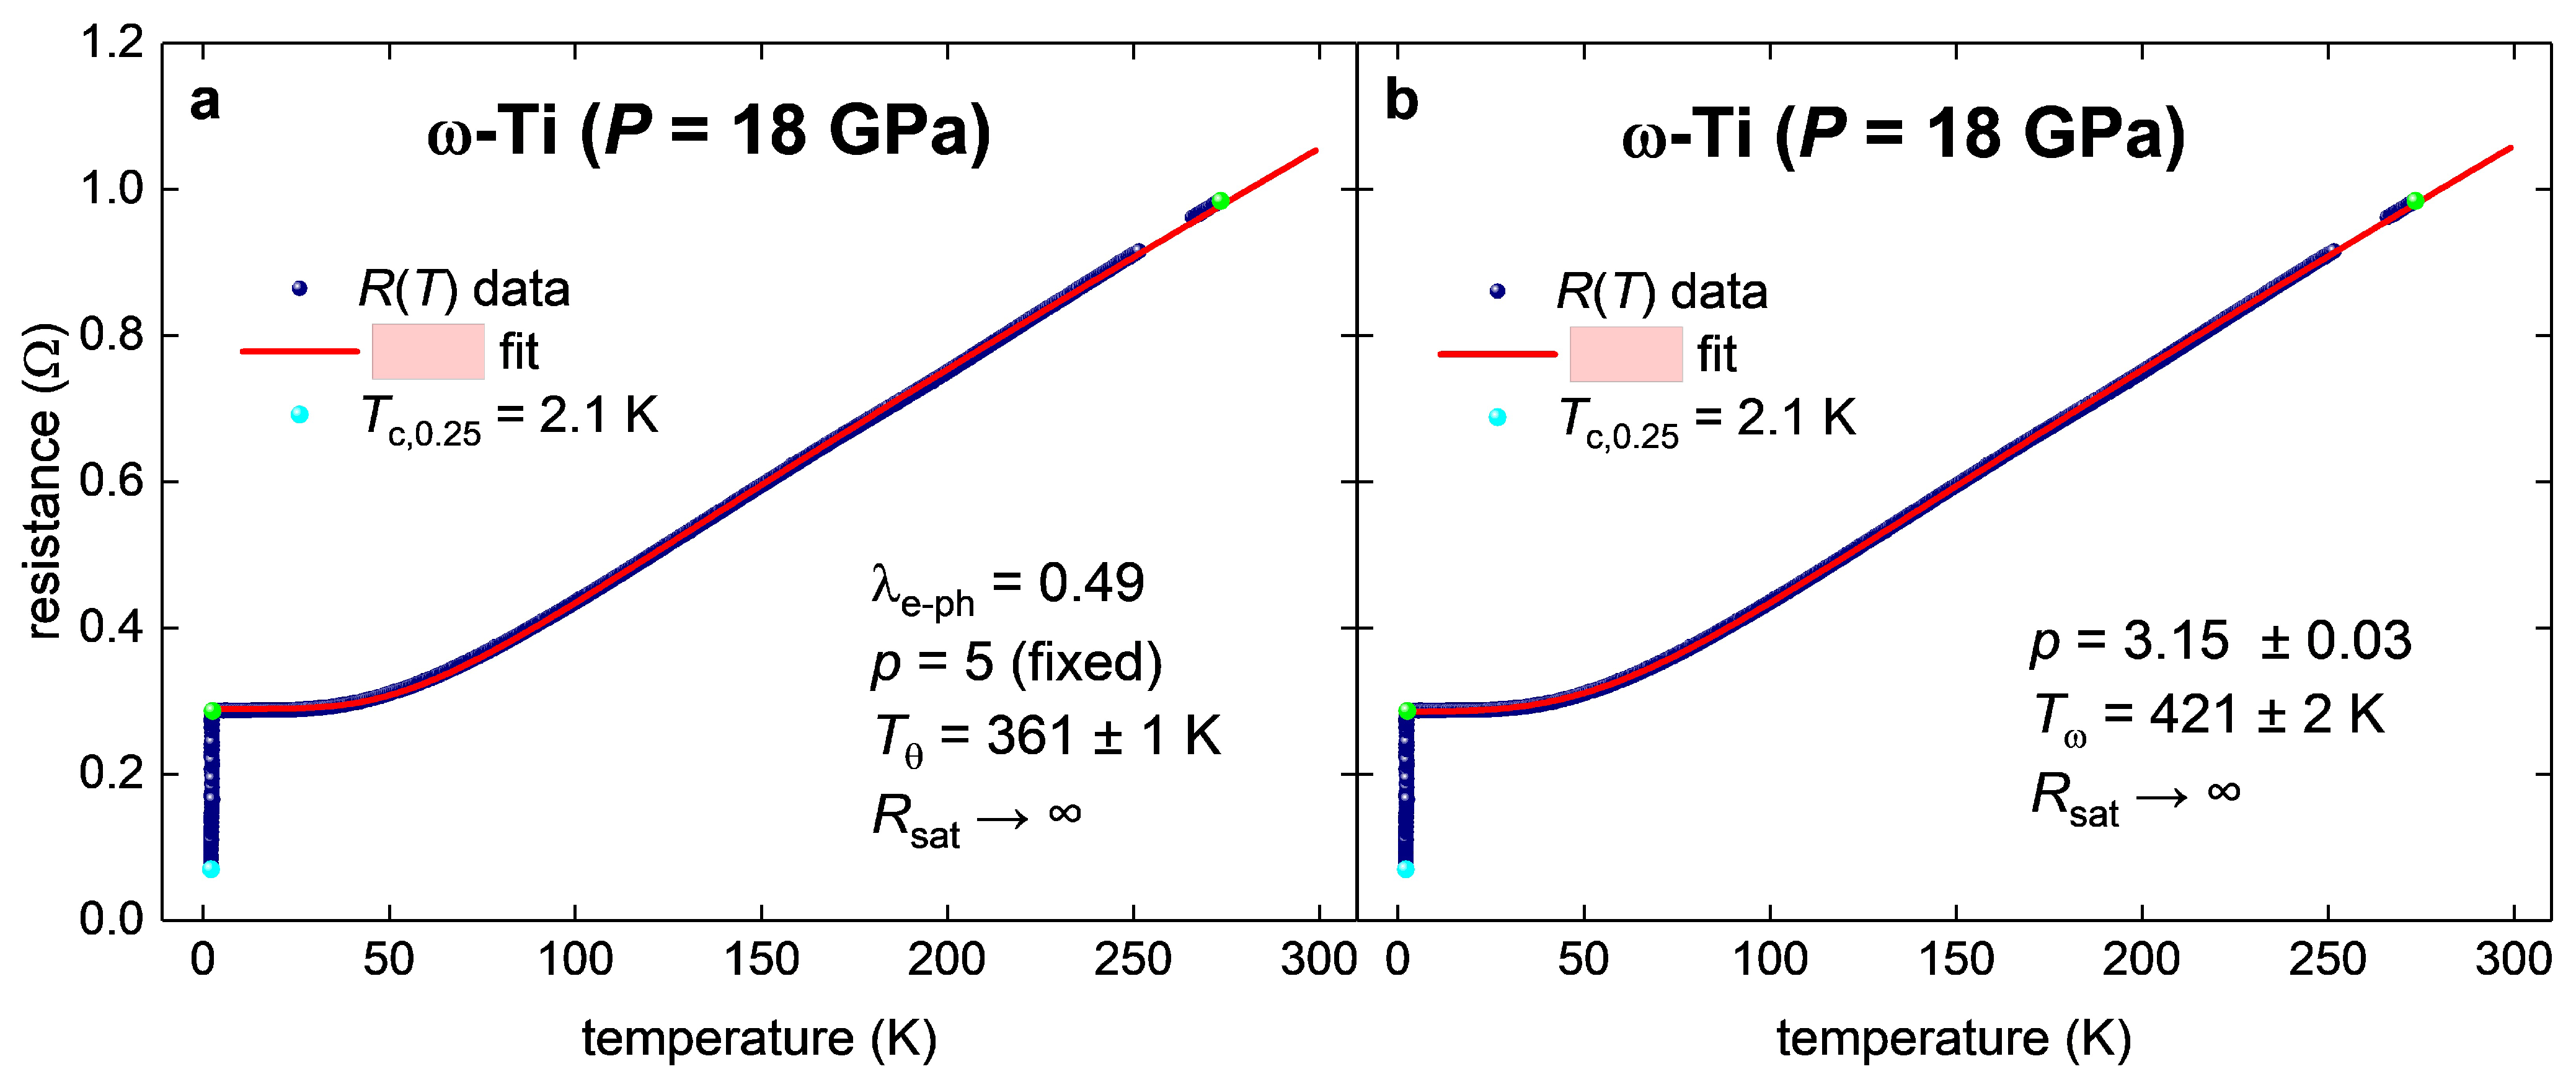
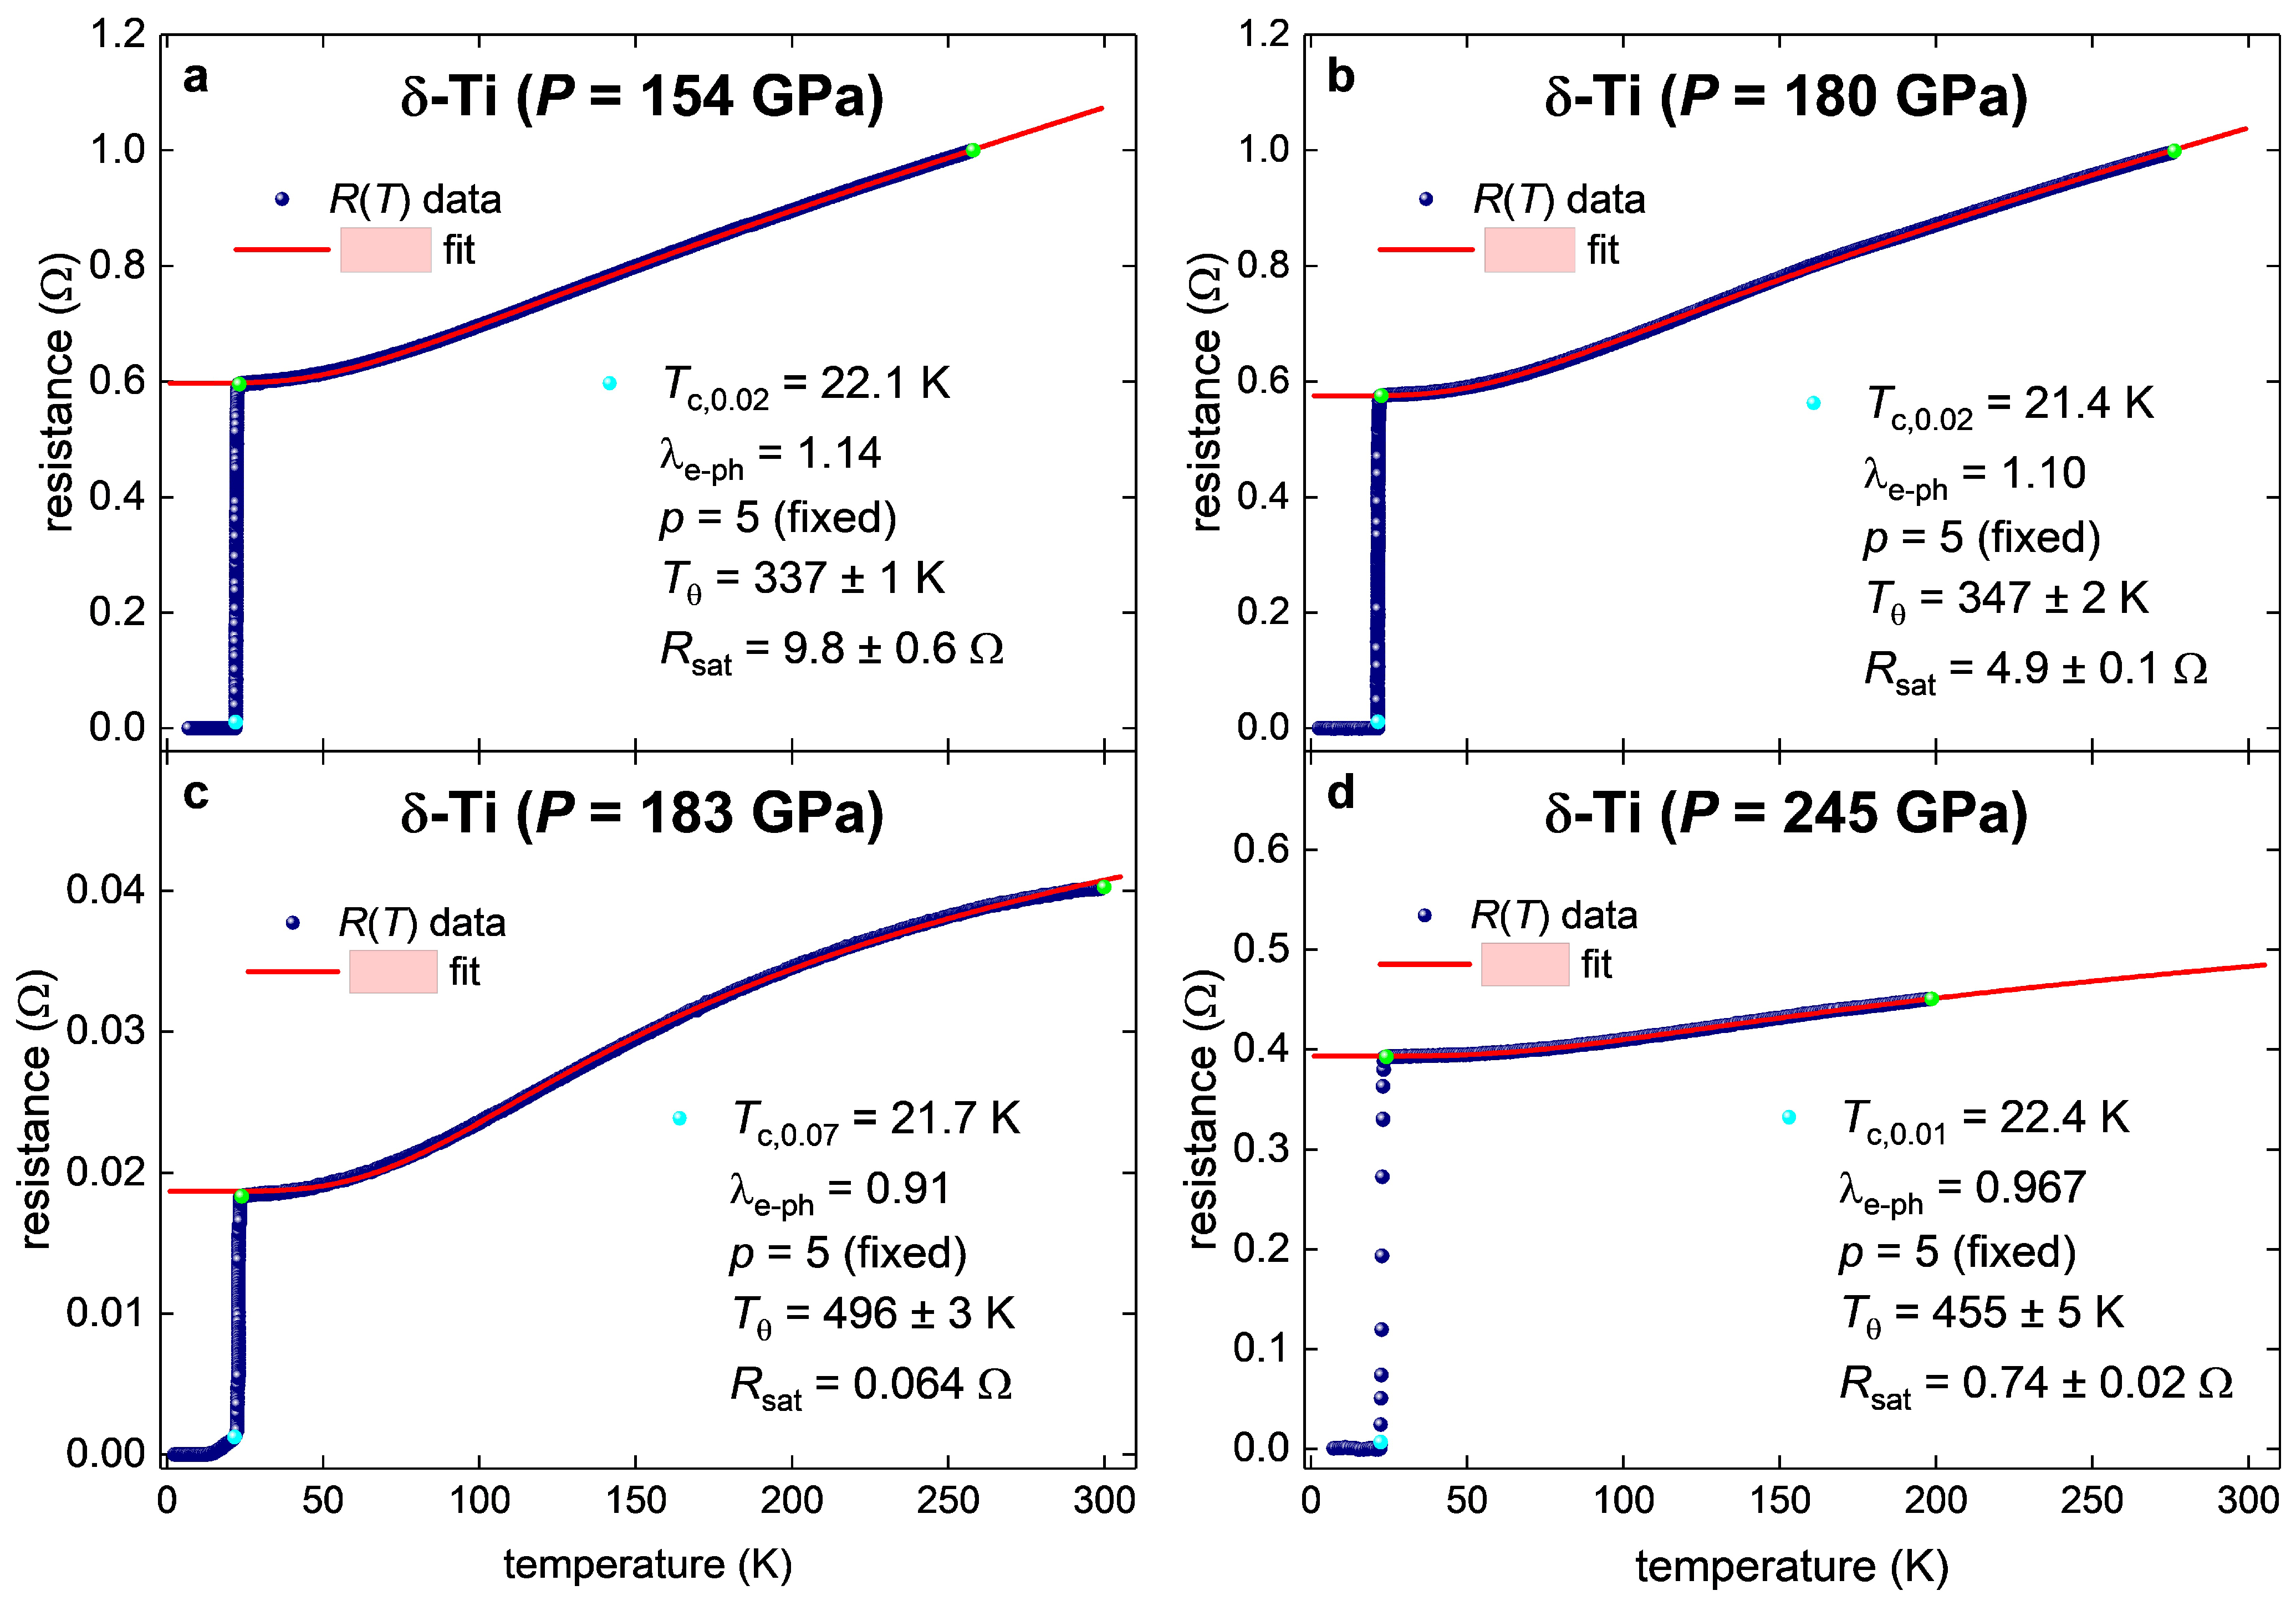
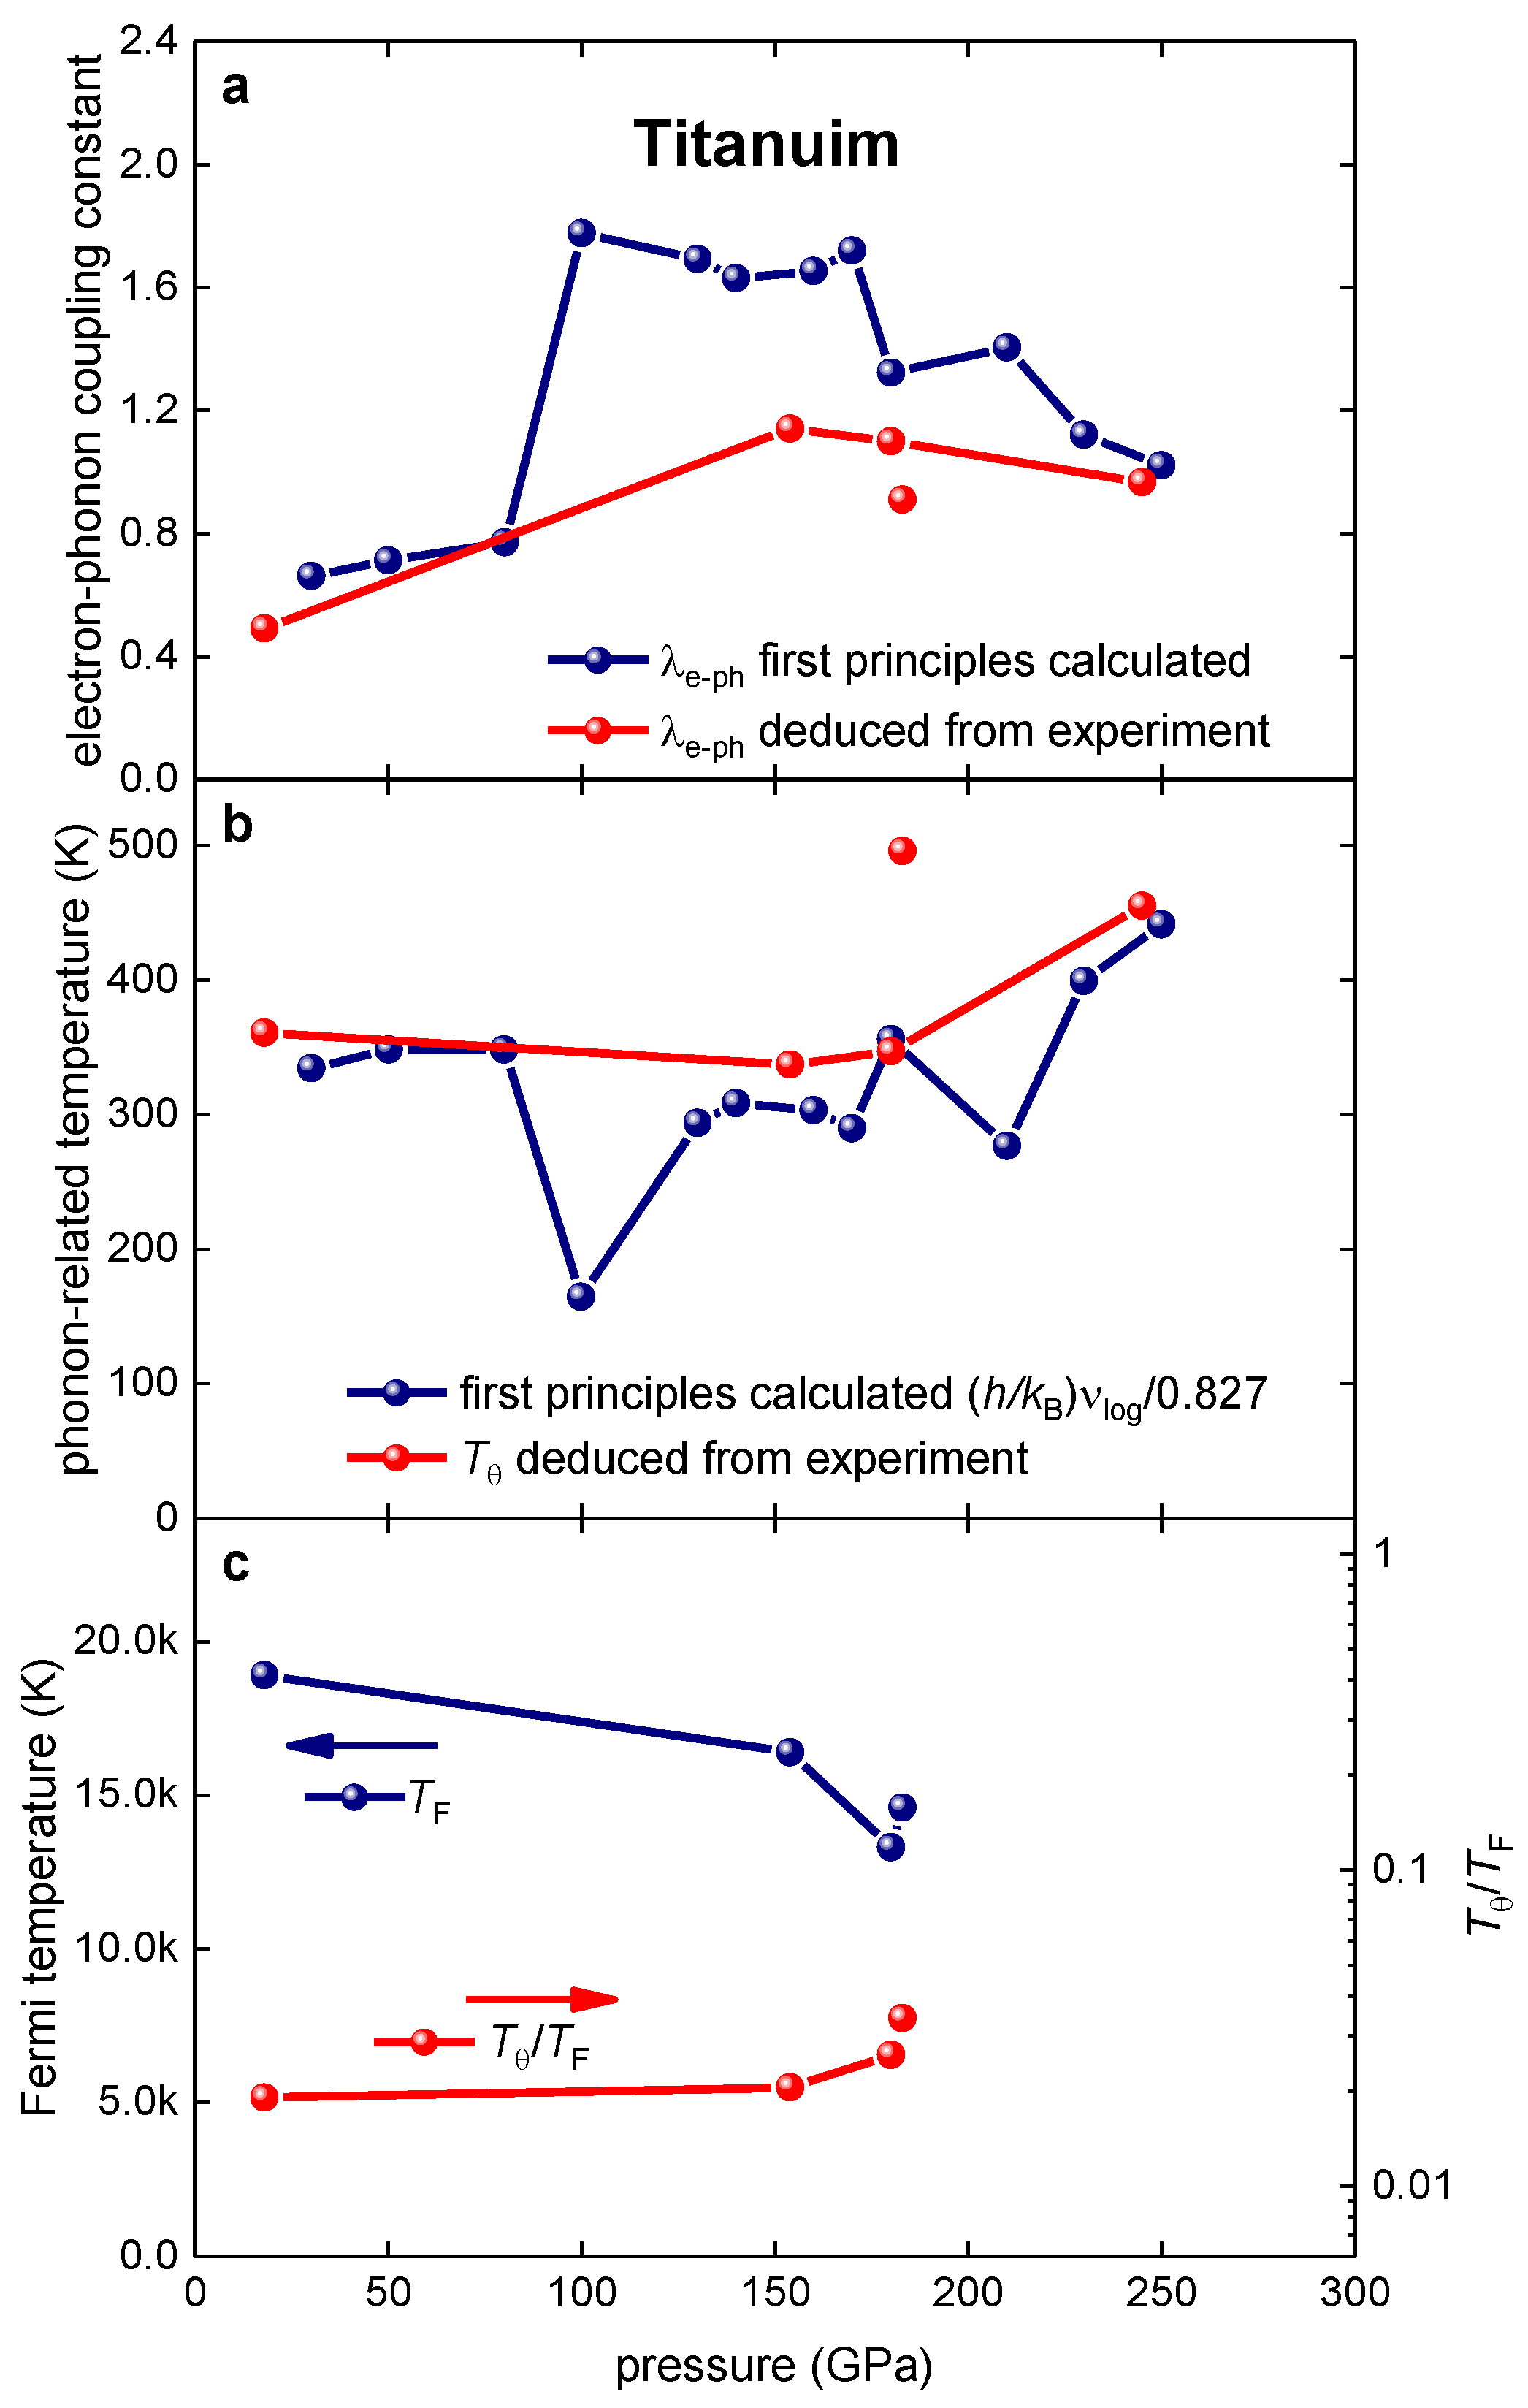
3.1. Highly Compressed Titanium
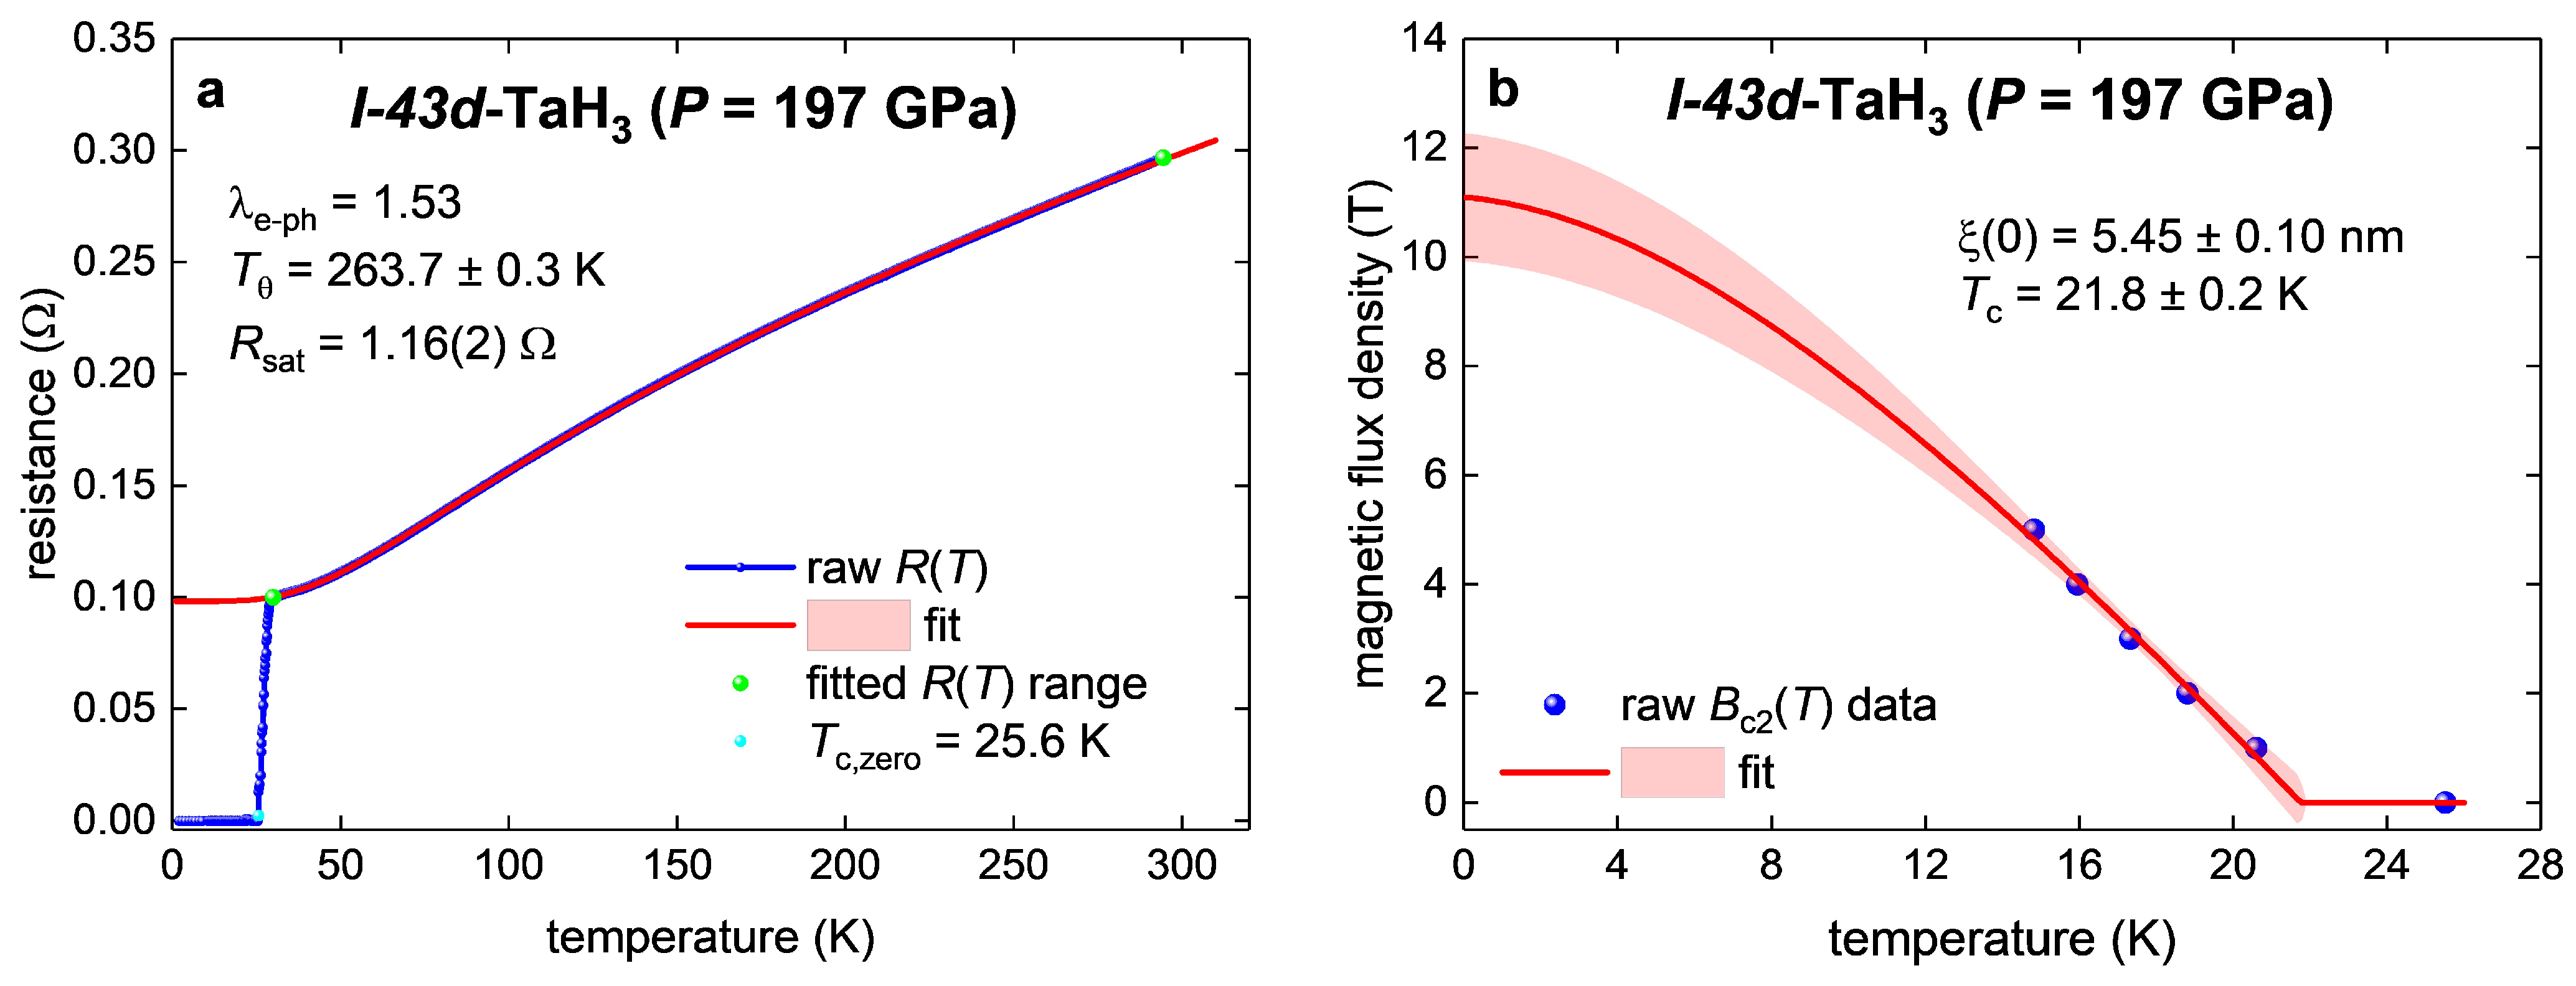
3.2. Highly Compressed I-43d-Phase of TaH3
- (1)
- the Debye temperature, ;
- (2)
- the electron–phonon coupling constant, ;
- (3)
- the ground-state coherence length, ;
- (4)
- the Fermi temperature, ;
- (5)
- , which implies that this phase falls in the unconventional superconductors band in the Uemura plot;
- (6)
- the nonadiabaticity strength constant, .
3.3. Highly Compressed Fm-3m-Phase of LaBeH8
- (1)
- the Debye temperature, ;
- (2)
- the electron–phonon coupling constant, ;
- (3)
- the ground-state coherence length, ;
- (4)
- the Fermi temperature, ;
- (5)
- , which implies that this phase falls in the unconventional superconductors band in the Uemura plot;
- (6)
- the nonadiabaticity strength constant, .
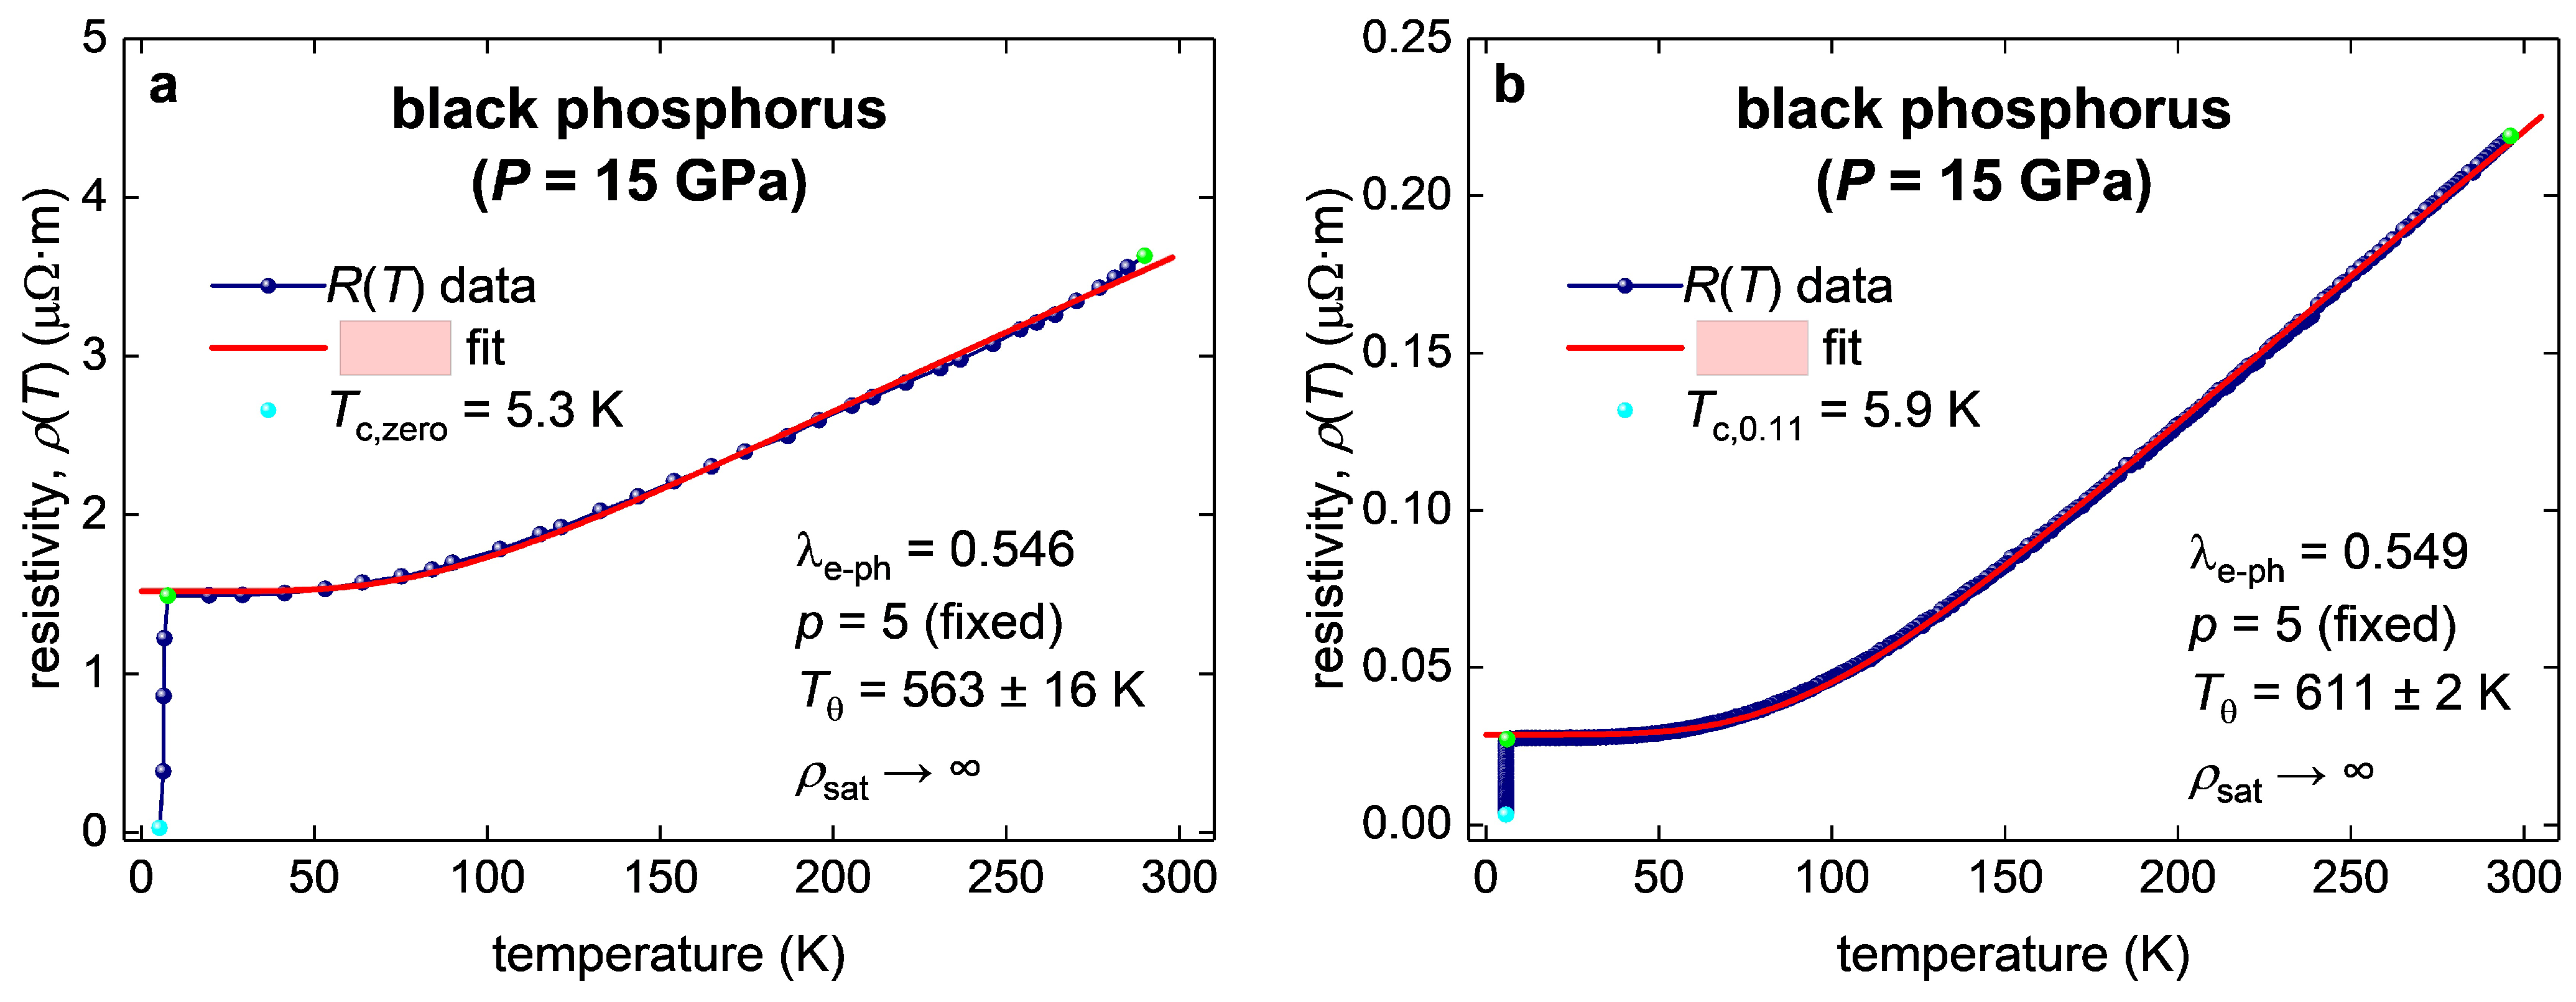
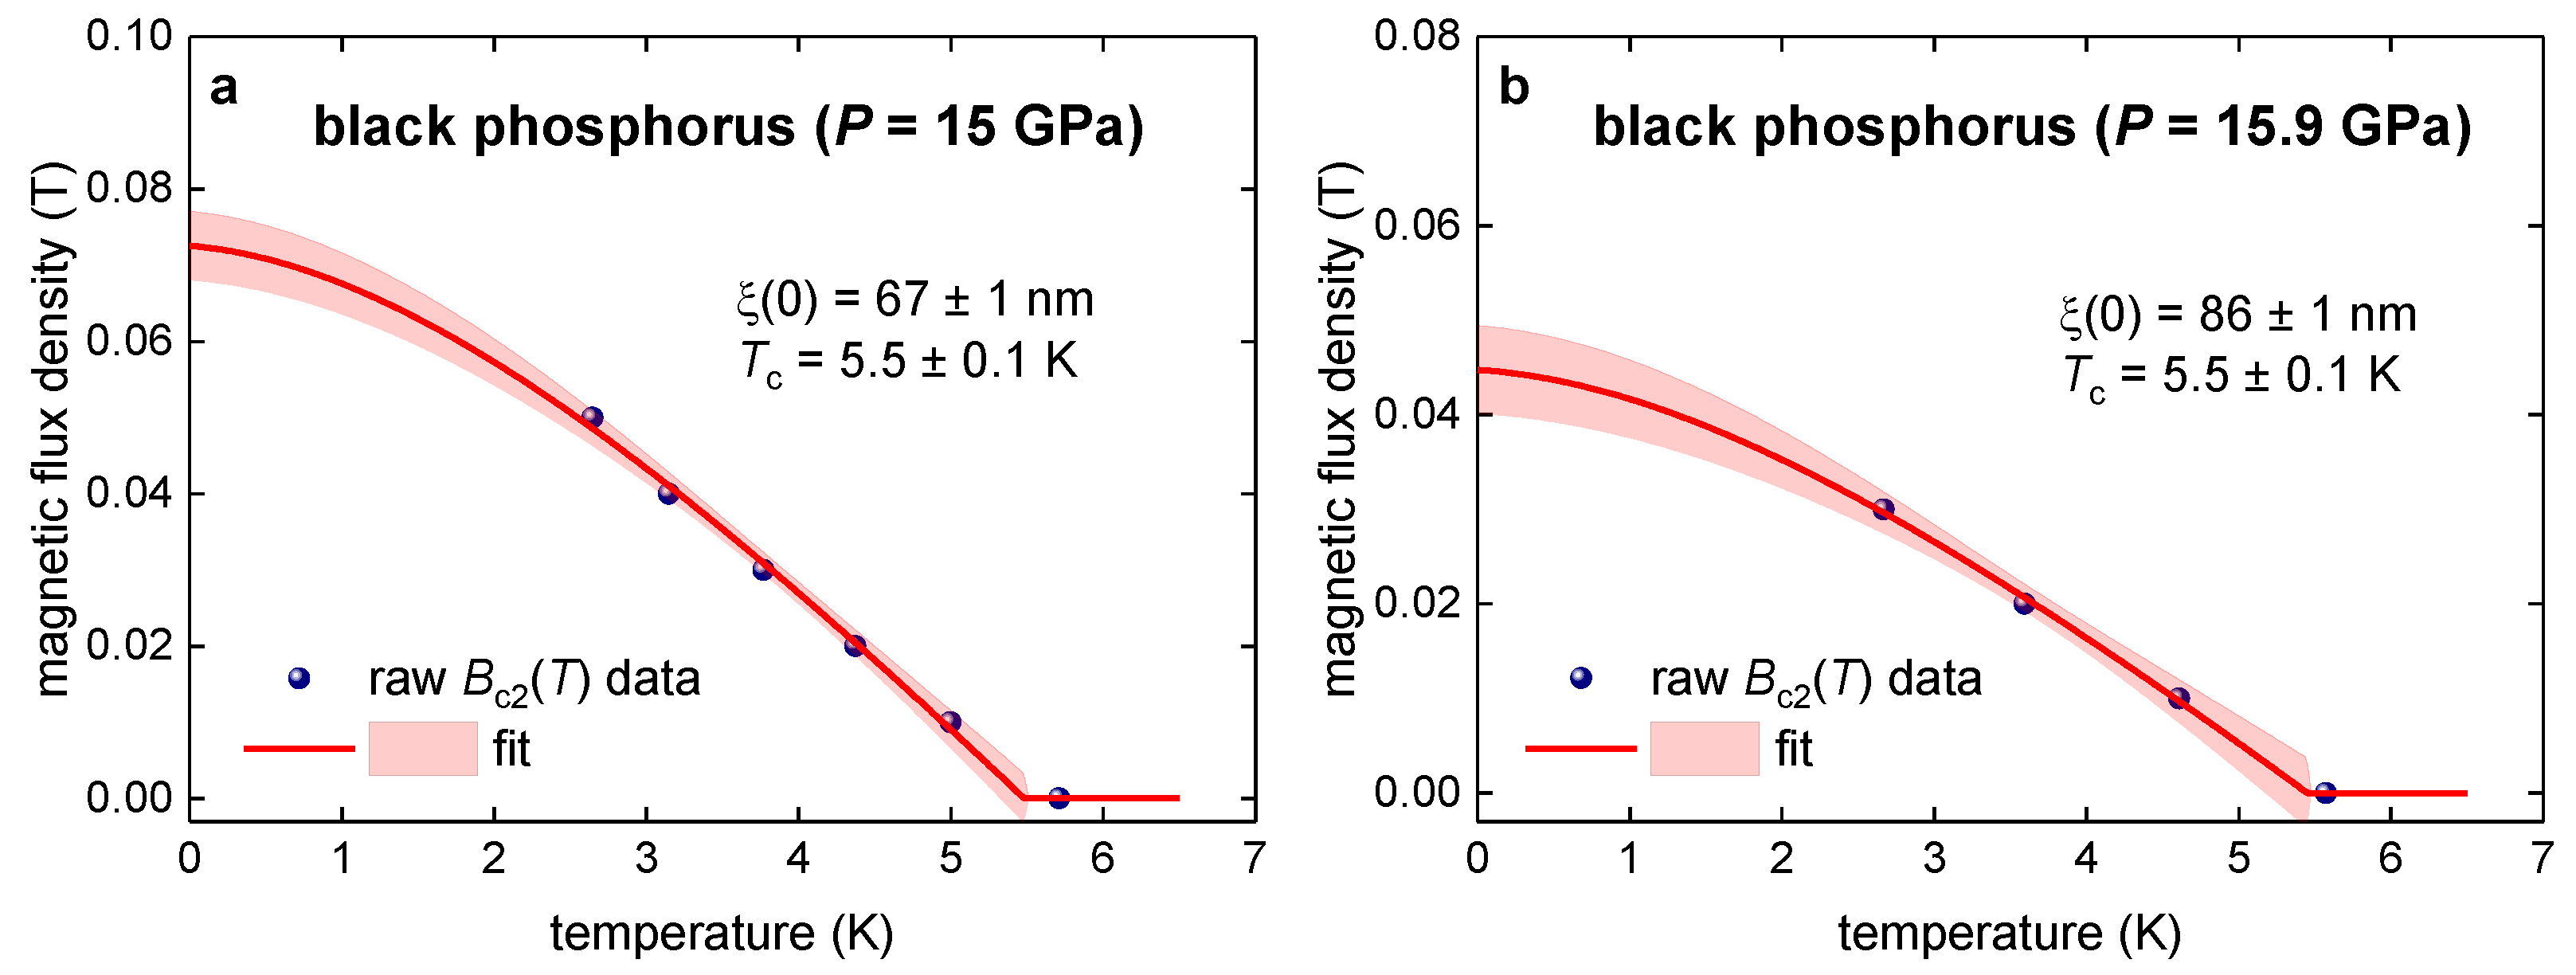
3.4. Highly Compressed Black Phosphorous
- (1)
- the Debye temperature, ;
- (2)
- the electron–phonon coupling constant, ;
- (3)
- the ground-state coherence length, ;
- (4)
- the Fermi temperature, ;
- (5)
- , which implies that black phosphorus falls in the conventional superconductors band in the Uemura plot;
- (6)
- the nonadiabaticity strength constant, .
3.5. Highly Compressed Violet Phosphorous
- (1)
- the Debye temperature, ;
- (2)
- the electron–phonon coupling constant, ;
- (3)
- the ground-state coherence length, ;
- (4)
- the Fermi temperature, ;
- (5)
- , which implies that this phase falls near the conventional superconductors band in the Uemura plot;
- (6)
- the nonadiabaticity strength constant, .
4. Discussion
5. Conclusions
Funding
Data Availability Statement
Conflicts of Interest
References
- Drozdov, A.P.; Eremets, M.I.; Troyan, I.A.; Ksenofontov, V.; Shylin, S.I. Conventional Superconductivity at 203 Kelvin at High Pressures in the Sulfur Hydride System. Nature 2015, 525, 73–76. [Google Scholar] [CrossRef] [PubMed]
- Duan, D.; Liu, Y.; Tian, F.; Li, D.; Huang, X.; Zhao, Z.; Yu, H.; Liu, B.; Tian, W.; Cui, T. Pressure-Induced Metallization of Dense (H2S)2H2 with High-Tc Superconductivity. Sci. Rep. 2014, 4, 6968. [Google Scholar] [CrossRef] [PubMed]
- Lilia, B.; Hennig, R.; Hirschfeld, P.; Profeta, G.; Sanna, A.; Zurek, E.; Pickett, W.E.; Amsler, M.; Dias, R.; Eremets, M.I.; et al. The 2021 Room-Temperature Superconductivity Roadmap. J. Phys. Condens. Matter 2022, 34, 183002. [Google Scholar] [CrossRef] [PubMed]
- Li, Y.; Hao, J.; Liu, H.; Li, Y.; Ma, Y. The Metallization and Superconductivity of Dense Hydrogen Sulfide. J. Chem. Phys. 2014, 140, 174712. [Google Scholar] [CrossRef]
- Sun, D.; Minkov, V.S.; Mozaffari, S.; Sun, Y.; Ma, Y.; Chariton, S.; Prakapenka, V.B.; Eremets, M.I.; Balicas, L.; Balakirev, F.F. High-Temperature Superconductivity on the Verge of a Structural Instability in Lanthanum Superhydride. Nat. Commun. 2021, 12, 6863. [Google Scholar] [CrossRef]
- Ma, L.; Wang, K.; Xie, Y.; Yang, X.; Wang, Y.; Zhou, M.; Liu, H.; Yu, X.; Zhao, Y.; Wang, H.; et al. High-Temperature Superconducting Phase in Clathrate Calcium Hydride CaH6 up to 215 K at a Pressure of 172 GPa. Phys. Rev. Lett. 2022, 128, 167001. [Google Scholar] [CrossRef]
- Wang, H.; Tse, J.S.; Tanaka, K.; Iitaka, T.; Ma, Y. Superconductive Sodalite-like Clathrate Calcium Hydride at High Pressures. Proc. Natl. Acad. Sci. USA 2012, 109, 6463–6466. [Google Scholar] [CrossRef]
- Bi, J.; Nakamoto, Y.; Zhang, P.; Shimizu, K.; Zou, B.; Liu, H.; Zhou, M.; Liu, G.; Wang, H.; Ma, Y. Giant Enhancement of Superconducting Critical Temperature in Substitutional Alloy (La,Ce)H9. Nat. Commun. 2022, 13, 5952. [Google Scholar] [CrossRef]
- Du, M.; Song, H.; Zhang, Z.; Duan, D.; Cui, T. Room-Temperature Superconductivity in Yb/Lu Substituted Clathrate Hexahydrides under Moderate Pressure. Research 2022, 2022, 9784309. [Google Scholar] [CrossRef]
- Alarco, J.A.; Almutairi, A.; Mackinnon, I.D.R. Progress Towards a Universal Approach for Prediction of the Superconducting Transition Temperature. J. Supercond. Nov. Magn. 2020, 33, 2287–2292. [Google Scholar] [CrossRef]
- Kostrzewa, M.; Szczęśniak, K.M.; Durajski, A.P.; Szczęśniak, R. From LaH10 to Room–Temperature Superconductors. Sci. Rep. 2020, 10, 1592. [Google Scholar] [CrossRef]
- Drozdov, A.P.; Kong, P.P.; Minkov, V.S.; Besedin, S.P.; Kuzovnikov, M.A.; Mozaffari, S.; Balicas, L.; Balakirev, F.F.; Graf, D.E.; Prakapenka, V.B.; et al. Superconductivity at 250 K in Lanthanum Hydride under High Pressures. Nature 2019, 569, 528–531. [Google Scholar] [CrossRef] [PubMed]
- Somayazulu, M.; Ahart, M.; Mishra, A.K.; Geballe, Z.M.; Baldini, M.; Meng, Y.; Struzhkin, V.V.; Hemley, R.J. Evidence for Superconductivity above 260 K in Lanthanum Superhydride at Megabar Pressures. Phys. Rev. Lett. 2019, 122, 027001. [Google Scholar] [CrossRef] [PubMed]
- Semenok, D.V.; Kvashnin, A.G.; Ivanova, A.G.; Svitlyk, V.; Fominski, V.Y.; Sadakov, A.V.; Sobolevskiy, O.A.; Pudalov, V.M.; Troyan, I.A.; Oganov, A.R. Superconductivity at 161 K in Thorium Hydride ThH10: Synthesis and Properties. Mater. Today 2020, 33, 36–44. [Google Scholar] [CrossRef]
- Troyan, I.A.; Semenok, D.V.; Kvashnin, A.G.; Sadakov, A.V.; Sobolevskiy, O.A.; Pudalov, V.M.; Ivanova, A.G.; Prakapenka, V.B.; Greenberg, E.; Gavriliuk, A.G.; et al. Anomalous High-Temperature Superconductivity in YH6. Adv. Mater. 2021, 33, 2006832. [Google Scholar] [CrossRef]
- Semenok, D.V.; Troyan, I.A.; Ivanova, A.G.; Kvashnin, A.G.; Kruglov, I.A.; Hanfland, M.; Sadakov, A.V.; Sobolevskiy, O.A.; Pervakov, K.S.; Lyubutin, I.S.; et al. Superconductivity at 253 K in Lanthanum–Yttrium Ternary Hydrides. Mater. Today 2021, 48, 18–28. [Google Scholar] [CrossRef]
- Kong, P.; Minkov, V.S.; Kuzovnikov, M.A.; Drozdov, A.P.; Besedin, S.P.; Mozaffari, S.; Balicas, L.; Balakirev, F.F.; Prakapenka, V.B.; Chariton, S.; et al. Superconductivity up to 243 K in the Yttrium-Hydrogen System under High Pressure. Nat. Commun. 2021, 12, 5075. [Google Scholar] [CrossRef]
- Zhang, C.; He, X.; Li, Z.; Zhang, S.; Feng, S.; Wang, X.; Yu, R.; Jin, C. Superconductivity in Zirconium Polyhydrides with Tc above 70 K. Sci. Bull. 2022, 67, 907–909. [Google Scholar] [CrossRef]
- Zhang, C.L.; He, X.; Li, Z.W.; Zhang, S.J.; Min, B.S.; Zhang, J.; Lu, K.; Zhao, J.F.; Shi, L.C.; Peng, Y.; et al. Superconductivity above 80 K in Polyhydrides of Hafnium. Mater. Today Phys. 2022, 27, 100826. [Google Scholar] [CrossRef]
- Minkov, V.S.; Prakapenka, V.B.; Greenberg, E.; Eremets, M.I. A Boosted Critical Temperature of 166 K in Superconducting D3S Synthesized from Elemental Sulfur and Hydrogen. Angew. Chem. 2020, 132, 19132–19136. [Google Scholar] [CrossRef]
- He, X.; Zhang, C.L.; Li, Z.W.; Zhang, S.J.; Min, B.S.; Zhang, J.; Lu, K.; Zhao, J.F.; Shi, L.C.; Peng, Y.; et al. Superconductivity Observed in Tantalum Polyhydride at High Pressure. Chin. Phys. Lett. 2023, 40, 057404. [Google Scholar] [CrossRef]
- Minkov, V.S.; Bud’ko, S.L.; Balakirev, F.F.; Prakapenka, V.B.; Chariton, S.; Husband, R.J.; Liermann, H.P.; Eremets, M.I. Magnetic Field Screening in Hydrogen-Rich High-Temperature Superconductors. Nat. Commun. 2022, 13, 3194. [Google Scholar] [CrossRef] [PubMed]
- Minkov, V.S.; Ksenofontov, V.; Bud’ko, S.L.; Talantsev, E.F.; Eremets, M.I. Magnetic Flux Trapping in Hydrogen-Rich High-Temperature Superconductors. Nat. Phys. 2023; online ahead of print. [Google Scholar] [CrossRef]
- Troyan, I.A.; Semenok, D.V.; Ivanova, A.G.; Sadakov, A.V.; Zhou, D.; Kvashnin, A.G.; Kruglov, I.A.; Sobolevskiy, O.A.; Lyubutina, M.V.; Perekalin, D.S.; et al. Non-Fermi-Liquid Behavior of Superconducting SnH4. arXiv 2023, arXiv:2303.06339. [Google Scholar] [CrossRef]
- Flores-Livas, J.A.; Boeri, L.; Sanna, A.; Profeta, G.; Arita, R.; Eremets, M. A Perspective on Conventional High-Temperature Superconductors at High Pressure: Methods and Materials. Phys. Rep. 2020, 856, 1–78. [Google Scholar] [CrossRef]
- Bhattacharyya, P.; Chen, W.; Huang, X.; Chatterjee, S.; Huang, B.; Kobrin, B.; Lyu, Y.; Smart, T.J.; Block, M.; Wang, E.; et al. Imaging the Meissner Effect and Flux Trapping in a Hydride Superconductor at Megabar Pressures Using a Nanoscale Quantum Sensor. arXiv 2023, arXiv:2306.03122. [Google Scholar] [CrossRef]
- Goh, S.K.; Zhang, W.; Yip, K.Y. Trapped Magnetic Flux in Superconducting Hydrides. Nat. Phys. 2023; online ahead of print. [Google Scholar] [CrossRef]
- Ho, K.O.; Leung, M.Y.; Wang, W.; Xie, J.; Yip, K.Y.; Wu, J.; Goh, S.K.; Denisenko, A.; Wrachtrup, J.; Yang, S. Spectroscopic Study of N-V Sensors in Diamond-Based High-Pressure Devices. Phys. Rev. Appl. 2023, 19, 044091. [Google Scholar] [CrossRef]
- Ho, K.O.; Leung, M.Y.; Reddy, P.; Xie, J.; Wong, K.C.; Jiang, Y.; Zhang, W.; Yip, K.Y.; Leung, W.K.; Pang, Y.Y.; et al. Probing the Evolution of the Electron Spin Wave Function of the Nitrogen-Vacancy Center in Diamond via Pressure Tuning. Phys. Rev. Appl. 2022, 18, 064042. [Google Scholar] [CrossRef]
- Ho, K.O.; Leung, M.Y.; Jiang, Y.; Ao, K.P.; Zhang, W.; Yip, K.Y.; Pang, Y.Y.; Wong, K.C.; Goh, S.K.; Yang, S. Probing Local Pressure Environment in Anvil Cells with Nitrogen-Vacancy (N-V−) Centers in Diamond. Phys. Rev. Appl. 2020, 13, 024041. [Google Scholar] [CrossRef]
- Yip, K.Y.; Ho, K.O.; Yu, K.Y.; Chen, Y.; Zhang, W.; Kasahara, S.; Mizukami, Y.; Shibauchi, T.; Matsuda, Y.; Goh, S.K.; et al. Measuring Magnetic Field Texture in Correlated Electron Systems under Extreme Conditions. Science 2019, 366, 1355–1359. [Google Scholar] [CrossRef]
- Sakata, M.; Einaga, M.; Dezhong, M.; Sato, T.; Orimo, S.; Shimizu, K. Superconductivity of Lanthanum Hydride Synthesized Using AlH3 as a Hydrogen Source. Supercond. Sci. Technol. 2020, 33, 114004. [Google Scholar] [CrossRef]
- Mozaffari, S.; Sun, D.; Minkov, V.S.; Drozdov, A.P.; Knyazev, D.; Betts, J.B.; Einaga, M.; Shimizu, K.; Eremets, M.I.; Balicas, L.; et al. Superconducting Phase Diagram of H3S under High Magnetic Fields. Nat. Commun. 2019, 10, 2522. [Google Scholar] [CrossRef]
- Chen, W.; Semenok, D.V.; Kvashnin, A.G.; Huang, X.; Kruglov, I.A.; Galasso, M.; Song, H.; Duan, D.; Goncharov, A.F.; Prakapenka, V.B.; et al. Synthesis of Molecular Metallic Barium Superhydride: Pseudocubic BaH12. Nat. Commun. 2021, 12, 273. [Google Scholar] [CrossRef] [PubMed]
- Zhou, D.; Semenok, D.V.; Duan, D.; Xie, H.; Chen, W.; Huang, X.; Li, X.; Liu, B.; Oganov, A.R.; Cui, T. Superconducting Praseodymium Superhydrides. Sci. Adv. 2020, 6, 1–9. [Google Scholar] [CrossRef] [PubMed]
- Hong, F.; Shan, P.F.; Yang, L.X.; Yue, B.B.; Yang, P.T.; Liu, Z.Y.; Sun, J.P.; Dai, J.H.; Yu, H.; Yin, Y.Y.; et al. Possible Superconductivity at ~70 K in Tin Hydride SnHx under High Pressure. Mater. Today Phys. 2022, 22, 100596. [Google Scholar] [CrossRef]
- Li, Z.; He, X.; Zhang, C.; Lu, K.; Min, B.; Zhang, J.; Zhang, S.; Zhao, J.; Shi, L.; Peng, Y.; et al. Superconductivity above 70 K Observed in Lutetium Polyhydrides. Sci. China Phys. Mech. Astron. 2023, 66, 267411. [Google Scholar] [CrossRef]
- Chen, W.; Semenok, D.V.; Huang, X.; Shu, H.; Li, X.; Duan, D.; Cui, T.; Oganov, A.R. High-Temperature Superconducting Phases in Cerium Superhydride with Tc up to 115 K below a Pressure of 1 Megabar. Phys. Rev. Lett. 2021, 127, 117001. [Google Scholar] [CrossRef] [PubMed]
- Semenok, D.V.; Troyan, I.A.; Sadakov, A.V.; Zhou, D.; Galasso, M.; Kvashnin, A.G.; Ivanova, A.G.; Kruglov, I.A.; Bykov, A.A.; Terent’ev, K.Y.; et al. Effect of Magnetic Impurities on Superconductivity in LaH10. Adv. Mater. 2022, 34, 2204038. [Google Scholar] [CrossRef]
- Li, Z.; He, X.; Zhang, C.; Wang, X.; Zhang, S.; Jia, Y.; Feng, S.; Lu, K.; Zhao, J.; Zhang, J.; et al. Superconductivity above 200 K Discovered in Superhydrides of Calcium. Nat. Commun. 2022, 13, 2863. [Google Scholar] [CrossRef]
- Chen, W.; Huang, X.; Semenok, D.V.; Chen, S.; Zhou, D.; Zhang, K.; Oganov, A.R.; Cui, T. Enhancement of Superconducting Properties in the La–Ce–H System at Moderate Pressures. Nat. Commun. 2023, 14, 2660. [Google Scholar] [CrossRef]
- Purans, J.; Menushenkov, A.P.; Besedin, S.P.; Ivanov, A.A.; Minkov, V.S.; Pudza, I.; Kuzmin, A.; Klementiev, K.V.; Pascarelli, S.; Mathon, O.; et al. Local Electronic Structure Rearrangements and Strong Anharmonicity in YH3 under Pressures up to 180 GPa. Nat. Commun. 2021, 12, 1765. [Google Scholar] [CrossRef]
- Shao, M.; Chen, W.; Zhang, K.; Huang, X.; Cui, T. High-Pressure Synthesis of Superconducting Clathratelike YH4. Phys. Rev. B 2021, 104, 174509. [Google Scholar] [CrossRef]
- Guo, J.; Shutov, G.; Chen, S.; Wang, Y.; Zhou, D.; Cui, T.; Huang, X.; Semenok, D. Stabilization of High-Temperature Superconducting A15 Phase La4H23 below 100 GPa. arXiv 2023, arXiv:2307.13067. [Google Scholar] [CrossRef]
- Sadakov, A.V.; Vlasenko, V.A.; Troyan, I.A.; Sobolevskiy, O.A.; Semenok, D.V.; Zhou, D.; Pudalov, V.M. Vortex Phase Dynamics in Yttrium Superhydride YH6 at Megabar Pressures. J. Phys. Chem. Lett. 2023, 14, 6666–6671. [Google Scholar] [CrossRef] [PubMed]
- Liu, W.; Wang, E.; Chen, G.; Zhu, X.; Zhang, Y.; Sheng, Y.; Wen, H.-H. Absence of Superconductivity in LiPdHX. Philos. Mag. 2018, 98, 623–631. [Google Scholar] [CrossRef]
- Zhang, Y.; Liu, W.; Zhu, X.; Zhao, H.; Hu, Z.; He, C.; Wen, H.-H. Unprecedented High Irreversibility Line in the Nontoxic Cuprate Superconductor (Cu,C)Ba2Ca3Cu4O11+δ. Sci. Adv. 2018, 4, eaau0192. [Google Scholar] [CrossRef]
- He, C.; Ming, X.; Si, J.; Zhu, X.; Wang, J.; Wen, H.-H. Characterization of the (Cu,C)Ba2Ca3Cu4O11+δ Single Crystals Grown under High Pressure. Supercond. Sci. Technol. 2022, 35, 025004. [Google Scholar] [CrossRef]
- Zhou, Y.; Guo, J.; Cai, S.; Zhao, J.; Gu, G.; Lin, C.; Yan, H.; Huang, C.; Yang, C.; Long, S.; et al. Quantum Phase Transition from Superconducting to Insulating-like State in a Pressurized Cuprate Superconductor. Nat. Phys. 2022, 18, 406–410. [Google Scholar] [CrossRef]
- Adachi, S.; Matsumoto, R.; Hara, H.; Saito, Y.; Song, P.; Takeya, H.; Watanabe, T.; Takano, Y. Pressure Effect in Bi-2212 and Bi-2223 Cuprate Superconductor. Appl. Phys. Express 2019, 12, 043002. [Google Scholar] [CrossRef]
- Mark, A.C.; Campuzano, J.C.; Hemley, R.J. Progress and Prospects for Cuprate High Temperature Superconductors under Pressure. High Press. Res. 2022, 42, 137–199. [Google Scholar] [CrossRef]
- Yamamoto, A.; Takeshita, N.; Terakura, C.; Tokura, Y. High Pressure Effects Revisited for the Cuprate Superconductor Family with Highest Critical Temperature. Nat. Commun. 2015, 6, 8990. [Google Scholar] [CrossRef]
- Mariappan, S.; Bhoi, D.; Krishnan, M.; Shoko, N.; Vajeeston, P.; Arushi; Kushwaha, R.K.; Singh, R.P.; Sonachalam, A.; Uwatoko, Y. Electronic Properties of α-Mn-Type Non-Centrosymmetric Superconductor Re5.5Ta under Hydrostatic Pressure. Supercond. Sci. Technol. 2023, 36, 025002. [Google Scholar] [CrossRef]
- Lim, J.; Hire, A.C.; Quan, Y.; Kim, J.S.; Xie, S.R.; Sinha, S.; Kumar, R.S.; Popov, D.; Park, C.; Hemley, R.J.; et al. Creating Superconductivity in WB2 through Pressure-Induced Metastable Planar Defects. Nat. Commun. 2022, 13, 7901. [Google Scholar] [CrossRef] [PubMed]
- Pei, C.; Zhang, J.; Wang, Q.; Zhao, Y.; Gao, L.; Gong, C.; Tian, S.; Luo, R.; Li, M.; Yang, W.; et al. Pressure-Induced Superconductivity at 32 K in MoB2. Natl. Sci. Rev. 2023, 10, nwad034. [Google Scholar] [CrossRef] [PubMed]
- Li, C.; Su, Y.; Zhang, C.; Pei, C.; Cao, W.; Wang, Q.; Zhao, Y.; Gao, L.; Zhu, S.; Zhang, M.; et al. Pressure-Tuning Superconductivity in Noncentrosymmetric Topological Materials ZrRuAs. Materials 2022, 15, 7694. [Google Scholar] [CrossRef] [PubMed]
- Pei, C.; Zhang, J.; Gong, C.; Wang, Q.; Gao, L.; Zhao, Y.; Tian, S.; Cao, W.; Li, C.; Lu, Z.-Y.; et al. Distinct Superconducting Behaviors of Pressurized WB2 and ReB2 with Different Local B Layers. Sci. China Phys. Mech. Astron. 2022, 65, 287412. [Google Scholar] [CrossRef]
- Zamyatin, D.A.; Pankrushina, E.A.; Streltsov, S.V.; Ponosov, Y.S. Pressure-Induced Reversible Local Structural Disorder in Superconducting AuAgTe4. Inorganics 2023, 11, 99. [Google Scholar] [CrossRef]
- Liu, Z.Y.; Dong, Q.X.; Yang, P.T.; Shan, P.F.; Wang, B.S.; Sun, J.P.; Dun, Z.L.; Uwatoko, Y.; Chen, G.F.; Dong, X.L.; et al. Pressure-Induced Superconductivity up to 9 K in the Quasi-One-Dimensional KMn6Bi5. Phys. Rev. Lett. 2022, 128, 187001. [Google Scholar] [CrossRef]
- Shimizu, K. Superconducting Elements under High Pressure. Phys. C Supercond. Its Appl. 2018, 552, 30–33. [Google Scholar] [CrossRef]
- Zhang, H.; Zhong, W.; Meng, Y.; Yue, B.; Yu, X.; Wang, J.-T.; Hong, F. Superconductivity above 12 K with Possible Multiband Features in CsCl-Type PbS. Phys. Rev. B 2023, 107, 174502. [Google Scholar] [CrossRef]
- Wu, Y.Y.; Mu, L.; Zhang, X.; Dai, D.Z.; Xin, L.; Kong, X.M.; Huang, S.Y.; Meng, K.; Yang, X.F.; Tu, C.P.; et al. Pressure-Induced Superconductivity in the van Der Waals Semiconductor Violet Phosphorus. arXiv 2023, arXiv:2307.02989. [Google Scholar] [CrossRef]
- Zhang, C.; He, X.; Liu, C.; Li, Z.; Lu, K.; Zhang, S.; Feng, S.; Wang, X.; Peng, Y.; Long, Y.; et al. Record High Tc Element Superconductivity Achieved in Titanium. Nat. Commun. 2022, 13, 5411. [Google Scholar] [CrossRef] [PubMed]
- Liu, X.; Jiang, P.; Wang, Y.; Li, M.; Li, N.; Zhang, Q.; Wang, Y.; Li, Y.-L.; Yang, W. Tc up to 23.6 K and Robust Superconductivity in the Transition Metal δ-Ti Phase at Megabar Pressure. Phys. Rev. B 2022, 105, 224511. [Google Scholar] [CrossRef]
- Ying, J.; Liu, S.; Lu, Q.; Wen, X.; Gui, Z.; Zhang, Y.; Wang, X.; Sun, J.; Chen, X. Record High 36 K Transition Temperature to the Superconducting State of Elemental Scandium at a Pressure of 260 GPa. Phys. Rev. Lett. 2023, 130, 256002. [Google Scholar] [CrossRef] [PubMed]
- He, X.; Zhang, C.; Li, Z.; Liu, C.; Feng, S.; Zhao, J.; Bin, K.L.B.; Zhang, S.; Peng, Y.; Wang, X.; et al. Superconductivity above 30 K Achieved in Dense Scandium. arXiv 2023, arXiv:2303.01062. [Google Scholar] [CrossRef]
- Sun, H.; Huo, M.; Hu, X.; Li, J.; Liu, Z.; Han, Y.; Tang, L.; Mao, Z.; Yang, P.; Wang, B.; et al. Signatures of Superconductivity near 80 K in a Nickelate under High Pressure. Nature, 2023; online ahead of print. [Google Scholar] [CrossRef]
- Hou, J.; Yang, P.T.; Liu, Z.Y.; Li, J.Y.; Shan, P.F.; Ma, L.; Wang, G.; Wang, N.N.; Guo, H.Z.; Sun, J.P.; et al. Emergence of High-Temperature Superconducting Phase in the Pressurized La3Ni2O7 Crystals. arXiv 2023, arXiv:2307.09865. [Google Scholar] [CrossRef]
- Zhang, Y.; Su, D.; Huang, Y.; Sun, H.; Huo, M.; Shan, Z.; Ye, K.; Yang, Z.; Li, R.; Smidman, M.; et al. High-Temperature Superconductivity with Zero-Resistance and Strange Metal Behavior in La3Ni2O7. arXiv 2023, arXiv:2307.14819. [Google Scholar] [CrossRef]
- Errea, I.; Belli, F.; Monacelli, L.; Sanna, A.; Koretsune, T.; Tadano, T.; Bianco, R.; Calandra, M.; Arita, R.; Mauri, F.; et al. Quantum Crystal Structure in the 250-Kelvin Superconducting Lanthanum Hydride. Nature 2020, 578, 66–69. [Google Scholar] [CrossRef]
- Meninno, A.; Errea, I. Ab Initio Study of Metastable Occupation of Tetrahedral Sites in Palladium Hydrides and Its Impact on Superconductivity. Phys. Rev. B 2023, 107, 024504. [Google Scholar] [CrossRef]
- Meninno, A.; Errea, I. Absence of Sizable Superconductivity in Hydrogen Boride: A First-Principles Study. Phys. Rev. B 2022, 106, 214508. [Google Scholar] [CrossRef]
- Belli, F.; Novoa, T.; Contreras-García, J.; Errea, I. Strong Correlation between Electronic Bonding Network and Critical Temperature in Hydrogen-Based Superconductors. Nat. Commun. 2021, 12, 5381. [Google Scholar] [CrossRef]
- Pickard, C.J.; Errea, I.; Eremets, M.I. Superconducting Hydrides under Pressure. Annu. Rev. Condens. Matter Phys. 2020, 11, 57–76. [Google Scholar] [CrossRef]
- Errea, I. Superconducting Hydrides on a Quantum Landscape. J. Phys. Condens. Matter 2022, 34, 231501. [Google Scholar] [CrossRef] [PubMed]
- Hou, P.; Belli, F.; Bianco, R.; Errea, I. Strong Anharmonic and Quantum Effects in Pm3n AlH3 under High Pressure: A First-Principles Study. Phys. Rev. B 2021, 103, 134305. [Google Scholar] [CrossRef]
- Errea, I.; Calandra, M.; Pickard, C.J.; Nelson, J.; Needs, R.J.; Li, Y.; Liu, H.; Zhang, Y.; Ma, Y.; Mauri, F. High-Pressure Hydrogen Sulfide from First Principles: A Strongly Anharmonic Phonon-Mediated Superconductor. Phys. Rev. Lett. 2015, 114, 157004. [Google Scholar] [CrossRef]
- Errea, I.; Calandra, M.; Pickard, C.J.; Nelson, J.R.; Needs, R.J.; Li, Y.; Liu, H.; Zhang, Y.; Ma, Y.; Mauri, F. Quantum Hydrogen-Bond Symmetrization in the Superconducting Hydrogen Sulfide System. Nature 2016, 532, 81–84. [Google Scholar] [CrossRef] [PubMed]
- Lyakhov, A.O.; Oganov, A.R.; Stokes, H.T.; Zhu, Q. New Developments in Evolutionary Structure Prediction Algorithm USPEX. Comput. Phys. Commun. 2013, 184, 1172–1182. [Google Scholar] [CrossRef]
- Goncharenko, I.; Eremets, M.I.; Hanfland, M.; Tse, J.S.; Amboage, M.; Yao, Y.; Trojan, I.A. Pressure-Induced Hydrogen-Dominant Metallic State in Aluminum Hydride. Phys. Rev. Lett. 2008, 100, 045504. [Google Scholar] [CrossRef] [PubMed]
- Singh, D.; Cohen, R.E.; Papaconstantopoulos, D.A. Possiblity of LiPdHx as a New Ionic Superconductor. Phys. Rev. B 1990, 41, 861–864. [Google Scholar] [CrossRef]
- Talantsev, E.F.; Tallon, J.L. Universal Self-Field Critical Current for Thin-Film Superconductors. Nat. Commun. 2015, 6, 7820. [Google Scholar] [CrossRef]
- Talantsev, E.F.; Crump, W.P.; Tallon, J.L. Universal Scaling of the Self-Field Critical Current in Superconductors: From Sub-Nanometre to Millimetre Size. Sci. Rep. 2017, 7, 10010. [Google Scholar] [CrossRef]
- Park, S.; Kim, S.Y.; Kim, H.K.; Kim, M.J.; Kim, T.; Kim, H.; Choi, G.S.; Won, C.J.; Kim, S.; Kim, K.; et al. Superconductivity Emerging from a Stripe Charge Order in IrTe2 Nanoflakes. Nat. Commun. 2021, 12, 3157. [Google Scholar] [CrossRef] [PubMed]
- Talantsev, E.F.; Crump, W.P.; Storey, J.G.; Tallon, J.L. London Penetration Depth and Thermal Fluctuations in the Sulphur Hydride 203 K Superconductor. Ann. Phys. 2017, 529, 1600390. [Google Scholar] [CrossRef]
- Khasanov, R.; Guguchia, Z.; Maisuradze, A.; Andreica, D.; Elender, M.; Raselli, A.; Shermadini, Z.; Goko, T.; Knecht, F.; Morenzoni, E.; et al. High Pressure Research Using Muons at the Paul Scherrer Institute. High Press. Res. 2016, 36, 140–166. [Google Scholar] [CrossRef]
- Talantsev, E.F. Classifying Superconductivity in Compressed H3S. Mod. Phys. Lett. B 2019, 33, 1950195. [Google Scholar] [CrossRef]
- Talantsev, E.F. Electron–Phonon Coupling Constant and BCS Ratios in LaH10−y Doped with Magnetic Rare-Earth Element. Supercond. Sci. Technol. 2022, 35, 095008. [Google Scholar] [CrossRef]
- Khasanov, R. Perspective on Muon-Spin Rotation/Relaxation under Hydrostatic Pressure. J. Appl. Phys. 2022, 132, 190903. [Google Scholar] [CrossRef]
- Grinenko, V.; Das, D.; Gupta, R.; Zinkl, B.; Kikugawa, N.; Maeno, Y.; Hicks, C.W.; Klauss, H.-H.; Sigrist, M.; Khasanov, R. Unsplit Superconducting and Time Reversal Symmetry Breaking Transitions in Sr2RuO4 under Hydrostatic Pressure and Disorder. Nat. Commun. 2021, 12, 3920. [Google Scholar] [CrossRef]
- Talantsev, E.F. D-Wave Superconducting Gap Symmetry as a Model for Nb1−xMoxB2 (x = 0.25; 1.0) and WB2 Diborides. Symmetry 2023, 15, 812. [Google Scholar] [CrossRef]
- Migdal, A.B. Interaction between Electrons and Lattice Vibrations in a Normal Metal. Sov. Phys.–JETP 1958, 7, 996. [Google Scholar]
- Eliashberg, G.M. Interactions between Electrons and Lattice Vibrations in a Superconductor. Sov. Phys.–JETP 1960, 11, 696. [Google Scholar]
- Gor’kov, L.P. Phonon Mechanism in the Most Dilute Superconductor n-Type SrTiO3. Proc. Natl. Acad. Sci. USA 2016, 113, 4646–4651. [Google Scholar] [CrossRef] [PubMed]
- Takada, Y. Plasmon Mechanism of Superconductivity in Two- and Three-Dimensional Electron Systems. J. Phys. Soc. Jpn. 1978, 45, 786–794. [Google Scholar] [CrossRef]
- Lin, X.; Zhu, Z.; Fauqué, B.; Behnia, K. Fermi Surface of the Most Dilute Superconductor. Phys. Rev. X 2013, 3, 021002. [Google Scholar] [CrossRef]
- Szczeşńiak, D.; Drzazga-Szczeşńiak, E.A. Non-Adiabatic Superconductivity in the Electron-Doped Graphene. Europhys. Lett. 2021, 135, 67002. [Google Scholar] [CrossRef]
- Drzazga-Szczȩśniak, E.A.; Szczȩśniak, D.; Kaczmarek, A.Z.; Szczȩśniak, R. Breakdown of Adiabatic Superconductivity in Ca-Doped h-BN Monolayer. Condens. Matter 2022, 7, 60. [Google Scholar] [CrossRef]
- Szczęśniak, D.; Kaczmarek, A.Z.; Drzazga-Szczęśniak, E.A.; Szczęśniak, R. Phonon-Mediated Superconductivity in Bismuthates by Nonadiabatic Pairing. Phys. Rev. B 2021, 104, 094501. [Google Scholar] [CrossRef]
- Szcześniak, D. Scalability of Non-Adiabatic Effects in Lithium-Decorated Graphene Superconductor. Europhys. Lett. 2023, 142, 36002. [Google Scholar] [CrossRef]
- Talantsev, E.F. Quantifying Nonadiabaticity in Major Families of Superconductors. Nanomaterials 2022, 13, 71. [Google Scholar] [CrossRef]
- Yoon, H.; Swartz, A.G.; Harvey, S.P.; Inoue, H.; Hikita, Y.; Yu, Y.; Chung, S.B.; Raghu, S.; Hwang, H.Y. Low-Density Superconductivity in SrTiO3 Bounded by the Adiabatic Criterion. arXiv 2021, arXiv:2106.10802. [Google Scholar] [CrossRef]
- Pietronero, L.; Strässler, S.; Grimaldi, C. Nonadiabatic Superconductivity. I. Vertex Corrections for the Electron-Phonon Interactions. Phys. Rev. B 1995, 52, 10516–10529. [Google Scholar] [CrossRef]
- Grimaldi, C.; Pietronero, L.; Strässler, S. Nonadiabatic Superconductivity. II. Generalized Eliashberg Equations beyond Migdal’s Theorem. Phys. Rev. B 1995, 52, 10530–10546. [Google Scholar] [CrossRef] [PubMed]
- Cappelluti, E.; Ciuchi, S.; Grimaldi, C.; Pietronero, L.; Strässler, S. High Tc Superconductivity in MgB2. Phys. Rev. Lett. 2002, 88, 117003. [Google Scholar] [CrossRef] [PubMed]
- Grimaldi, C.; Cappelluti, E.; Pietronero, L. Isotope Effect on m * in High-Tc Materials Due to the Breakdown of Migdal’s Theorem. Europhys. Lett. 1998, 42, 667–672. [Google Scholar] [CrossRef]
- Pietronero, L.; Boeri, L.; Cappelluti, E.; Ortenzi, L. Conventional/Unconventional Superconductivity in High-Pressure Hydrides and beyond: Insights from Theory and Perspectives. Quantum Stud. Math. Found. 2018, 5, 5–21. [Google Scholar] [CrossRef]
- Eremets, M.I.; Shimizu, K.; Kobayashi, T.C.; Amaya, K. Metallic CsI at Pressures of up to 220 Gigapascals. Science 1998, 281, 1333–1335. [Google Scholar] [CrossRef]
- Talantsev, E.F. Fermi-Liquid Nonadiabatic Highly Compressed Cesium Iodide Superconductor. Condens. Matter 2022, 7, 65. [Google Scholar] [CrossRef]
- Song, Y.; Bi, J.; Nakamoto, Y.; Shimizu, K.; Liu, H.; Zou, B.; Liu, G.; Wang, H.; Ma, Y. Stoichiometric Ternary Superhydride LaBeH8 as a New Template for High-Temperature Superconductivity at 110 K under 80 GPa. Phys. Rev. Lett. 2023, 130, 266001. [Google Scholar] [CrossRef]
- Li, X.; Sun, J.; Shahi, P.; Gao, M.; MacDonald, A.H.; Uwatoko, Y.; Xiang, T.; Goodenough, J.B.; Cheng, J.; Zhou, J. Pressure-Induced Phase Transitions and Superconductivity in a Black Phosphorus Single Crystal. Proc. Natl. Acad. Sci. USA 2018, 115, 9935–9940. [Google Scholar] [CrossRef]
- Guo, J.; Wang, H.; von Rohr, F.; Yi, W.; Zhou, Y.; Wang, Z.; Cai, S.; Zhang, S.; Li, X.; Li, Y.; et al. Electron-Hole Balance and the Anomalous Pressure-Dependent Superconductivity in Black Phosphorus. Phys. Rev. B 2017, 96, 224513. [Google Scholar] [CrossRef]
- Shirotani, I.; Mikami, J.; Adachi, T.; Katayama, Y.; Tsuji, K.; Kawamura, H.; Shimomura, O.; Nakajima, T. Phase Transitions and Superconductivity of Black Phosphorus and Phosphorus-Arsenic Alloys at Low Temperatures and High Pressures. Phys. Rev. B 1994, 50, 16274–16278. [Google Scholar] [CrossRef]
- Jin, M.; Wang, Q.; Liu, Y.; Zheng, Q.; Li, C.; Wang, S.; Wang, S.; Hao, N.; Nakamoto, Y.; Shimizu, K.; et al. Pressure Tuned 2D Superconductivity in Black Phosphorus. arXiv 2023, arXiv:2307.08385. [Google Scholar] [CrossRef]
- Bardeen, J.; Cooper, L.N.; Schrieffer, J.R. Theory of Superconductivity. Phys. Rev. 1957, 108, 1175–1204. [Google Scholar] [CrossRef]
- McMillan, W.L. Transition Temperature of Strong-Coupled Superconductors. Phys. Rev. 1968, 167, 331–344. [Google Scholar] [CrossRef]
- Dynes, R.C. McMillan’s Equation and the Tc of Superconductors. Solid State Commun. 1972, 10, 615–618. [Google Scholar] [CrossRef]
- Allen, P.B.; Dynes, R.C. Transition Temperature of Strong-Coupled Superconductors Reanalyzed. Phys. Rev. B 1975, 12, 905–922. [Google Scholar] [CrossRef]
- Talantsev, E.F. Advanced McMillan’s Equation and Its Application for the Analysis of Highly-Compressed Superconductors. Supercond. Sci. Technol. 2020, 33, 094009. [Google Scholar] [CrossRef]
- Bloch, F. Zum Elektrischen Widerstandsgesetz Bei Tiefen Temperaturen. Z. Für Phys. 1930, 59, 208–214. [Google Scholar] [CrossRef]
- Grüneisen, E. Die Abhängigkeit Des Elektrischen Widerstandes Reiner Metalle von Der Temperatur. Ann. Phys. 1933, 408, 530–540. [Google Scholar] [CrossRef]
- Fisk, Z.; Webb, G.W. Saturation of the High-Temperature Normal-State Electrical Resistivity of Superconductors. Phys. Rev. Lett. 1976, 36, 1084–1086. [Google Scholar] [CrossRef]
- Wiesmann, H.; Gurvitch, M.; Lutz, H.; Ghosh, A.; Schwarz, B.; Strongin, M.; Allen, P.B.; Halley, J.W. Simple Model for Characterizing the Electrical Resistivity in A−15 Superconductors. Phys. Rev. Lett. 1977, 38, 782–785. [Google Scholar] [CrossRef]
- Carbotte, J.P. Properties of Boson-Exchange Superconductors. Rev. Mod. Phys. 1990, 62, 1027–1157. [Google Scholar] [CrossRef]
- Helfand, E.; Werthamer, N.R. Temperature and Purity Dependence of the Superconducting Critical Field, Hc2. II. Phys. Rev. 1966, 147, 288–294. [Google Scholar] [CrossRef]
- Werthamer, N.R.; Helfand, E.; Hohenberg, P.C. Temperature and Purity Dependence of the Superconducting Critical Field, Hc2. III. Electron Spin and Spin-Orbit Effects. Phys. Rev. 1966, 147, 295–302. [Google Scholar] [CrossRef]
- Baumgartner, T.; Eisterer, M.; Weber, H.W.; Flükiger, R.; Scheuerlein, C.; Bottura, L. Effects of Neutron Irradiation on Pinning Force Scaling in State-of-the-Art Nb3Sn Wires. Supercond. Sci. Technol. 2014, 27, 015005. [Google Scholar] [CrossRef]
- Poole, C.P. Properties of the Normal Metallic State. In Handbook of Superconductivity; Elsevier: Amsterdam, The Netherlands, 2000; pp. 29–41. [Google Scholar]
- Poole, C.P.; Farach, H.; Creswick, R.; Prozorov, R. Superconductivity, 2nd ed.; Academic Press: London, UK, 2007. [Google Scholar]
- Talantsev, E.F. The Compliance of the Upper Critical Field in Magic-Angle Multilayer Graphene with the Pauli Limit. Materials 2022, 16, 256. [Google Scholar] [CrossRef]
- Ho, C.Y.; Powell, R.W.; Liley, P.E. Thermal Conductivity of the Elements. J. Phys. Chem. Ref. Data 1972, 1, 279–421. [Google Scholar] [CrossRef]
- Talantsev, E.F. The Dominance of Non-Electron–Phonon Charge Carrier Interaction in Highly-Compressed Superhydrides. Supercond. Sci. Technol. 2021, 34, 115001. [Google Scholar] [CrossRef]
- Semenok, D. Computational Design of New Superconducting Materials and Their Targeted Experimental Synthesis. Ph.D. Thesis, Skolkovo Institute of Science and Technology, Moscow, Russia, 2022. [Google Scholar] [CrossRef]
- Harshman, D.R.; Fiory, A.T. High-TC Superconductivity in Hydrogen Clathrates Mediated by Coulomb Interactions Between Hydrogen and Central-Atom Electrons. J. Supercond. Nov. Magn. 2020, 33, 2945–2961. [Google Scholar] [CrossRef]
- Homes, C.C.; Dordevic, S.V.; Strongin, M.; Bonn, D.A.; Liang, R.; Hardy, W.N.; Komiya, S.; Ando, Y.; Yu, G.; Kaneko, N.; et al. A Universal Scaling Relation in High-Temperature Superconductors. Nature 2004, 430, 539–541. [Google Scholar] [CrossRef]
- Koblischka, M.R.; Koblischka-Veneva, A. Calculation of Tc of Superconducting Elements with the Roeser–Huber Formalism. Metals 2022, 12, 337. [Google Scholar] [CrossRef]
- Dew-Hughes, D. Flux Pinning Mechanisms in Type II Superconductors. Philos. Mag. 1974, 30, 293–305. [Google Scholar] [CrossRef]
- Kramer, E.J. Scaling Laws for Flux Pinning in Hard Superconductors. J. Appl. Phys. 1973, 44, 1360–1370. [Google Scholar] [CrossRef]
- Talantsev, E.F. New Scaling Laws for Pinning Force Density in Superconductors. Condens. Matter 2022, 7, 74. [Google Scholar] [CrossRef]
- Godeke, A.; Haken, B.; Kate, H.H.J.; Larbalestier, D.C. A General Scaling Relation for the Critical Current Density in Nb3Sn. Supercond. Sci. Technol. 2006, 19, R100–R116. [Google Scholar] [CrossRef]
- Talantsev, E.F.; Mataira, R.C.; Crump, W.P. Classifying Superconductivity in Moiré Graphene Superlattices. Sci. Rep. 2020, 10, 212. [Google Scholar] [CrossRef]
- Talantsev, E.F. Classifying Hydrogen-Rich Superconductors. Mater. Res. Express 2019, 6, 106002. [Google Scholar] [CrossRef]
- Zhang, Z.; Cui, T.; Hutcheon, M.J.; Shipley, A.M.; Song, H.; Du, M.; Kresin, V.Z.; Duan, D.; Pickard, C.J.; Yao, Y. Design Principles for High-Temperature Superconductors with a Hydrogen-Based Alloy Backbone at Moderate Pressure. Phys. Rev. Lett. 2022, 128, 047001. [Google Scholar] [CrossRef]
- Hirsch, J.E.; Marsiglio, F. On Magnetic Field Screening and Expulsion in Hydride Superconductors. J. Supercond. Nov. Magn. 2023, 36, 1257–1261. [Google Scholar] [CrossRef]
- Hirsch, J.E.; Marsiglio, F. Evidence Against Superconductivity in Flux Trapping Experiments on Hydrides Under High Pressure. J. Supercond. Nov. Magn. 2022, 35, 3141–3145. [Google Scholar] [CrossRef]
- Hirsch, J.E. Enormous Variation in Homogeneity and Other Anomalous Features of Room Temperature Superconductor Samples: A Comment on Nature 615, 244 (2023). J. Supercond. Nov. Magn. 2023, 36, 1489–1494. [Google Scholar] [CrossRef]
- Hirsch, J.E. Electrical Resistance of Hydrides Under High Pressure: Evidence of Superconductivity or Confirmation Bias? J. Supercond. Nov. Magn. 2023, 36, 1495–1501. [Google Scholar] [CrossRef]
- Talantsev, E.F. Classifying Induced Superconductivity in Atomically Thin Dirac-Cone Materials. Condens. Matter 2019, 4, 83. [Google Scholar] [CrossRef]


Disclaimer/Publisher’s Note: The statements, opinions and data contained in all publications are solely those of the individual author(s) and contributor(s) and not of MDPI and/or the editor(s). MDPI and/or the editor(s) disclaim responsibility for any injury to people or property resulting from any ideas, methods, instructions or products referred to in the content. |
© 2023 by the author. Licensee MDPI, Basel, Switzerland. This article is an open access article distributed under the terms and conditions of the Creative Commons Attribution (CC BY) license (https://creativecommons.org/licenses/by/4.0/).
Share and Cite
Talantsev, E.F. Quantifying the Nonadiabaticity Strength Constant in Recently Discovered Highly Compressed Superconductors. Symmetry 2023, 15, 1632. https://doi.org/10.3390/sym15091632
Talantsev EF. Quantifying the Nonadiabaticity Strength Constant in Recently Discovered Highly Compressed Superconductors. Symmetry. 2023; 15(9):1632. https://doi.org/10.3390/sym15091632
Chicago/Turabian StyleTalantsev, Evgeny F. 2023. "Quantifying the Nonadiabaticity Strength Constant in Recently Discovered Highly Compressed Superconductors" Symmetry 15, no. 9: 1632. https://doi.org/10.3390/sym15091632
APA StyleTalantsev, E. F. (2023). Quantifying the Nonadiabaticity Strength Constant in Recently Discovered Highly Compressed Superconductors. Symmetry, 15(9), 1632. https://doi.org/10.3390/sym15091632