Article

Chiral Analysis of Linalool, an Important Natural Fragrance and Flavor Compound, by Molecular Rotational Resonance Spectroscopy

BrightSpec, Inc., 770 Harris St., Suite 104b, Charlottesville, VA 22903, USA
*
Author to whom correspondence should be addressed.
Symmetry 2022, 14(5), 917; https://doi.org/10.3390/sym14050917
Submission received: 30 March 2022 / Revised: 20 April 2022 / Accepted: 27 April 2022 / Published: 30 April 2022
(This article belongs to the Special Issue Asymmetric Molecules and Chirality Recognition)

Abstract

:
The chiral analysis of terpenes in complex mixtures of essential oils, necessary for authentication, has been further developed using chiral tagging molecular rotational resonance (MRR) spectroscopy. One analyte that is of particular interest is linalool (3,7-dimethyl-1,6-octadien-3-ol), a common natural chiral terpene found in botanicals with its enantiomers having unique flavor, fragrance, and aromatherapy characteristics. In this MRR demonstration, resolution of the enantiomers is achieved through the addition of a chiral tag, which creates non-covalent diastereomeric complexes with distinct spectral signatures. The relative stereochemistry of the complexes is identified by the comparison of calculated spectroscopic parameters with experimentally determined parameters of the chiral complexes with high accuracy. The diastereomeric complex intensities are analyzed to determine the absolute configuration (AC) and enantiomeric excess (EE) in each sample. Here, we demonstrate the use of chiral tagging MRR spectroscopy to perform a quantitative routine enantiomer analysis of linalool in complex essential oil mixtures, without the need for reference samples or chromatographic separation.

1. Introduction

Linalool (3,7-dimethyl-1,6-octadien-3-ol) is a widely known chiral terpene that is present in hundreds of botanical species [1,2,3]. Its contribution to flavor and fragrance is dependent not only on concentration but also on the dominant enantiomer form [4]. For instance, (R)-(−)-linalool is the dominant form in clary sage, lavender, hop, and hemp. On the other hand, (S)-(+)-linalool is the dominant form in cardamom, coriander, and catnip. Aromatherapeutic benefits from linalool are becoming increasingly recognized in consumer products, such as the soothing effects arising from such botanical inclusions as lavender or clary sage. These aromatherapy structure–function relationships are tied directly to the enantiomeric form of the linalool that is present [5]. New research continues to uncover other related medical benefits such as anti-anxiety, anticonvulsant, and anti-inflammatory properties [6]. Because these biological interactions are largely stereospecific, the dominant chiral form of linalool determines the various imparted health benefits.
With these increased health claims around botanical sources of linalool comes a greater need to ensure their identity. The specific symmetry of the enantiomer ratio that is produced is specific to a given botanical and, therefore, is used to ensure its identity [7]. Chirality specifications are an important tool in confirming the authenticity of extracted essential oils. In addition to the inclusion of synthetic racemic sources, botanical sources can also have different enantiomer ratios. Ensuring the correct enantiomer ratios not only confirms identity, but also other important consumer-desired traits such as aroma or health benefits. Relative area percentages from gas chromatography (GC) separation have traditionally been used to confirm the chiral specifications of terpenes in essential oils [8,9]. However, these chiral GC methods have various limitations, such as time, complexity, and the need for standards for ongoing retention time confirmation when it comes to verifying the chirality of constituents in these complex essential oil mixtures.
Chiral tagging molecular rotational resonance (MRR) spectroscopy is capable of performing chiral analysis without the need for reference samples or chromatographic separation. MRR spectroscopy characterizes compounds through their gas-phase rotational momentum transitions, which result in sharp, characteristic spectra that are directly correlated to the moments of inertia of the compound in its principal axis system, as expressed through the rotational constants (A, B, and C) [10]. This technique has been demonstrated to successfully resolve regioisomers [11], diastereomers [12,13], and even isotopologues and isotopomers [14,15] in a variety of mixtures. Enantiomers, unlike other types of isomers, have identical moments of inertia. However, by utilizing a pulsed supersonic expansion, which stabilizes non-covalent complexes in the gas phase, enantiomers can be resolved through their complexation with a chiral tag molecule, analogous to chiral derivatization [16,17,18,19]. For example, if a mixture of (R)- and (S)-linalool is combined with one enantiomer of a tag molecule, two diastereomeric complexes will form with different three-dimensional geometries, which can be spectrally resolved and quantified using MRR.
In addition to quantifying the enantiomeric composition of a compound using the spectral intensities of the two complexes, the absolute configuration (AC) of analytes in a sample can be determined by a comparison of the experimentally observed moments of inertia with predictions from electronic structure theory [16,17,18]. Prior studies using chiral tagging to resolve enantiomers have focused on small, rigid molecules. Flexible molecules can be challenging for chiral tagging experiments because the presence of multiple conformers can lead to multiple complex isomers, increasing the spectral complexity and reducing measurement sensitivity. This study focuses on the analysis of linalool, a chiral terpene alcohol that has been characterized by MRR previously [20]. Linalool has multiple rotatable bonds, and thus a large number of potential conformers. Despite this conformational flexibility, in isolated linalool, one conformer was energetically preferred, both computationally and experimentally. However, the addition of the chiral tag can change this preference, and in the pulsed jet, the molecule can adapt its conformation to find a lower-energy complex geometry. For example, alaninol (2-amino-1-propanol), which in the isolated state adopts an O-H—N intramolecular hydrogen bond, changes its conformation upon complexation with the chiral tag propylene oxide to form more favorable intermolecular interactions [21]. In this study, we consider how intramolecular and intermolecular non-covalent interactions can impact the low-energy complex geometries.
With these considerations in mind, we demonstrate the feasibility of chiral tagging MRR analysis of linalool. We also show, using a targeted MRR spectrometer with a faster measurement time, how the enantiomeric excess of linalool can be measured directly in essential oils, enabling its use for rapidly detecting adulteration. The high specificity and resolution of MRR limits spectral overlaps, so this analysis can be performed without any separation or purification.

2. Materials and Methods

2.1. Materials

A standard of (−)-linalool (Sigma-Aldrich, ≥95%) was used for initial chiral tagging studies without further purification. The chiral tags used to perform the experiments were racemic 3,3,3-trifluoro-1,2-epoxypropane—or trifluoropropylene oxide (TFPO)—(Synquest Labs, Alachua, FL, USA, 98%) and (S)-3,3,3-trifluoro-1,2-epoxypropane (Synquest Labs, Alachua, FL, USA, 97%). Note that these purity levels are the achiral purities as provided by the commercial supplier. The enantiomeric purity of the (S)-TFPO used in this study was determined to be 99.1 ± 0.1%, as determined through chiral tag complexation with another compound, (S)-1,1,1-trifluoropropan-2-ol, with known enantiopurity. Samples of clary sage (Whole Foods Market, Charlottesville, VA, USA) and cardamom (Aura Cacia, Norway, IA, USA) essential oils were also used for targeted characterization.

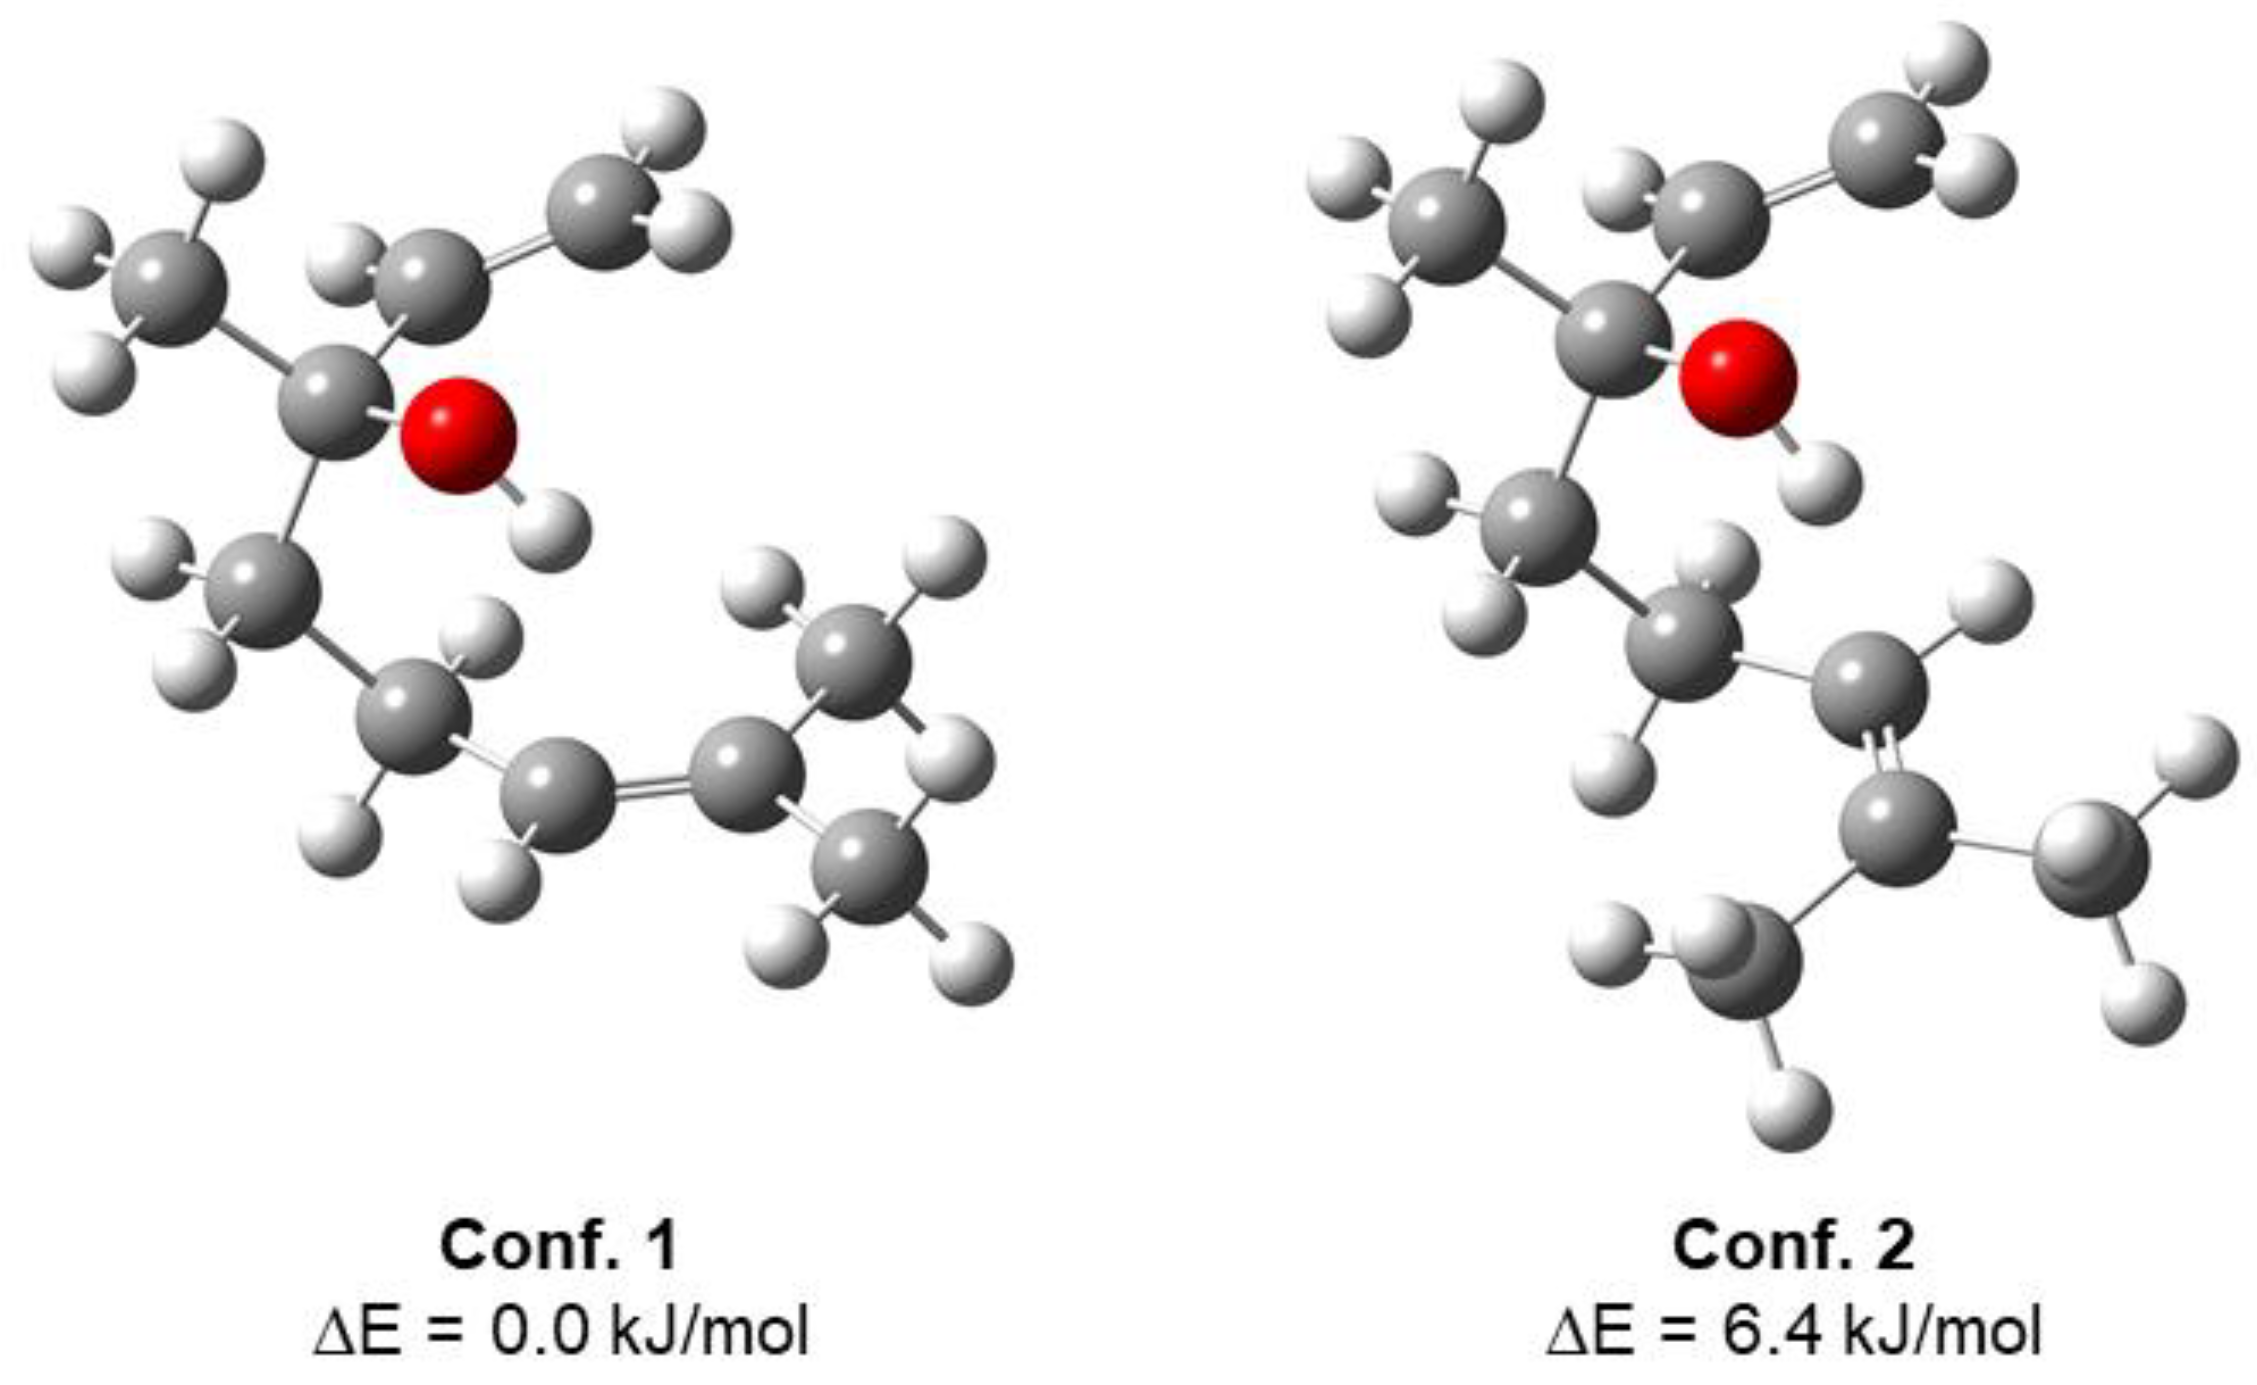
2.2. Computational Methods

All quantum chemical calculations were performed using Gaussian 16 [22]. Low-energy conformers of the linalool monomer were identified using a GMMX conformer search as implemented in GaussView, and the lowest-energy candidates were optimized at a B3LYP-D3BJ/6-311++G(d,p) level of theory. The low-energy conformers of linalool were then used to generate structures of possible chiral tag complexes with TFPO, with the primary intermolecular interaction assumed to be between the hydroxyl group of the analyte and the oxygen atom of the tag. Multiple isomers were generated that maintain the same primary interaction but differ in the overall orientation of the analyte and tag. All complex geometries were optimized at a B3LYP-D3BJ/def2-TZVP level of theory. Though more computationally expensive, the def2-TZVP basis set was employed for the complex geometry optimizations because it has been found to give better structural agreement for noncovalent intermolecular interactions. The D3BJ dispersion correction has been shown to accurately calculate the geometry for isolated molecules and weakly bound complexes of molecules [23,24,25]. It should be noted that computational programs exist to aid in identifying potential complex geometries [26]; however, these methods can be computationally expensive and were not employed here. A summary of the computational results can be found in the Supplemental Material.

2.3. MRR Measurements

Broadband MRR measurements. A 2–8 GHz chirped-pulse Fourier transform molecular rotational resonance spectrometer [27,28] was used to measure the chiral tag (-)-linalool spectra. Neon was used as the carrier gas, mixed with the chiral tag at 0.1% concentration and held at a backing pressure of +5 psig (1.3 bar). In this spectrometer, three identical pulsed nozzles, operating simultaneously, were used to increase the measurement sensitivity. Each nozzle, which was modified as previously described by Suenram et al. [29] to incorporate a reservoir to hold solid and liquid samples, was loaded with the liquid linalool sample and heated to 45 °C to generate sufficient vapor pressure. The nozzle pinhole diameter was 0.9 mm.
The nozzles were pulsed at a repetition rate of 5 Hz. On each sample injection cycle, eight chirped pulses, each spanning from 2–8 GHz with a duration of 4 µs, and separated in time by approximately 50 µs, were amplified with a 200-watt traveling wave tube amplifier and broadcast across the sample chamber using a high-gain broadband horn antenna. Following each pulse, the molecular free induction decay (FID) signal was recorded for 40 µs. These FIDs signals were accumulated in the time domain, and then Fourier transformed with a Kaiser–Bessel apodization function (β = 6) to yield the frequency domain spectrum. The analysis was performed using the first 20 ms of the FID measurement. For the Aldrich linalool standard, a total of 250,000 FIDs (1.7 hours of measurement, using approximately 40 mg of linalool) were recorded with a racemic TFPO tag, and 400,000 FIDs (2.7 h of measurement, using approximately 65 mg of linalool) were recorded with the high-enantiopurity (S) tag.
Targeted MRR measurements. The IsoMRR spectrometer, based on the design of Balle and Flygare [30] and Suenram et al. [29], and previously described elsewhere [13,21], was used for rapid linalool EE measurements of the standard as well as in two essential oils. In this case, the sample was injected through a septum into a liner containing a glass wool plug to retain the liquid sample, which was maintained at 45 °C. The same mixture of neon and the desired chiral tag as in the broadband measurements was used, which flowed over the sample and was conveyed to a pulsed nozzle. The IsoMRR instrument contains a pair of mirrors, one of which is movable, to form a Fabry–Perot cavity for enhanced sensitivity compared to the broadband measurements. The cavity length can be automatically tuned to change the measurement frequency of the instrument. In the IsoMRR instrument, the nozzle is pulsed at a repetition rate of 10 Hz, with five FIDs measured on each gas pulse.

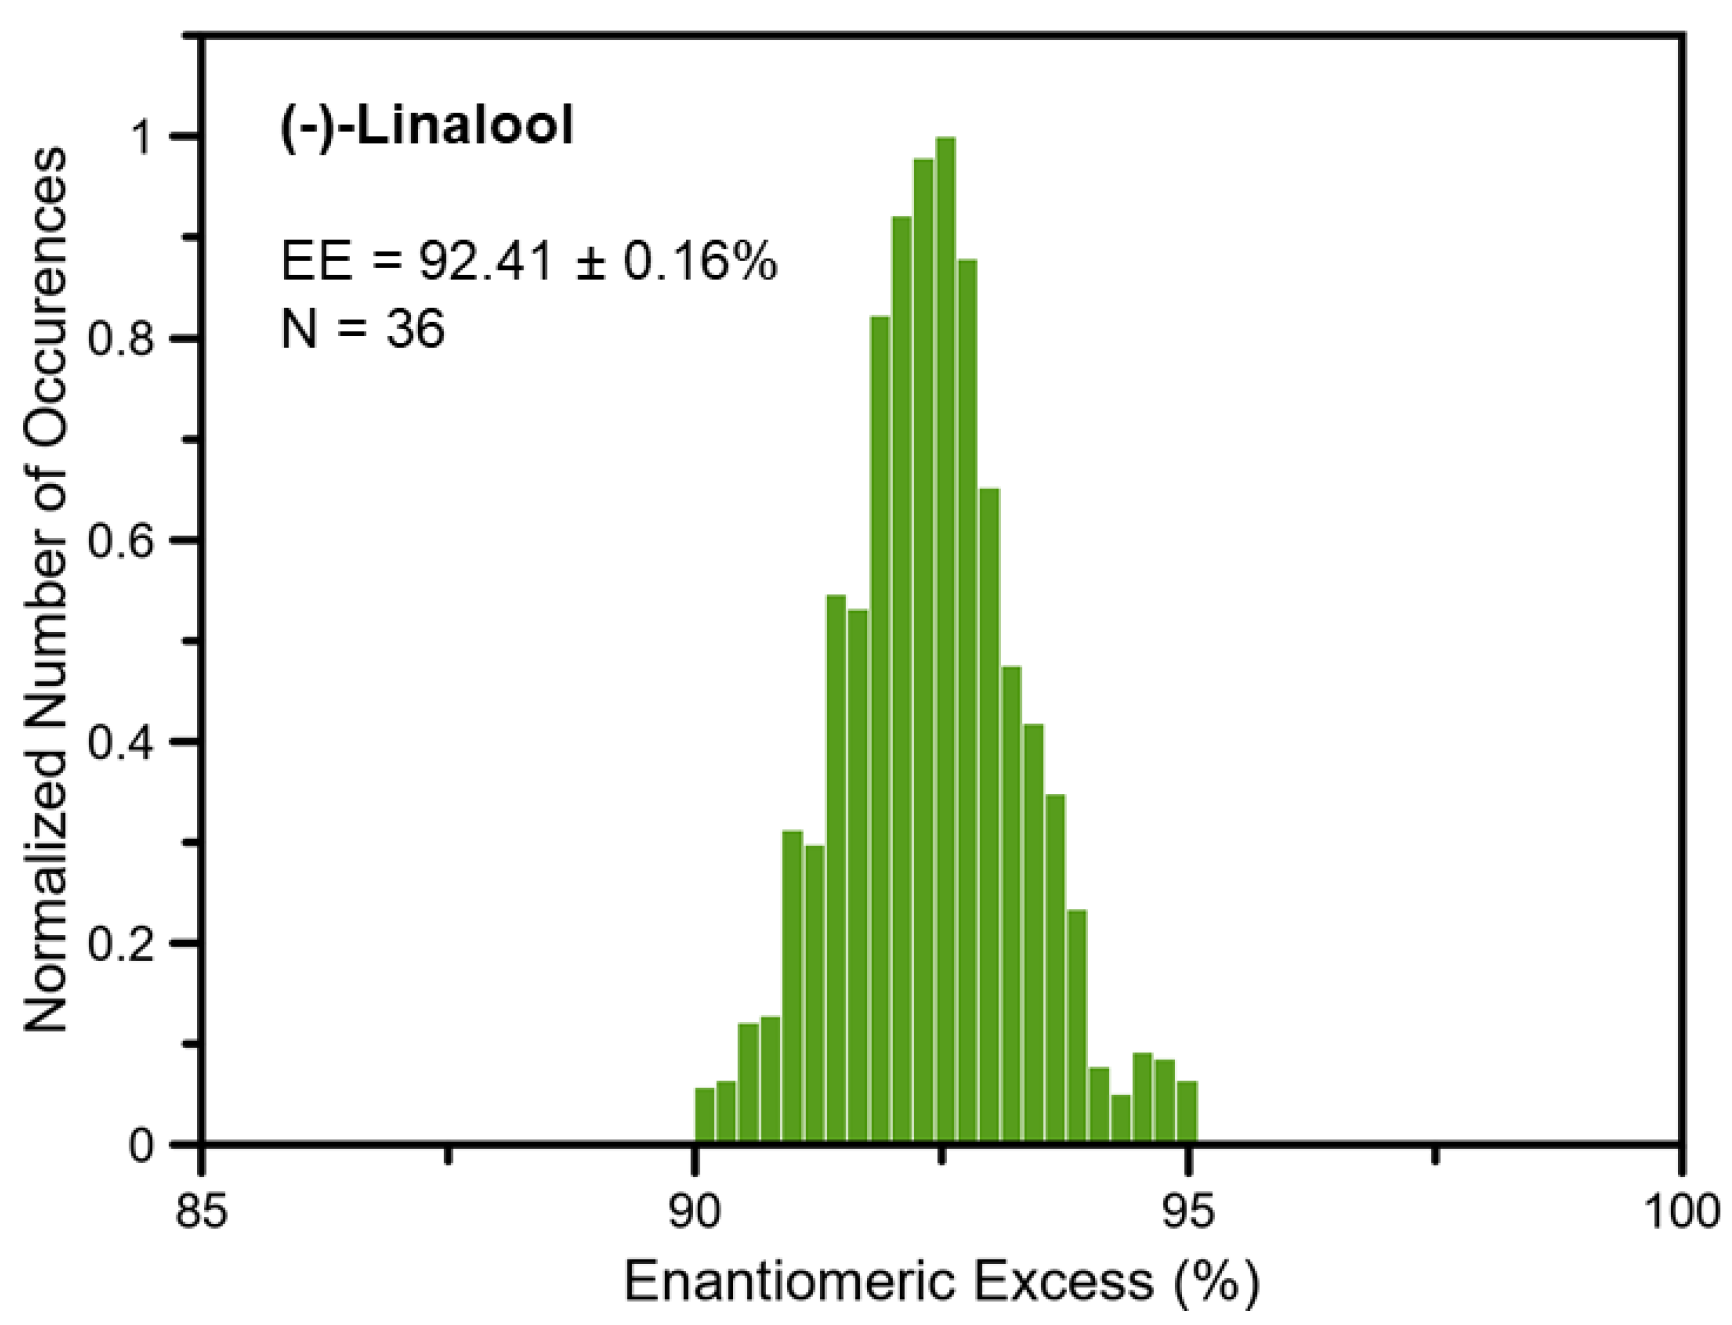
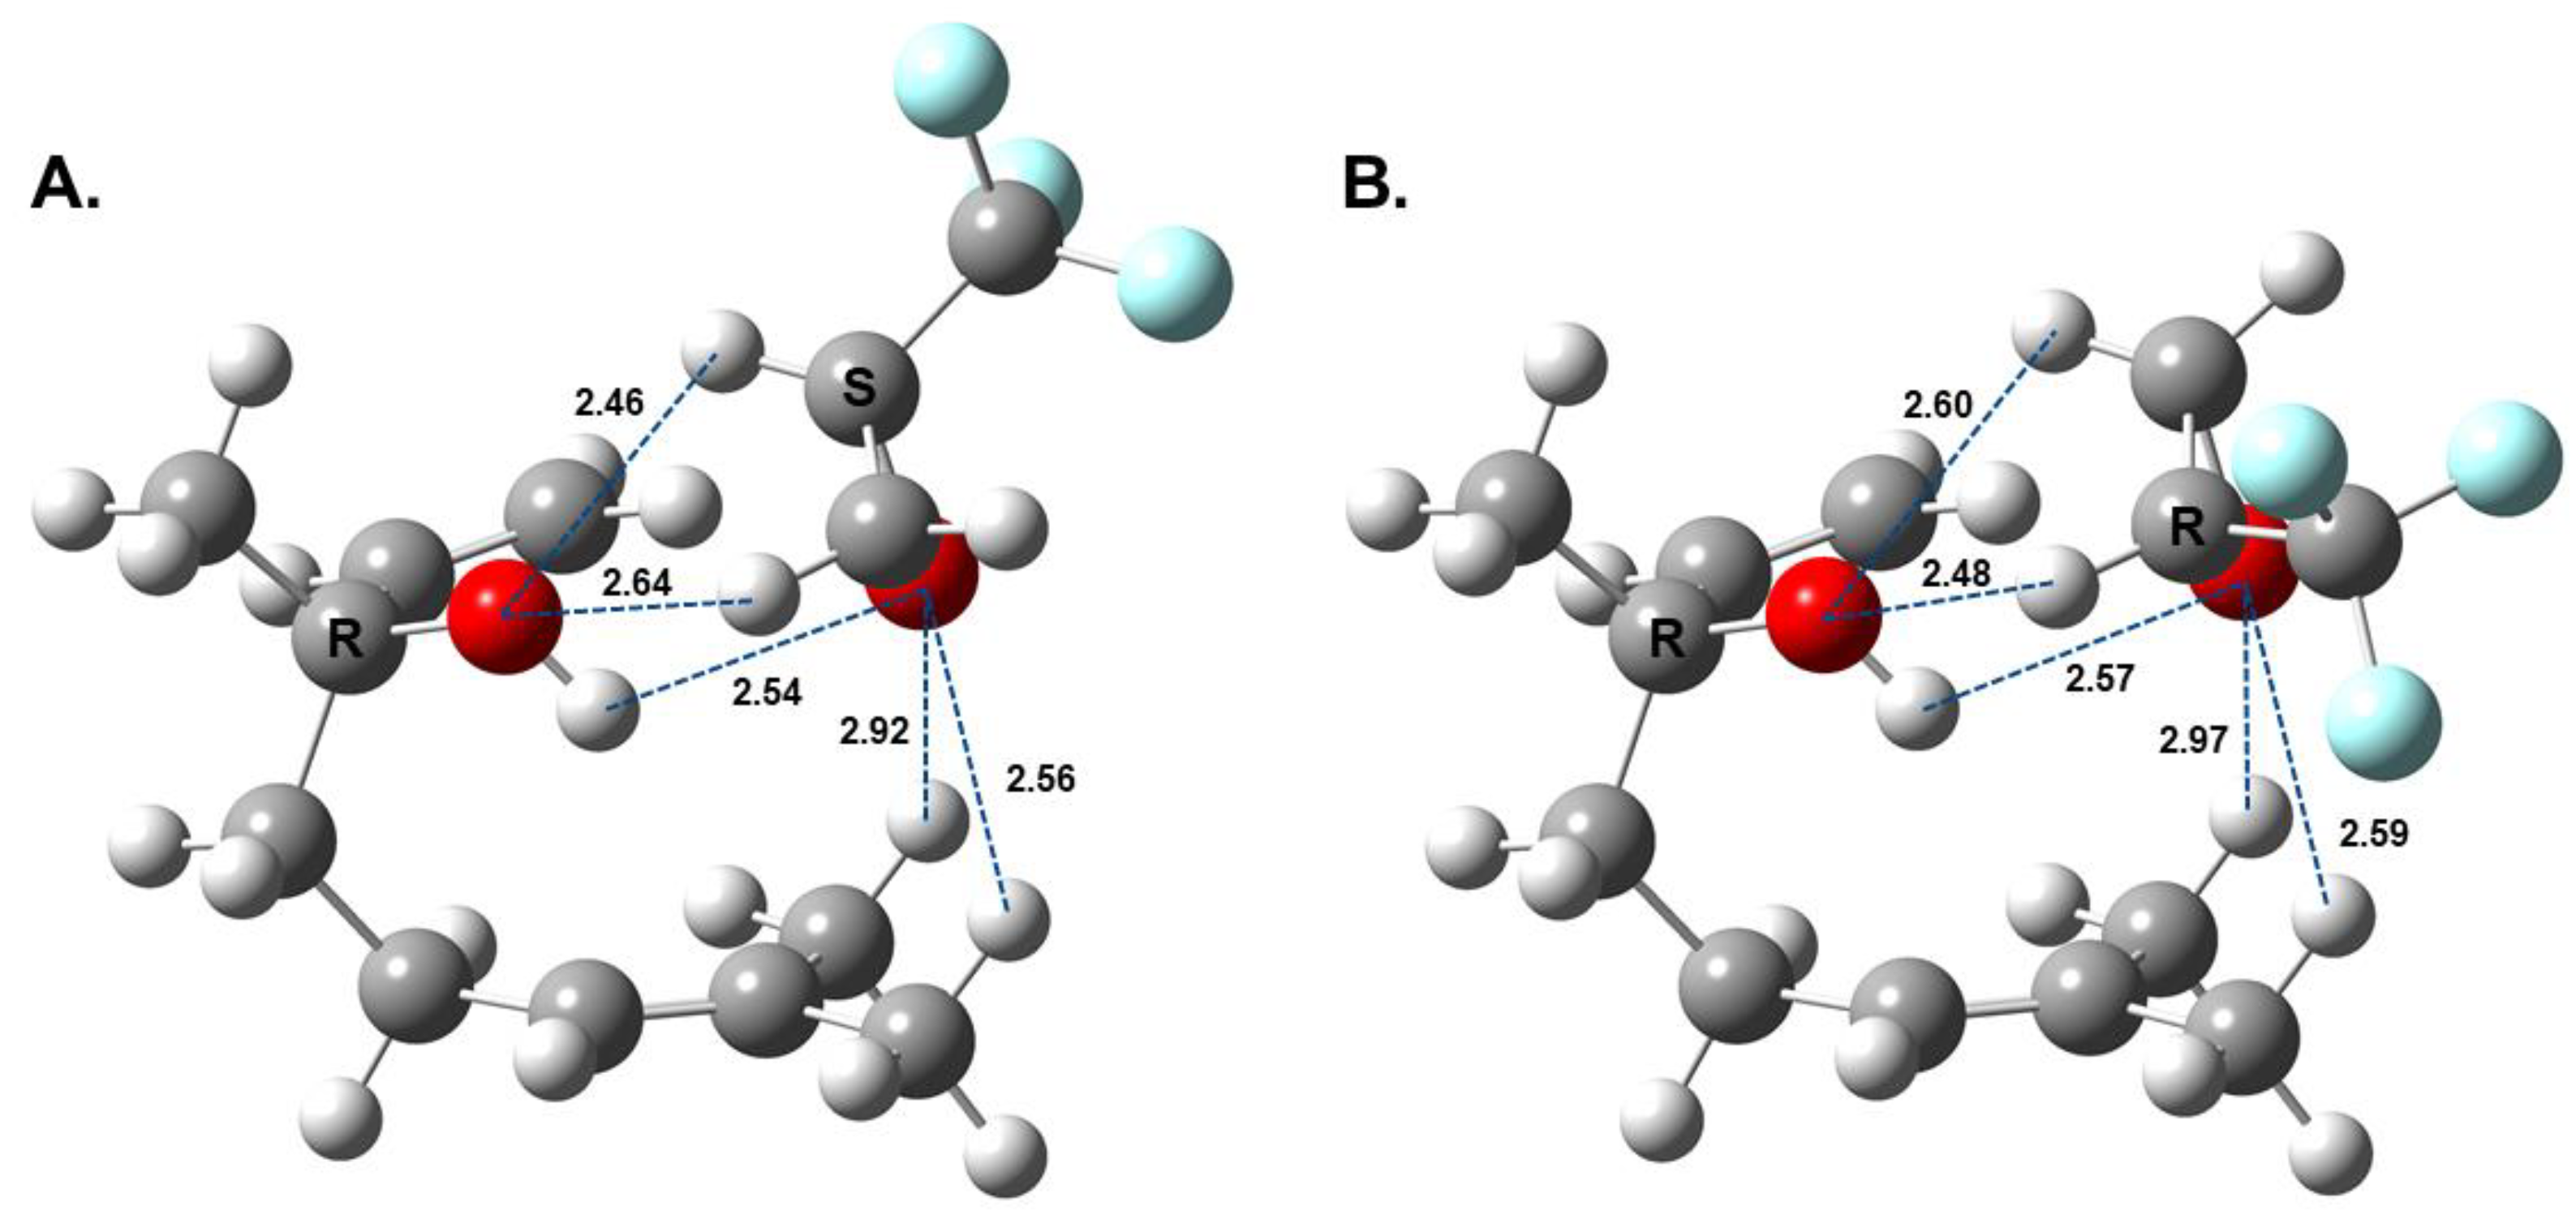
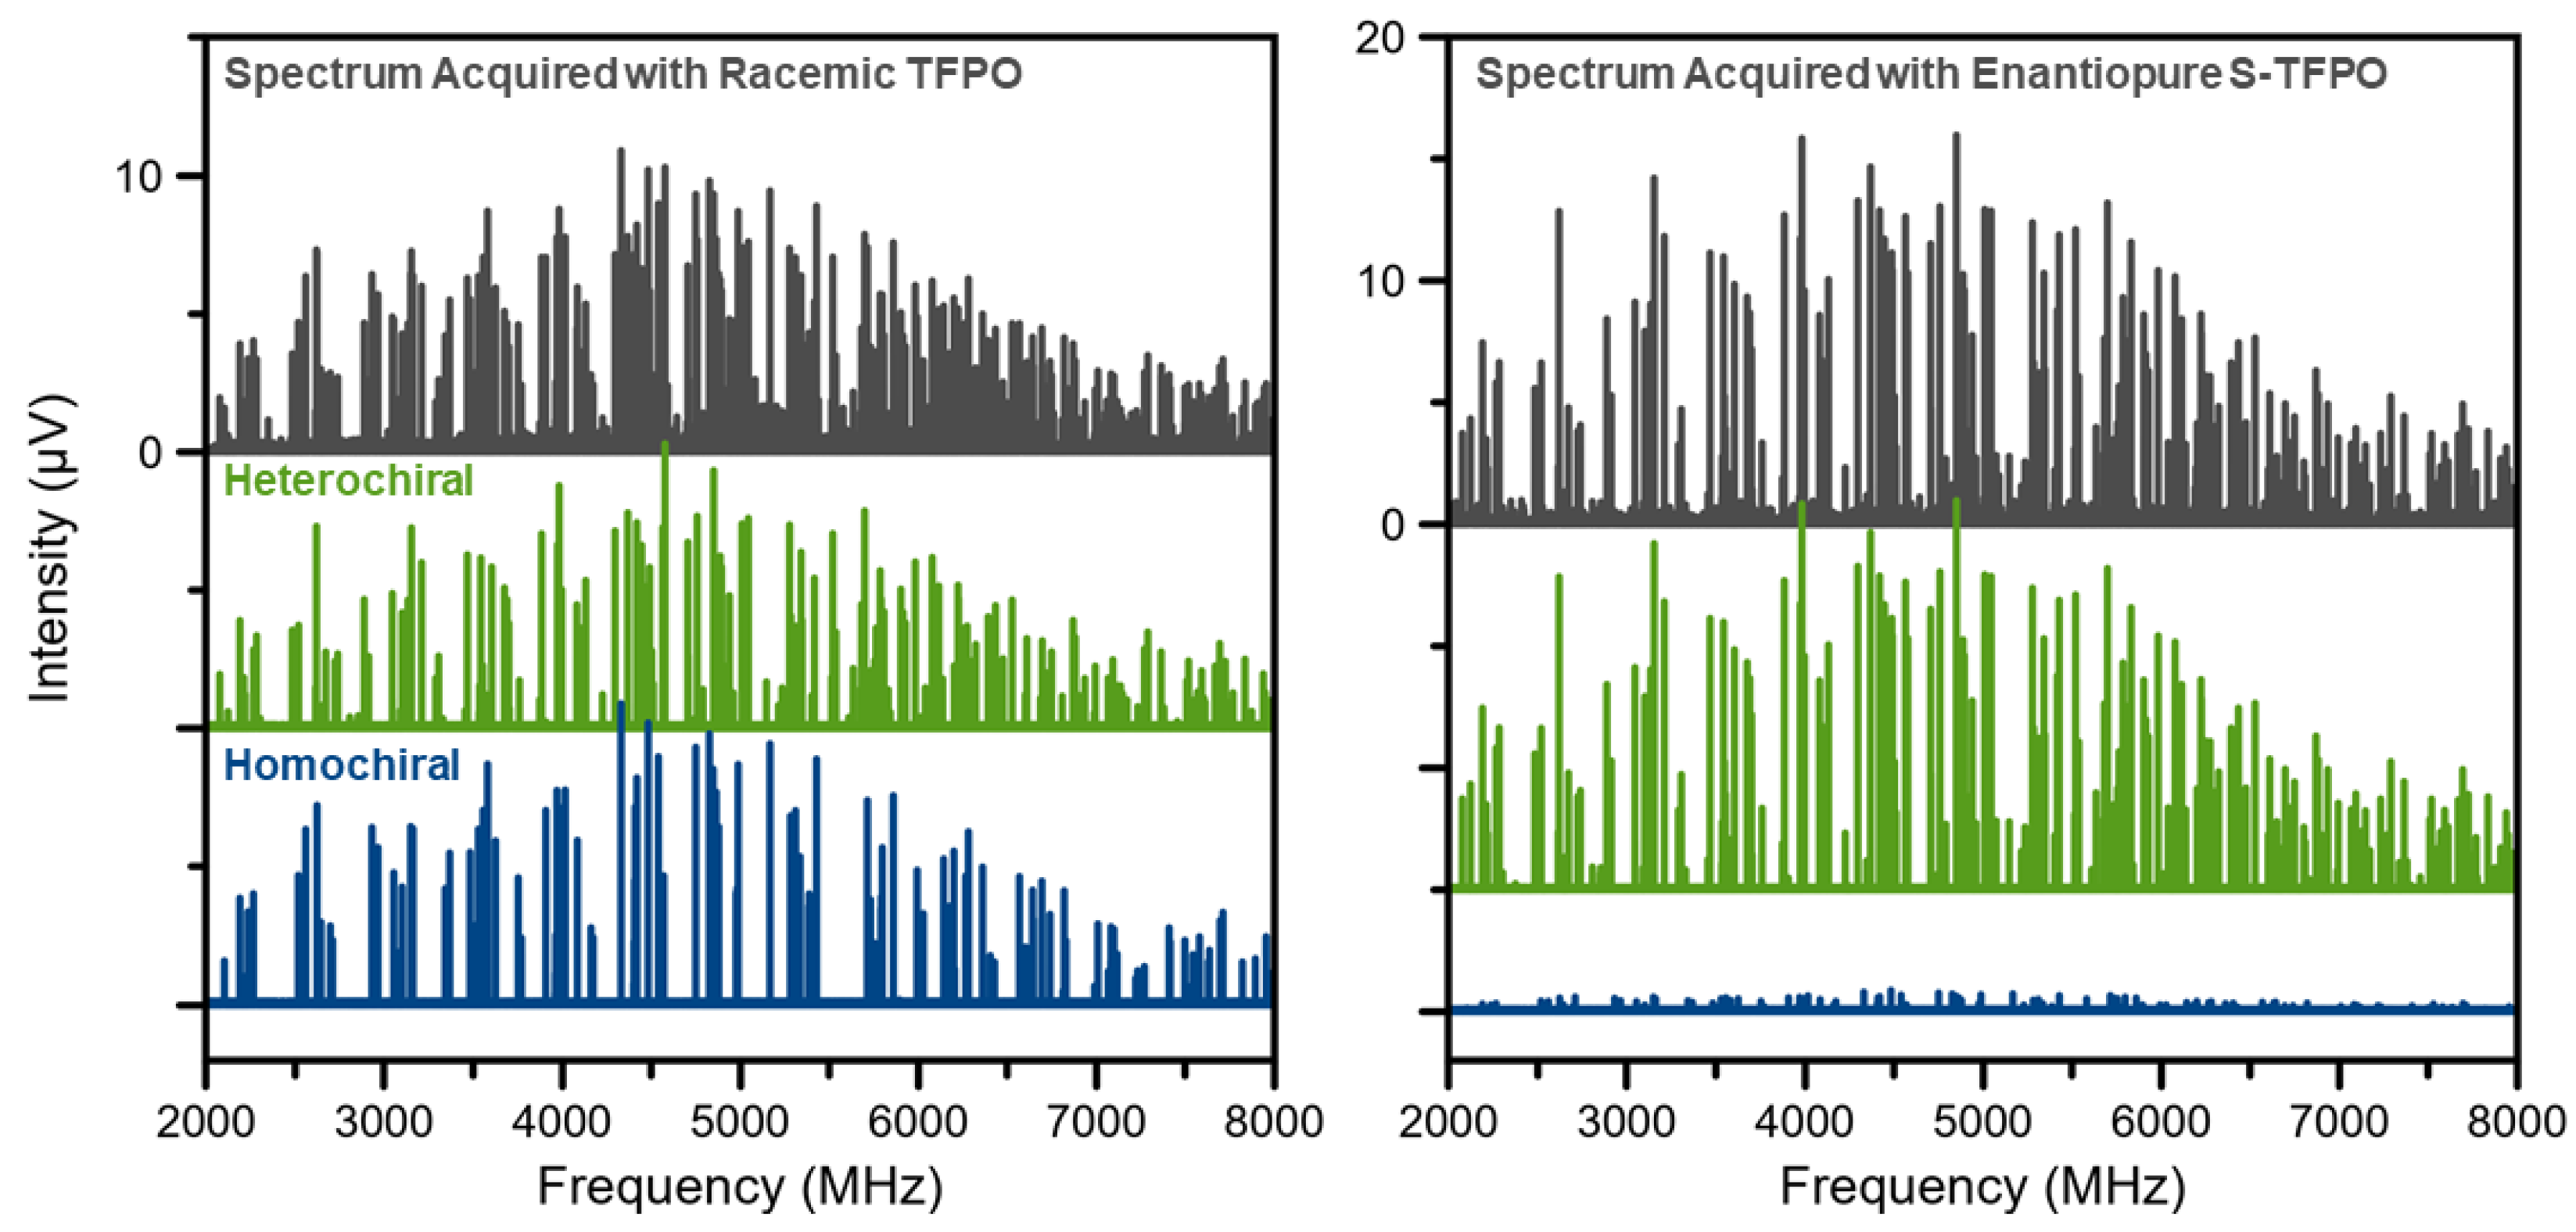
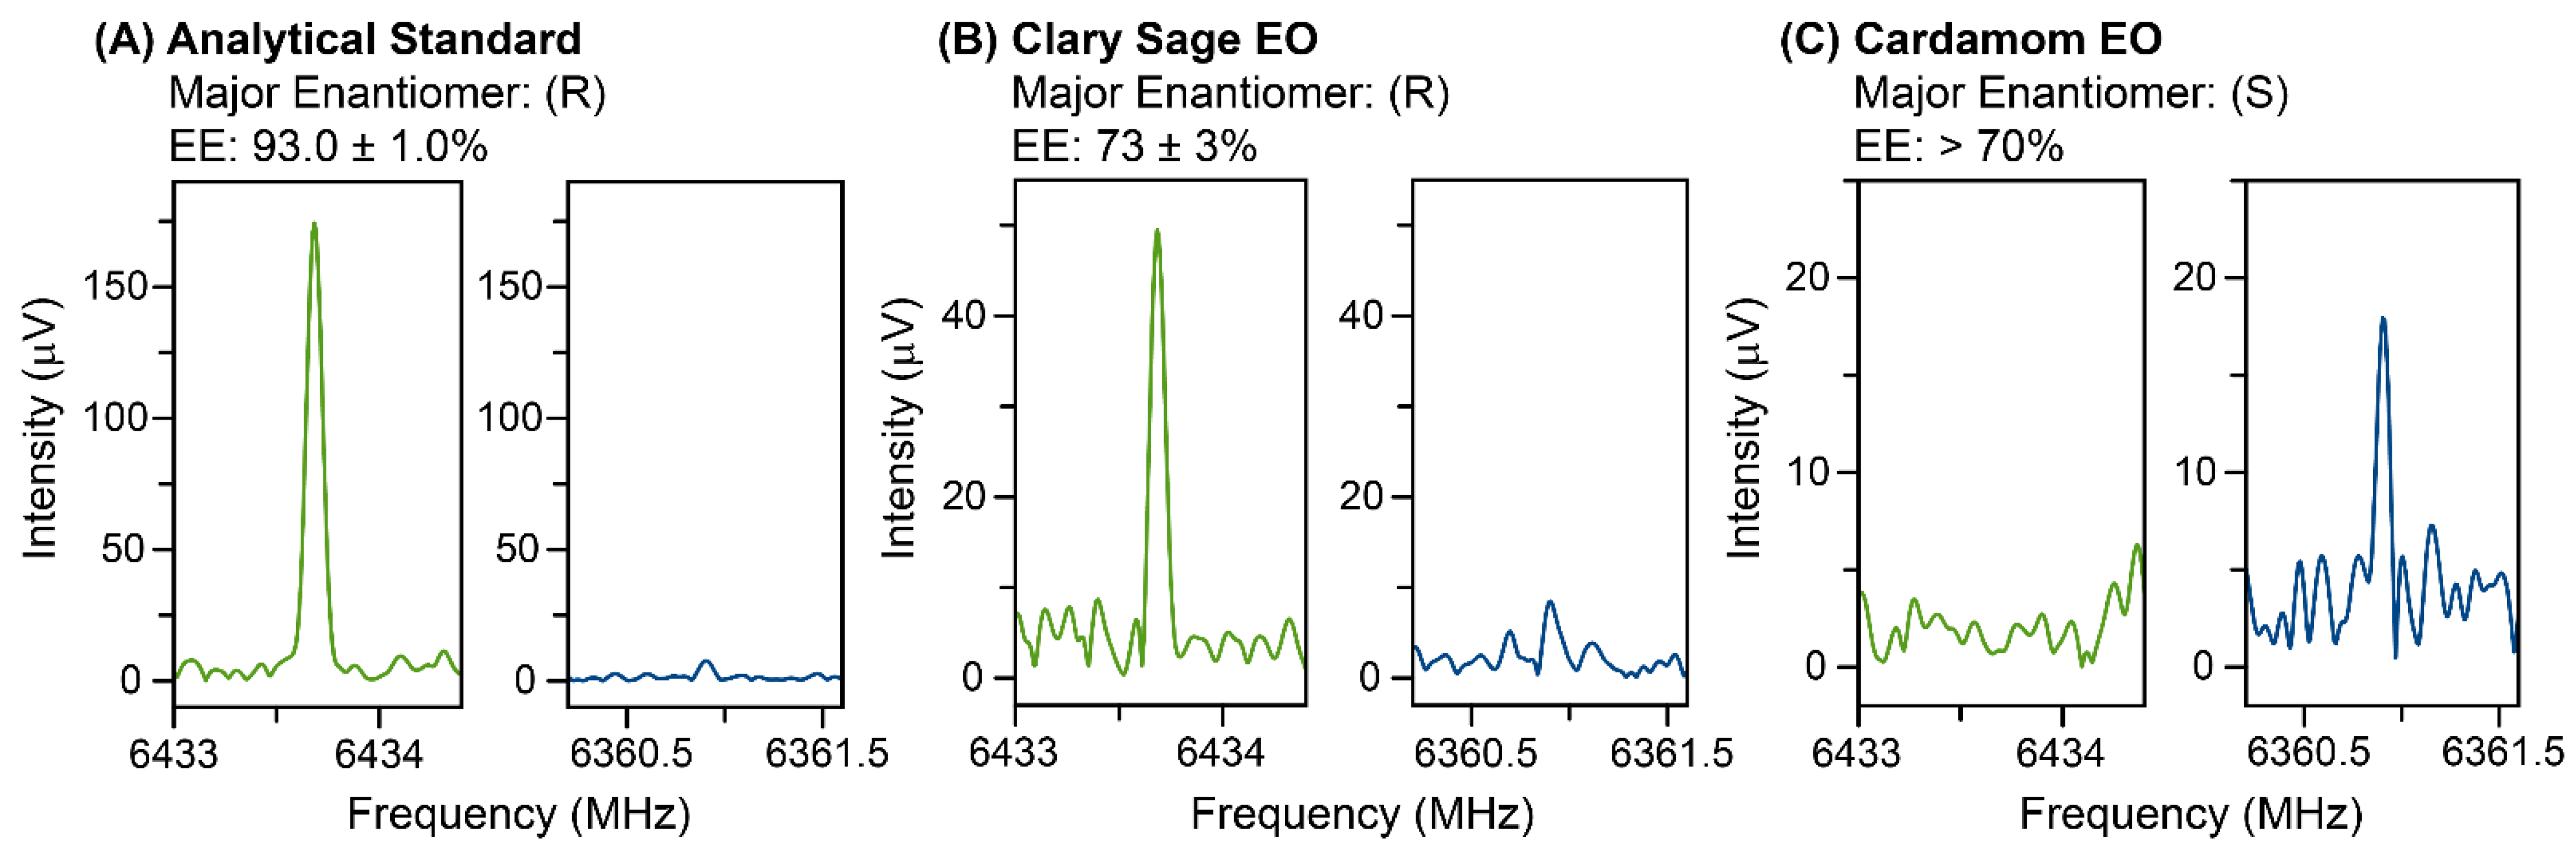
3. Results and Discussion

There are several chiral tags that can be used to resolve enantiomers. The main criterion for a chiral tag is that it is small, rigid, volatile, and commercially available with high enantiopurity. The first step in a chiral tagging measurement is to determine the most suitable tag for the analyte under study. For this measurement, the racemic tag is used to calibrate the instrument response and identify the diastereomeric complexes. The tags are evaluated based on their ability to produce complexes with strong MRR signals, which depends on the strength of the analyte–tag interaction, the number of distinct complex geometries produced (since isomers dilute the spectral intensity), and the dipole moments of the complexes. Since linalool has a hydroxyl group, two tags containing H-bond donors were tested: propylene oxide (PO) and (3,3,3)-trifluoro-1,2-epoxypropane (trifluoro-propylene oxide, TFPO) [31]. The spectrum of the linalool monomer, as well as that of the prospective tags, was measured independently so that these transitions could be filtered out, and the chiral tag complex transitions were isolated. We found that the TFPO tag resulted in the strongest complex signals. Though only differing by the presence of a -CF3 group instead of a methyl group, TFPO can be preferable to PO in some cases because the fluorines can result in a molecular complex with a larger dipole moment than its equivalent structure with PO. The geometries of the resulting complexes can also vary in energy, leading to differences in the number of observed isomers. With the best tag determined, electronic structure calculations were performed to identify the geometries of the complexes that are most prevalent in the MRR spectrum. Potential complex isomers were generated using the two lowest-energy conformers of linalool; the calculations explored various orientations of the tag and analyte that resulted in an H-bond between the hydroxyl group of the analyte and the oxygen atom of the tag.
The geometry for each assigned complex was determined by comparing the rotational constants of the assigned linalool/TFPO complexes with the calculations. In addition, the orientation of the complex’s dipole moment (expressed as projections on the three principal axes, µa, µb, and µc) governs the relative transition intensities of a-, b-, and c-type transitions, and for a good match, the observed relative intensities should be in good agreement with the dipole moment calculations. Table 1 shows the comparison of the two experimental assignments with the lowest-energy calculated isomers of the homochiral and heterochiral complexes. Excellent agreement (better than 1%) is observed between the experimental and calculated rotational constants. Additionally, the comparison of the rotational constants with the calculated constants for the other diastereomeric complex clearly indicates that it is not a suitable match (errors above 3% for at least one of the three constants). A full summary of the spectroscopic fits, including the dipole direction analysis, can be found in the Supplementary Material.
In its lowest-energy conformation, isolated linalool contains an intramolecular interaction between the hydroxyl group and the π-orbital of the double bond, with the next lowest conformer arising from the rotation at the double bond (Figure 1). Though not a traditional H-bond, π-orbitals have been shown to act as H-bond acceptors [32,33]. These geometries agree with a previous computational and MRR study of linalool, which found that only the lowest-energy conformation is observable in the pulsed jet [20]. Figure 2 shows the geometries of the two lowest-energy isomers of the diastereomeric complexes of linalool/TFPO. For both the heterochiral and homochiral complexes, the internal geometry of linalool does not change significantly when complexed with TFPO. Instead, linalool maintains the intramolecular interaction observed in the isolated molecule while also forming intermolecular H-bonds with TFPO. The dashed blue lines shown in Figure 2 indicate the H-bond network formed between the tag and analyte. The H-bonds are not all “traditional” H-bonds and vary in the strength of their interactions. The oxygen of TFPO forms an H-bond with the hydroxyl group of linalool and hydrogens of the -CH3 groups attached to C7, which are expected to be slightly electropositive due to the double bond of the adjacent carbon. The complex is also stabilized by the hydrogens of the oxirane group that interact with the lone pairs of the hydroxyl group of linalool. In both cases, the hydrogen on the chiral carbon is closer to the oxygen, presumably due to -CF3 being a strong electron-withdrawing group. Based on the relative energies of the calculated geometries, one isomer of each complex was expected to dominate in the chiral tag measurements, which is what is observed. A complete summary of the quantum chemistry calculations can be found in the Supplemental Section.
The absolute configuration of the dominant enantiomer was established by acquiring a second chiral tagging spectrum, with an enantiopure tag—in this case, (S)-TFPO—and comparing the relative intensities of the two diastereomeric complexes in the racemic and enantiopure chiral tag measurements. Figure 3 shows the isolated complex spectra of a reference sample of (−)-linalool. The masked spectra of the experimental assignments are offset to illustrate the difference in intensity between the two chiral measurements. In the enantiopure measurement of the reference standard, the heterochiral complex dominates. The possible heterochiral complexes are either (R)-(−)-linalool/(S)-TFPO or (S)-(+)-linalool/(R)-TFPO. Since the spectrum was acquired using (S)-TFPO, the AC of the linalool standard is confirmed as (R)-(−)-linalool, matching the manufacturer’s specification.
The enantiomeric excess was determined by comparing the complex signal levels in the measurements with racemic and enantiopure tags. Enantiomeric excess (EE) is calculated by comparing the rotational transition intensities of two diastereomeric complexes [16,17,21]. Inherent differences in the response factor of each complex transition are corrected by normalizing the transition intensity between the racemic and enantiopure measurements:
I norm = I enantiopure   tag I racemic   tag
Then, for any pair of transitions (one from a heterochiral complex and one from a homochiral complex), the population ratio between the two complexes, R, can be determined by:
R = I norm , homo I norm , hetero
This ratio is then related to the enantiomeric excess of the analyte and tag by:
( R 1 ) ( R + 1 ) = ( e e Tag ) ( e e Analyte )
In this expression, ee denotes the fractional EE (i.e., if EE = 90, ee = 0.9). Because numerous transitions are observed for each complex, the accuracy of the EE measurement is improved by repeating the EE determination for multiple lines and taking the average value of these determinations. These results are presented in Figure 4 as a histogram of all the EE determinations. In this analysis, 36 transitions were chosen for each complex. The uncertainty of the final determination was calculated by taking the half-width at half-height of the histogram, divided by the square root of the number of transition pairs used in the analysis. The histogram analysis of the reference standard determined the EE to be 92.41 ± 0.16% (2σ). Using chiral GC-FID, an EE of 92.01% was found for this sample, in excellent agreement. The GC-FID chromatogram and method details are given in the Supplemental Material.
Once the broadband spectral assignments and structure characterization have been completed, the EE of additional samples containing linalool can be assessed using the targeted IsoMRR spectrometer, which requires significantly less time (and correspondingly less sample) than the broadband instrument to reach the same signal-to-noise ratio on a line, due to its resonator. However, the advantage of detecting multiple lines of each complex simultaneously is lost. There are multiple available transitions for each complex; when analyzing linalool in an essential oil mixture, this allows alternate lines to be chosen in case any of the transitions overlap with other components in an oil sample. The lines selected for evaluation were the 143,11 ← 133,10 transitions at 6433.68 MHz for the heterochiral complex and 6360.90 MHz for the homochiral complex. While it was the case in these measurements, it is not required that the transition quantum numbers be the same for the two complexes.
The sample conditions, including the optimal excitation power level, were optimized for each transition using racemic TFPO as the chiral tag. The instrument response for each line was also determined in this measurement (repeated six times to estimate the uncertainty). Then, with (S)-TFPO as the tag, three samples were measured: the (-)-linalool standard measured from Aldrich, and clary sage and cardamom, two essential oils where linalool is a significant component. The sample injection volume was 10 µL for each sample. We first performed an injection where the linalool monomer signal was measured to confirm that it stays constant during the time window of the enantiomeric measurement. For cardamom, we observed that the linalool signal did not appear immediately after injection, due to the presence of more volatile components, especially eucalyptol, that vaporize first. This wait time was programmed into the method. Additionally, the amount of integration time for each complex was adjusted for each sample, with more time devoted to the measurement of the complex corresponding to the less abundant enantiomer.
Results for the three samples are presented in Figure 5. The enantiomeric excess was determined using the same calculation as for the broadband analysis, which accounted for the enantiomeric excess of the tag. The uncertainty presented incorporated the uncertainty in both the calibration measurement and the final measurement. In practice, the measurement uncertainty for enantioenriched samples is usually limited by the signal-to-noise ratio of the weaker complex in the measurement. The signal-to-noise ratio of the homochiral (weaker) complex from the Aldrich standard measured with (S)-TFPO is comparable between the IsoMRR measurement (20,000 FIDs) and the broadband measurement (400,000 FIDs). While the EE results are the same within measurement uncertainty for the two instruments, because 36 transitions were used in the broadband analysis, the uncertainty in the broadband measurement is approximately 6 times lower as expected. However, the IsoMRR measurement used less sample by approximately a factor of 40 and less measurement time by approximately a factor of 20.
In both of the EO samples, the complex signals are reduced from that of the standard, indicating that the vapor pressure consists of a mixture of components. This reduces the sensitivity of the EE measurements in a mixture; however, for determining adulteration, Figure 5 makes clear that we can immediately distinguish whether the sample consists of high-enantiopurity (R), high-enantiopurity (S), or near-racemic linalool, without any sample preparation or complex method development. As is expected, clary sage contains predominantly (R)-linalool, while cardamom has predominantly (S). The EE results in this figure are also consistent with our chiral GC results (see the Supplemental Information).

4. Conclusions

This work reports the use of chiral tagging MRR to resolve linalool enantiomers in an analytical standard and two essential oil samples, clary sage and cardamom. We found that upon complexation with TFPO, linalool maintains the same conformation as in the isolated gas phase. In each case, the AC determined by chiral tagging was consistent with the certificate of analysis or known dominant enantiomer for the botanicals; the AC of the analytical standard and clary sage EO was (R)-linalool and the AC of the cardamom EO was (S)-linalool. The EE of each sample was determined using chiral tagging MRR; all samples had high enantiopurity (92.41% for the standard, 73% for clary sage, >70% for cardamom). The linalool EE of the analytical standard was determined in two different MRR spectrometers and compared against chiral GC results with good agreement. This study shows chiral tagging can be used for direct enantiomer analysis in mixtures, providing a useful analytical tool for adulteration studies of EOs.

Supplementary Materials

The following supporting information can be downloaded at: https://www.mdpi.com/article/10.3390/sym14050917/s1, a complete summary of electronic structure calculations for complex geometries; information pertaining to spectroscopic assignments; enantiomeric excess calculations; and chiral GC measurements.

Author Contributions

Conceptualization, R.E.S., D.M.C. and J.L.N.; methodology, R.E.S. and J.L.N.; validation, R.E.S. and J.L.N.; formal analysis, R.E.S. and J.L.N.; investigation, R.E.S. and J.L.N.; resources, J.L.N. and D.M.C.; data curation, J.L.N.; writing—original draft preparation, R.E.S.; writing—review and editing, R.E.S., D.M.C. and J.L.N.; visualization, R.E.S.; supervision, J.L.N.; project administration, R.E.S. All authors have read and agreed to the published version of the manuscript.

Funding

This research received no external funding.

Data Availability Statement

Not applicable.

Conflicts of Interest

R.E.S., D.M.C. and J.L.N. have equity in BrightSpec, Inc.

References

  1. Raguso, R.A. More lessons from linalool: Insights gained from a ubiquitous floral volatile. Curr. Opin. Plant Biol. 2016, 32, 31–36. [Google Scholar] [CrossRef] [PubMed] [Green Version]
  2. Kamatou, G.P.P.; Viljoen, A.M. Linalool—A Review of a Biologically Active Compound of Commercial Importance. Nat. Prod. Commun. 2008, 3, 1934578X0800300727. [Google Scholar] [CrossRef] [Green Version]
  3. Aprotosoaie, A.C.; Hăncianu, M.; Costache, I.-I.; Miron, A. Linalool: A review on a key odorant molecule with valuable biological properties. Flavour Fragr. J. 2014, 29, 193–219. [Google Scholar] [CrossRef]
  4. Ozek, T.; Tabanca, N.; Demirci, F.; Wedge, D.; Baser, K.H.C. Enantiomeric Distribution of Some Linalool Containing Essential Oils and Their Biological Activities. Rec. Nat. Prod. 2010, 4, 180–192. [Google Scholar]
  5. Bakkali, F.; Averbeck, S.; Averbeck, D.; Idaomar, M. Biological effects of essential oils—A review. Food Chem. Toxicol. 2008, 46, 446–475. [Google Scholar] [CrossRef]
  6. Peana, A.T.; D’Aquila, P.S.; Panin, F.; Serra, G.; Pippia, P.; Moretti, M.D.L. Anti-inflammatory activity of linalool and linalyl acetate constituents of essential oils. Phytomedicine 2002, 9, 721–726. [Google Scholar] [CrossRef]
  7. Boren, K.; Dg, Y. Detecting Essential Oil Adulteration. J. Environ. Anal. Chem. 2015, 2, 1000132. [Google Scholar] [CrossRef]
  8. Casabianca, H.; Graff, J.B.; Faugier, V.; Fleig, F.; Grenier, C. Enantiomeric Distribution Studies of Linalool and Linalyl Acetate. A Powerful Tool for Authenticity Control of Essential Oils. J. High Resolut. Chromatogr. 1998, 21, 107–112. [Google Scholar] [CrossRef]
  9. Do, T.K.T.; Hadji-Minaglou, F.; Antoniotti, S.; Fernandez, X. Authenticity of essential oils. TrAC Trends Anal. Chem. 2015, 66, 146–157. [Google Scholar] [CrossRef]
  10. Gordy, W.; Cook, R.L. Microwave Molecular Spectra, 3rd ed.; John Wiley & Sons: Hoboken, NJ, USA, 1984. [Google Scholar]
  11. Joyce, L.A.; Schultz, D.M.; Sherer, E.C.; Neill, J.L.; Sonstrom, R.E.; Pate, B.H. Direct regioisomer analysis of crude reaction mixtures via molecular rotational resonance (MRR) spectroscopy. Chem. Sci. 2020, 11, 6332–6338. [Google Scholar] [CrossRef]
  12. Schmitz, D.; Shubert, V.A.; Betz, T.; Schnell, M. Exploring the conformational landscape of menthol, menthone, and isomenthone: A microwave study. Front. Chem. 2015, 3, 15. [Google Scholar] [CrossRef] [PubMed]
  13. Neill, J.L.; Yang, Y.; Muckle, M.T.; Reynolds, R.L.; Evangelisti, L.; Sonstrom, R.E.; Pate, B.H.; Gupton, B.F. Online Stereochemcial Process Monitoring by Molecular Rotational Resonance Spectroscopy. Org. Process. Res. Dev. 2019, 23, 1046–1051. [Google Scholar] [CrossRef]
  14. Smith, J.A.; Wilson, K.B.; Sonstrom, R.E.; Kelleher, P.J.; Welch, K.D.; Pert, E.K.; Westendorff, K.S.; Dickie, D.A.; Wang, X.; Pate, B.H.; et al. Preparation of cyclohexene isotopologues and stereoisotopomers from benzene. Nature 2020, 581, 288–293. [Google Scholar] [CrossRef] [PubMed]
  15. Vang, Z.P.; Reyes, A.; Sonstrom, R.E.; Holdren, M.S.; Sloane, S.E.; Alansari, I.Y.; Neill, J.L.; Pate, B.H.; Clark, J.R. Copper-Catalyzed Transfer Hydrodeuteration of Aryl Alkenes with Quantitative Isotopomer Purity Analysis by Molecular Rotational Resonance Spectroscopy. J. Am. Chem. Soc. 2021, 143, 7707–7718. [Google Scholar] [CrossRef] [PubMed]
  16. Pate, B.H.; Evangelisti, L.; Caminati, W.; Xu, Y.; Thomas, J.; Patterson, D.; Perez, C.; Schnell, M. Chapter 17—Quantitative Chiral Analysis by Molecular Rotational Spectroscopy. In Chiral Analysis, 2nd ed.; Polavarapu, P.L., Ed.; Elsevier: Amsterdam, The Netherlands, 2018; pp. 679–729. [Google Scholar] [CrossRef]
  17. Sonstrom, R.E.; Neill, J.L.; Mikhonin, A.V.; Doetzer, R.; Pate, B.H. Chiral analysis of pantolactone with molecular rotational resonance spectroscopy. Chirality 2022, 34, 114–125. [Google Scholar] [CrossRef]
  18. Xie, F.; Seifert, N.A.; Hazrah, A.S.; Jäger, W.; Xu, Y. Conformational Landscape, Chirality Recognition and Chiral Analyses: Rotational Spectroscopy of Tetrahydro-2-Furoic Acid Propylene Oxide Conformers. ChemPhysChem 2021, 22, 455–460. [Google Scholar] [CrossRef]
  19. Domingos, S.R.; Pérez, C.; Marshall, M.D.; Leung, H.O.; Schnell, M. Assessing the performance of rotational spectroscopy in chiral analysis. Chem. Sci. 2020, 11, 10863–10870. [Google Scholar] [CrossRef]
  20. Nguyen, H.V.L.; Mouhib, H.; Klahm, S.; Stahl, W.; Kleiner, I. A touch of lavender: Gas-phase structure and dynamics of the monoterpene linalool validated by microwave spectroscopy. Phys. Chem. Chem. Phys. 2013, 15, 10012–10018. [Google Scholar] [CrossRef]
  21. Neill, J.L.; Mikhonin, A.V.; Chen, T.; Sonstrom, R.E.; Pate, B.H. Rapid quantification of isomeric and dehalogenated impurities in pharmaceutical raw materials using MRR spectroscopy. J. Pharm. Biomed. Anal. 2020, 189, 113474. [Google Scholar] [CrossRef]
  22. Frisch, M.J.; Trucks, G.W.; Schlegel, H.B.; Scuseria, G.E.; Robb, M.A.; Cheeseman, J.R.; Scalmani, G.; Barone, V.; Petersson, G.A.; Nakatsuji, H.; et al. Gaussian 16 Revision C.01; Gaussian Inc.: Wallingford, CT, USA, 2016. [Google Scholar]
  23. Grimme, S.; Steinmetz, M. Effects of London dispersion correction in density functional theory on the structures of organic molecules in the gas phase. Phys. Chem. Chem. Phys. 2013, 15, 16031–16042. [Google Scholar] [CrossRef]
  24. Grimme, S.; Ehrlich, S.; Goerigk, L. Effect of the damping function in dispersion corrected density functional theory. J. Comput. Chem. 2011, 32, 1456–1465. [Google Scholar] [CrossRef] [PubMed]
  25. Grimme, S.; Hansen, A.; Brandenburg, J.G.; Bannwarth, C. Dispersion-Corrected Mean-Field Electronic Structure Methods. Chem. Rev. 2016, 116, 5105–5154. [Google Scholar] [CrossRef] [PubMed] [Green Version]
  26. Pracht, P.; Bohle, F.; Grimme, S. Automated exploration of the low-energy chemical space with fast quantum chemical methods. Phys. Chem. Chem. Phys. 2020, 22, 7169–7192. [Google Scholar] [CrossRef] [PubMed]
  27. Brown, G.G.; Dian, B.C.; Douglass, K.O.; Geyer, S.M.; Shipman, S.T.; Pate, B.H. A broadband Fourier transform microwave spectrometer based on chirped pulse excitation. Rev. Sci Instrum 2008, 79, 053103. [Google Scholar] [CrossRef] [PubMed]
  28. Brown, G.G.; Dian, B.C.; Douglass, K.O.; Geyer, S.M.; Pate, B.H. The rotational spectrum of epifluorohydrin measured by chirped-pulse Fourier transform microwave spectroscopy. J. Mol. Spectrosc. 2006, 238, 200–212. [Google Scholar] [CrossRef]
  29. Suenram, R.D.; Grabow, J.U.; Zuban, A.; Leonov, I. A portable, pulsed-molecular-beam, Fourier-transform microwave spectrometer designed for chemical analysis. Rev. Sci. Instrum. 1999, 70, 2127–2135. [Google Scholar] [CrossRef] [Green Version]
  30. Balle, T.J.; Flygare, W.H. Fabry–Perot cavity pulsed Fourier transform microwave spectrometer with a pulsed nozzle particle source. Rev. Sci. Instrum. 1981, 52, 33–45. [Google Scholar] [CrossRef]
  31. Marshall, M.D.; Leung, H.O.; Wang, K.; Acha, M.D. Microwave Spectrum and Molecular Structure of the Chiral Tagging Candidate, 3,3,3-Trifluoro-1,2-epoxypropane and Its Complex with the Argon Atom. J. Phys. Chem. A 2018, 122, 4670–4680. [Google Scholar] [CrossRef]
  32. Levitt, M.; Perutz, M.F. Aromatic rings act as hydrogen bond acceptors. J. Mol. Biol. 1988, 201, 751–754. [Google Scholar] [CrossRef]
  33. Li, J.; Zhang, R.-Q. Strong orbital interaction in a weak CH-π hydrogen bonding system. Sci. Rep. 2016, 6, 22304. [Google Scholar] [CrossRef]
Figure 1. Optimized geometries of the low-energy conformers of linalool. Conformers were identified using GMMX and optimized using B3LYP-D3BJ/6-311++G(d,p) level of theory using Gaussian16 [22].
Symmetry 14 00917 g001
Figure 2. Lowest-energy isomers of linalool/TFPO (A) heterochiral and (B) homochiral complexes. The dashed lines show the non-covalent interactions between the analyte and tag with the distance between atoms provided in Angstrom (Å). Complex geometries were calculated at B3LYP-D3BJ/def2-TZVP level of theory.
Symmetry 14 00917 g002
Figure 3. Chiral analysis of (−)-linalool using TFPO. Complexes were isolated by removing the transitions belonging to the monomer and the tag. Masks of the two complex assignments, identified by comparison of experimental and calculated rotational constants, are offset to show the relative intensity of the diastereomeric complexes in each measurement. The left panel shows the spectrum acquired using racemic TFPO and the right panel shows the isolated spectrum acquired with (S)-TFPO.
Symmetry 14 00917 g003
Figure 4. Histogram analysis of (−)-linalool performed using TFPO as the chiral tag. The analysis was performed by calculating the enantiomeric excess (EE) using the thirty-six strongest transitions for each complex.
Symmetry 14 00917 g004
Figure 5. Targeted IsoMRR measurements of linalool chiral purity in a standard and two essential oils, with (S)-TFPO as the chiral tag. In each panel, the green trace indicates the measured transition of the heterochiral complex, while the blue trace indicates the homochiral complex. For the cardamom EO, the heterochiral complex (corresponding to (R)-linalool) is not detected, so a lower limit is provided. The transition frequencies and excitation conditions were the same for each oil, while the number of signal averages was changed between samples to increase the amount of time spent measuring the weaker complex. For the analytical standard, 20,000 FID acquisitions were performed on the minor complex, while 10,000 FID acquisitions were performed on the minor complex for the two essential oils.
Symmetry 14 00917 g005
Table 1. Comparison of the experimentally determined rotational constants with the calculated constants from the optimized equilibrium geometries of the lowest-energy complex isomers of linalool/TFPO. Geometries were optimized using B3LYP-D3BJ/def2-TZVP level of theory.
Experiment-1 aHomochiral Lowest-Energy Isomer bErrorHeterochiral Lowest-Energy Isomer cError
A/MHz550.2565(27)554.905−0.84%531.806+3.35%
B/MHz236.05869(16)234.979+0.46%240.944−2.07%
C/MHz202.98183(15)202.935+0.02%199.451+1.74%
Experiment-2 aHomochiral Lowest-Energy IsomerErrorHeterochiral Lowest-Energy IsomerError
A/MHz526.62456(17)554.905−5.37%531.806−0.98
B/MHz241.281240(95)234.979+2.61%240.944+0.14
C/MHz198.667830(95)202.935−2.15%199.451−0.39
a Full details of the experimental fits can be found in the Supplement. b Homochiral complex energy: −958.3989444 hartree. c Heterochiral complex energy: −958.3988105 hartree (0.35 kJ/mol higher than homochiral).
Publisher’s Note: MDPI stays neutral with regard to jurisdictional claims in published maps and institutional affiliations.

