Abstract
Pedobarography is a safe, non-invasive diagnostic method that enables estimation of plantar pressure distribution. This article aims to describe the symmetry between right and left toes in the Polish adult population using data obtained during postural pedobarographic examinations. Eighty-two patients, both sexes, with a mean age of 42.12 (range 19–70), without significant pathologies, participated in the study. Plantar pressure was evaluated using a PEL38 pressure plate. The study applies the elements of Cavanagh’s classification to identify the foot sole regions: Hallux, Second Toe and Lateral Toe areas and the entire foot surface. The parameters measured included maximal and average pressures, total support area for each foot, and contact area of the foot with the ground at individual moments of standing. The results showed significantly greater loading under the right Hallux in women. As regards men, higher values in the whole foot pressure distribution were noted on the left side. Plantar pressure distribution does not increase along with the global factors such as age and body mass. The findings suggest that the asymmetry in the morphological structure of the foot does not determine the asymmetry in the plantar pressure distribution. None of the feet studied had full symmetry on the entire surface.
1. Introduction
The phenomena of symmetry and asymmetry are universal by nature. The very concept of symmetry has its roots in antiquity. Euclid’s “Elements” symmetry, understood as commensurability, has become fundamental to expressing the ideas of harmony, beauty and unity. Defining ideal symmetry of the human body has been popular with artists since antiquity. In the Renaissance, Leonardo Da Vinci, following Vitruvius’ view, indicated that the proportions between the individual parts of the human body reflect the harmony that exists in nature—based on geometric order. The challenge of modern science is to identify the correlations, commonly described as fractal models, a golden number, pi number, or equations in quantum mechanics. One of the most important directions of scientific research in modern science is proving or denying the existence of supersymmetry by physicists, which is understood as the relationship between two basic classes of elementary particles: bosons, which have an integer-valued spin, and fermions, which have a half-integer-valued spin.
Although the human body is characterized by bilateral symmetry, the right and left antimeres of the human body are not identical. This phenomenon originates in the ontogenetic period and arises from numerous asymmetries, which determines the topography of the human body. According to the principle that every symmetry implies asymmetry, the musculoskeletal system asymmetry can also be observed in external proportions.
A broad analysis of the literature has shown that the topic we are discussing is not covered in the available literature. Most of the articles concern asymmetry in various types of pathologies, not healthy people, and this is not the topic of this research. In addition, these articles discuss dynamic mode pedobarography (test during walking), while the postural mode pedobarography (examination during standing) is used for current analysis. Previous studies demonstrated that the right and left foot symmetry is rare. Asymmetry mainly applies to beta angle, plantar pressure distribution and the foot’s contact area with the ground among girls and boys in early school age [1]. As it is known, studies on the left and right foot symmetry found in the literature focus on the entire foot. The issues of assessing symmetry and asymmetry within the foot were dealt with by Wafai et al., Titianova et al., Mayolas et al., and Wang et al. [2,3,4,5]. However, there is a paucity of clinical data on symmetry of the lesser toes. Therefore, our study may be interesting particularly due to the morphological conditions of IV and V toes.
The anthropometric measurements of particular body regions guarantee objective evaluation of existing differences in anatomical structure. Recent technological developments, including artificial intelligence, nanotechnology and medical engineering solutions, have led to new trends in the diagnosis of the musculoskeletal system, using methods that enable a direct assessment of its function and biomechanics [6]. Pedobarography analysis, one of the main foot diagnostic method, shows the plantar pressure distribution while standing or walking. It provides information on its size and distribution with a graphical representation of the results [7]. In the literature, three types of pedobarographic examination are distinguished: static, postural and dynamic. Static pedobarography describes plantar pressure distribution during stance in the particular time; therefore, ‘dynamics of standing’ is tested with postural pedobarography. The number of forces acting on the plantar surface of the foot during gait is determined by dynamic pedobarographic examination, capturing the foot propulsion phase [8,9,10].
The most common classification of foot regions used in pedobarography are: Blomgren’s, Cavanagh’s, Kernozek’s, Stess’ and Bowen’s. They include foot regions and differences between pressures in particular regions that have been distinguished in the clinical anatomy [11,12,13,14,15].
The primary function of the forefoot during gait is its participation in the push off phase. The chief element involved is the great toe (Hallux) [16,17]. Previous studies on plantar pressure distribution indicate that IV and V toes’ involvement in the stance phase of the gait is negligible. The values of pressures beneath the fourth toe in static; postural and dynamic tests were not higher than 10% of those beneath Hallux. The increased loading was associated, for example, with flexion contracture ranged between 5°–25° of the PIP (proximal interphalangeal joint) and DIP (distal interphalangeal joint) of the fourth toe, as well as flexion contracture ranged 5°–60° of the PIP and DIP joint of the fifth toe [18,19]. In particular, there has been no study so far to investigate whether morphological disorders of the IV and V toe result in functional symmetry in the plantar pressure distribution of the left and right foot.
The aim of this study is to determine the symmetry between right and left toes in the Polish adult population using images obtained from postural pedobarographic examinations.
2. Materials and Methods
2.1. Subjects
Eighty-two patients (41 women, 41 men), with a mean age of 42.12 (range 19–70), participated in a study, as shown in Table 1. Age, body mass, and body height were normally distributed in women and men. All subjects pointed to the right upper limb as dominant (right-handed). None of the patients reported any pain; they were free of musculoskeletal system disorders, joint disorders and lower limb disease, and any other neuromuscular or chromosomal disorders, as well as of systemic diseases that might induce a compensatory abnormal gait pattern. None of them had undergone any medical procedure other than pedobarographic examination on the day of the study. The study was approved by the Ethical Committee of Regional Medical Chamber in Cracow (OIL/KBL/18/2019). All subjects signed written informed consent for the patient to participate in the study.

Table 1.
Demographic characteristics.
2.2. Inclusion Criteria
- -
- Correct foot structure in physical examination, in particular no defects in the forefoot, transverse or longitudinal flatfoot;
- -
- age 19–70 years (all age groups are included).
2.3. Exclusion Criteria
- -
- Undergoing foot surgery, especially forefoot correction surgery;
- -
- a history of injuries of limbs and the axial skeleton significantly disrupting the biomechanics of the musculoskeletal system;
- -
- moderate to severe degenerative changes in ankles, knee joints, hip joints and spine;
- -
- valgus or varus of the knees;
- -
- diabetes and other endocrinopathies;
- -
- rheumatic diseases;
- -
- other diseases disturb condition and locomotion;
- -
- pregnancy.
2.4. Pedobarographic Analysis
The tests were performed in the postural mode with the calibration of the device before each test, using the PEL38 pedobarograph with TWIN 99 software working on Windows. Prior to the examination, the foot sole was divided into regions. Patients were instructed to stand barefoot in an upright position keeping the symmetry of the body, and to look straight ahead during the examination. Before the actual testing, a trial test was performed to make the patient familiar with the equipment and procedure of the test, and in order to check the equipment calibration. The pedobarographic platform was centrally located in the room, at the same distance from the wall on the left and right sides of the subject in order to maintain a symmetrical view. Then, the measurement was repeated until the most common three reproducible results were obtained. Each individual study lasted 30 s, but the median time for pedobarographic examination per one participant was 25 min due to the need for a short rest of the subjects after each test.
2.5. Data Analysis
The study uses classification of the foot into 10 masked regions proposed by Cavanagh: (1) MH—medial heel, (2) LH—lateral heel, (3) MM—medial midfoot, (4) LM—lateral midfoot, (5) 1st MET—area under the 1st metatarsal head, (6) Second MET—area under the 1st metatarsal head, (7) Lateral MET—area under III-V metatarsal heads, (8) H—Hallux, (9) Second Toe, (10) Lateral Toes—area under III-V toes [12]. In the analyses, the 8, 9, and 10 areas were considered. The remaining regions were interconnected. Parameters quantifying plantar pressure for each masked region included maximal pressures (g/cm2), average pressures (g/cm2), total support area for each foot (%), contact area of the plantar foot with the ground at individual moments of standing. In order to standardize the results, with exclusion of the weight of the respondents, the percentage of maximum and average pressures in a given region was taken into account in the analyses. The maximum pressure in both feet of a given person was treated as 100%. Due to percentage record of the results (in relation to the maximum values), percentage results were used as standardized values (for 8–10 regions and the entire foot surface, respectively) in further analyses. Additionally, the pressure areas of both feet were contrasted. If the symmetry was full, the result would be 50% and 50% for the right and left feet, respectively.
2.6. Statistical Analysis
Statistical analyses were performed with Statistical software (Statistica 10.0). The data were normally distributed, as tested by the t-test for independent sample tests and Spearman’s correlations. The level of statistical significance was set at p < 0.05 for all analyses.
3. Results
Table 2 shows the comparison of the foot pressure distribution between the left and right foot in women. The mean values of plantar pressure under the Hallux were significantly higher on the right side than under the left Hallux (25.79 vs. 21.57)–as shown in Figure 1. In the other tested regions, as well as the entire foot surface, the obtained results do not indicate any significant difference in the loading of the left and right foot.
Table 2.
Comparison of plantar pressure distribution in the masked regions in the left and right foot in women (N = 41). The result shows the percentage of maximum pressures in the tested zone.
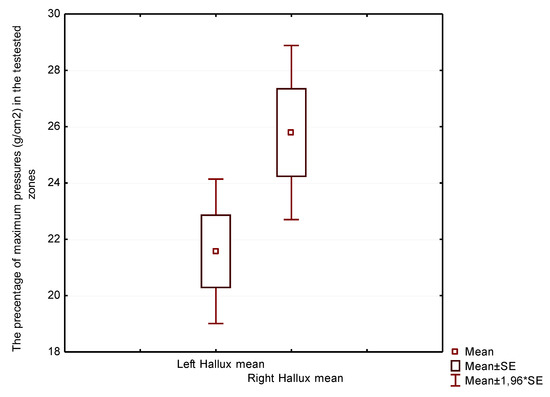
Figure 1.
Plantar pressure distribution under the left hallux (left side) versus the right hallux (right side) in women.
In Table 3, higher values of the foot pressure distribution were noted on the left side in men. The mean beneath the whole area of the left foot was considerably higher than beneath the right foot, as shown in Figure 2. The differences in Hallux, Second Toe and Lateral Toe regions were not statistically significant.
Table 3.
Comparison of plantar pressure distribution in the masked regions in the left and right foot in men (N = 41). The result shows the percentage of maximum pressures in the tested zone.
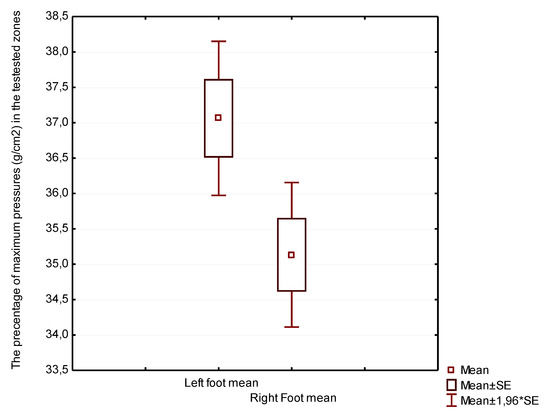
Figure 2.
Plantar pressure distribution under the left foot-the whole area (left side) versus right foot-the whole area (right side) in men
Comparing women’s feet to men’s feet in Table 4, differences in foot loads in the Hallux region can be found. The mean values in women were significantly higher under the right Hallux than in men, as shown in Figure 3.
Table 4.
Comparison of plantar pressure distribution in masked regions between women and men. The result shows the percentage of maximum pressures in the tested zone.
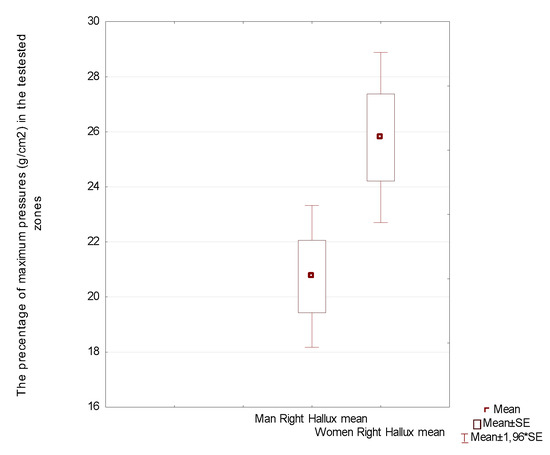
Figure 3.
Plantar pressure distribution under the right hallux in men (left side) versus right hallux in women (right side).
Table 5 shows the asymmetry of loadings on the left and right foot in men. The left foot was significantly more heavily loaded by the male respondents than the right foot. We did not find such a significant difference in women.
Table 5.
Comparison of left total support area and right total support area in % under the whole foot in women and men.
Table 6 shows potential correlation between body mass and plantar pressure distribution in both women and men. The plantar pressure distribution is not affected by an increase in weight in the entire study group. In the Left Hallux region in women and in the Left Second Toe in men, a weak negative correlation between body mass and the magnitude of the load was observed. The age of the tested persons had no impact on the plantar pressure distribution, as shown in Table 7.
Table 6.
Correlation between body mass and the masked foot regions in women and men.
Table 7.
Correlation between age and masked foot regions in women and men.
4. Discussion
Differences in the estimated parameters indicate feet asymmetry, which is a logical consequence of human body asymmetry. The literature says that the cause of functional dominance of the left brain hemisphere is dextrality [20,21]. The dominance of the right upper limb makes the left lower limb dominant. In right-handed people, the right side of their body is heavier than the left one because their right upper limb is longer and heavier. By way of compensation of the state, the left lower limb is dominant (it is longer than the right one). This asymmetry could be compensated by right foot dominance [22].
Forefoot pathology such as flexion contractures of the lesser toes are common foot disorders in the general population, with substantial functional consequences. Deformity of the forefoot can significantly affect the gait and impair quality of life [23]. The results of our studies indicate that among Hallux, Second Toe and Lateral Toe regions the greatest asymmetry is identified in the Hallux region in women (21.57 left foot vs. 25.79 right foot). Despite the fact that the left and right hallux are the most symmetrical toes in terms of morphology, higher pressure was observed under the right hallux. These results are surprising because all subjects were right-handed, so the higher pressures under hallux, which has a dominant part in the push-off phase, should be on the left side. However, the study was performed in postural mode, not dynamic in walking, and do not take into account the push-off phase of gaits during measurement of plantar pressure distribution. In men, a difference in the distribution of plantar pressure was observed in the area under left and right second toe (19.93 left versus 18.05 right). This difference is not statistically significant, but merely indicates a certain tendency, so it is assumed that the symmetry within the toes is maintained. When examining the load under the entire foot, a significant difference was obtained in the pressure distribution between the left and right foot (37.06 left versus 35.13 right). This means that since symmetry is maintained in the toe area, the asymmetry obtained in the distribution of pressures applies to the remaining areas of the foot. These results are interesting and require further research on a larger study group. Studies have confirmed that the occurrence of lesser toe deformities does not lead to asymmetry within III-V toes in both women and men. The smallest asymmetry of plantar pressure distribution in women was found between the Lateral Toes region (16.00 left vs. 14.66 right), while in men it was found under the Hallux (20.71 left vs. 20.75 right). The lower asymmetry over the foot surface results from the fact that it is more static than the toes themselves. This study shows that even while standing the toes behave differently than the other part of the foot; they display greater dynamic variability as a consequence of the variability of pressure. This research demonstrates the dynamic process of standing. As a conclusion of the repeated analyses, it is believed that the most important support points are the metatarsal heads, the fifth metatarsal head and the heel tumor. The conducted research complements numerous analyses of the morphology of the feet, particularly the toes.
Kurup et al. indicate that the forefoot shape can also reveal possible foot pathology According to the anatomic principles, there are three morphotypes of the forefoot: the Egyptian forefoot (first toe longer than lesser toes), the Square forefoot (first and second toes has the same length with progressively decreasing lengths of lesser toes) and the Greek type which has a second toe longer than the first with progressively decreasing lengths of lesser toes [16]. The study shows a close relationship between the Egyptian shape of the foot and the presence of Hallux valgus, Hallux rigidus and ingrown toenails. The Greek type of forefoot may be associated with higher risk of metatarsalgia, hammer toes and Morton’s neuroma [16]. Hammer, claw, and mallet toes are sagittal plane deformities of the lesser toes; in a diabetic population the frequency of their occurrence is approximately 30% [24], while crossover toes represent axial plane deformities [25]. Crossover toes most often affects the second toe in women aged 50 and over, and people with Hallux valgus. Medial deviation is more frequent than lateral deviation [26,27].
According to DiPreta, hammer toe is defined as a flexion deformity of the PIP joint accompanied by a slight MTP joint extension deformity. Claw toe refers to hyperextension deformity of the MTP joint and, secondarily, having flexion deformity of the PIP and distal interphalangeal (DIP) joints. A flexion deformity of the DIP joint is called mallet toe [28]. Detailed analysis of toe morphology has long been disregarded, and no attention has been devoted to contractures in III-V toes. This problem has not been recognized in anatomy textbooks to date [29].
As it is already known, forefoot pathology affects the plantar pressure distribution [30,31]. The conducted research confirms the fact that a changed shape of forefoot is not only a cosmetic defect, but also a reflection of a change in the foot biomechanics (pressure, stress). Toe deformity disturbs the function of the articular chain covering the lower limb joints ranging from the interphalangeal joints of the foot to the hip joint [19]. Barn et al., in studies on plantar pressure distribution in patients with diabetes, notes that the presence of prominent metatarsal heads, followed by claw toes, is responsible for 31% of variation in pressure of the forefoot region [31].
It was noted that disorders of the fourth and fifth toe are associated with cramping or high-heeled shoes [18,19]. Similar conclusions were drawn by Malhotra et al. [25]. Moreover, another factor affecting the development of lesser toe deformities is shortening of the first ray by Hallux valgus. Hallux valgus slackens the plantar fascia and weakens the windlass effect on the first toe, which leads to greater strain on the lesser toes [32]. These studies did not attract the attention of many authors and none of them developed them; hence, the results cannot be compared with any other sources. As regards plantar pressure distribution in the forefoot region, hammer toe deformity (metatarsal phalangeal joint angle) was the most significant variable affecting an increase in plantar pressure distribution. Not only diabetes mellitus, but also rheumatic disease and neuromuscular disorders as well as pathologies may increase plantar pressure in the forefoot region and cause deformities of the fourth and fifth toe [31,33].
The health consequences of this problem are not widely recognized. According to the MEDLINE®/PubMed® database as of 21 June 2021, the number of publications devoted to the most common deformities of the Hallux, i.e., Hallux valgus and Hallux rigidus amounts to 4886, while on the lesser toes deformities, in particular fourth and fifth toe, only 475 articles.
Conservative treatment of the lesser toe deformities includes selection of appropriate footwear that decreases forefoot loading, e.g., earth shoes, as well as selection of orthopedic supplies such as toe sleeve or padding that can be applied over high-pressure areas of the PIP or DIP joints or beneath the MT heads [23]. The relationship between the toes and the biometric function of the entire motor system is very complex. Numerous research supports the existence of myofascial connections running from the head to the feet [34,35]. Besides such complex, mostly insufficiently unexplained functional combinations, it comes as no surprise that there are several global factors such as age and body mass which may affect the plantar pressure distribution. Age-related changes in the musculoskeletal system could cause soft tissue stiffness and a decrease in range of motion in the forefoot [31]. However, the results of the conducted research did not confirm a correlation between age and plantar pressure distribution both under the foot and the toes. The same applies to body mass factor; the results of our research indicate the lack of its relationship with plantar pressure distribution, which is in agreement with previously reported research [31,36]. Youssef et al. obtained different results; he points to a significant increase in the plantar pressure of all measured regions in obese persons as compared with the normal-weight subjects [37]. A more detailed analysis requires a combination of the static, dynamic standing and gait assessments. In these studies, the number of variables as well as the number of data requiring evaluation is growing rapidly. Until recently, these analyses were impossible to perform.
However, errors in pedobarographic measurements are still a big problem. Following analyses of the literature, the most significant possible causes of errors include: too low sensitivity of the device, errors in the sensor signal due to the effects of external fields, bad sensor calibration, too long cable length, the influence of temperature on the sensors, incomplete load of a single matrix sensor, and non-ideal non-linear characteristics of the system in particular [38]. Eigenfeet methods, through complex and algorithmic image analysis, enable easy identification of some errors, simple, automatic finding of outliers, and response to them [39]. With the use of latest technologies that allow us to increase the computing power (in accordance with Moore’s law), the process of pedobarographic examination is automated. The study results become more reliable as well. It is influenced by the coupling of pedobarographic and photogrammetric tests. This reduces not only measurement errors, but also the probability of misinterpreting the results. The above process is one of the many elements of the revolution 4.0 in medical diagnostics [40].
There may be some possible limitations in this study. The first concerns the selection of the test group. Findings presented herein were observed in a cohort of only 82 individuals. All of those individuals were adults, with a large standard deviation from middle age. In order to better characterize our subjects, future studies are needed with age stratification of the study group. All subjects were in ethnically similar group and therefore did not cover the full range of mature forefoot shapes. Another potential limitation concerns the fact that the presence of various disorders in feet, such as soft tissue pathology and calluses, may have affected the quality of the measurement. Finally, we focus on the plantar pressure distribution in masked regions under toes, and other masked foot zones were not considered in detail. Despite these limitations, findings have identified changes with variable plantar pressure distributions under the right and left forefoot in both men and women.
5. Conclusions
- The asymmetry in the morphological structure of the foot does not determine the asymmetry in the plantar pressure distribution.
- The greatest asymmetry in the toe pressure is noted beneath the left and right hallux in women. A slight difference was observed in the pressure distribution under second toes in men, therefore we can consider that the symmetry within the toes is preserved.
- Global factors such as body weight do not affect the plantar pressure distribution in the toe areas.
Author Contributions
Conceptualization, J.L. and K.G.; methodology, J.L. and K.G.; software, J.L. and K.G.; validation, J.L. and K.G.; formal analysis, J.L. and K.G.; investigation, J.L. and K.G.; resources, J.L. and K.G.; data curation, J.L. and K.G.; writing—original draft preparation, J.L. and K.G.; writing—review and editing, J.L. and K.G.; visualization, J.L. and K.G.; supervision, J.L. All authors have read and agreed to the published version of the manuscript.
Funding
This research received no external funding.
Institutional Review Board Statement
The study was conducted according to the guidelines of the Declaration of Helsinki, and approved by the he Ethical Committee of Regional Medical Chamber in Cracow (protocol/OIL/KBL/18/2019 and date of approval: 19 February 2019).
Informed Consent Statement
Informed consent was obtained from all subjects involved in the study, as required by Ethical Committee.
Data Availability Statement
The data presented in this study are available on request from the corresponding authors. The data was saved in the memory of the computer on which the test was performed (TWIN 99 software working on Windows; pedobarograph PEL 38).
Conflicts of Interest
The authors declare no conflict of interest. The sponsors had no role in the design, execution, interpretation, or writing of the study.
References
- Lorkowski, J.; Radło, W.; Litwiejko-Pietryńczak, E. Estimation of foot symmetry of early school age children. Scri. Period. 2000, 3, 479–482. [Google Scholar]
- Wafai, L.; Zayegh, A.; Woulfe, J.; Aziz, S.M.; Begg, R. Identification of Foot Pathologies Based on Plantar Pressure Asymmetry. Sensors 2015, 15, 20392–20408. [Google Scholar] [CrossRef] [Green Version]
- Titianova, E.B.; Mateev, P.S.; Tarkka, I.M. Footprint analysis of gait using a pressure sensor system. J. Electromyogr. Kinesiol. 2004, 14, 275–281. [Google Scholar] [CrossRef]
- Mayolas Pi, C.; Arrese, A.L.; Aparicio, A.V.; Masià, J.R. Distribution of plantar pressures during gait in different zones of the foot in healthy children: The effects of laterality. Percept. Mot Skills 2015, 120, 159–176. [Google Scholar] [CrossRef] [PubMed]
- Wang, Y.; Watanabe, K. Limb dominance related to the variability and symmetry of the vertical ground reaction force and center of pressure. J. Appl. Biomech. 2012, 28, 473–478. [Google Scholar] [CrossRef]
- Galbusera, F.; Cina, A.; Panico, M.; Albano, D.; Messina, C. Image-based biomechanical models of the musculoskeletal system. Eur. Radiol. Exp. 2020, 4, 49. [Google Scholar] [CrossRef] [PubMed]
- Lorkowski, J.; Gawronska, K. Pedobarography in Physiotherapy: A Narrative Review on Current Knowledge. Adv. Exp. Med. Biol. 2021, 1–10. [Google Scholar] [CrossRef]
- Güven, M.; Kocadal, O.; Akman, B.; Poyanlı, O.S.; Kemah, B.; Atay, E.F. Proximal femoral nail shows better concordance of gait analysis between operated and uninjured limbs compared to hemiarthroplasty in intertrochanteric femoral fractures. Injury 2016, 47, 1325–1331. [Google Scholar] [CrossRef]
- Hagen, L.; Pape, J.P.; Kostakev, M.; Peterlein, C.D. Pedobarographic changes during first month after subtalar extra-articular screw arthroereisis (SESA) operation of juvenile flexible flatfoot. Arch. Orthop. Trauma Surg. 2020, 140, 313–320. [Google Scholar] [CrossRef] [PubMed]
- Skopljak, A.; Muftic, M.; Sukalo, A.; Masic, I.; Zunic, L. Pedobarography in diagnosis and clinical application. Acta Inform. Med. 2014, 22, 374–378. [Google Scholar] [CrossRef] [PubMed] [Green Version]
- Blomgren, M.; Turan, I.; Agadir, M. Gait analysis in Hallux valgus. J. Foot Surg. 1991, 30, 70–71. [Google Scholar]
- Cavanagh, P.R.; Rodgers, M.M.; Iiboshi, A. Pressure distribution under symptom-free feet during barefoot standing. Foot Ankle. 1987, 7, 262–276. [Google Scholar] [CrossRef] [PubMed]
- Kernozek, T.; Roehrs, T.; McGarvey, S. Analysis of plantar loading parameters pre and post surgical intervention for Hallux valgus. Clin. Biomech. 1997, 12, 18–19. [Google Scholar] [CrossRef]
- Stess, R.M.; Jensen, S.R.; Mirmiran, R. The role of dynamic plantar pressures in diabetic foot ulcers. Diabetes Care 1997, 20, 855–858. [Google Scholar] [CrossRef]
- Bowen, T.R.; Miller, F.; Castagno, P.; Richards, J.; Lipton, G. A method of dynamic foot-pressure measurement for the evaluation of pediatric orthopaedic foot deformities. J. Pediatr. Orthop. 1998, 18, 789–793. [Google Scholar] [CrossRef]
- Kurup, H.V.; Clark, C.I.; Dega, R.K. Footwear and orthopaedics. Foot Ankle Surg. 2012, 18, 79–83. [Google Scholar] [CrossRef] [PubMed]
- Aprile, I.; Galli, M.; Pitocco, D.; Di Sipio, E.; Simbolotti, C.; Germanotta, M.; Bordieri, C.; Padua, L.; Ferrarin, M. Does First Ray Amputation in Diabetic Patients Influence Gait and Quality of Life? J. Foot Ankle Surg. 2018, 57, 44–51. [Google Scholar] [CrossRef] [PubMed] [Green Version]
- Lorkowski, J.; Skawina, A.; Radło, W. The position, types and the function of the fifth toe in adult. Scr. Period 2000, 3, 488–492. [Google Scholar]
- Lorkowski, J.; Skawina, A. Human fourth toe—Morphological conditions of its function. In Biokulturowe Uwarunkowania Rozwoju, Sprawności i Zdrowia; Rozdziewicz-Gruhn, J., Ed.; WSP: Częstochowa, Poland, 2003; pp. 469–474. [Google Scholar]
- Tan, U.; Akgün, A. Contributions of the right and left brains to manual asymmetry in hand skill in right-handed normal subjects. Int. J. Neurosci. 1992, 65, 11–17. [Google Scholar] [CrossRef]
- Tan, U. The relation of hand preference to hand performance in left-handers: Importance of the left brain. Int. J. Neurosci. 1992, 65, 1–10. [Google Scholar] [CrossRef]
- Means, L.W.; Walters, R.E. Sex, handedness and asymmetry of hand and foot length. Neuropsychologia 1982, 20, 715–719. [Google Scholar] [CrossRef]
- Park, C.H.; Chang, M.C. Forefoot disorders and conservative treatment. Yeungnam Univ. J. Med. 2019, 36, 92–98. [Google Scholar] [CrossRef] [PubMed]
- Smith, D.G.; Barnes, B.C.; Sands, A.K.; Boyko, E.J.; Ahroni, J.H. Prevalence of radiographic foot abnormalities in patients with diabetes. Foot Ankle Int. 1997, 18, 342–346. [Google Scholar] [CrossRef] [PubMed]
- Malhotra, K.; Davda, K.; Singh, D. The pathology and management of lesser toe deformities. EFORT Open Rev. 2017, 1, 409–419. [Google Scholar] [CrossRef] [PubMed]
- Kaz, A.J.; Coughlin, M.J. Crossover second toe: Demographics, etiology, and radiographic assessment. Foot Ankle Int. 2007, 28, 1223–1237. [Google Scholar] [CrossRef]
- Coughlin, M.J. Subluxation and dislocation of the second metatarsophalangeal joint. Orthop. Clin. N. Am. 1989, 20, 535–551. [Google Scholar]
- DiPreta, J.A. Metatarsalgia, lesser toe deformities, and associated disorders of the forefoot. Med. Clin. N. Am. 2014, 98, 233–251. [Google Scholar] [CrossRef]
- Drake, R.L.; Vogl, W.; Mitchell, A.W.M.; Gray, H. Gray’s Anatomy for Students, 4th ed.; Elsevier: Amsterdam, The Netherlands, 2019; pp. 600–622. [Google Scholar]
- Bowen, C.J.; Culliford, D.; Allen, R.; Beacroft, J.; Gay, A.; Hooper, L.; Burridge, J.; Edwards, C.J.; Arden, N.K. Forefoot pathology in rheumatoid arthritis identified with ultrasound may not localise to areas of highest pressure: Cohort observations at baseline and twelve months. J. Foot Ankle Res. 2011, 4, 25. [Google Scholar] [CrossRef] [Green Version]
- Barn, R.; Waaijman, R.; Nollet, F.; Woodburn, J.; Bus, S.A. Predictors of barefoot plantar pressure during walking in patients with diabetes, peripheral neuropathy and a history of ulceration. PLoS ONE 2015, 10, e0117443. [Google Scholar] [CrossRef]
- Hecht, P.J.; Lin, T.J. Hallux valgus. Med. Clin. N. Am. 2014, 98, 227–232. [Google Scholar] [CrossRef]
- Mueller, M.J.; Hastings, M.; Commean, P.K.; Smith, K.E.; Pilgram, T.K.; Robertson, D.; Johnson, J. Forefoot structural predictors of plantar pressures during walking in people with diabetes and peripheral neuropathy. J. Biomech. 2003, 36, 1009–1017. [Google Scholar] [CrossRef]
- Ajimsha, M.S.; Shenoy, P.D.; Gampawar, N. Role of fascial connectivity in musculoskeletal dysfunctions: A narrative review. J. Bodyw. Mov. Ther. 2020, 24, 423–431. [Google Scholar] [CrossRef]
- Williams, W.; Selkow, N.M. Self-Myofascial Release of the Superficial Back Line Improves Sit-and-Reach Distance. J. Sport Rehabil. 2019, 29, 400–404. [Google Scholar] [CrossRef]
- Guldemond, N.A.; Leffers, P.; Walenkamp, G.H.; Schaper, N.C.; Sanders, A.P.; Nieman, F.H.; van Rhijn, L.W. Prediction of peak pressure from clinical and radiological measurements in patients with diabetes. BMC Endocr. Disord. 2008, 8, 16. [Google Scholar] [CrossRef] [PubMed] [Green Version]
- Youssef, E.F.; Shanb, A.A.; Ameer, M.A.; Shanab, M.E. Impact of body weight on shifting of foot pressure among adult subjects. Acta Bioeng. Biomech. 2020, 22, 131–137. [Google Scholar] [CrossRef] [PubMed]
- Meyer, J. Textile Pressure Sensor: Design, Error Modeling and Evaluation. Ph.D. Thesis, ETH Zurich, Zürich, Switzerland, 2008. [Google Scholar]
- Lorkowski, J.; Bober, M.; Kotela, I. Advanced image analysis supporting pedobarographic diagnostics—Indroducing the Eigenfeet method. Med Probl. 2013, 49, 36–43. [Google Scholar]
- Ciszkiewicz, A.; Lorkowski, J.; Milewski, G. A novel planning solution for semi-autonomous aspiration of Baker’s cysts. Int. J. Med. Robot. 2018, 14, e1882. Available online: https://pubmed.ncbi.nlm.nih.gov/29316179/ (accessed on 12 January 2021). [CrossRef]
Publisher’s Note: MDPI stays neutral with regard to jurisdictional claims in published maps and institutional affiliations. |
© 2021 by the authors. Licensee MDPI, Basel, Switzerland. This article is an open access article distributed under the terms and conditions of the Creative Commons Attribution (CC BY) license (https://creativecommons.org/licenses/by/4.0/).