Abstract
Phenotypic variation arises from genetic and environmental variation, as well as random aspects of development. The genetic (nature) and environmental (nurture) components of this variation have been appreciated since at least 1900. The random developmental component (noise) has taken longer for quantitative geneticists to appreciate. Here, I sketch the historical development of the concepts of random developmental noise and developmental instability, and its quantification via fluctuating asymmetry. The unsung pioneers in this story are Hugo DeVries (fluctuating variation, 1909), C. H. Danforth (random variation between monozygotic twins, 1919), and Sewall Wright (random developmental variation in piebald guinea pigs, 1920). The first pioneering study of fluctuating asymmetry, by Sumner and Huestis in 1921, is seldom mentioned, possibly because it failed to connect the observed random asymmetry with random developmental variation. This early work was then synthesized by Boris Astaurov in 1930 and Wilhelm Ludwig in 1932, and then popularized by Drosophila geneticists beginning with Kenneth Mather in 1953. Population phenogeneticists are still trying to understand the origins and behavior of random developmental variation. Some of the developmental noise represents true stochastic behavior of molecules and cells, while some represents deterministic chaos, nonlinear feedback, and symmetry breaking.
1. Introduction
Charles Darwin [1] (p. 127) recognized that individuals of the same species vary among one another, producing an “infinite diversity in structure, constitution, and habits.” He also recognized that heritable variation is the raw material upon which natural selection acts. Without variation, in his view, there can be no adaptation. Darwin, in fact, devoted three chapters of Origin of Species to the problem of variation—variation under domestication, variation under nature, and the laws of variation. Later, he devoted an entire book to the variation of domesticated plants and animals [2].
Despite an opening section of Origin of Species entitled “The Causes of Variation,” Darwin was, nevertheless, acutely aware that those causes were entirely unknown. He openly admitted that our “ignorance of the laws of variation is profound. Not in one case out of a hundred can we pretend to assign any reason why this or that part differs, more or less, from the same part in the parents” [1] (p. 167). Of course, genetics was still 40 years in the future, and the synthesis of genetics and Darwinism was 60 years in the future. Even today, after 161 years of Darwinism, 121 years of genetics, 101 years of neo-Darwinism, and 70 years of molecular biology, we still only partly understand the causes of variation. We can describe it well enough, but whence does it arise?
Quantitative geneticists would say that variation arises from two sources—genetic and non-genetic [3]. The genetic source, or component, is attributable to the genetic variation among individuals within a population. The non-genetic component, commonly called the environmental component, is attributable to macro- and micro-environmental variation, maternal effects, ontogenetic variation, and random aspects of development. In fact, the environmental component is something of a misnomer, since random (i.e., unpredictable) developmental variation often accounts for most of the so-called environmental component and a significant fraction of the total phenotypic variance [3,4,5]. Lajus et al. [5] concluded that 10 to 40% of the variation in continuously variable (morphometric) characters and 50 to 70% of the variation in discrete (meristic) characters is attributable to developmental noise. Gärtner [6] has justifiably called random developmental variation the third component of phenotypic variation.
Of course, such a partitioning of phenotypic variation into two, or even three, components does not address the actual causes of variation, which are daunting and complex, and deterministic and stochastic. The deterministic part involves the unfolding of the phenotype during development—epigenesis. The stochastic part involves the random behavior of molecules and cells that compose tissues and organs of the developing organism. Despite the forbidding complexity of development, we can initially treat the problem as if it were a black box.
Black box theory arose in electrical engineering as a way of revealing the behavior of “any system whose internal mechanisms are not fully open to inspection” [7] (p. 86). Presented with a black box having only inputs and outputs, the electrical engineer varies the input, perhaps by turning a dial, and observes the output, perhaps by measuring current with an ammeter. Nevertheless, black box theory has wide application in all science. In fact, much scientific investigation resembles a black box when the inner workings of a process are hidden from view. Mendel, for example, unaware of chromosomes, genes, and meiosis, deduced the laws of inheritance by varying the phenotypes of parental pea plants and observing the phenotypes of their offspring.
One can present the problem of phenotypic variation as a black box model (Figure 1). Imagine two inputs, genotype and environment, and a single output, the phenotype. Sometimes, the genotype alone influences the phenotype. In mammals, for example, the presence or absence of a Y-chromosome determines whether an individual develops into a male or a female. Sometimes, the reverse is true—the environment alone influences the phenotype. In turtles and crocodilians, incubation temperature alone determines sex. For most traits, however, both genotype and environment jointly influence the phenotype. Nevertheless, this simple two-input model is grossly inadequate, because oftentimes there can be more than one phenotype for a particular combination of genotype and environment. Identical (monozygotic) twins, for example, may have different fingerprint ridge counts, and left and right eyes of the common fruit fly may have different numbers of facets. This additional variation can be attributed to the unpredictability of development. Developmental processes are inherently noisy. Moreover, some deterministic processes may be indistinguishable from random ones.
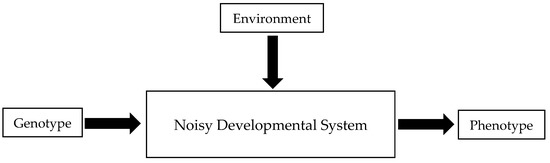
Figure 1.
Simple model of the relationship between genotype, environment, developmental noise, and phenotype.
Developmental noise can be quantified by holding the genotype and environment constant and measuring the phenotypic variation. This can be achieved most easily by examining the variation among genetically identical individuals (clones) raised in a common environment, or by examining the minor asymmetries of symmetrical structures—fluctuating asymmetries.
2. Population Phenogenetics and Developmental Noise
Population phenogenetics involves the marriage of developmental biology and population biology. According to Vladimir Zakharov [8], its main proponent, the ultimate goal of population phenogenetics is to understand the causes of variation, both within and among populations. Population biologists merely describe this variation. Developmental biologists attempt to discover, experimentally, how it is generated [9,10,11]. They work with a few model species, and use inbred lines to uncover genetic, environmental, and random developmental influences on the phenotype. Population phenogeneticists, in contrast, study these influences in natural populations. Nevertheless, they are confronted with a serious problem: one cannot manipulate the genotype and environment in a natural situation. Thus, they are compelled to focus on random developmental variation (developmental noise).
By studying fluctuating asymmetry and phenotypic variation of bilaterally symmetrical traits, population phenogeneticists can estimate the upper limit on genotypic variation. To do so, they first estimate total phenotypic variation for a trait. Then, they estimate the fluctuating asymmetry variation, which represents within-individual (stochastic) variation. Finally, the difference between asymmetry variation and total variation is the among-individual (factorial) variation, which is due to the combined effects of genotypic and environmental variation [5,12,13]. This, therefore, is the upper limit on genotypic variation.
Interest in developmental noise distinguishes population phenogeneticists from population biologists and developmental biologists. Hence, any process that influences the amount of developmental noise is also of interest, as are homeostasis, stability, and canalization of development. Population phenogeneticists, then, study phenotypic diversity, and partition it into factorial (genetic and environmental) and stochastic (random) components. They use these components to characterize populations. For example, the factorial component can give a rough idea of genetic and environmental variability, and thus, an upper limit on the heritability of traits. The stochastic component responds to genetic and environmental stress and may additionally reflect how well a population is adapted, on average, to its environment, and how well genes are coadapted to one another.
The advantages of a population phenogenetic approach are numerous and can lead to insights that are either difficult or impossible to obtain by conventional means. For example, being able to easily obtain even a crude estimate of heritability in a natural population is immensely valuable. To estimate the heritability of a trait requires knowledge of either parents and offspring, or selection differentials and responses. These are virtually impossible to obtain for most species. Even if heritability can be independently estimated, for instance, by parent–offspring regression, then the additive genetic variance (heritability times the total phenotypic variance) can be subtracted from the factorial component to obtain an estimate of the remaining environmental, ontogenetic, and maternal components.
2.1. Developmental Homeostasis
Developmental homeostasis is a concept analogous to physiological homeostasis. According to Cannon [14], as cited by Waddington [15], homeostasis is “the capacity of an organism to maintain its physiological functioning at some definite level.” Examples of physiological homeostasis are the maintenance of relatively constant blood pH and glucose concentrations. Waddington [15], who introduced the concept of developmental homeostasis, described it as the stabilized flow of a developmental trajectory. According to Waddington [15], and later Zakharov [16], developmental homeostasis incorporates two related but distinct sets of concepts: canalization and stability. Canalization is the ability of an individual to develop the same phenotype under diverse genotypes and environments. Its converse is phenotypic plasticity [16]. Pigliucci [17], however, does not consider canalization and plasticity to be at all related. Canalization and plasticity can be deduced by examining reaction norms. Developmental stability, in contrast, is the ability of an individual to develop the same phenotype under identical genotypes and environments. Its converse is developmental instability. Stability and instability of development can be deduced by examining developmental noise.
2.2. Symmetry and Asymmetry
The study of developmental noise often involves the study of minor asymmetries in normally symmetrical traits. These are fluctuating asymmetries because the direction and intensity of the asymmetry is random. Fluctuating asymmetries are important because they allow one to estimate developmental noise (and hence developmental stability and instability). This has proven to be an extremely powerful approach for two reasons. First, genotype and environment are automatically held constant, without any special manipulation by the investigator. Second, virtually all organisms, even sponges, possess some form of symmetry, so it can be applied virtually anywhere.
Bilateral, rotational, and translatory symmetry are the most common forms of symmetry in living organisms. Fish, humans, flatworms, insects, and orchid flowers all display bilateral symmetry, at least externally. Bilateral symmetry involves symmetry across an axis of reflection; there is a left and a right side. Anemones, starfish (adults), and sunflower inflorescences all display rotational symmetry, which involves symmetry of rotation around an axis. Filamentous algae and annelid worms display translatory symmetry, which involves linear translation. Even sponges, which are commonly thought of as having no symmetry, possess fractal symmetry, or symmetry of scale.
Population phenogenetics is a rapidly growing and diverse field. Interest in fluctuating asymmetry, as a measure of developmental instability, has increased exponentially over the past 60 years [18]. It is currently being used as a tool in several disciplines. Evolutionary biologists, for example, use it to reveal the state of adaptation of populations undergoing evolutionary change. For example, populations experiencing strong directional selection tend to have higher average asymmetry. Moreover, some evolutionary psychologists believe that humans use symmetry to assess the quality of potential mates. Anthropologists have used asymmetry to deduce stress in current and prehistoric populations [19]. Finally, environmental biologists and ecotoxicologists use it to assess environmental stress.
Gerontologists have discovered that chance developmental events determine, in part, the course of aging [4]. For example, aging in the roundworm, Caenorhabditis elegans, is associated with increased variability for a number of traits [20]. Laboratory strains of C. elegans are isogenic and are raised in a uniform environment, and yet there is abundant variability, which increases as the worm ages. Gerontologists believe the same is true of human aging.
3. Developmental Noise, Fluctuating Asymmetry, and Developmental Stability
Here, I trace the development of the concepts of developmental noise, fluctuating asymmetry, and developmental stability, from Darwin to the present. The path is rocky and tortuous. It leads from the recognition of chance events in the 19th century to the development of these concepts in the 20th century. Gradually, it became apparent that developmental noise is responsible for at least as much phenotypic variation as either genotype or environment.
Unfamiliarity with the history of our discipline has resulted in researchers claiming discoveries that were known as much as 80 years earlier. It has resulted in the credit of initial discovery being given to those who did not make it. I hope that this brief, and admittedly incomplete, history will right some of these misconceptions.
I do not discuss the concepts of reaction norms and plasticity here. As reaction norms must be estimated on a genotype by genotype and environment by environment basis, they are mainly applicable to experimental settings. Thus, they are technically not a part of population phenogenetics. An excellent history of the development of these concepts can be found in Pigliucci’s [17] Phenotypic Plasticity.
3.1. Nature, Nurture, and Noise
Interest in phenotypic variation began with Darwin [1], who understood that variation needed to be heritable for natural selection to be effective. In fact, today’s recognition of environmental and genetic components of variation can be traced back to Darwin’s concepts of definite and indefinite variation [5]. He also accepted the role of chance events but had little inkling that some of them might be due to developmental noise.
Darwin’s cousin, Francis Galton [21,22], realized that one could assess the relative contributions of nature (genotype) and nurture (environment) by comparing identical, or monozygotic, twins raised in different environments with those raised in the same environment. Such twins share a common genotype and maternal environment. After birth, however, the environments of separated twins may differ. Galton [21] (p. 171) concluded that there “is no escape from the conclusion that nature prevails enormously over nurture when the differences of nurture do not exceed what is commonly to be found among persons of the same rank of society and in the same country.” Nevertheless, twins raised in the same environment often exhibited notable differences, even though they were still, obviously, descended from the same zygote. He attributed these differences to the “combined action of many small influences,” that is to chance [21] (p. 167). Today, we know that much of this inexplicable random variation is due to developmental noise. Galton, however, attributed the differences to random environmental influences, which he likened to obstacles and eddies in a stream.
3.2. Homotypic Correlation and Within-Individual Variation
Karl Pearson was the first scientist to study within-individual phenotypic variation [23]. Just as twins raised in a common environment can be used to assess developmental noise, so can within-individual variation. However, Pearson had a different motivation for studying such variation. He was convinced that the same forces contributing to the resemblance of repeated parts of an individual, such as multiple leaves on a tree, were also responsible for the similarity among siblings. To this end, he studied pairs of repeated (homotypic) structures belonging to the same individual—which he called undifferentiated organs. According to Pearson [24] (p. 322), homotyposis was “the resemblance of certain like parts, it is therefore a correlation.” For example, a whorl of leaves consists of several similar elements, and yet they are not exactly alike in length, width, vein lengths, and marginal tooth counts. Through homotyposis, Pearson hoped to uncover the secrets of inheritance and its role in the evolutionary process.
William Bateson [25] and other Mendelians vehemently attacked Pearson’s homotyposis theory. Their criticisms were largely justified. Pearson had developed a mathematical model that predicted that the resemblance among siblings would be identical to that of undifferentiated parts. The model was based, in part, on the assumption of blending inheritance, which naturally led to unrealistic predictions. Another problem with the paper was that Pearson used correlations (homotypic correlations) to quantify the similarities among repeated structures [26]. The method was clumsy, because it required the computation of all possible correlations among homotypes on a single individual. For example, one of his tables, for a single tree, contained 650 correlations. For 100 trees of one species, there were 65,000 correlations, which had to be computed by hand. Pearson was also adamant that correlations were more important than variances, in part because his model demanded it. However, variances are more easily computed, can be easily partitioned, and can be just as easily used to test predictions regarding theories of inheritance.
As mentioned previously, Pearson’s concept of inheritance was faulty. At the time, he rejected Mendelian inheritance, the idea that discrete particles, which we now call genes, are passed from parents to offspring. This is unsurprising, because Mendel’s paper of 1866 was only rediscovered in 1900, when Pearson had already finished most of the work on his homotyposis paper. His acceptance of blending inheritance, however, led to an unrealistic model. Nevertheless, when he found that homotypic correlations in plants and fungi were about the same as correlations among sibs in animals, he wrongly concluded that heredity was “only a phase of the wider factor of homotyposis” [23] (p. 359). Although he was wrong on this important point, Pearson et al. [23] (p. 287) correctly attributed much of the within-individual variation to a “great number of small factors, varying from organ to organ, and incapable of being defined or specified.” For this reason, he is apparently the first person to show how one might estimate developmental noise.
One interesting aspect of the debate between Bateson and Pearson was their disagreement over bilaterally symmetric structures. Bateson [25] (p. 199), in his critique, declared that the “two claws of a crab are a pair of homotypes. Their homotypic correlation in respect of any character, length, for example, might be determined.” He wondered why Pearson had not discussed symmetric structures, and he also went on to mention rotational and translatory symmetry as potential sources of repeated structures. Pearson [24], however, declared that correlations between right and left sides of symmetrical structures are organic, not homotypic, correlations. Organic correlations involve selection for the regulation of symmetry. Thus, they are generally much higher than homotypic correlations. Homotypic traits, such as different leaves on the same tree, have not undergone such selection. Today, scientists would be inclined to agree with Bateson. They routinely use both symmetrical and repeated structures to estimate within-individual variation.
Pearson’s paper on homotypic correlation spurred several studies of within-individual variation in a variety of organisms, including plants [27,28,29], protozoa [30], and animals [31,32,33]. None of these papers, however, addressed the likely source of within-individual variation—developmental noise. Interest in homotyposis and within-individual variation faded as they became associated with a discredited theory of inheritance.
3.3. Fluctuating Variation
When Pearson was publishing his homotyposis theory of inheritance, Hugo De Vries, a Dutch botanist and one of the discoverers of Mendel, was finishing a two-volume work entitled Die Mutationstheorie [34], later published in English as the Mutation Theory (1909). The main thesis of this work was that mutations were the main source of evolutionary change, and that such change occurred in jumps (saltations) (see Gould [26] for a fascinating review of De Vries’s mutation theory).
De Vries [34] distinguished two kinds of variation: fluctuating and mutational. The mutational variations were those susceptible to natural selection, while fluctuating variations were generally not. Mutational variation introduced something new (genetic change of large effect), while fluctuating variation was generally too small to exert an influence. According to De Vries, fluctuating variation consisted of genetic variation of small effect and environmental variation. He emphasized the role of chance in its causation. Fluctuating variation could be identified by a normal distribution about a population mean.
By 1911, the concept of fluctuating variation was already being subjected to considerable criticism. The division of variation into two categories represented a kind of false dichotomy [26]. It was also obvious that some of the fluctuating variation was heritable, and that some was not.
At this point, chance events were still being attributed to random environmental events, and yet that would soon change. Some scientists would realize that environmental variation could simply not explain all the non-genetic variation, and the concept of fluctuating variation would soon be transmuted into the concept of fluctuating asymmetry.
3.4. Bilateral Asymmetry
The study of bilateral (right–left) asymmetry was popular in the late 19th and early 20th centuries. At first, most studies focused on adaptive asymmetries, such as left–right handedness and the asymmetry of the internal organs in humans. Furthermore, most studies focused on genetic, rather than other, sources of asymmetry.
A study by J. K. Breitenbecher [35], of Woods Hole Marine Biological Laboratory, is typical. He investigated the inheritance of a mutation conferring an antisymmetric distribution of spots on the elytra (wing case) of female weevils, Bruchus. The trait (piebald) was sex-limited and recessive. Half of the homozygous recessive females had red spots on their left elytra and black spots on their right elytra. The other half had the reversed pattern. The trait was antisymmetric because none of the females were symmetric. Although this trait was heritable, Breitenbecher noted that there was an element of chance involved, since each female weevil had a 50:50 chance of being either left- or right-handed for the trait.
As with Bruchus, some forms of asymmetry were inherited, but many were clearly not [36]. However, after some 40 years and dozens of studies, there was still no consensus. What was the nature of those asymmetries that were not inherited? At this point, those asymmetries still resembled fluctuating variation of environmental origin.
3.5. The Synthesis of Twin Studies and Asymmetry
In 1919, C. H. Danforth [37], an anatomist at Washington University School of Medicine, came to the astonishing conclusion that the minor differences between monozygotic twins were analogous to the minor differences between symmetrical parts of the body, and perhaps had the same explanation.
“Anatomists are familiar with the rather frequent departures from symmetry in bilateral muscles, nerves and vessels. Occasionally individuals occur with one blue eye and one brown eye, and indeed it is probable that all symmetrical parts of the body are subject to occasional unilateral variations. The origin of these variations, however, is probably not environmental in the usual sense, since here the environment factor is reduced to its minimum.
Whatever may be the cause of variation between the two sides of the body when they develop together as a single individual, it is reasonable to expect that they will be equally effective when each half of the blastoderm develops as a separate individual. It might therefore be predicted that uniovular twins would differ from each other in the same respects and to the same degree as the two sides of the body differ in ordinary individuals” [37] (pp. 407–408).
If the source of variation was not environmental, what was it? Danforth clearly did not know.
3.6. The Irregularity of Development
In 1920, Sewall Wright [38], then working for the U.S. Department of Agriculture, reported the results of 20 generations of inbreeding within several families of guinea pigs. In particular, he was interested in the relative importance of heredity and environment in determining the color patterns of the fur. Piebald was a pattern that consisted of colored spots on a white background. For each guinea pig, both inbred and outbred, he estimated the percentage of white in the coat.
Wright was surprised that even after “twenty generations of inbreeding, a guinea-pig with 20% of white may have a litter mate with as much as 90% of white” [38] (p. 321). Using path coefficients to determine the degree of determination of each cause (genetic, environmental, developmental), he found that in the control (outbred) guinea pigs, heredity accounted for 42 percent of the phenotypic variation in coat color, while the environment accounted for less than 1 percent. The remaining 58 percent he attributed to the irregularity of development. In the inbred lines, the percent contribution of developmental irregularity was a whopping 92 percent.
Despite the basic importance of this paper, its message only influenced a small number of fellow researchers. Thus, 90 years later, Gärtner [6] reached precisely the same, and surprising to him, conclusion when he tried to produce uniform lines of laboratory rats and mice by repeatedly inbreeding them. However, try as he might, the levels of variation could not be significantly reduced. Nevertheless, Wright critically influenced Astaurov [39] and Van Valen [40], pioneers in the study of fluctuating asymmetry.
3.7. Fluctuating Asymmetry
F. B. Sumner and R. R. Huestis [36], of the Scripps Institute, studied the inheritance of bilateral asymmetry in natural populations of deer mice, Peromyscus maniculatus. They examined more than 2000 skeletons from wild mice, cage-bred mice, and F1 and F2 hybrids between mice from different localities. Replicate measures of mandible weight, femur length, femur weight, and the length of the innominate bone of the pelvis were made. Caged mice were more symmetrical on average than wild mice from the same population, and F2 hybrids were more asymmetrical than F1 hybrids. Moreover, asymmetry of offspring was not consistently correlated with parental asymmetry.
In what is probably the first study of fluctuating asymmetry, Sumner and Huestis [36] succeeded in demonstrating environmental and genetic influences on developmental stability, without realizing they were doing so. They were also the first to study the heritability of fluctuating asymmetry. They did not, however, use the term fluctuating asymmetry, and they did not offer any suggestions as to where this non-heritable variation had come from, or why wild mice were more variable than caged mice or why F2 hybrids were more variable than F1 hybrids. This otherwise beautiful study was fatally flawed by the author’s own inability to explain their results. There was simply no theoretical context for them in 1921.
Boris Astaurov, a Soviet geneticist who made important contributions to the genetics of silkworms [41,42], was the first to recognize that subtle asymmetries were due to random developmental processes. As a student, he studied genetics in Moscow, where he was influenced by his teachers, N. K. Koltsov and S. S. Chetverikov. In 1926, Chetverikov’s group began focusing its attention on wild populations of Drosophila melanogaster. According to Berg [42], their goal was to “reveal the total amount and the features of hereditary variation itself.” The research by Chetverikov’s group amounted to the first empirical population genetics. In 1927, Timofeeff-Ressovsky [43], as a member of Chetverikov’s group, observed that the trait radius incompletus in the wings of Drosophila funebris could be present on only one of the pair of wings. He attributed this asymmetrical manifestation of the trait to “variations of the individual development” [43] (p. 164). Astaurov, also a member of the group, first studied the asymmetry of the halteres, which are balancing organs. He then began examining the variation of symmetric traits in two marine polychaetes and a myriopod [39]. His paper of 1930 [39], “Analyse der erblichen Störungsfälle der bilateralen Symmetrie im Zusammenhang mit der selbständigen Variabilität ähnlicher Strukturen” roughly translates to “Analysis of heritable deviations from bilateral symmetry in connection with independent variation of similar structures.” This paper is doubly innovative in that Astaurov studied random deviations from both bilateral and translatory symmetry.
Figure 2 shows Astaurov’s [39] analysis of variation in bristle count in Geophilus ferrugineus (Geophilidae: Myriapoda). For the first 15 segments, beginning at the anterior end, the number of bristles on each side averages about 19. Between segments 15 and 30, the number of bristles declines to about 16, and stays there until segment 46. In segment 47, the number of bristles drops off to 13 on each side. In general, the number of bristles declines from anterior to posterior ends of Geophilus. This variation is strictly deterministic, but the number of bristles varies in a random fashion, both within segments and between neighboring segments. This corresponds to fluctuating bilateral and fluctuating translatory asymmetry. Astaurov used deviations from a moving average as a measure of random variation.
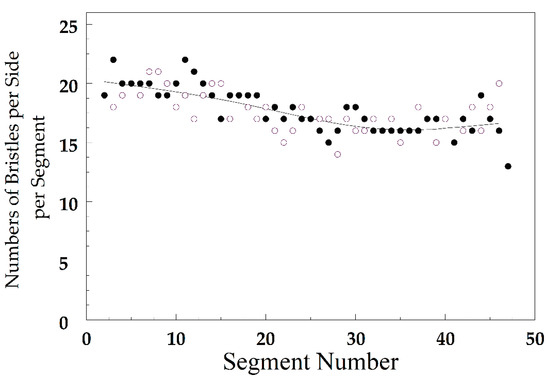
Figure 2.
Number of bristles on right (filled circles) and left (open circles) sides of an individual myriopod, Geophilus ferrugineus. The smoothed line shows the trend from anterior to posterior segments. Redrawn from Astaurov [39].
Influenced in part by Wright [38], Astaurov attributed the variation he saw to stochastic aspects of morphogenetic processes. The stochastic variation could be explained by neither genotypic nor environmental differences among individuals. According to Astaurov [39] (p. 258),
“This spontaneous stochastic variation results from internal conditions of the development of the characters and from small stochastic effects of both fluctuations of the environment and from the organic structure itself. Taking place in multiple repeated similar organs of the same individual, this spontaneous variation may result in their differences and, in the particular case of symmetric organs, leads to asymmetry of the organism. In that case, when independent stochastic variation leads to a number of quantitatively differing cases, grouped near some mean case, it practically does not differ from the well-known fluctuation of characters, in which fluctuating asymmetry is included as one of the elements” (translation courtesy of Dmitri Lajus).
Here, Astaurov points out that minor asymmetries are an example of the well-known concept of fluctuating variation.
When Cherverikov was arrested in 1929, Astaurov moved away from Moscow to avoid the unfavorable political climate there [42] and changed the focus of his research. Although he had used the terms “Fluktuation” and “Asymmetrien” in the same paragraph, and by inference understood that asymmetries could fluctuate, it was Ludwig [44] who actually put the two words together, thus coining the term fluctuating asymmetry. In 1934, Astaurov’s friend, Timofeeff-Ressovsky [45], coined the term antisymmetry, to describe situations in which the average individual is asymmetrical but whether the right or left side is dominant is random.
3.8. Theory of Developmental Homeostasis
Although numerous scientists had studied random variation in twins and in symmetrical parts of the same individual, a theoretical basis for this work was needed to give it a proper context. Sumner and Huestis [36], in particular, found it difficult to explain their own results. Why was asymmetry greater in some groups of mice than in others? They had no answer. Astaurov [39] touched on the basic truth—fluctuating asymmetry was due to random developmental processes—but he went no further with it.
The theory of developmental homeostasis was developed independently by Conrad Waddington, an English developmental biologist, and Ivan I. Schmalhausen, a Soviet evolutionary morphologist, in the 1930s and 1940s. The core concepts they introduced were canalization (or autoregulation) and stability of development. In addition, Schmalhausen introduced the concept of stabilizing selection. Both individuals were responsible for making embryology a part of the neo-Darwinian synthesis.
Waddington was primarily interested in the genetic regulation of development, which is summarized in Organizers and Genes [46] and Strategy of the Genes [15]. He was among the first to introduce genetic networks, autocatalysis, and nonlinear dynamics into biology. He also coined the terms canalization [47], developmental homeostasis, and developmental stability.
Schmalhausen’s interests were similar to Waddington’s. His most influential work was Factors of Evolution, first published in Russia in 1947, but suppressed by Lysenko and his followers after 1948. An English translation was published in 1949, before most of the first edition could be destroyed. Its main contribution was the suggestion that stabilizing selection “protects normal morphogenesis against … chance variations in the external environment” [48] (p. 79). The book also contained insightful discussions of reaction norms, morphoses, and phenodeviants, topics infrequently discussed in the West.
3.9. Developmental Stability and the Drosophila Experimentalists
Perhaps the most influential study of fluctuating asymmetry is that of Kenneth Mather, one of the founders of quantitative genetics. His paper of 1953, “Genetical control of stability in development” [49], is a classic. In it, he crossed two inbred strains of Drosophila melanogaster, and then selected for high and low asymmetry of sternopleural bristles. Mather, however, was unfamiliar with Astaurov, Ludwig, and Wright, and based most of his ideas on Waddington [47] and Timofeeff-Ressovsky [45], a close friend of Astaurov’s.
Mather’s paper was followed by those of Tebb and Thoday [50], Thoday [51,52], Beardmore [53], Reeve [54], and Parsons [55], all carried out in the laboratory with Drosophila melanogaster as the model organism. These studies established the genetic and environmental basis of fluctuating asymmetry. Mary Rasmuson [56], also working with Drosophila, introduced the frequency of phenodeviants as an alternative measure of developmental instability. A phenodeviant is a nonheritable expression of a trait. Most phenodeviants are minor, but some are considered major developmental anomalies.
This sudden explosion of interest in developmental stability underscores the importance of theory. Prior to Waddington and Schmalhausen, there was not much theory to guide researchers. Once the necessary concepts had been developed, new work proceeded in earnest.
3.10. Fluctuating Asymmetry in Natural Populations
By the 1960s, Drosophila geneticists were moving on to new problems, and fluctuating asymmetry caught the attention of scientists studying natural populations. Leigh Van Valen [40], for example, showed that fluctuating asymmetry could be easily studied in museum specimens. His paper, “A study of fluctuating asymmetry,” was important for two reasons. First, Van Valen resurrected the term fluctuating asymmetry, which had not been used since Ludwig [44]. Second, he demonstrated how to study fluctuating asymmetry in a variety of organisms, and how to distinguish it from the two other kinds of asymmetry: directional asymmetry and antisymmetry. Finally, Van Valen began the tradition that suggested that only fluctuating asymmetry was a valid measure of developmental instability.
Although Van Valen’s paper was undeniably important, it was Michael Soulé, in 1967, who demonstrated what could really be achieved with fluctuating asymmetry in natural populations. Soulé [57], studying island populations of the lizard, Uta stansburiana, in the Gulf of California, showed that levels of fluctuating asymmetry were correlated with size and relative isolation of the islands. In general, lizards on small, isolated islands had greater levels of fluctuating asymmetry than those on large islands near the mainland. Soulé attributed this to inbreeding and genic homozygosity. A later study showed that, indeed, the lizards on the smaller islands had lower heterozygosity for electrophoretic alleles [58].
The explosion of interest in fluctuating asymmetry since 1967 has primarily been from scientists studying natural populations. The obvious attraction of this approach is its simplicity and generality. Nearly all organisms have some aspect of symmetry. There has also been an underlying assumption that fluctuating asymmetry is correlated with the mean fitness of a population. It has been proposed, for example, that well-adapted populations, and coadapted gene pools, have low fluctuating asymmetry. If true, fluctuating asymmetry would be a godsend since it would allow evolutionary biologists to measure the unmeasurable. By the 1990s, many scientists were even suggesting that individual asymmetry was correlated with individual fitness [59]. Currently, there is abundant evidence for and against both of these hypotheses [60,61].
3.11. Chaos, Nonlinear Dynamics, and Systems Biology
Within the past 30 years, it has become apparent that not all processes that seem random really are. Deterministic variation that is indistinguishable from random variation is called chaos, a concept pioneered by Henri Poincaré in the 19th century, as well as Edward Lorenz, Robert May, and many others, in the late 20th century [62,63]. With the advent of chaos theory, the possibility arises that some developmental noise may actually be deterministic chaos [64,65,66].
A deterministic process (or experiment) is strictly determined by the conditions under which it occurs. Hence it is, in theory, predictable in all its details. A stochastic process (or random experiment), in contrast, is only predictable on average, and for large sample sizes, and yet deterministic processes can sometimes behave as if they are stochastic. That is, they are sometimes indistinguishable from actually being stochastic. Such determinism is called deterministic chaos. At the molecular and cellular levels, it has the potential of contributing to phenotypic variation.
Chaos theory is, in turn, a sub-discipline of nonlinear dynamics. This larger field also addresses fractals, attractors, complexity, and related subjects. It provides a theoretical basis for explaining the fractal architecture of living things, the breaking of symmetry during development, sensitivity to initial conditions, and the canalization of phenotypes, all of which contribute to phenotypic variation. It can also explain phenotypic plasticity in terms of alternate attractors in multidimensional hyperspace.
Complex dynamical systems are common in nature. A complex system contains many interacting units, and a dynamical system evolves, or changes, in time. A developing organism is a complex dynamical system.
There are two sorts of dynamical systems: conservative and dissipative. Conservative systems exhibit invariance under time reversal. The frictionless pendulum is an example of a conservative dynamical system. If such a pendulum is filmed, and the film is played back, it is impossible for the viewer to tell whether the film is being played backwards or forwards. Dissipative systems, on the other hand, do not exhibit invariance under time reversal. A developing organism is an example of a dissipative dynamical system. A film of a living organism played backwards is always obvious. Life’s trajectory (zygote, to embryo, to juvenile, to adult, to senescent adult) is unidirectional.
Dissipative systems have a number of interesting properties. Most importantly, such systems exhibit nonlinearity, positive and negative feedback, symmetry breaking, multiple stable states (bistability), macroscopic correlations, thresholds, and edge of chaos behavior [67,68].
Fractal architecture arises naturally in dissipative nonlinear systems [69]. It represents the invariance of scale. Branching respiratory, circulatory, and vascular systems are random fractals; their invariance is imperfect and finite. Scale invariance at the cellular and tissue levels generates shape asymmetry at the organ and organ-system levels. Much like fluctuating asymmetry, the breakdown of fractal architecture can occur with genetic and environmental stress. In most cases, however, the fractal dimension is reduced, which lessens the complexity of fractal objects [70,71,72].
4. Conclusions
Since the culmination of the Human Genome Project at the end of the 20th century, we have entered a new post-genomic world. It is now possible to reconstruct genetic, metabolic, and developmental networks for many species. Moreover, much recent research is firmly based in nonlinear dynamics (i.e., complexity, scale-free topology, etc.). In fact, much of the new computational systems biology addresses questions and hypotheses originally posed by Waddington and Schmalhausen. How are living things designed? How is their robustness maintained in the face of mutation and environmental perturbation? How do genes influence phenotypes? Does natural selection produce robust networks, or do they arise by some other process?
The idea that developmental stability is mediated by regulatory networks of genes and proteins is called distributed robustness. This hypothesis is consistent with the fit of random phenotypic variation in 4718 strains of haploid single-gene knockouts of yeast (Saccharomyces cerevisiae) to a double Pareto lognormal distribution [73].
There are several lines of evidence that the regulation of right–left symmetry involves feedback between right and left sides. In animals, it is likely that at least some of the feedback is through the nervous system. In Australian sheep blowflies, resistance to the insecticide ivermectin is associated with a transition from fluctuating asymmetry to antisymmetry [74]. The resistant genotype involves changes to the enzyme, acetylcholinesterase, that recycles the neurotransmitter acetylcholine. A transition from fluctuating asymmetry (normal distribution) to antisymmetry (bimodal distribution) is only possible if the right and left sides are somehow linked [75]. I have observed similar transitions in my own lab when acetylcholinesterase activity was knocked down in Drosophila melanogaster (unpublished work in my own lab).
Phenotypic variation is not absolutely fixed by the genotype and environment. Some of the developmental variation—indeed, a large part of it—is truly random. However, some also arise from complex, nonlinear developmental processes and, though it is deterministic, it is indistinguishable from true random variation. This additional source of variation reflects the dynamical aspects of development. It explains symmetry breaking, handedness, dominance, and adaptive modification, and may solve several intractable problems.
Funding
This research received no external funding.
Institutional Review Board Statement
Not applicable.
Informed Consent Statement
Not applicable.
Data Availability Statement
Not applicable.
Acknowledgments
Dmitri Lajus helped translate portions of Astaurov’s classic monograph for me. D. Carl Freeman read an early draft and made many useful suggestions. My late wife, Cathy Chamberlin-Graham helped with the literature search.
Conflicts of Interest
The author declares no conflict of interest.
References
- Darwin, C. The Origin of Species; John Murray: London, UK, 1859. [Google Scholar]
- Darwin, C. Variation of Plants and Animals under Domestication; John Murray: London, UK, 1868; Volume 1. [Google Scholar]
- Falconer, D.; Mackay, T. Introduction to Quantitative Genetics, 3rd ed.; Longmans Green: Harlow, Essex, UK, 1996. [Google Scholar]
- Finch, C.E.; Kirkwood, T.B.L. Chance, Development, and Aging; Oxford University Press: New York, NY, USA, 2000. [Google Scholar]
- Lajus, D.L.; Graham, J.H.; Kozhara, A.V. Developmental Instability and the Stochastic Component of Total Phenotypic Variance. In Developmental Instability. Causes and Consequences; Polak, M., Ed.; Oxford University Press: New York, NY, USA, 2003; pp. 343–363. [Google Scholar]
- Gärtner, K. A third component causing random variability beside environment and genotype. A reason for the limited success of a 30 year long effort to standardize laboratory animals? Lab. Anim. 1990, 24, 71–77. [Google Scholar] [CrossRef] [PubMed]
- Ashby, W.R. An Introduction to Cybernetics; Chapman and Hall: London, UK, 1956. [Google Scholar]
- Zakharov, V.M. Population phenogenetics: Analysis of developmental stability in natural populations. Acta Zool. Fenn. 1992, 191, 7–30. [Google Scholar]
- Haecker, V. Entwicklungsgeschichtliche Eigenschaftsanalyse (Phänogenetik). Gemeinsame Aufgaben der Entwicklungsgeschichte, Vererbungs- und Rassenlehre; Gustav Fischer: Jena, Germany, 1918. [Google Scholar]
- Hoßfeld, U.; Watts, E.; Levit, G.S. Valentin Haecker (1864–1927) as a pioneer of phenogenetics: Building the bridge between genotype and phenotype. Epigenetics 2017, 12, 247–253. [Google Scholar] [CrossRef] [PubMed][Green Version]
- Hoßfeld, U.; Levit, G.S.; Watts, E. 100 Years of phenogenetics: Valentin Haecker and his examination of the phenotype. Mol. Genet. Genom. 2019, 294, 445–456. [Google Scholar] [CrossRef] [PubMed]
- Kozhara, A.V. On the ratio of components of phenotypic variances of bilateral characters in populations of some fishes. Genetika 1989, 25, 1508–1513. [Google Scholar]
- Kozhara, A.V. Phenotypic variance of bilateral characters as an indicator of genetic and environmental conditions in bream Abramis brama (L.) (Pisces, Cyprinidae) populations. J. Appl. Ichthyol. 1994, 10, 167–181. [Google Scholar] [CrossRef]
- Cannon, W. The Wisdom of the Body; W.W. Norton & Company: New York, NY, USA, 1932. [Google Scholar]
- Waddington, C.H. The Strategy of the Genes: A Discussion of Some Aspects of Theoretical Biology; George Allen Unwin: London, UK, 1957. [Google Scholar]
- Zakharov, V.M. Future prospects for population phenogenetics. Sov. Sci. Rev. F Physiol. Gen. Biol. Rev. 1989, 4, 1–79. [Google Scholar]
- Pigliucci, M. Phenotypic Plasticity: Beyond Nature and Nurture; Johns Hopkins University Press: Baltimore, MD, USA, 2001. [Google Scholar]
- Graham, J.H.; Raz, S.; Hel-Or, H.; Nevo, E. Fluctuating asymmetry: Methods, theory, and applications. Symmetry 2010, 2, 466–540. [Google Scholar] [CrossRef]
- Graham, J.H.; Özener, B. Fluctuating asymmetry of human populations: A review. Symmetry 2016, 8, 154. [Google Scholar] [CrossRef]
- Herndon, L.A.; Schmeissner, P.J.; Dudaronek, J.M.; Brown, P.A.; Listner, K.M.; Sakano, Y.; Paupard, M.C.; Hall, D.H.; Driscoll, M. Stochastic and genetic factors influence tissue-specific decline in ageing C. elegans. Nature 2002, 419, 808–814. [Google Scholar] [CrossRef]
- Galton, F. The history of twins, as a criterion of the relative powers of nature and nurture. Fraser’s Mag. 1875, 12, 566–576. [Google Scholar] [CrossRef]
- Galton, F. A theory of heredity. Contemp. Rev. 1866–1900 1875, 27, 80–95. [Google Scholar] [CrossRef][Green Version]
- Pearson, K.; Lee, A.; Warren, E.; Fry, A.; Fawcett, C.D. Mathematical contributions to the theory evolution—IX. On principle of homotyposis and its relation, the variability of the individual, and to that of the race. Part I.—Homotyposis in the vegetable Kingdom. Philos. Trans. R. Soc. London. Ser. A Contain. Pap. Math. Phys. Character 1901, 197, 285–379. [Google Scholar]
- Pearson, K. On the fundamental conceptions of biology. Biometrika 1902, 1, 320–344. [Google Scholar] [CrossRef]
- Bateson, W. Heredity, differentiation, and other conceptions of biology: A consideration of Professor Karl Pearson’s paper ‘On the Principle of homotyposis’. Proc. R. Soc. Lond. 1902, 69, 193–205. [Google Scholar]
- Gould, S.J. The Structure of Evolutionary Theory; Harvard University Press: Cambridge, MA, USA, 2002. [Google Scholar]
- Fry, A. Note on variation in leaves of mulberry trees. Biometrika 1902, 1, 258. [Google Scholar] [CrossRef]
- Pearson, K.; Radford, M. On differentiation and homotyposis in the leaves of Fagus sylvatica. Biometrika 1904, 3, 104–107. [Google Scholar] [CrossRef]
- Harris, J.A. Variation and correlation in the flowers of Lagerstroemia indica. Mo. Bot. Gard. Annu. Rep. 1909, 1909, 97–104. [Google Scholar] [CrossRef]
- Simpson, J.Y. The relation of binary fission to variation. Biometrika 1902, 1, 400–407. [Google Scholar] [CrossRef]
- Harris, J.A. Variation, correlation and inheritance of fertility in the mammals. Am. Nat. 1916, 50, 626–636. [Google Scholar] [CrossRef]
- Rowan, W.; Parker, K.M.; Bell, J. On homotyposis and allied characters in eggs of the Common Tern. Biometrika 1914, 10, 144–168. [Google Scholar] [CrossRef]
- Rowan, W.; Wolff, E.; Sulman, P.L.; Pearson, K.; Isaacs, E.; Elderton, E.M.; Tildesley, M. On the nest and eggs of the Common Tern (S. fluviatilis). A cooperative study. Biometrika 1919, 12, 308–354. [Google Scholar] [CrossRef]
- De Vries, H. The Mutation Theory; Experiments and Observations on the Origin of Species in the Vegetable Kingdom: The Origin of Species by Mutation; Open Court Publishing Company: Chicago, IL, USA, 1909. [Google Scholar]
- Breitenbecher, J.K. An apterous mutation in Bruchus. Biol. Bull. 1925, 48, 166–170. [Google Scholar] [CrossRef][Green Version]
- Sumner, F.B.; Huestis, R.R. Bilateral asymmetry and its relation to certain problems of genetics. Genetics 1921, 6, 445–485. [Google Scholar] [CrossRef]
- Danforth, C.H. Resemblance and difference in twins: Twins that look and act alike attract attention first, while dissimilar ones are apt to be overlooked. J. Hered. 1919, 10, 399–409. [Google Scholar] [CrossRef]
- Wright, S. The relative importance of heredity and environment in determining the piebald pattern of guinea-pigs. Proc. Natl. Acad. Sci. USA 1920, 6, 320–332. [Google Scholar] [CrossRef]
- Astaurov, B.L. Analyse der erblichen Störungsfälle der bilateralen Symmetrie. Z. Indukt. Abstamm. Vererb. 1930, 55, 183–262. [Google Scholar] [CrossRef]
- Van Valen, L. A study of fluctuating asymmetry. Evolution 1962, 16, 125–142. [Google Scholar] [CrossRef]
- Gaissinovitch, A.E. In commemoration of Boris L. Astaurov (1904–1974). Cas. Morav. Mus. Acta Musei Moraviae. Vedy Prir. Sci. Nat. 1975, 60, 247–252. [Google Scholar]
- Berg, R.L. The life and research of Boris L. Astaurov. Q. Rev. Biol. 1979, 54, 397–416. [Google Scholar] [CrossRef] [PubMed]
- Timofeeff-Ressovsky, N. Studies on the phenotypic manifestation of hereditary factors. I. On the phenotypic manifestation of the genovariation radius incompletus in Drosophila funebris. Genetics 1927, 12, 128–198. [Google Scholar] [CrossRef]
- Ludwig, W. Das Rechts-Links Problem im Tierreich und Beim Menschen; Springer: Berlin, Germany, 1932. [Google Scholar]
- Timofeeff-Ressovsky, N.W. Über den Einfluss des genotypischen Milieus und der Aussenbedingungen auf die Realisation des Genotyps: Genmutation vti (venae transversae imcompletae) bei Drosophila funebris. Nachr. Göttingen Gesell Math Phys. KI 1934, 1, 53–104. [Google Scholar]
- Waddington, C.H. Organisers and Genes; Cambridge University Press: Cambridge, UK, 1940. [Google Scholar]
- Waddington, C.H. Canalization of development and the inheritance of acquired characters. Nature 1942, 150, 563–565. [Google Scholar] [CrossRef]
- Schmalhausen, I.I. Factors of Evolution: The Theory of Stabilizing Selection; The Blakiston Co.: Philadelphia, PA, USA, 1949. [Google Scholar]
- Mather, K. Genetical control of stability in development. Heredity 1953, 7, 297–336. [Google Scholar] [CrossRef]
- Tebb, G.; Thoday, J.M. Stability in development and relational balance of X-chromosomes in Drosophila melanogaster. Nature 1954, 174, 1109–1110. [Google Scholar] [CrossRef]
- Thoday, J.M. Balance, Heterozygosity and Developmental Stability. In Cold Spring Harbor Symposia on Quantitative Biology; Spring Harbor Laboratory Press: Cold Spring Harbor, NY, USA, 1955; pp. 318–326. [Google Scholar]
- Thoday, J.M. Homeostasis in a selection experiment. Heredity 1958, 12, 401–415. [Google Scholar] [CrossRef][Green Version]
- Beardmore, J. Developmental stability in constant and fluctuating temperatures. Heredity 1960, 14, 411–422. [Google Scholar] [CrossRef]
- Reeve, E. Some genetic tests on asymmetry of sternopleural chaeta number in Drosophila. Genet. Res. 1960, 1, 151–172. [Google Scholar] [CrossRef]
- Parsons, P.A. Maternal age and developmental variability. J. Exp. Biol. 1962, 39, 251–260. [Google Scholar] [CrossRef]
- Rasmuson, M. Frequency of morphological deviants as a criterion of developmental stability. Hereditas 1960, 46, 511–535. [Google Scholar] [CrossRef]
- Soulé, M. Phenetics of natural populations. II. Asymmetry and evolution in a lizard. Am. Nat. 1967, 101, 141–160. [Google Scholar] [CrossRef]
- Soulé, M.E. Heterozygosity and developmental stability: Another look. Evolution 1979, 33, 396–401. [Google Scholar] [CrossRef] [PubMed]
- Møller, A.P. Developmental stability and fitness: A review. Am. Nat. 1997, 149, 916–932. [Google Scholar] [CrossRef] [PubMed]
- Lens, L.; Van Dongen, S.; Kark, S.; Matthysen, E. Fluctuating asymmetry as an indicator of fitness: Can we bridge the gap between studies? Biol. Rev. 2002, 77, 27–38. [Google Scholar] [CrossRef]
- Tracy, M.; Freeman, D.C.; Duda, J.J.; Miglia, K.J.; Graham, J.H.; Hough, R.A. Developmental instability: An appropriate indicator of plant fitness? In Developmental Instability: Causes and Consequences; Polak, M., Ed.; Oxford University Press: New York, NY, USA, 2003; pp. 196–212. [Google Scholar]
- Gleick, J. Chaos: Making a New Science; Penguin: New York, NY, USA, 1987. [Google Scholar]
- Oestreicher, C. A history of chaos theory. Dialogues Clin. Neurosci. 2007, 9, 279–289. [Google Scholar]
- Molenaar, P.C.; Boomsma, D.I.; Dolan, C.V. A third source of developmental differences. Behav. Genet. 1993, 23, 519–524. [Google Scholar] [CrossRef]
- Graham, J.H.; Freeman, D.C.; Emlen, J.M. Antisymmetry, Directional Asymmetry, and Dynamic Morphogenesis. In Developmental Instability: Its Origins and Evolutionary Implications; Markow, T.A., Ed.; Kluwer: Dordrecht, The Netherlands, 1994; pp. 123–139. [Google Scholar]
- Graham, J.H.; Emlen, J.M.; Freeman, D.C. Nonlinear Dynamics and Developmental Instability. In Developmental Instability: Causes and Consequences; Polak, M., Ed.; Oxford University Press: New York, NY, USA, 2003; pp. 35–49. [Google Scholar]
- Nicolis, G.; Prigogine, I. Exploring Complexity an Introduction; St. Martin’s Press: New York, NY, USA, 1989. [Google Scholar]
- Bak, P.; Tang, C.; Wiesenfeld, K. Self-organized criticality. Phys. Rev. A 1988, 38, 364–374. [Google Scholar] [CrossRef]
- Seely, A.J.E.; Macklem, P. Fractal variability: An emergent property of complex dissipative systems. Chaos 2012, 22, 013108. [Google Scholar] [CrossRef]
- Emlen, J.M.; Freeman, D.C.; Graham, J.H. Nonlinear growth dynamics and the origin of fluctuating asymmetry. Genetica 1993, 89, 77–96. [Google Scholar] [CrossRef]
- Emlen, J.M.; Freeman, D.C.; Mills, A.; Graham, J.H. How organisms do the right thing: The attractor hypothesis. Chaos 1998, 8, 717–726. [Google Scholar] [CrossRef]
- Freeman, D.C.; Graham, J.H.; Emlen, J.M. Developmental stability in plants: Symmetries, stress and epigenesis. Genetica 1993, 89, 97–119. [Google Scholar] [CrossRef]
- Graham, J.H.; Robb, D.T.; Poe, A.R. Random phenotypic variation of yeast (Saccharomyces cerevisiae) single-gene knockouts fits a double pareto-lognormal distribution. PLoS ONE 2012, 7, e48964. [Google Scholar] [CrossRef]
- McKenzie, J.A.; Clarke, G.M. Diazinon resistance, fluctuating asymmetry and fitness in the Australian sheep blowfly, Lucilia cuprina. Genetics 1988, 120, 213–220. [Google Scholar] [CrossRef]
- Palmer, A.R.; Strobeck, C. Fluctuating asymmetry as a measure of developmental stability: Implications of non-normal distributions and power of statistical tests. Acta Zool. Fenn. 1992, 191, 57–72. [Google Scholar]
Publisher’s Note: MDPI stays neutral with regard to jurisdictional claims in published maps and institutional affiliations. |
© 2021 by the author. Licensee MDPI, Basel, Switzerland. This article is an open access article distributed under the terms and conditions of the Creative Commons Attribution (CC BY) license (https://creativecommons.org/licenses/by/4.0/).