Abstract
In this article, a new four-parameter lifetime model called the beta generalized inverse Rayleigh distribution (BGIRD) is defined and studied. Mixture representation of this model is derived. Curve’s behavior of probability density function, reliability function, and hazard function are studied. Next, we derived the quantile function, median, mode, moments, harmonic mean, skewness, and kurtosis. In addition, the order statistics and the mean deviations about the mean and median are found. Other important properties including entropy (Rényi and Shannon), which is a measure of the uncertainty for this distribution, are also investigated. Maximum likelihood estimation is adopted to the model. A simulation study is conducted to estimate the parameters. Four real-life data sets from difference fields were applied on this model. In addition, a comparison between the new model and some competitive models is done via information criteria. Our model shows the best fitting for the real data.
Keywords:
beta generalized inverse Rayleigh distribution; statistical properties; mean deviations; quantile; Rényi entropy; Shannon entropy; incomplete beta function; Montecarlo Simulation MSC:
Primary 62E10; Secondary 60E05
1. Introduction
Modeling and analysis of lifetime phenomena are important aspects of statistical work in a wide variety of scientific and technological fields. The field of lifetime data analysis has grown and expanded rapidly with respect to methodology, theory, and fields of applications. In the context of modeling the real-life phenomena, continuous probability distributions and many generalizations or transformation methods have been proposed. These generalizations, obtained either by adding one or more shape parameters or by changing the functional form of the distribution, make the models more sufficient for many applications.
The inverse Rayleigh distribution has many applications in lifetime studies. Sometimes it could not fit skewed data or near symmetrical data [1]. This paper proposes a solution by introducing a new two-parameter extension of this distribution through the use of beta generator distribution. Furthermore, the extended parameters control the skewness of the proposed model.
The generalized inverse Rayleigh distribution (GIRD) is a very useful life distribution. The GIRD is an important distribution in statistics and operations research. Ref. [2] estimated parameters of GIRD based on randomly censored samples. Ref. [3] discussed the inference of GIRD with real data applications. Moreover, ref. [4] estimated parameters of GIRD based on progressive type II censoring. In addition, ref. [5] studied the characterizations through the generalized inverted Rayleigh distribution.
The probability density function (pdf) of the generalized inverse Rayleigh distribution is given by
and the corresponding cumulative distribution function (cdf) is provided by
where and are the shape and the scale parameters, respectively.
Recently, attempts have been made to define new families of probability distributions that extend well-known families of distributions and at the same time provide great flexibility in modeling data in practice. One such class of distributions is generated from the beta random variable. This class of generalized distributions has been receiving considerable attention over the last years. A general class of distribution was introduced by [6] as:
where is the cdf of a baseline distribution and is the incomplete beta function ratio such that
where is the beta function. The skewness of the distribution is controlled by the two shape parameters a and b.
The pdf of the beta-G distribution has the following form
where is the pdf of a baseline distribution.
We can obtain the beta generalized inverse Rayleigh distribution (BGIRD) by using the pdf and cdf of GIRD in (1) and (2) as a baseline distribution for (5) and (3), which is a generalization of GIRD. The BGIRD is expected to be more flexible in real applications.
Some classes of beta-generated distributions have received considerable attention in recent years. Ref. [7] studied the beta inverse Rayleigh distribution. They provided various properties, including the quantile function, moments, mean deviations, Bonferroni and Lorenz curves, Rényi and Shannon entropies, and order statistics, as well as the maximum likelihood estimates. In addition, Ref. [8] studied the beta Rayleigh distribution and discussed some properties of the distribution. Additionally, maximum likelihood estimation and the information matrix were obtained. Ref. [9] proposed the beta generalized inverted exponential distribution and derived various statistical properties. They obtained the maximum likelihood estimators, asymptotic Fisher information matrix, and confidence interval estimates of the parameters. Moreover, applications on real data sets were provided.
The aim of this study is to introduce a generalization of the generalized inverted Rayleigh distribution termed the beta generalized inverted Rayleigh distribution. We hope that this generalization shall attract wide applications. In this study, many important characteristics of the distribution are studied. As well as estimating the parameters of the distribution using the maximum likelihood estimation method and Bayes estimation method under complete samples. A simulation study is adopted to find the estimates of this distribution according to the methods mentioned above for different sample sizes. Finally, the distribution was applied to five real data in different fields. As well, the distribution is compared with other models using information criteria.
2. The Beta Generalized Inverse Rayleigh Distribution
In this section, we introduce the four parameter beta generalized inverse Rayleigh distribution. The cdf of the BGIRD could be written using the incomplete beta function defined in (3) as follows
where , , and are shape parameters and is a scale parameter.
2.1. Probability Density Function of BGIRD
The pdf of the BGIRD takes the form
By using the power series expansion, for a real non-integer number and ,
we can rewrite the pdf of the BGIRD in (8) as an infinite power series in the following forms
and
where is a real number.
2.2. Cumulative Distribution Function of BGIRD
Figure 1 shows the curves of the BGIR probability density function.
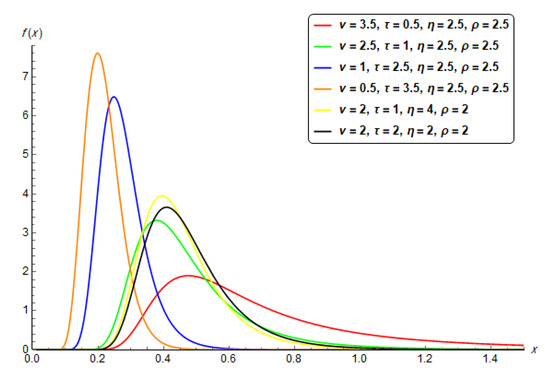
Figure 1.
The pdf curves of the BGIRD for different values of parameters.
From Figure 1, we note that the distribution is unimodal and positively skewed.
2.3. Mixture Representation
In this section, we derive mixture representations for the pdf and cdf of X in order to obtain a simple form for the BGIRD pdf. By using Equation (10), the pdf of X can be written as
Equation (14) can be rewritten as
where is the inverse Rayleigh (IR) pdf with scale parameter ().
Equation (15) reveals that the BGIRD density function can be expressed as a mixture of IR densities. Therefore, several of its structural properties can be derived from those of the inverse Rayleigh distribution (IRD).
By integrating (15), we obtain
where is the cdf of the IR model with scale parameter ().
2.4. The Reliability Function
Suppose X is a BGIR random variable which represents the lifetime of a unit, and t represents time, then the probability that a unit X survives beyond time t is called the reliability at time t. The reliability, , at time t is given as follows:
Figure 2 shows the reliability function of the BGIRD for various parameter choices.
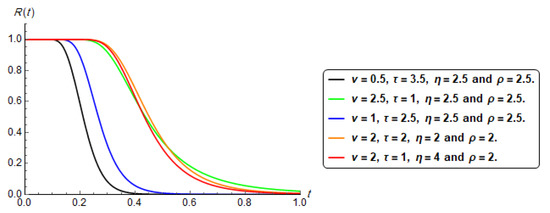
Figure 2.
The reliability curves of the BGIRD for different values of parameters.
2.5. The Hazard Function
The rate at which failure of a unit occurs per unit of time relative to the proportion of the population which has not yet failed, is the hazard function, . The hazard function of the BGIRD is given as
Figure 3 shows the hazard function of the BGIRD for various parameter choices.
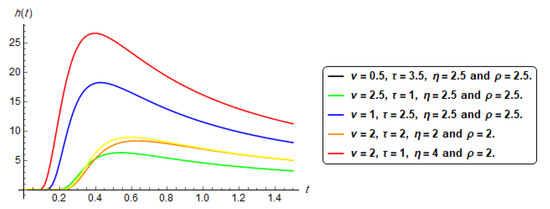
Figure 3.
The hazard curves of the BGIRD for different values of parameters.
It is shown from Figure 3 that the hazard function increases and then decreases. That is, the upside down bathtub hazard function which indicates that the risk of failing decreases as soon as the item has passed a specific time, during which it may have experienced some type of stress. Thus, the BGIRD shows good statistical behavior based on this function and could be a flexible model for fitting data in many fields.
2.6. Special Sup-Models
The BGIRD in Equation (8) represents a generalization of several distributions that have been considered in the literature.
- In particular, BGIRD becomes GIRD (, ) when and .
- The beta inverse Rayleigh distribution BIRD () is clearly a special case of BGIRD when = 1.
- IRD () can be obtained from (8) by making = 1.
- In addition, the exponentiated Rayleigh distribution ERD (, ) is a special case of BGIRD when = = 1 and the random variable Y = 1/X.
- If = = 1 and = 1 in Equation (8), the random variable Y = 1/X has the Rayleigh distribution ().
3. Statistical Properties
3.1. Quantile Function
3.2. Median
We can derive the median of the BGIRD as the following:
Set , then by using Equation (12), we have:
when a is positive and , we can take the first approximation by putting k = 0 and = 1, then we get:
After some simplifications, we can write the median of the BGIRD in the form:
3.3. Mode
The mode of the BGIRD can be found by solving the following equation with respect to x:
Then, by using (8), we get:
since , the mode is the solution of the following equation:
3.4. Moments
The rth moment of the BGIRD random variable X is given by:
using the form of the pdf in (14), we have:
By setting , we get:
where is the gamma function, which is defined as
Setting in Equation (19), we obtain the mean of X.
We noticed that the even moments of (X) do not exist, as the second and fourth moments.
Using the relation between the central and non-central moments, we obtain the nth central moment of X, say , as follows
3.5. Harmonic Mean
The harmonic mean is given by (see [10]):
Using Equation (11), the harmonic mean of the BGIRD can be derived as follows:
Let
By setting , we get:
where
Then
Therefore, the harmonic mean of BGIRD is given by:
3.6. Skewness and Kurtosis
Based on the fact that the second and fourth moments of the BGIRD are non-existent, usual skewness and kurtosis based on moments could not be found.
However, measures based on quantile, such as Bowley skewness (see [11]) and Moors kurtosis (see [12]), can quantify asymmetry and the peakedness of a given distribution. These measures exist even when moments are not available.
Bowley skewness and Moors kurtosis are defined, respectively, by
and
where is defined in (16).
The Bowley skewness, Moors kurtosis, mean, median, mode, and harmonic mean of the BGIRD for various values of , , , and are shown in Table 1.

Table 1.
The skewness, kurtosis, mean, median, mode, and harmonic mean of the BGIRD.
Table 1 shows the results of studying BGIRD’s behavior. Kurtosis and skewness values remain constant for fixed values of , , and . We also note that, with increasing , the mean, median, mode, and harmonic mean are decreasing. As the value of increases and the other parameters are fixed, the skewness, kurtosis, mean, median, mode and harmonic mean decrease. Furthermore, the skewness, kurtosis, mean, mode, and harmonic mean increase as we increase the value of and with the stability of the values of , , and . Additionally, for different values of and fixed values of , , and , the skewness, kurtosis, mean, median, mode, and harmonic mean decrease as increases. Moreover, we found that our results for = = 1 are exactly the same as the results in [5]. All graphs and computations presented were carried out by Mathematica 12.0.
3.7. Mean Deviations
The mean deviation is a measure of dispersion derived by computing the mean of the absolute values of the differences between the observed values of a variable and the mean or median of the variable. It is called average deviation (see [13]).
The mean deviation about the mean and the mean deviation about the median are, respectively, defined by:
and
where and .
The mean deviation about the mean and the median is given by the following theorems.
3.7.1. The Mean Deviation about the Mean
Theorem 1.
If X follows BGIRD, then the mean deviation about the mean is in the form
Proof.
The mean deviation about the mean can be written as
by using Equation (13), the mean deviation of the BGIRD can be derived as:
where
then, we get the mean deviation about the mean of the BGIRD as:
□
3.7.2. The Mean Deviation about the Median
Theorem 2.
If X follows BGIRD, then the mean deviation about the median is in the form
3.8. Rényi and Shannon Entropies
There are two important entropy measures: the Shannon entropy and its generalization, which is known as the Rényi entropy. The entropy of a random variable quantifies its associated uncertainty (see [14]).
The Rényi and Shannon entropies are defined, respectively, by:
where
Now, the Shannon entropy can be obtained by taking the limit of the Rényi entropy when , as follows:
The following theorems presented the forms of Rényi and Shannon entropies for the BGIRD.
3.8.1. The Rényi Entropy for the BGIRD
Theorem 3.
If X follows BGIRD, then the Rényi entropy is in the form
Figure 4 shows the curve of the BGIR Rényi entropy.
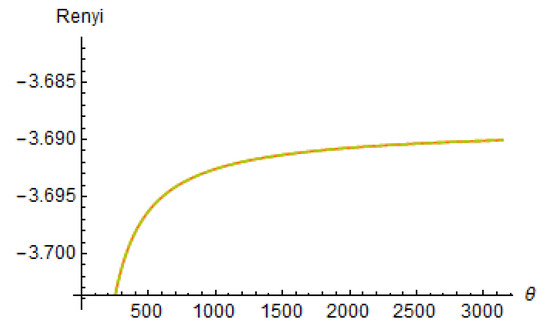
Figure 4.
The Rényi entropy for the BGIRD.
3.8.2. The Shannon Entropy for the BGIRD
Theorem 4.
If X follows BGIRD, then the Shannon entropy is in the form
The proof is presented in Appendix A.
4. Order Statistics
Order statistics deal with the properties and applications of ordered random variables and their functions. In the study of many natural problems related to flood, longevity, breaking strength, atmospheric temperature, atmospheric pressure, wind, etc., the future possibilities in the recurrence of extreme situations are of much importance and accordingly the problem of interest in these cases reduces to that of the extreme observations.
Let be a random sample from the BGIRD with pdf and cdf as in (14) and (6), respectively, and let denote the order statistics obtained from this sample. The pdf of the rth order statistic is given by (see [15]).
Here, we present an explicit expression for the density function of the rth order statistic in a random sample of size n from the BGIRD.
Using (6), the pdf of for the BGIRD is given by
by applying the series defined in Equation (9), we get:
Using the series expression for the incomplete beta function:
the pdf of can be written as
5. Maximum Likelihood Estimation Method
In this section, we determine the maximum likelihood estimates (MLEs) of the parameters of the BGIRD from complete samples. Let be a random sample of size n from the BGIRD = (, , , ).
The likelihood function in this case can be written as:
The likelihood function for the BGIRD is given by:
and the log-likelihood function is obtained as:
For the BGIRD, we have
The first derivatives of the log-likelihood function with respect to the components of are given by
where is called the Psi (Digamma) Function [16].
where
Setting the four non-linear Equations (31)–(34) to zero and solving the resulting system of non-linear equations, we obtain the maximum likelihood estimators of the unknown parameters , , , and of BGIRD. These equations are in implicit form, so they may be solved using numerical iteration, such as the Newton–Raphson method via Mathematica 12.0.
6. Simulation Study
In this part, a Monte Carlo simulation is investigated for estimating unknown parameters and the reliability function and hazard rate function of BGIRD. The simulation is conducted by using Mathematica 12.0, 1000 random samples of BGIRD were generated with values of n = (10, 20, 30, and 50) while choosing (, , , ) = (0.5, 2, 2, 2). Average of the absolute relative bias (ARBias) and mean square error (MSE), where
The results are summarized and tabulated in Table 2 which contain the values of the ARBias and MSEs for estimating the parameters and the reliability function and hazard rate function of BGIRD.
Table 2.
Maximum likelihood estimates, ARBias, and MSE of the parameters = (2, 2, 0.5, 2) and R() = 0.1519, h() = 0.8740 at t = 2.
Results of ML estimates for the four parameters, and :
- From Table 2, we note that the MSEs of the ML estimates for BGIR(, , , ), , and decrease as the sample size increases which show consistency of the estimated parameters.
- According to the simulation results given in Table 2, as the sample size n increases, the ARBias is close to zero, the mean estimates tend to be closer to the true parameter values.
7. Application
In this section, we provide four real data sets to illustrate the importance and flexibility of the BGIRD. The data sets that we applied on our model have been analyzed by [17] to assess the exbility of exponential, Lindley, and Akash distributions.
We shall compare the fit of the proposed BGIRD (and its sub-model namely: BIRD) with several other competitive models namely: the beta generalized inverse Weibull distribution (BGIWD) [18], and exponential, Lindley, and Akash distributions [17] with corresponding cumulative distribution functions (for x > 0) as follows
The previous models are chosen to compare fitting the selected data sets with the BGIRD. These models are distinguished by two distinct groups: beta-G distributions (BIRD and BGIWD) and one parameter distributions (exponential, Lindley, and Akash). Theoretically, our model has complex derivations but in the lifetime context it has a flexible failure rate function which has an upside down bathtub shape. On the other hand the exponential distribution has a constant failure rate function. Therefore, our model is better than the exponential distribution at this point.
In order to compare the models, we consider some goodness-of-fit measures including , Akaike information criterion (AIC), and Bayesian information criterion (BIC),
and
where is the maximized log-likelihood, k is the number of parameters, and n is the sample size. For more discussion on these criteria, see [19]. In general, the model with minimum values for these statistics could be chosen as the best model to fit the data. The required numerical evaluations are carried out using Mathematica 12.0.
Data Set 1: This data represents the survival times of a group of patients suffering from Head and Neck cancer disease and treated using a combination of radiotherapy and chemotherapy. These data are: 12.2, 23.56, 23.74, 25.87, 31.98, 37, 41.35, 47.38, 55.46, 58.36, 63.47, 68.46, 78.26, 74.47, 81.43, 84, 92, 94, 110, 112, 119, 127, 130, 133, 140, 146, 155, 159, 173, 179, 194, 195, 209, 249, 281, 319, 339, 432, 469, 519, 633, 725, 817, 1776.
Data Set 2: The data set represents the failure times of the air conditioning system of an airplane. It has 30 observations as follows: 23, 261, 87, 7, 120, 14, 62, 47, 225, 71, 246, 21, 42, 20, 5, 12, 120, 11, 3, 14, 71, 11, 14, 11, 16, 90, 1, 16, 52, 95.
Data Set 3: The data set represents the lifetime data relating to relief times (in minutes) of patients receiving an analgesic. The data set consists of 20 observations and it is as follows: 1.1, 1.4, 1.3, 1.7, 1.9, 1.8, 1.6, 2.2, 1.7, 2.7, 4.1, 1.8, 1.5, 1.2, 1.4, 3.0, 1.7, 2.3, 1.6, 2.0.
Data Set 4: These data are the strengths of 1.5 cm glass fibers, measured at the National Physical Laboratory, England. The data set is: 0.55, 0.93, 1.25, 1.36, 1.49, 1.52, 1.58, 1.61, 1.64, 1.68, 1.73, 1.81, 2, 0.74, 1.04, 1.27, 1.39, 1.49, 1.53, 1.59, 1.61, 1.66, 1.68, 1.76, 1.82, 2.01, 0.77, 1.11, 1.28, 1.42, 1.5, 1.54, 1.6, 1.62, 1.66, 1.69, 1.76, 1.84, 2.24, 0.81, 1.13, 1.29, 1.48, 1.5, 1.55, 1.61, 1.62, 1.66, 1.7, 1.77, 1.84, 0.84, 1.24, 1.3, 1.48, 1.51, 1.55, 1.61, 1.63, 1.67, 1.7, 1.78, 1.89.
Data Set 5: These data arose in testing on the cycle at which the Yarn failed. The data are the number of cycles until failure of the yarn and they are: 86, 146, 251, 653, 98, 249, 400, 292, 131, 169, 175, 176, 76, 264, 15, 364, 195, 262, 88, 264, 157, 220, 42, 321, 180, 198, 38, 20, 61, 121, 282, 224, 149, 180, 325, 250, 196, 90, 229, 166, 38, 337, 65, 151, 341, 40, 40, 135, 597, 246, 211, 180, 93, 315, 353, 571, 124, 279, 81, 186, 497, 182, 423, 185, 229, 400, 338, 290, 398, 71, 246, 185, 188, 568, 55, 55, 61, 244,20, 284, 393, 396, 203, 829, 239, 236, 286, 194, 277, 143, 198, 264, 105, 203, 124, 137, 135, 350, 193, 188.
The applicability of the BGIRD was demonstrated with four real lifetime data sets. The data sets were also fitted to other distributions, Table 3. The method of maximum likelihood estimation was used to estimate the parameters of the distributions. It is evident from Data Sets 3 and 4, the BGIRD has the lowest AIC, BIC, and −2 values among all fitted models. Hence, this new distribution can be chosen as the best model for fitting these data sets. From Data Set 1, there is a strong competition between BGIRD and the exponential distribution. Exponential distribution is the best according to BIC but when compared to AIC value and −2 value BGIRD is the best. In addition, as for the second data set, the exponential distribution gives better fit and the next distribution is BGIRD. As for the fifth and final data set, the most appropriate distribution was the Lindley distribution and our model is considered the third competitor distribution for fitting these data.
Table 3.
Parameter estimates, goodness-of-fit measures of the fitted distributions of Data Sets 1–4.
Figure 5 shows the curves of the empirical cdf of the data sets and the fitted cdfs.
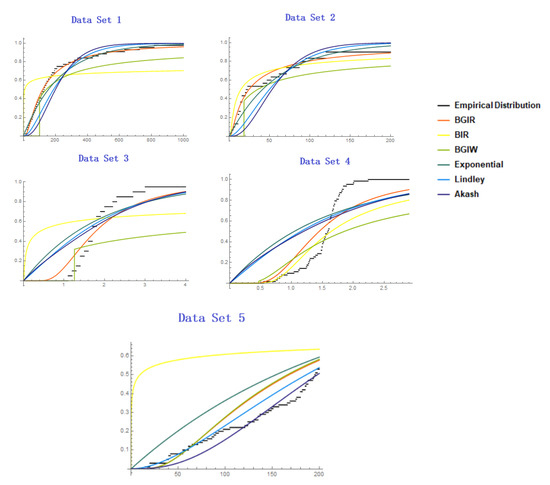
Figure 5.
Empirical cdf of the data sets and the fitted cdfs.
8. Conclusions
We studied the beta generalized inverse Rayleigh distribution (BGIRD). This new unimodal distribution has a positively skewed curve for all values of the parameters. A comprehensive study of the statistical properties of the proposed distribution has been provided. The quantile function, median, mode, moments, harmonic mean, skewness, kurtosis, and the mean deviation from the mean and from the median have been obtained. Moreover, we have derived the Rényi and Shannon entropies. In addition, we have obtained the order statistics. We hope that the proposed model may be interesting for a wider range of statistical research. All results in this article generalize the generalized inverted Rayleigh distribution (GIRD) discussed by [5]. Maximum likelihood estimators of the BGIRD parameters are obtained. Simulation studies of Monte Carlo are conducted under various sample sizes to study the theoretical performance of the MLE of the parameters. Four real data sets are analyzed and a good fit for the data sets has been provided by the BGIRD.
Author Contributions
Conceptualization, R.A.B. and A.M.A.-S.; methodology, R.A.B.; software, A.M.A.-S.; validation, R.A.B., A.M.A.-S. and A.M.A.-S.; formal analysis, A.M.A.-S.; investigation, A.M.A.-S.; resources, A.M.A.-S.; data curation, A.M.A.-S.; writing—original draft preparation, A.M.A.-S.; writing—review and editing, R.A.B.; visualization, R.A.B.; supervision, R.A.B. Both authors have read and agreed to the published version of the manuscript.
Funding
This research received no external funding.
Institutional Review Board Statement
Not applicable.
Conflicts of Interest
The authors declare no conflict of interest.
Appendix A
Theorem A1.
The Shannon entropy for the BGIRD.
Proof.
Each integral can be calculated as follows:
where
Let , then
where and it is known as Euler–Mascheroni constant. Therefore, we get:
Next,
where
Let , then
Therefore, we get:
Next,
By setting , we get:
By using the following Maclaurin series expansion (see [16]):
Next,
References
- Voda, V. On the inverse Rayleigh distributed random variable. Rep. Stat. Appl. Res. Jues 1972, 19, 13–21. [Google Scholar]
- Kumar, K.; Garg, R. Estimation of the parameters of randomly censored generalized inverted Rayleigh distribution. Int. J. Agric. Stat. Sci. 2014, 10, 147–155. [Google Scholar]
- Bakoban, R.A.; Abubaker, M.I. On the estimation of generalised inverted Rayleigh distribution with real data applications. Int. J. Electron. Commun. Comput. Eng. 2015, 6, 502–508. [Google Scholar]
- Bakoban, R.A.; Abubaker, M.I. Parameters estimation of the generalized inverted Rayleigh distribution based on progressive type II censoring. Adv. Appl. Stat. 2015, 47, 19–50. [Google Scholar]
- Bakoban, R.A.; Abubaker, M.I. Characterizations through the Generalized Inverted Rayleigh Distribution. Far East J. Theor. Stat. 2016, 52, 115–138. [Google Scholar] [CrossRef]
- Eugene, N.; Lee, C.; Famoye, F. Beta-Normal distribution and its applications. Commun. Stat. Theory Methods 2002, 31, 497–512. [Google Scholar] [CrossRef]
- Leao, J.; Saulo, H.; Bourguignon, M.; Cintra, R.; Rêgo, L.; Cordeiro, G. On some properties of the beta inverse Rayleigh distribution. Chil. J. Stat. 2013, 4, 111–131. [Google Scholar]
- Nekoukhou, V. The Beta-Rayleigh Distribution on the Lattice of Integers. J. Stat. Res. Iran 2015, 12, 205–224. [Google Scholar] [CrossRef]
- Bakoban, R.A.; Abu-Zinadah, H.H. The beta generalized inverted exponential distribution with real data applications. REVSTAT Stat. J. 2017, 15, 65–88. [Google Scholar]
- Khuri, A.I. Advanced Calculus with Applications in Statistics, 2nd ed.; Wiley: Princento, NJ, USA, 2003. [Google Scholar]
- Kenney, J.F.; Keeping, E.S. Mathematics of Statistics, 3rd ed.; Wiley: Princento, NJ, USA, 1962; Part 1. [Google Scholar]
- Moors, J.J.A. A quantile alternative for kurtosis. J. R. Stat. Soc. D 1988, 37, 25–32. [Google Scholar] [CrossRef]
- Bain, L.J.; Engelhardt, M. Introduction to Probability and Mathematical Statistics, 2nd ed.; Brooks/Cole: Boston, MA, USA, 1992. [Google Scholar]
- Song, K.S. Rényi information, loglikelihood and an intrinsic distribution measure. J. Stat. Plan. Inference 2001, 93, 51–69. [Google Scholar] [CrossRef]
- David, H.A.; Nagaraja, H.N. Order Statistics, 3rd ed.; Wiley: Princento, NJ, USA, 2003. [Google Scholar]
- Abramowitz, M.; Stegun, I.A. Handbook of Mathematical Functions with Formulas, Graphs, and Mathematical Tables, 2nd ed.; Dover Publications: New York, NY, USA, 1972. [Google Scholar]
- Shanker, R.; Hagos, F.; Sujatha, S. On Modeling of Lifetime Data using One-Parameter Akash, Lindley and Exponential Distributions. Biom. Biostat. Int. J. 2016, 3, 54–62. [Google Scholar] [CrossRef]
- Baharith, L.A.; Mousa, S.A.; Atallah, M.A.; Elgayar, S.H. The beta generalized inverse Weibull distribution. J. Adv. Math. Comput. Sci. 2014, 252–270. [Google Scholar] [CrossRef] [PubMed]
- Burnham, K.P.; Anderson, D.R. Multimodel inference: Understanding AIC and BIC in model selection. Sociol. Methods Res. 2004, 33, 261–304. [Google Scholar] [CrossRef]


Publisher’s Note: MDPI stays neutral with regard to jurisdictional claims in published maps and institutional affiliations. |
© 2021 by the authors. Licensee MDPI, Basel, Switzerland. This article is an open access article distributed under the terms and conditions of the Creative Commons Attribution (CC BY) license (https://creativecommons.org/licenses/by/4.0/).