Abstract
The structure evolution of nuclei which are in connection with symmetry breaking is one of the important problems not only for nuclear structures, but also for astrophysics and the spectroscopy of exotic nuclei. Many physical quantities can provide useful information of a shell structure, such as nuclear masses and nuclear charge radii. This paper introduces three kinds of local relations, i.e., the scheme respectively for the quadrupole deformation parameter and the excitation energy of the first , , states, the relation for nuclear charge radii and decay energies, and the so-called “nonpairing” relation for binding energies and nuclear charge radii. All these relations reflect the evolution of nuclear structures, involving shells, subshells, shape coexistence, phase transition and the Wigner effect. Some results from different models can be verified with each other.
1. Introduction
The shell structure is found in many physical systems, such as atoms and nuclei. In the early 1930s, Bartlett discovered certain regularities in the composition of atomic nuclei and speculated that nucleons within nuclei might have their own shell structure [1,2,3]. Subsequently, more systematic studies were conducted by Elsasser, and it was found experimentally that some properties of the nucleus present obvious periodic changes as the number of protons or neutrons increase, and nuclei with several special proton or neutron numbers are particularly stable [4,5,6]. These special numbers are called “magic numbers”, and were explained successfully by Mayer [7,8,9] and Jensen et al. [10,11,12,13,14] through introducing spin-orbit coupling in the mean field. The nuclear shell model, which represents magic numbers as well as experimental phenomena, such as spin, parity, magnetic moment and beta decay, was successfully developed through this line [15], and was proved to be very useful in studying the low-lying states of nuclei [16,17,18].
Nuclear mass (or binding energy) is a fundamental quantity of an atomic nucleus, and its measurement played an important role in the building of the nuclear shell model [7,8,9,10,11,12,13,14,15]. The shell structure of a neutron (proton) can be determined effectively by the double-neutron (-proton) separation energies, for their sudden decrease at magic numbers. For the nuclei away from the stability line, the binding energy decreases, and they become weak-bounded open systems near the drip line. These unstable nuclei may have different magic numbers and systematic evolution of their structures, which is in connection with the symmetry breaking that may arise [19]. In the early years, research was focused on nuclei with a small mass number, due to the limited experimental conditions. Nowadays, more than 3000 nuclei are synthesized experimentally [20,21,22] and more information of the nuclear structure can be obtained.
The structure evolution of nuclei, which is directly reflected in the ground and low-lying states, is one of the advanced topics of nuclear structure, and is also involved in astrophysics and the spectroscopy of exotic nuclei. Recently, many efforts were made toward describing and predicting physical quantities, which provide useful information of shell structure, such as nuclear masses, -decay energies, nuclear charge radii and so on. Some of these works that give relations connecting physical quantities of several neighbor nuclei or reveal certain phenomenon in local regions are called “local” relations, for example, the Garvey–Kelson mass relations [23,24], relations connected with neutron–proton interactions [25,26,27,28,29,30], and the scheme [31,32,33,34,35]. In this paper, three kinds of local relations and corresponding information reflecting nuclear structure evolutions are introduced and discussed.
2. Local Relations
In this section, three kinds of local relations that can reflect nuclear structure evolutions are introduced, and the corresponding discussions are made.
2.1. The Scheme of the Quadrupole Deformation Parameter or the Excitation Energy , and
The scheme was described by Casten, where , and for even–even nuclei exhibit smooth systematics against the product of valence proton number and valence neutron number [31,36,37]. It works equally well for the quadrupole deformation parameter (correlated with the intrinsic quadrupole moment) of all parity types of medium-heavy nuclei in Ref. [34].
In Figure 1, the absolute value of in the Nilsson perturbed–spheroid parameterization taken from Ref. [38] is presented versus for nuclei in three different regions [34]. Here only of nuclei with known experimental binding energies [22] are plotted. As discussed in Ref. [34], the correlation between and shown in Figure 1 is very compact, except for several anomalies which are labeled by the red circles in Figure 1a and marked by a red circle in Figure 1b,c.
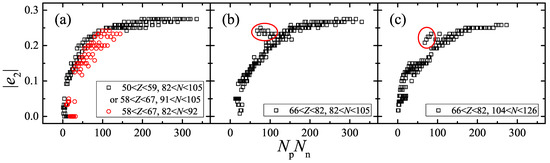
Figure 1.
in the Nilsson perturbed–spheroid parametrization [38] versus . (a) For nuclei with and . (b) For nuclei with and . (c) For nuclei with and . The anomalies are labeled by the red circles in panel (a) and marked by a red circle in panels (b,c).
Affected by the subshell, the red circles in Figure 1a, which correspond to of nuclei with and , deviate from the other black squares [34]. In addition, of isotones equals 0 as shown in Figure 1a, which is because these nuclei are soft and the difference between the equilibrium deformation and the expected value of the deformation is large [34].
Those anomalies in Figure 1b,c correspond to nuclei with or 78 and , which belong to a complex region where there exists large softness, deformation and transition [34]. In Ref. [35], similar anomalies are pointed out in the scheme for the excitation energy of the first state of even–even nuclei with or 80 and , based on the experimental data taken from Ref. [39] (see Figure 2a with the anomalies labeled by the red circles). However, it is no longer obvious with the updated experimental data taken from Ref. [40], as shown in Figure 2b.
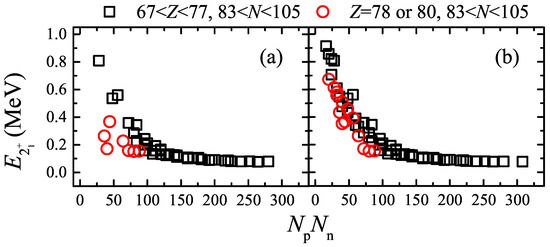
Figure 2.
versus for even-even nuclei with and . The experimental data are taken from Ref. [39] for panel (a) [35] and Ref. [40] for panel (b), respectively. The red circles correspond to the of nuclei with or 80 and .
In Ref. [41], is further discussed with the P factor, i.e., , in the same region of Figure 1b,c. in the Nilsson perturbed–spheroid parametrization [38] is plotted versus the P factor in Figure 3, where nuclei with are labeled by black squares, and isotopes with are labeled by colored dots. With the increase in factor P, grows smoothly and becomes flat around [41].
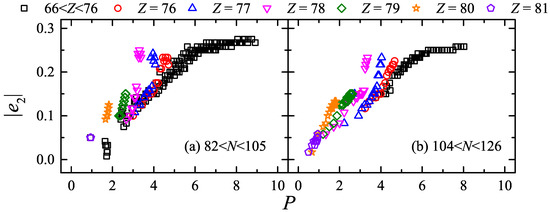
Figure 3.
in the Nilsson perturbed–spheroid parametrization [38] versus the P factor. Panel (a,b) corresponds to and , respectively. Nuclei with are labeled by black squares, and isotopes with are labeled by red circles, blue up triangles, pink down triangles, green diamonds, orange stars and violet pentagons, respectively.
It is seen that some colored dots depart from black squares obviously. Most of these anomalies correspond to nuclei with in Figure 3a and with in Figure 3b, which near the midshell . This is explained by Ref. [41] that coexisting deformed states may descend into the low-lying spectrum for nuclei with .
Similarly in Ref. [41], the relationship between [40] and the P factor is presented in Figure 4a for even–even nuclei with and . The black squares correspond to nuclei with , and isotopes with , 78 and 80 are labeled by colored dots. It is obvious that the deviation between those colored dots and the black squares becomes larger with the increase in Z. This phenomenon also appears in the relation between , [40] and the P factor, as shown in Figure 5a,c.
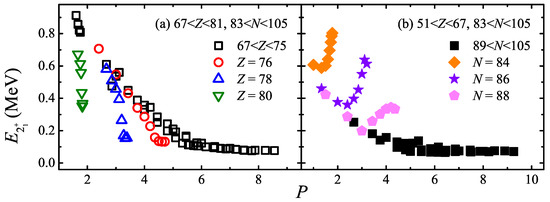
Figure 4.
[40] versus the P factor for even–even nuclei with . Panels (a,b) correspond to nuclei with and , respectively. The colored hollow dots in panel (a) are isotopes and the colored solid dots in panel (b) are isotones.
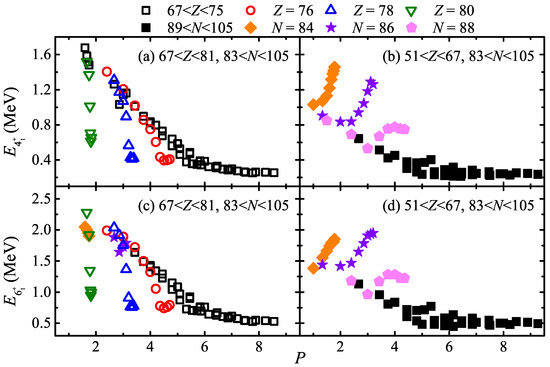
Figure 5.
and [40] versus the P factor for even–even nuclei with . Panels (a,c) correspond to nuclei with , while panels (b,d) correspond to nuclei with . The colored hollow dots are isotopes and the colored solid dots are isotones.
In addition, by comparing Figure 3 with Figure 1b,c, and Figure 4a with Figure 2b, it is easy to see that the anomalies for nuclei with are more conspicuous in the P factor plot than in the scheme for both and , and behave in a pattern with the proton number Z in the P factor plot [41].
For even–even nuclei with and , , and [40] are also plotted with the P factor in Figure 4b and Figure 5b,d, respectively. It is seen that these excitation energies [40] of nuclei with , 86 and 88 (colored solid dots) are also deviated from the others (black solid dots) obviously, as well as those and 86 isotones with as shown in Figure 5c.
2.2. Relation for Nuclear Charge Radii R and Decay Energies
It is shown in Ref. [42] that nuclear charge radii R have a good linear relationship with in a local region. Here, is a fitting parameter, and , where and are the beginning proton number and neutron number of a local region, respectively. However, some anomalies exist in several local regions [42].
Suppose that nuclear charge radii are plotted versus in Figure 6 and Figure 7 for several different local regions which are pointed to have anomalies in Ref. [42]. Here, the experimental value of R is taken from the CR2013 database [43,44], and k, , C are obtained by -fitting.
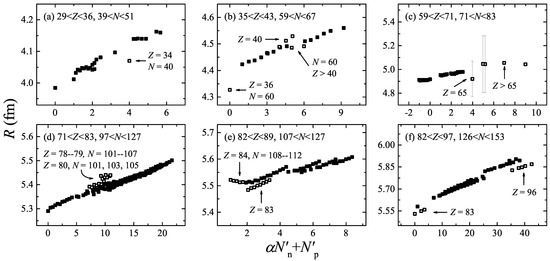
Figure 6.
Nuclear charge radii R [43,44] versus in different regions. The anomalies are labeled by the open squares, and large experimental uncertainties (>0.15 fm) of R are shown in panel (c). The parameter respectively equals 0.111, 0.534, , 0.417, 0.187 and 1.180 for panels (a–f).
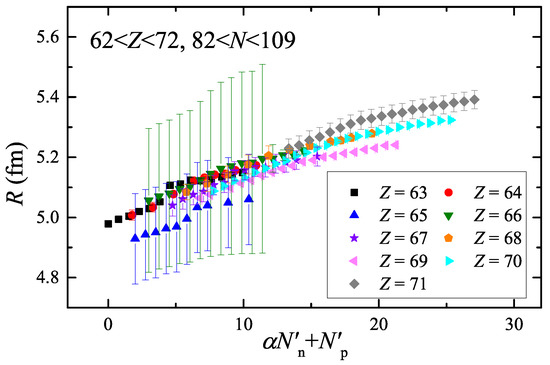
Figure 7.
Nuclear charge radii R [43,44] versus . Different symbols are used to label the chains of isotopes, and the experimental uncertainties of R are given. The parameter is 0.763.
It is seen that nuclear charge radii of nuclei with and in Figure 6d and of nuclei in Figure 7 also show abnormalities [42], which are generally consistent with the anomalies of and , , in the scheme and the P factor plot, as discussed in Section 2.1.
The anomalies given in Figure 6b may correspond to the phase transition at and [45], where it is also explained by Ref. [46] that the sudden deformation here is contrasted with the deformation from a sphere to an ellipsoid.
As shown in Figure 6c and Figure 7, R of nuclei with have very large experimental uncertainties (about 0.15 fm), which may lead to much lower positions in panels relative to the others [42]. For the other anomalies presented in Figure 6a,e,f and Figure 7, the structure of them should be further studied in the future.
The linear relationship between decay energies and is also pointed out in Ref. [47]. In Figure 8, taken from Ref. [22] is plotted versus in four different regions, and those anomalies which deviate from the others (black dots) obviously are labeled by colored dots.
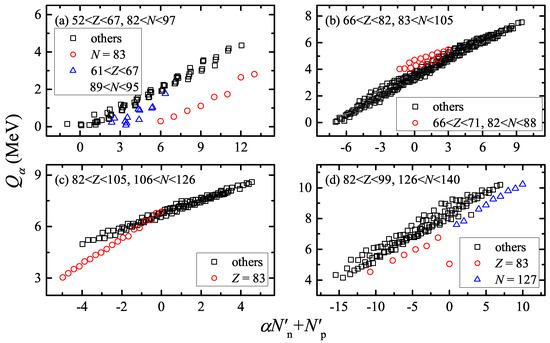
Figure 8.
decay energies [22] versus in different regions. The anomalies are labeled by colored dots. The parameter respectively equals , , and for panels (a–d).
Blue triangles in Figure 8a correspond to nuclei with and , which may be influenced by the subshell [31,36,48,49,50]. The red circles in Figure 8b denote nuclei with and , which also exhibit an anomaly as shown in Figure 5b,d (, versus the P factor) and Figure 7 (R versus ). The deviations of between isotopes and the others in Figure 8c,d are also reflected in Figure 6e,f.
2.3. The So-Called “Nonpairing” Relation of Binding Energies B and Nuclear Charge Radii R
The so-called “nonpairing” interaction between the last two protons or the last two neutrons are defined as follows:
respectively [45]. is the binding energy of nuclei with neutron number N and proton number Z.
Based on the AME2020 database [22], and are calculated by using Equations (1) and (2), and are plotted versus Z and N, respectively, in Figure 9 [45]. Those blue circles or green tringles, which correspond to nuclei with or 2 for and or 2 for , are quite large, as shown in Figure 9a,b. This is mainly caused by the Wigner effect [45], which results from the neutron–proton correlation and is dependent on the isospin.
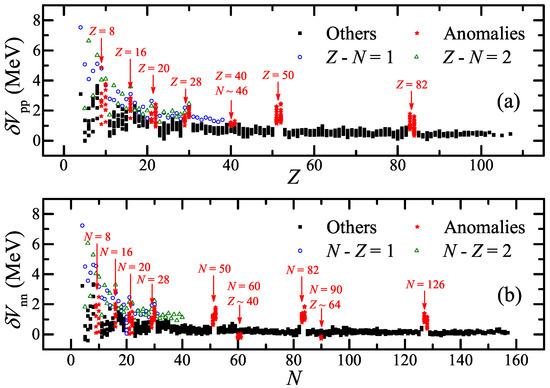
Figure 9.
(a): versus Z. (b): versus N. The anomalies are labeled by the red stars. The blue circles and green triangles correspond to nuclei with and in panel (a), and those with and in panel (b).
The other anomalies that are irrelevant to the Wigner effect are labeled by the red circles in Figure 9. As pointed in Refs. [45,51,52], these anomalies are “fingerprints” of nuclear structure involving (sub-)shells and phase transitions.
New magic numbers discovered in Refs. [53,54] are represented in Figure 9a,b, respectively [45]. The subshell (for ) [31,36,48,55,56] and subshell (for ) [31,36,48,49,50] correspond to anomalies with , of and , of , respectively [45]. In addition, the phase transition at and also behaves abnormally as shown in Figure 9b [45].
Similar to discussed above, is defined in Ref. [42], i.e.,
Here, is the nuclear charge radii of nuclei with neutron number N and proton number Z. Based on the CR2013 database [43,44], is calculated and plotted versus the neutron number N in Figure 10 [42]. The red dash lines of fm are plotted to guide the eyes.
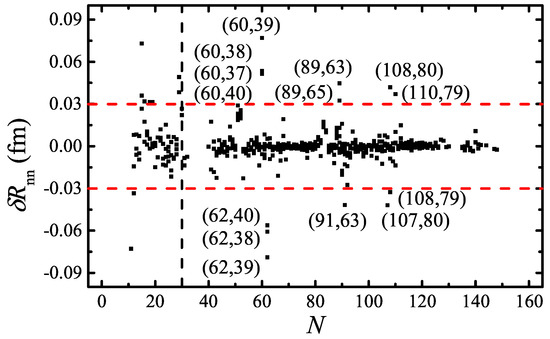
Figure 10.
versus N for . The red dash lines correspond to fm. For , nuclei with absolute values of fm are labeled.
The nuclei with fm are labeled in Figure 10, and these anomalies can be divided into three regions: (1) and or 62; (2) or 65 and or 91; (3) , or 110, and , or 108 [42]. These large deviations of are also consistent with the relation for R, as discussed in Section 2.2 [42].
The anomalies in region 3 of Figure 10 are the same as those in Figure 6d. For the other two regions, Figure 11 is plotted to explain those anomalies. Obvious gaps shown in Figure 11a,b lead to those anomalies of regions 1 and 2 of Figure 10, respectively [42].
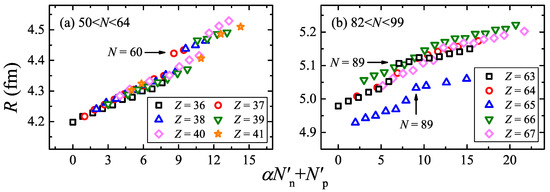
Figure 11.
Nuclear charge radii R [43,44] versus . Different symbols are used to label the chains of isotopes. The parameter is 0.844 for panel (a) and 1.178 for panel (b).
The sudden increase in R at shown in Figure 11a corresponds to the phase transition at , (as discussed above in Figure 6b in Section 2.2). The gap in Figure 11b is influenced by the subshell [45].
3. Conclusions
In this paper, three kinds of local relations that can reflect many nuclear structure evolutions are introduced, and some results of these models can be verified with each other.
The new magic numbers and Wigner effect can be reflected from and . The phase transition at and is shown in the relation, and , relation. The subshell at and causes a part of the anomalies in . The scheme of , , and the relation of R and show abnormalities at the subshell.
The shape coexistence in the region of nuclei with and can be given by the in both the scheme and the P factor plot, the , , in the P factor plot, and the relation and the relation for nuclear charge radii R.
In addition, anomalies of nuclei with and arise in the P factor plot of , , , as well as the relation of R and , and anomalies of isotopes arise in both the relations of R and . The reason for these anomalies is still unknown and should be studied further.
Author Contributions
Conceptualization, M.B.; methodology, M.B.; validation, M.B. and Q.W.; formal analysis, M.B. and Q.W.; investigation, M.B.; data curation, M.B. and Q.W.; writing—original draft preparation, M.B.; writing—review and editing, M.B.; visualization, M.B. and Q.W.; supervision, M.B. All authors have read and agreed to the published version of the manuscript.
Funding
This research was funded by the National Natural Science Foundation of China, grant number 11905130, and Shanghai Sailing Program, grant number 19YF1434200.
Data Availability Statement
Data is contained within the article.
Conflicts of Interest
The authors declare no conflict of interest.
References
- Bartlett, J.H. Nuclear Structure. Nature 1932, 130, 165. [Google Scholar] [CrossRef]
- Bartlett, J.H. Structure of Atomic Nuclei. Phys. Rev. 1932, 41, 370–371. [Google Scholar] [CrossRef]
- Bartlett, J.H. Structure of Atomic Nuclei. II. Phys. Rev. 1932, 42, 145–146. [Google Scholar] [CrossRef]
- Elsasser, W.M. Sur le principe de Pauli dans les noyaux. J. Phys. Radium 1933, 4, 549–556. [Google Scholar] [CrossRef]
- Elsasser, W.M. Sur le principe de Pauli dans les noyaux—II. J. Phys. Radium 1934, 5, 389–397. [Google Scholar] [CrossRef]
- Elsasser, W.M. Sur le principe de Pauli dans les noyaux—III. J. Phys. Radium 1934, 5, 635–639. [Google Scholar] [CrossRef]
- Mayer, M.G. On Closed Shells in Nuclei. Phys. Rev. 1948, 74, 235–239. [Google Scholar] [CrossRef]
- Mayer, M.G. On Closed Shells in Nuclei. II. Phys. Rev. 1949, 75, 1969–1970. [Google Scholar] [CrossRef]
- Mayer, M.G. Nuclear Configurations in the Spin-Orbit Coupling Model. I. Empirical Evidence. Phys. Rev. 1950, 78, 16–21. [Google Scholar] [CrossRef]
- Haxel, O.; Jensen, J.H.D.; Sueß, H.E. Zur Interpretation der ausgezeichneten Nucleonenzahlen im Bau der Atomkerne. Naturwissenschaften 1948, 35, 376. [Google Scholar] [CrossRef]
- Sueß, H.E.; Haxel, O.; Jensen, J.H.D. Zur Interpretation der ausgezeichneten Nucleonenzahlen im Bau der Atomkerne. Naturwissenschaften 1949, 36, 153–155. [Google Scholar] [CrossRef]
- Jensen, J.H.D.; Sueß, H.E.; Haxel, O. Modellmäßige Deutung der ausgezeichneten Nucleonenzahlen im Kernbau. Naturwissenschaften 1949, 36, 155–156. [Google Scholar] [CrossRef]
- Haxel, O.; Jensen, J.H.D.; Sueß, H.E. On the “Magic Numbers" in Nuclear Structure. Phys. Rev. 1949, 75, 1766. [Google Scholar] [CrossRef]
- Haxel, O.; Jensen, J.H.D.; Sueß, H.E. Modellmäßige Deutung der ausgezeichneten Nukleonenzahlen im Kernbau. Z. Phys. 1950, 128, 295–311. [Google Scholar] [CrossRef]
- Mayer, M.G.; Jensen, J.H.D. Elementary Theory of Nuclear Shell Structure; John Wiley & Sons Inc.: New York, NY, USA, 1955. [Google Scholar]
- de-Shalit, A.; Talmi, I. Nuclear Shell Theory; Academic Press Inc.: New York, NY, USA, 1963. [Google Scholar]
- Lawson, R.D. Theory of the Nuclear Shell Model; Oxford University Press: New York, NY, USA, 1980. [Google Scholar]
- Talmi, I. Simple Models of Complex Nuclei: The Shell Model and Interacting Boson Model; Harwood Academic Publishers: Chur, Switzerland, 1993. [Google Scholar]
- Editing group for future strategies study of nuclear and plasma physics. Forefronts and Future Strategies of Nuclear Physics and Plasma Physics; Science Press: Beijing, China, 2017; pp. 121–206. (In Chinese) [Google Scholar]
- Kondev, F.G.; Wang, M.; Huang, W.J.; Naimi, S.; Audi, G. The NUBASE2020 evaluation of nuclear physics properties. Chin. Phys. C 2021, 45, 030001. [Google Scholar] [CrossRef]
- Huang, W.J.; Wang, M.; Kondev, F.G.; Audi, G.; Naimi, S. The AME 2020 atomic mass evaluation (I). Evaluation of input data, and adjustment procedures. Chin. Phys. C 2021, 45, 030002. [Google Scholar] [CrossRef]
- Wang, M.; Huang, W.J.; Kondev, F.G.; Audi, G.; Naimi, S. The AME2020 atomic mass evaluation (II). Tables, graphs and references. Chin. Phys. C 2021, 45, 030003. [Google Scholar] [CrossRef]
- Garvey, G.T.; Kelson, I. New Nuclidic Mass Relationship. Phys. Rev. Lett. 1966, 16, 197–200. [Google Scholar] [CrossRef]
- Garvey, G.T.; Gerace, W.J.; Jaffe, R.L.; Talmi, I.; Kelson, I. Set of Nuclear-Mass Relations and a Resultant Mass Table. Rev. Mod. Phys. 1966, 41, S1–S80. [Google Scholar] [CrossRef]
- Gao, Z.C.; Chen, Y.S. Enhancement of the n − p interaction in odd-odd nuclei. Phys. Rev. C 1999, 59, 735–739. [Google Scholar]
- Gao, Z.C.; Chen, Y.S.; Meng, J. Garvey-Kelson Mass Relations and n-p Interaction. Chin. Phys. Lett. 2001, 18, 1186–1188. [Google Scholar]
- Fu, G.J.; Jiang, H.; Zhao, Y.M.; Pittel, S.; Arima, A. Nuclear binding energies and empirical proton-neutron interactions. Phys. Rev. C 2010, 82, 034304. [Google Scholar] [CrossRef]
- Jiang, H.; Fu, G.J.; Zhao, Y.M.; Arima, A. Nuclear mass relations based on systematics of proton-neutron interactions. Phys. Rev. C 2010, 82, 054317. [Google Scholar] [CrossRef]
- Fu, G.J.; Lei, Y.; Jiang, H.; Zhao, Y.M.; Sun, B.; Arima, A. Description and evaluation of nuclear masses based on residual proton-neutron interactions. Phys. Rev. C 2011, 84, 034311. [Google Scholar] [CrossRef]
- Jiang, H.; Fu, G.J.; Sun, B.; Liu, M.; Wang, N.; Wang, M.; Ma, Y.G.; Lin, C.J.; Zhao, Y.M.; Zhang, Y.H.; et al. Predictions of unknown masses and their applications. Phys. Rev. C 2012, 85, 054303. [Google Scholar] [CrossRef]
- Casten, R.F. NpNn systematics in heavy nuclei. Nucl. Phys. A 1985, 443, 1–28. [Google Scholar] [CrossRef]
- Casten, R.F.; Zamfir, N.V. The evolution of nuclear structure: The NpNn scheme and related correlations. J. Phys. G Nucl. Part. Phys. 1996, 22, 1521–1552. [Google Scholar] [CrossRef]
- Casten, R.F. Nuclear Structure from a Simple Perspective, 2nd ed.; Oxford University Press: New York, NY, USA, 2000. [Google Scholar]
- Zhao, Y.M.; Casten, R.F.; Arima, A. Generalization of the NpNn Scheme and the Structure of the Valence Space. Phys. Rev. Lett. 2000, 85, 720–723. [Google Scholar] [CrossRef] [PubMed] [Green Version]
- Zhao, Y.M.; Arima, A. Generalization of the NpNn scheme to nonyrast levels of even-even nuclei. Phys. Rev. C 2003, 68, 017301. [Google Scholar] [CrossRef] [Green Version]
- Casten, R.F. Possible Unified Interpretation of Heavy Nuclei. Phys. Rev. Lett. 1985, 54, 1991–1994. [Google Scholar] [CrossRef]
- Casten, R.F.; Brenner, D.S.; Haustein, P.E. Valence p-n interactions and the development of collectivity in heavy nuclei. Phys. Rev. Lett. 1987, 58, 658–661. [Google Scholar] [CrossRef]
- Möller, P.; Nix, J.R.; Myers, W.D.; Swiatecki, W.J. Nuclear Ground-State Masses and Deformations. At. Data Nucl. Data Tables 1995, 59, 185–381. [Google Scholar] [CrossRef] [Green Version]
- Sakai, M. Quasi-bands in even-even nuclei. At. Data Nucl. Data Tables 1984, 31, 399–432. [Google Scholar] [CrossRef]
- National Nuclear Data Center. Available online: https://www.nndc.bnl.gov/ (accessed on 27 September 2021).
- Zhao, Y.M.; Arima, A.; Casten, R.F. Systematics of nuclear deformation in large regions. Phys. Rev. C 2001, 63, 067302. [Google Scholar] [CrossRef]
- Bao, M.; Zong, Y.Y.; Zhao, Y.M.; Arima, A. Local relations of nuclear charge radii. Phys. Rev. C 2020, 102, 014306. [Google Scholar] [CrossRef]
- Angeli, I.; Marinova, K.P. Table of experimental nuclear ground state charge radii: An update. At. Data Nucl. Data Tables 2013, 99, 69–95. [Google Scholar] [CrossRef]
- The Table of Experimental Nuclear Charge Radii. Available online: https://www-nds.iaea.org/radii/ (accessed on 29 September 2021).
- Fu, G.J.; Bao, M.; He, Z.; Jiang, H.; Zhao, Y.M.; Arima, A. Pairing interactions and one-nucleon separation energies. Phys. Rev. C 2012, 86, 054303. [Google Scholar] [CrossRef]
- Rowe, D.J.; Wood, J.L. Fundamentals of Nuclear Models: Foundational Models; World Scientific Publishing Company: Singapore, 2010; pp. 41–44. [Google Scholar]
- Jia, J.; Qian, Y.; Ren, Z. Systematics of α-decay energies in the valence correlation scheme. Phys. Rev. C 2021, 103, 024314. [Google Scholar] [CrossRef]
- Casten, R.F. A simple approach to nuclear transition regions. Phys. Lett. B 1985, 152, 145–150. [Google Scholar] [CrossRef]
- Ogawa, M.; Broda, R.; Zell, K.; Daly, P.J.; Kleinheinz, P. Lowest 2+ State in and the Energy Gap at Z = 64. Phys. Rev. Lett. 1978, 41, 289–292. [Google Scholar] [CrossRef]
- Casten, R.F.; Warner, D.D.; Brenner, D.S.; Gill, R.L. Relation between the Z = 64 Shell Closure and the Onset of Deformation at N = 88–90. Phys. Rev. Lett. 1981, 47, 1433–1436. [Google Scholar] [CrossRef]
- Zamfir, N.V.; Casten, R.F. Nonpairing like-nucleon valence residual interactions. Phys. Rev. C 1991, 43, 2879–2882. [Google Scholar] [CrossRef]
- Casten, R.F.; Zamfir, N.V. Evolution of pre-collective nuclei: Structural signatures near the drip lines. Phys. Scr. 1995, T56, 47–57. [Google Scholar] [CrossRef]
- Ozawa, A.; Kobayashi, T.; Suzuki, T.; Yoshida, K.; Tanihata, I. New Magic Number, N = 16, near the Neutron Drip Line. Phys. Rev. Lett. 2000, 84, 5493–5495. [Google Scholar] [CrossRef]
- Gupta, R.K.; Balasubramaniam, M.; Kumar, S.; Patra, S.K.; Münzenberg, G.; Greiner, W. Magic numbers in exotic light nuclei near drip lines. J. Phys. G Nucl. Part. Phys. 2006, 32, 565–571. [Google Scholar] [CrossRef]
- Federman, P.; Pittel, S. Unified shell-model description of nuclear deformation. Phys. Rev. C 1979, 20, 820–829. [Google Scholar] [CrossRef]
- Tabor, S.L. Collective systematics in the mass 80 region. Phys. Rev. C 1986, 34, 311–316. [Google Scholar] [CrossRef] [PubMed]
Publisher’s Note: MDPI stays neutral with regard to jurisdictional claims in published maps and institutional affiliations. |
© 2021 by the authors. Licensee MDPI, Basel, Switzerland. This article is an open access article distributed under the terms and conditions of the Creative Commons Attribution (CC BY) license (https://creativecommons.org/licenses/by/4.0/).