1. Introduction
Every year the number of mobile malicious applications (apps) in the wild increases significantly. For instance, according to a 2020 report by McAfee [
1], hidden apps, known for their ability to conceal their presence after installation while annoying victims with invasive ads, have become the most active mobile threat. To stay covert, malware writers encrypt their code and spread it throughout the program, thus making legacy signature-based detection increasingly harder. Overall, the galloping rise of mobile malware of any kind calls for more robust detection solutions by leveraging on Machine Learning (ML).
Generally, mobile malware detection schemes can be categorized into two broad classes, namely signature and anomaly-based. The former collects patterns and signatures stemming from known malware, and compares them against unknown pieces of code for determining their status. The latter class employs a more lax approach; by observing the normal behavior of a piece of code for a certain amount of time and using the metrics of that normal model against any deviant behavior. App analysis on the other hand is done by means of either a static, dynamic, or hybrid method. Briefly, opposite to the dynamic approach, static analysis involves examining an app without actually running it. In the last few years, considerable work has been devoted to all the three types of app analysis for the sake of effectively detecting malware on Android [
2,
3,
4,
5,
6]. However, hitherto, little attention has been paid to hybrid approaches for malware detection with emphasis on ML.
The work at hand concerns the design, implementation and evaluation of Androtomist, a hybrid detection solution that symmetrically combines static analysis and dynamic instrumentation to detect mobile malware on the Android platform. Instrumentation is the process of injecting trace code into a software’s source code, binary code, or execution environment, and is mainly exploited for debugging, tracing, and performance and security analysis purposes. Instrumentation techniques do not necessarily modify code, but rather tamper with the app’s execution or behavior based on defined constructs. The advantages of melding static analysis with dynamic instrumentation into a hybrid approach are twofold. On the one hand, the static analysis works as a fast pre-filtering mechanism capitalizing on permission analysis, API calls, and intents. On the other, by instrumenting code, one is able to scrupulously analyze and detect a plethora of behaviors during runtime, such as network traffic, information leakage threatening the privacy of the end-user [
7], and so on. On top of legacy signature-based metrics, Androtomist is assessed via the use of different classification performance metrics against three well-known malware datasets.
To enable the use of Androtomist by virtually anyone, including ordinary end-users, a web app has been developed. The web-based interface caters for easily uploading and analyzing mobile apps on-the-fly. Both static and dynamic analysis in terms of feature extraction are performed automatically. Finally, unlike similar open source tools, Androtomist is easy to set up and has only a few dependencies, all of which pertain to open source software. The main contributions of this study are:
A methodology is presented that collects groups of static and dynamic features mapping the behavior of an app, including permissions, intents, API calls, Java classes, network traffic, and inter-process communication. Especially for the dynamic analysis part, among others, we improve the hitherto related work by means of contributing features emanating from the hooking of Java classes, which is made possible due to instrumentation.
We examine the effect of features when dynamic instrumentation is provided. It is demonstrated that the effectiveness of classification models based on either static or dynamic analysis without instrumentation is outperformed by models using dynamic instrumentation.
We report experimental results on three different well-known mobile malware benchmark datasets that are directly compared with state-of-the-art methods under the same settings. The performance of the approaches presented in this paper is quite competitive to the best results reported so far for these corpora, demonstrating that the proposed methods can be an efficient and effective alternative toward more sophisticated malware detection systems.
We propose an ensemble approach by averaging the output of all base models for each malware instance separately. The combination of all base models achieves the best average results in all three data sets examined. This demonstrates that ensembles of classifiers based on multiple, possibly heterogeneous models, can further improve the performance of individual base classifiers.
A new, publicly available, open source software tool is provided that could be exploited for conducting further research on mobile malware detection.
The remainder of this paper is organized in the following manner. The next section discusses the related work.
Section 3 details on our methodology.
Section 4 presents our results and outcomes. A discussion of the key findings is included in
Section 5. The last section concludes and provides pointers to future work.
2. Related Work
As of today, the topic of mobile malware detection via the use of hybrid schemes has received significant attention in the Android security literature [
8,
9]. This section along with
Table 1 offer a succinct chronologically arranged review of the most notable and recent works on this topic. Specifically, we concentrate on contributions published over the last four years, that is, from 2015 to 2020.
Patel et al. [
10] proposed a hybrid approach for mobile malware detection, which combines app analysis and ML techniques to classify apps as benign or malicious. The features collected vary from app’s permissions, intents, and API calls during static analysis to network traffic in the course of dynamic analysis. According to the authors, it takes around 8 to 11 min to scan an app.
Cam et al. [
11] presented
uitHyDroid. Their system firstly uses static analysis to collect user’s interface elements, followed by dynamic analysis to capture possible inter-app communication and link partial sensitive data flows stemming from static analysis. However, their proposed system has been evaluated with a rather small dataset of 23 apps.
Tuan et al. [
12] proposed
eDSDroid, an analysis tool which uses both static and dynamic analysis to identify malware targeting inter-app communication. Specifically, at a first stage, static analysis detects information leakage, while dynamic analysis is employed to help eliminate the false positives of the first stage. On the downside, their approach has only been evaluated with a tiny corpus of 3 apps. Martinelli et al. [
13] introduced
BRIDEMAID. Their system operates in three consequent steps, namely static, meta-data, and dynamic. During static analysis, BRIDEMAID decompiles the apk and analyzes the source code for finding possible similarities in the executed actions. This is done with the help of
n-grams. Dynamic analysis exploits both ML classifiers and security policies to control suspicious activities related to text messages, system call invocations, and administrator privilege abuses. In their evaluations, the authors used the Drebin dataset, which by now is mostly considered outdated.
Xu et al. [
14] proposed
HADM. With HADM, the features extracted during static analysis are converted into vector-based representations, while those fetched during dynamic analysis, namely system call invocations, are converted into vector-based and graph-based representations. Deep learning techniques were used to train a neural network for each of the vector sets. Finally, the hierarchical multiple kernel learning technique was applied with the purpose of combining different kernel learning results from diverse features, and thus improve the classification accuracy. According to the authors, their model is weak against code obfuscation techniques because dynamic analysis is guided based on the results obtained from static analysis.
Ali-Gombe et al. [
15] presented
AspectDroid an hybrid analysis system, which analyzes Android apps to detect unwanted or suspicious activities. The proposed system employs static bytecode instrumentation to provide efficient dataflow analysis. However, static instrumentation is unable to detect apps which use anti-unpacking and anti-repackaging obfuscation mechanisms. Furthermore, the authors used the Drebin dataset to evaluate their model, which is mostly considered obsolete nowadays. Finally, their tests were conducted on an outdated Android version (ver. 6.0).
Arshad et al. [
16] introduced a hybrid malware detection scheme, namely
SAMADroid. According to the authors, SAMADroid delivers high detection accuracy by combining static and dynamic analysis, which run both in a local and remote fashion. ML is used to detect malicious behavior of unknown apps and to correctly classify them. On the negative side, their scheme was tested on an outdated Android version (ver. 5.1).
Tsutano et al. [
17] contributed an Android analysis framework called
JITANA. According to the authors, JITANA can be used to identify inter-app communications as well as potential malicious collaborations among apps. A number of tests conducted by the authors demonstrated the effectiveness of JITANA in three different Android devices with multiple installed apps. On the negative side, the authors neither provide the detection rate and precision achieved nor any result about malicious apps which do not use intents.
Wang et al. [
18] proposed a hybrid approach coined
DirectDroid, which combines fuzzy logic with a new type of app testing process called “on-demand forced execution”. According to the authors, by using this technique one can trigger more hidden malicious behaviors. On top of that, DirectDroid avoids app crashes with the use of fuzzy logic and static instrumentation. DirectDroid was evaluated against 951 malware samples from 3 datasets, namely Drebin, GitHub, and AMD, and it is reported that it can detect more malicious behaviors via a method called “augmenting fuzzing”. Nevertheless, given that code obfuscation techniques render detection harder for virtually any static approach, DirectDroid cannot detect malware which employs code obfuscation or have malicious code in native payload. Put simply, any obfuscated code is invisible to DirectDroid’s static analyzer.
Fang et al. [
19] suggested a hybrid analysis method which performs dynamic analysis on the results of static analysis. During the static analysis phase, they decompiled the app’s APK file to extract permissions from the manifest file as well as any occurrence of API features existing in
smali files. Regarding dynamic analysis, they generated user input and logged the system calls. Finally, they used ML algorithms to classify apps. After experimentation, they reported a detection accuracy of 94.6% using a balanced dataset of 4000 benign and 4000 malicious apps.
Lately, Surendran et al. [
20] implemented a Tree Augmented Naive Bayes (TAN) model that combines the classifier output variables pertaining to static and dynamic features, namely API calls, permissions and system calls, to detect malicious behavior. Their experiments showed an accuracy of up to 97%. The authors did not provide information about the Android version they employed or about how they generated user input events for the purposes of dynamic analysis.
As observed from
Table 1, scarce research is hitherto conducted toward the use of dynamic instrumentation in hybrid detection approaches, as none of the above mentioned contributions exploits such a scheme. Furthermore, none of the previous work capitalises on information stemming from hooking Java classes. Moreover, none of them is offered as a web app and only the work in Reference [
17] is open source. ML techniques are exploited in half of the works included in the Table, namely References [
10,
13,
14,
16,
19]. Finally, it is worth mentioning that there exists a number of free online Android app analysis tools, including
AMAaaS [
21] and
VirusTotal [
22]. AMAaaS reportedly applies hybrid analysis, but unfortunately its source code is kept private, and the tool’s webpage provides insufficient information regarding its analysis and classification engines. On the other hand, VirusTotal is not an apk analysis tool, but rather a vote-based system that leverages analysis from multiple engines.
3. Methodology
This section details on our methodology, that is, the tool implemented, the feature extraction process, and the datasets exploited.
3.1. Androtomist
Androtomist is offered as a web app [
23], which enables the user to easily upload, analyze, and study the behavior of any Android app.
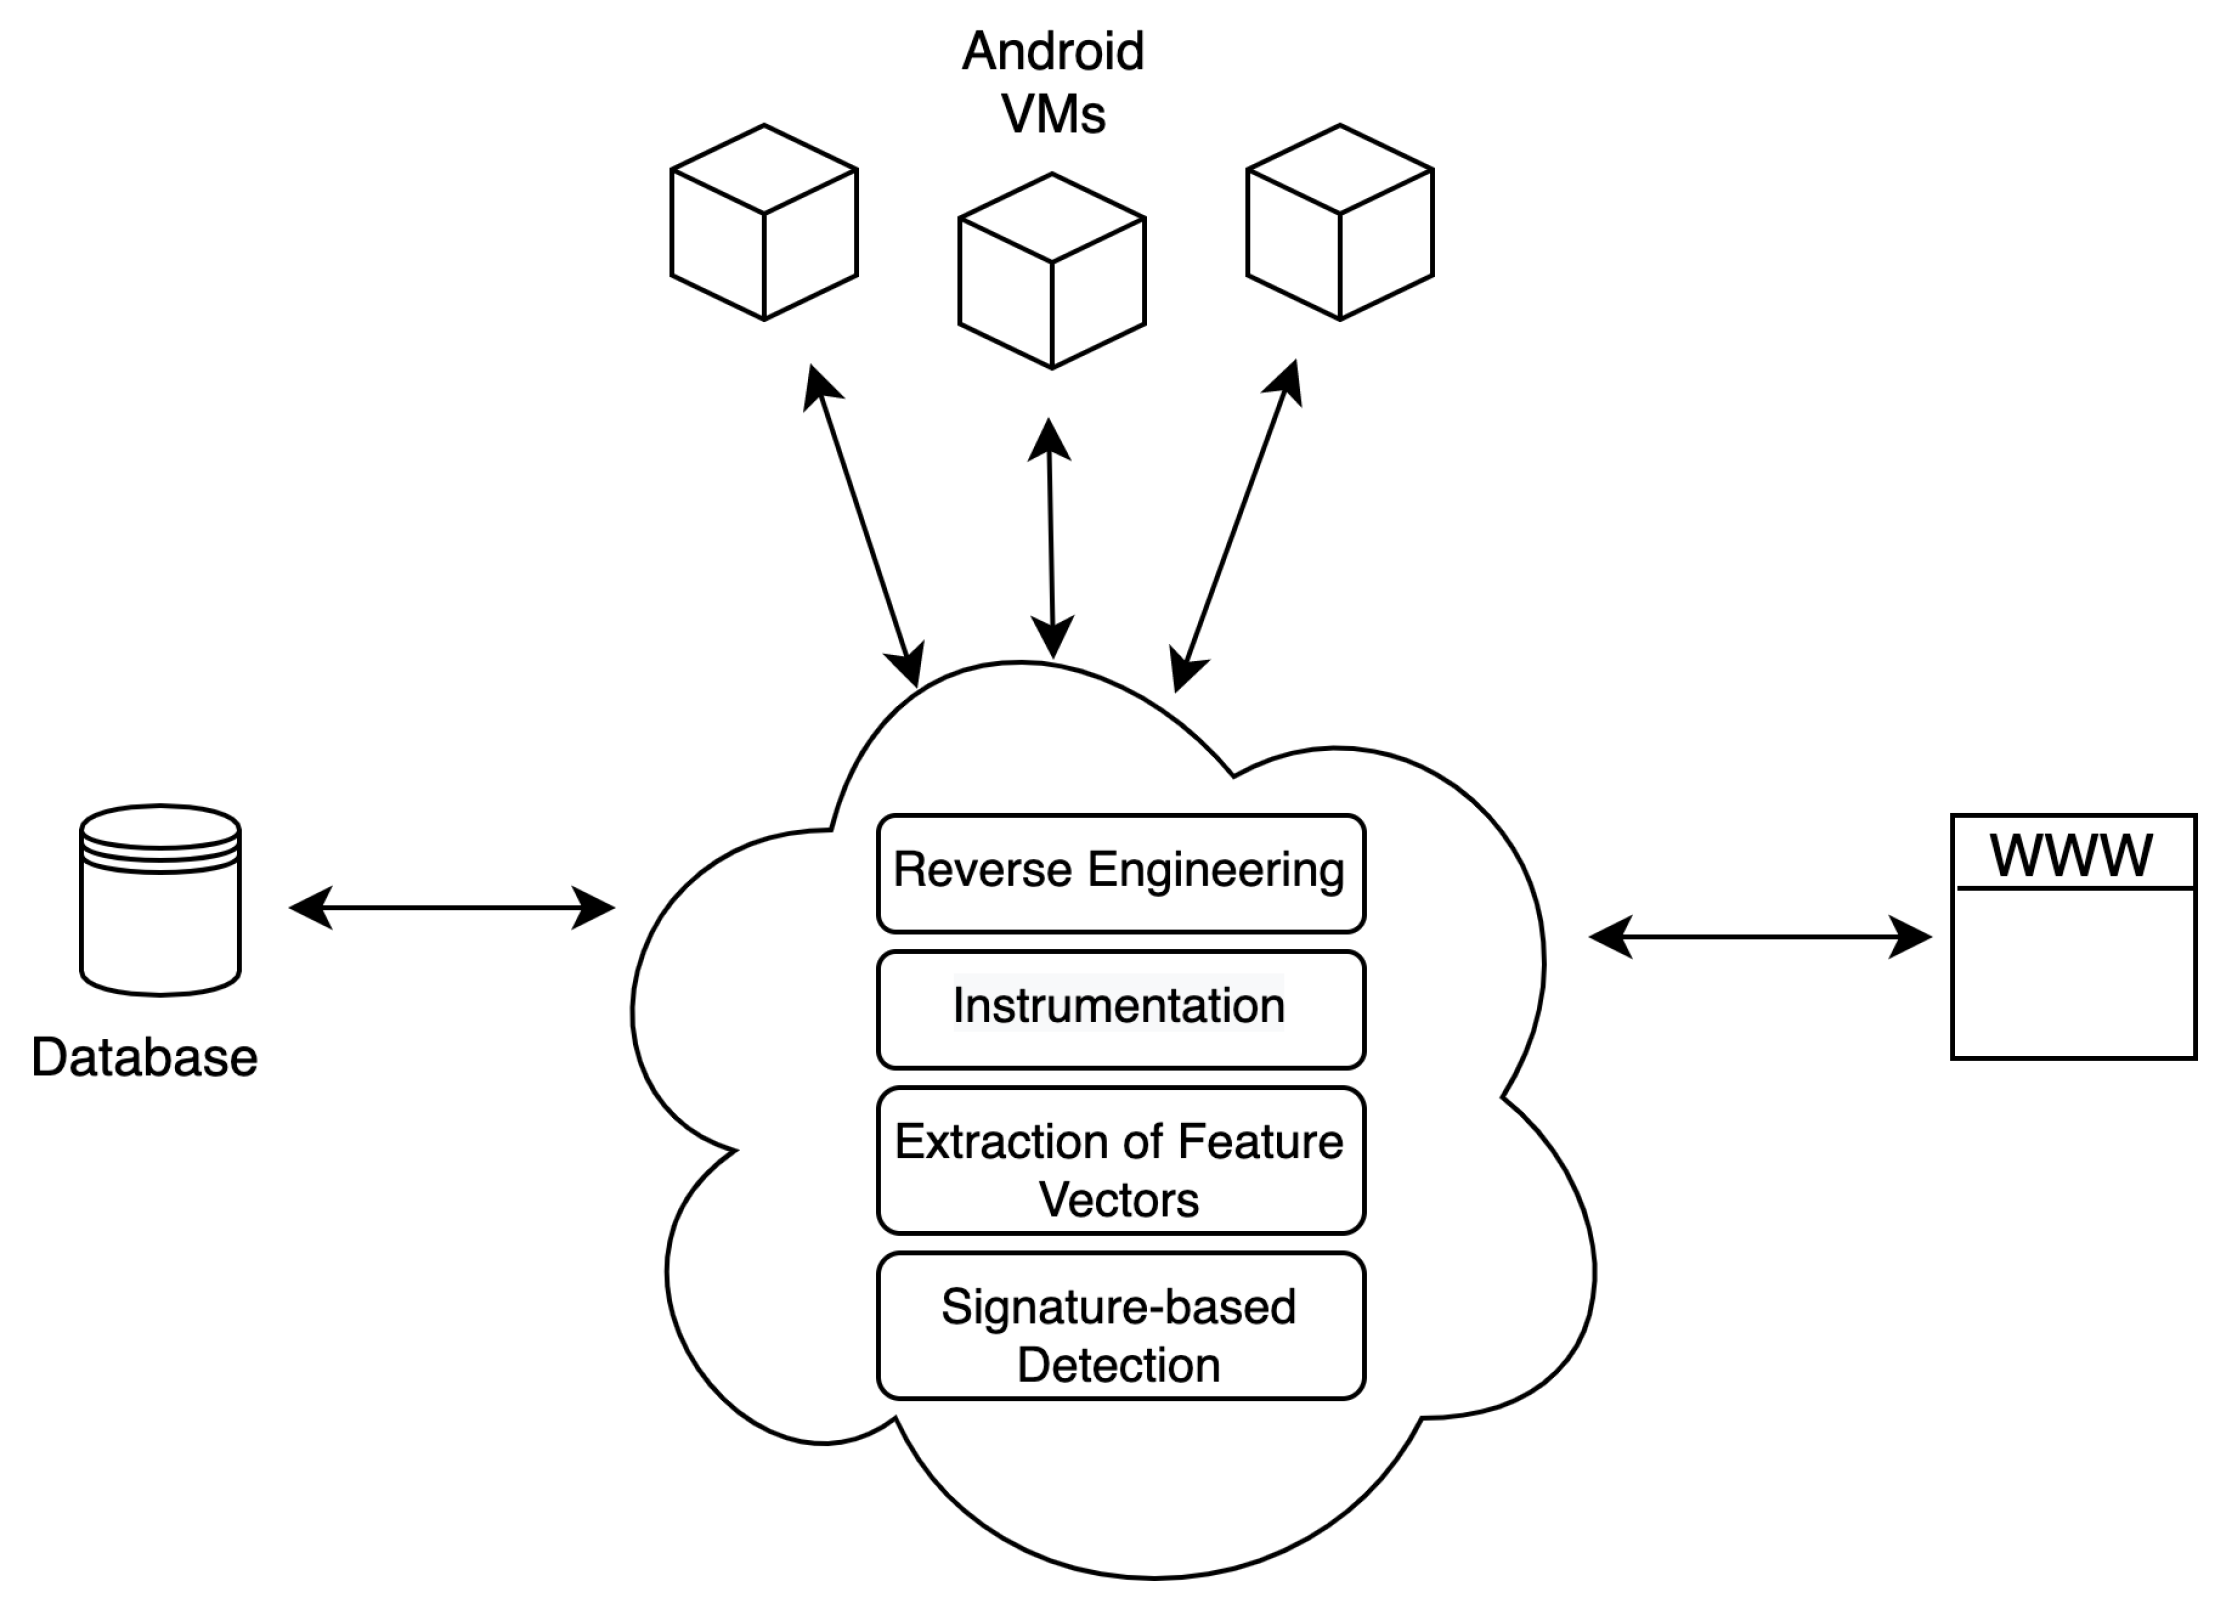
Figure 1 depicts a high-level view of the Androtomist’s architecture. Specifically, Androtomist comprises three basic components, namely virtual machines (VMs), database (DB), and a web app. Each app is installed on a VM running the Android OS. All the features collected during app analysis are stored in the DB. A user is able to interact with Androtomist via the web app.
For the needs of this work, Androtomist runs on a desktop computer equipped with an Intel Core i7-3770K CPU and 8GB of RAM. VirtualBox [
24] is used to create and manage Virtual Machines (VMs). Depending on the user’s preference, a VM running Android ver. 7.1, 8.0 or 9.0 is automatically deployed during an app’s dynamic analysis phase in order to extract its runtime behavior. A VM communicates with Androtomist using ADB [
25], which is a command-line tool that enables communication between an Android device and a computer, and also provides access to a Unix shell. Each time after the installation and testing of an app, the device (VM) is reverted to its original state. This guarantees the best possible comparison results and simultaneously ensures the forensic soundness of the data [
26]. This process can be easily performed automatically when using VMs, and as result, the execution time needed for the whole process is substantially reduced. In the context of this work, VMs running the Android ver. 7.1 were used. The reason for not choosing a newer version is to achieve the maximum possible compatibility across malware samples from each dataset listed in
Section 3.3. Finally, Androtomist is written in .NET Core and its source code is publicly available at Reference [
27] under the European Union Public Licence [
28].
The process of analyzing APK files is simple and does not demand any special knowledge about malware analysis. After the user connects to the Androtomist’s app, they are able to upload the desired APK file in the “files” section. Next, after clicking on the corresponding button, the system initiates the analysis process, which executes in the background. The output per APK file analyzed is available for inspection in the “results” webpage, where there is also an option to export it to a CSV-formatted file. The results webpage incorporates a summary of the app’s malicious features, if any, plus an overall percentage estimation on whether the app is malevolent or not. A detailed output report is also available for download, which contains a substantial amount of data, namely permissions, intents, network traffic, and inter-app communications. Generally, inter-app communication refers to the action of data being passed on to another app using intents during runtime. However, it is noted that inter-app communication cannot always be detected while analyzing one app at a time. Androtomist yields the following types of data:
Data from static analysis: Permissions and intents from the manifest file, API calls retrieved from the smali files.
Data from dynamic analysis by means of instrumentation: Network traffic, inter-app communication, Java classes.
All the above mentioned pieces of data are stored in the DB. The web app offers two types of user menu, “user” and “admin”. The latter is meant only for the expert user and offers advanced functions, such as rebuilding the detection signatures from new datasets (see
Section 4.1), exporting feature vectors to train ML models (see
Section 4.2), and adding users to the app. The former is destined to the novice user, even the non-tech-savvy one, and offers basic functionality, including uploading and analyzing apps, as well as inspecting the analysis results.
3.2. Extraction of Features and Feature Modeling
Under the hood, Androtomist firstly decompiles and scans the app’s APK file to extract information. Secondly, it installs and runs the APK on a VM, while generating pseudorandom user events, including clicks, touches, gestures, as well as a number of system-level events to extract the app’s runtime behavior. In addition, the tool produces vectors of features that can be fed to ML classifiers to assort apps. The internal workings of both static and dynamic analysis phases is schematically shown in
Figure 2.
Precisely, the app’s APK is fed ① to the analysis controller, which first triggers static and then dynamic analysis. During static analysis ②, the APK file is scrutinised to collect static features as detailed further down. During dynamic analysis ③, a VM running the Android OS is loaded, and the APK is installed on it ④. The instrumentation code is injected during runtime ⑤. Moreover, pseudorandom user input events are generated ⑥ and the instrumentation controller logs any information emanated from the triggered events ⑦. The totality of features collected by both static and dynamic analysis are stored in the DB. The following subsections elaborate on each of the aforementioned steps of the analysis process.
Static feature extraction: The APK file is used as input to fetch static features, that is, permissions, intents, and API calls. These features are automatically extracted with the help of reverse engineering techniques. Indicatively, for a 1 Mb, 10 Mb, and 20 Mb app, the overall process takes correspondingly ≈10, ≈16, and ≈19 secs. In greater detail, the main steps are as follows:
Dynamic feature extraction: Androtomist collects a variety of information during app runtime by means of dynamic instrumentation. These pieces of data include the Java classes used, network communication specifics, and inter-app communication details. To do so, Androtomist capitalises on
Frida [
30], a full-fledged free dynamic instrumentation toolkit. Frida is able to hook on any function, inject code into processes, and trace the app’s code without executing any compilation steps or app restarts. In particular, the instrumentation controller illustrated in
Figure 2 feeds ⑦ the instrumentation code along with the app’s package name to Frida during runtime. The instrumentation code hooks on method implementations and alters their operation. Information logged by Frida is forwarded to Androtomist in real-time using ADB. As previously mentioned, all the aforementioned functions are performed automatically. The overall process takes ≈2 min for all apps, independent of their size. Specifically, 1 min is required to load a VM and install the app, and another one is allocated to the generation of ≈1000 pseudorandom user action sequences using the UI/app exerciser Monkey [
31]. The main stages can be summarized as follows:
Start a new VM with a clean image of the Android OS.
Connect the device (VM) with ADB.
Copy the selected APK file in the device (VM) and install it.
Start the instrumentation process using the package name and the instrumentation code.
Generate pseudorandom streams of user events into the app on the VM.
Log the output from the instrumentation process, namely java classes, inter-app communication derived from triggered intents, and any information stemming from network communications, including communication protocols, sockets, IPs, ports, and URLs.
Androtomist allows experienced users to create and import custom Javascript instrumentation code and inject it during dynamic analysis. The code in Listing 1 is a simplified example of such a case and can be applied to log possible intents triggered during runtime. Specifically, the code hooks the constructors of the class android.content.Intent, which is used by Android apps to trigger intents.
Listing 1.
Example of instrumentation code.
Listing 1.
Example of instrumentation code.
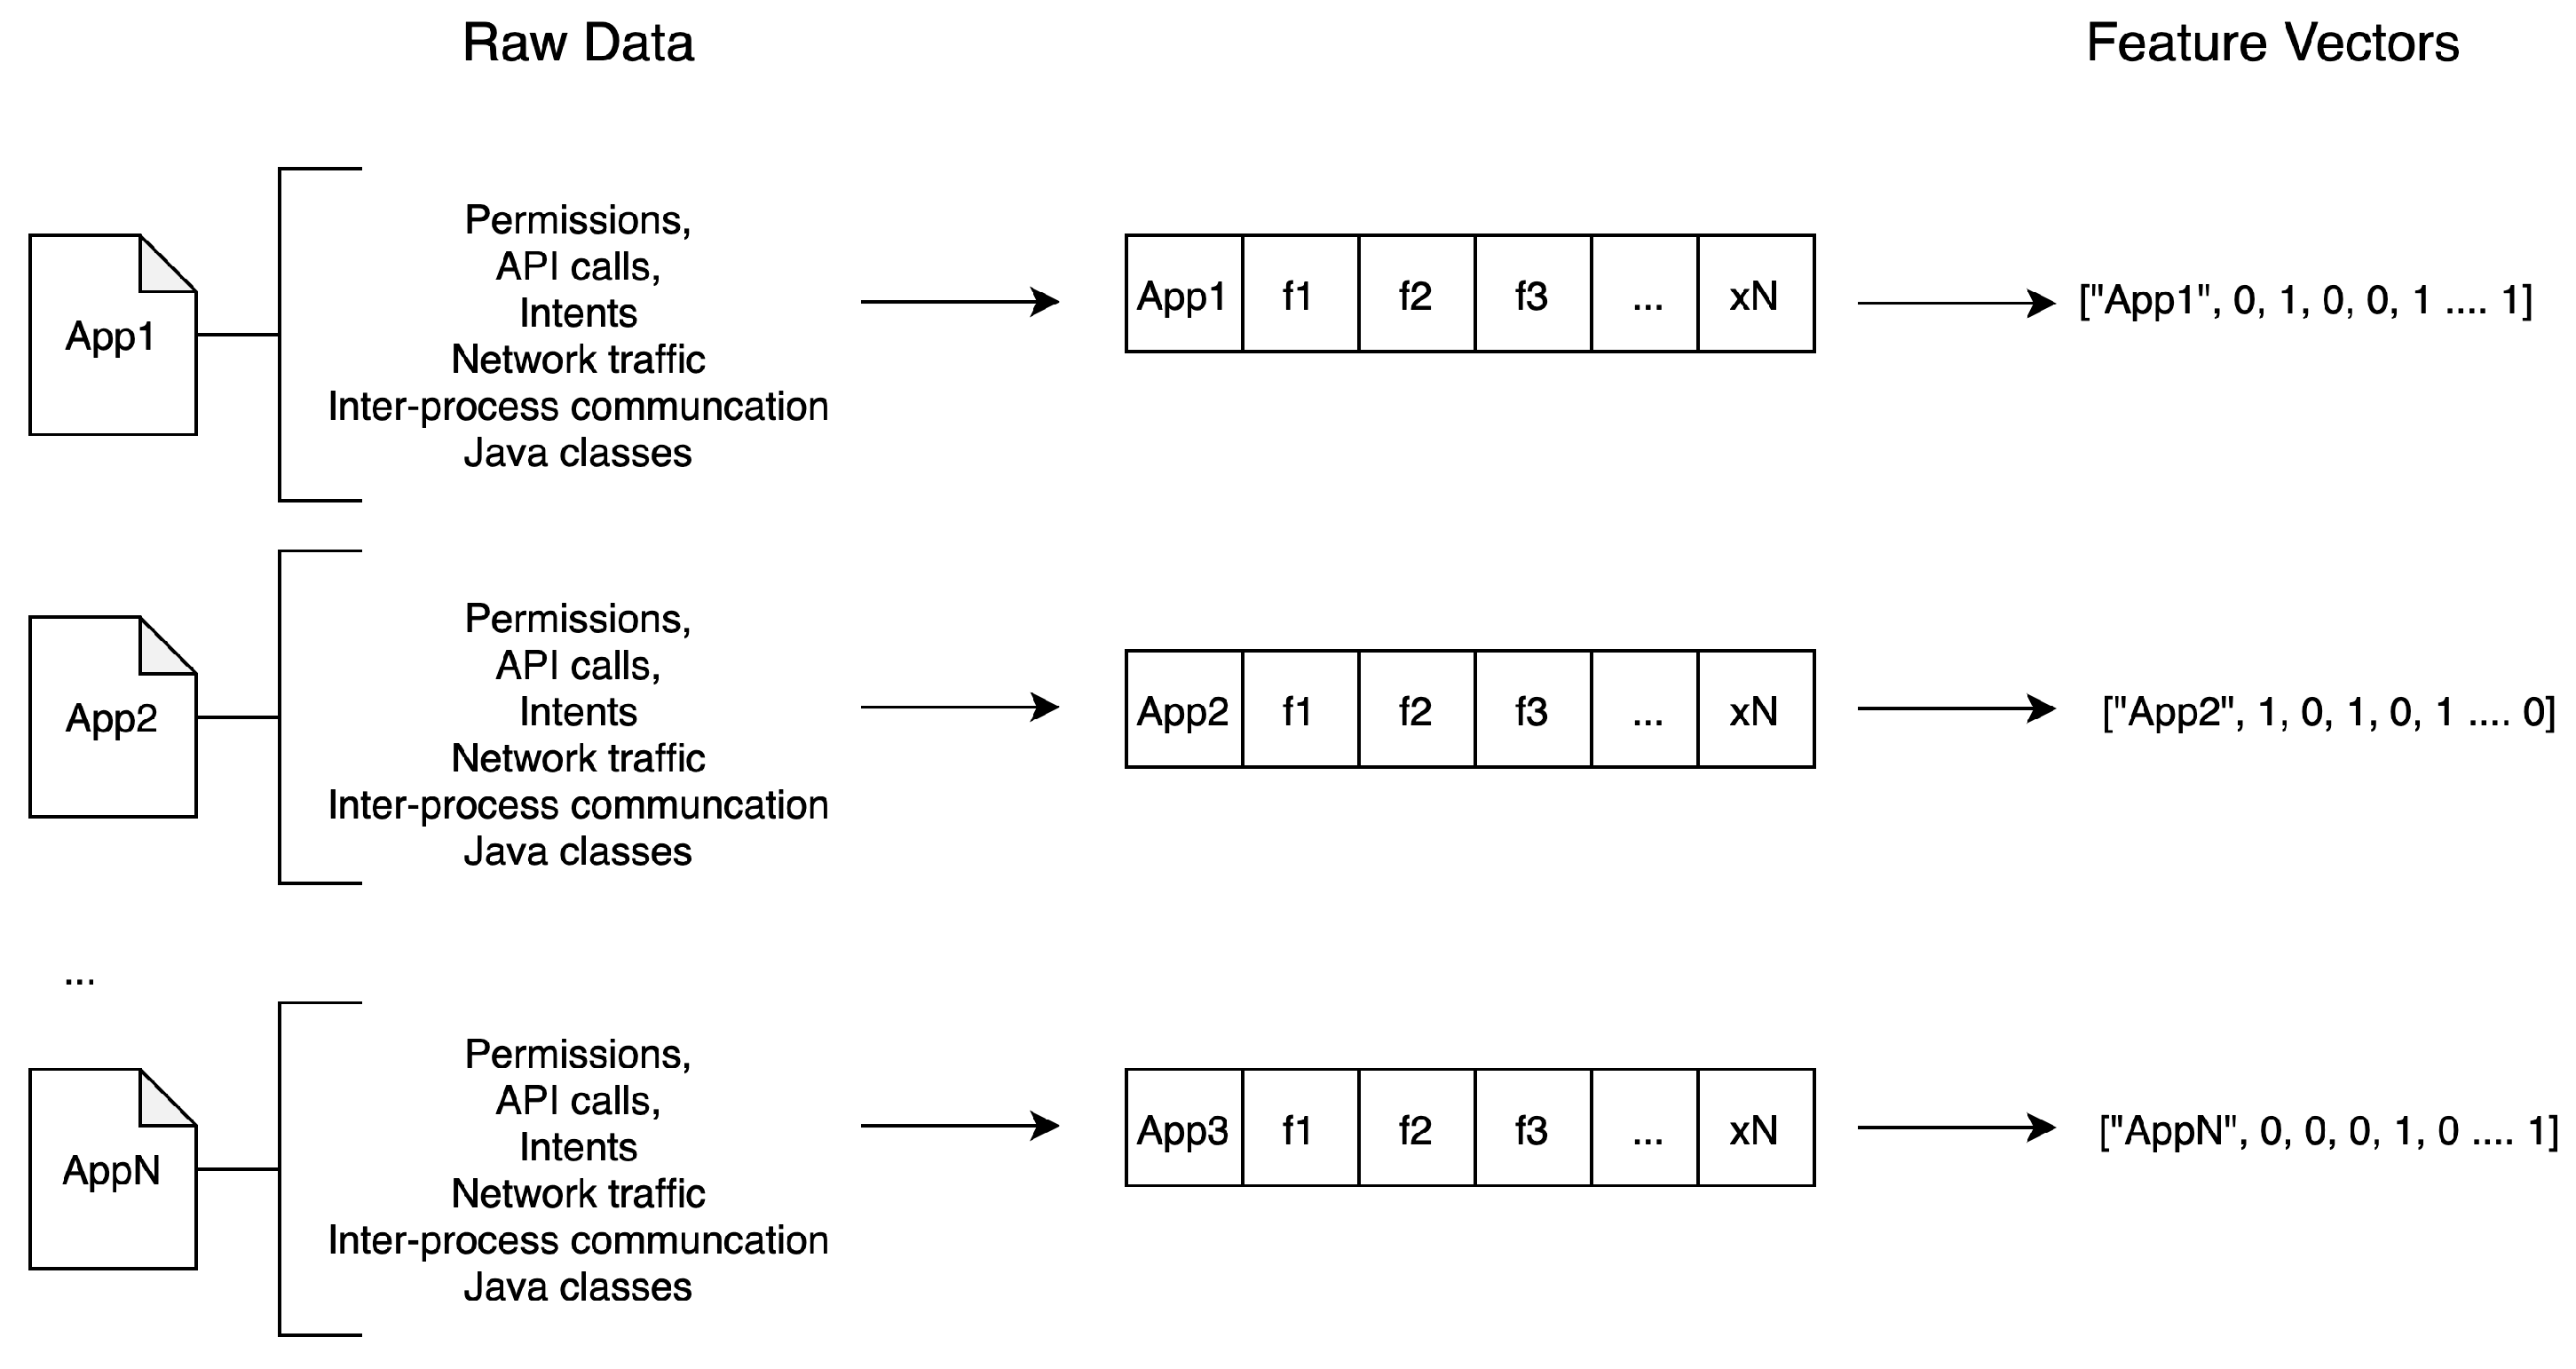
The data collected in the DB can be further analyzed to classify an app as malicious or benign. To this end, as it is illustrated in
Figure 3, the gathered raw data must be first transformed into vectors of features. As already pointed out, the resulting vectors can be exported to a CSV-formatted file and used in the context of any data mining tool.
3.3. Dataset
In the context of mobile malware detection, several datasets were built to cover manifold and exceptionally demanding malicious cases. These corpora of malware samples are considered as benchmark datasets for evaluating novel schemes that attempt to distinguish between malware and goodware samples. Initially, this work employed three well-known datasets used extensively in the related literature; the full Drebin dataset [
3] dated from 2010 to 2012, a collection (subset) from VirusShare [
32] dated from 2014 to 2017, as well as a collection from Androzoo [
33] dated from 2017 to 2020. Precisely, the number of malware samples taken from each of the aforementioned datasets was correspondingly 5560, 10,000, and 1520, that is, a total of 17,080 samples. It is important to note that the Drebin dataset contains outdated samples, and therefore, these pieces of malware were only used to cross-validate our results vis-à-vis the related work. On the other hand, Androzoo samples are expected to be more challenging when it comes to detection, given that this corpus contains newer, and therefore more sophisticated malware in comparison to those in the Drebin and VirusShare datasets.
After analysing 17,080 mobile malware samples from the three datasets, a total of more than 50,000 different vectors of features were collected. Note that each vector is a binary representation of each distinct feature. Let us for example take the simplest case of just two apps. App A1 uses permission A, intent B, and initiates communication via HTTP with IP: 1.1.1.1. App A2 on the other hand, uses permission B, intent C, and triggers communication via HTTPS with IP: 1.1.1.2. As a result, as shown in
Table 2, the vectors of features for both app A1 and app A2 have twice as many binary indicators. Of course, a real-world app would produce a much more lengthy vector.
Naturally, putting aside the capacity of the data mining tool, the overall number of 50,000 different vectors, meaning 50,000 diverse columns (features), exceeds the ability of Androtomist and virtually and proof-of-concept tool to fetch them in a reasonable time using SQL queries. So, for the needs of our experiments in
Section 4.2, a smaller subset of 100 or 120 malware samples per dataset was finally used. Specifically, we randomly selected 100 malware samples from each of the Drebin and VirusShare datasets and 120 from—the more challenging—AndroZoo. This sample reduction technique is also observed in previous work, including those in References [
11,
15,
18]. Specifically, common malware families can produce overestimated results. Therefore, we filtered commonplace information among malware families, such as sample year and package name from each dataset, for the sake of obtaining equally distributed samples across the different malware families. It is important to mention that all the three (reduced) datasets are balanced, containing an equal number of randomly selected malicious and benign apps. The benign apps were collected from Google Play Store [
34] and are common across all the three datasets but the AndroZoo, which incorporates 20 more.
3.4. Classifiers and Metrics
The vast majority of the state-of-the-art methods focused on the detection of malicious samples were ranked based on recall and precision of correct answers combined by the F1 measure. For each instance separately, these measures of correctness are concentrated on providing a binary answer, either a positive (malware class) or a negative (goodware class) one. This indicates that the information about the distribution of positive and negative instances is necessary in order to set this threshold. In this paper, we follow exactly the same evaluation procedure to achieve compatibility of comparison with previously reported results. For each dataset, the set of the extracted scores based on the test instances are normalized in the interval of [0,1] per classification model per examined method. To this direction, the estimation of the threshold is set equal to 0.5.
Moreover, we use the AUC of the receiver-operating characteristic curve as the main evaluation measure [
35]. Generally, AUC quantifies the effectiveness of each examined approach for all possible score thresholds. As a rule, the value of AUC is extracted by examining the ranking of scores rather than their exact values produced when a method is applied to a dataset. Noticeably, the estimation of the AUC measure is based on all possible thresholds. Besides, this evaluation measure does not depend on the distribution of positive and negative samples.
In this paper, a sizable number of well-known and popular supervised ML algorithms are applied. That is, for each dataset, we consider seven of the most widely used binary classification models, namely Logistic Regression (LR), Naïve Bayes, Random Forest, AdaBoost, Support-vector machine (SVM), k-nearest neighbors (k-NN) and Stochastic Gradient Descent (SGD). The majority of the classification algorithms applied falls under eager learning. In this category, supervised learning algorithms attempt to build a general model of the malicious instances, based on the training data. Obviously, the performance of such classifiers strongly depends on the size, quality and representative of the training data. On the other hand, k-NN is a weak learner (known as lazy learner) as that is not using the training data to construct a general model, but it makes a decision based on information extracted for each sample separately. For each classifier applied, the default values of the parameter settings are used. The general model of each eager classifier is built following the 10-fold cross-validation technique. In this technique, the original dataset is randomly partitioned into 10 equal sized sub-datasets. A single sub-dataset is retained for the testing, while the remaining 9 are used for training. This process is repeated 10 times, and each time using a different sub-dataset for testing. Taking into consideration that a set of 100 samples are handled in each of the three examined datasets, a percent of 90% is used as training and 10% as test set per time. The results are then averaged to produce a single estimation.
Finally, for each dataset, a simple meta-model, that is, an aggregate function, is developed combining all the base classifiers applied either in hybrid or static methods separately. This heterogeneous ensemble is based on the average score resulted by all seven binary classification models for each sample. Regarding the Android malware literature, “ensemble learning” is also exploited by the authors of References [
36,
37].
5. Discussion
Regarding signature-based detection, the scores in
Table 5 suggest that when static analysis is combined with dynamic instrumentation into a hybrid approach, the detection rate can be augmented by at least 3% and up to 7.5%. Another salient observation is that the classification performance differs significantly among the three datasets. Specifically, as observed from the same Table, the detection rate vary considerably from 87% to 96% for static analysis, but this divergence is much lesser, from 94% to 99%, for the hybrid scheme. This also support the view that hybrid analysis by means of dynamic instrumentation leads to more robust classification results. Particularly, the detection rate for—the more challenging—AndroZoo dataset, is the lowest among all scores when using only static analysis, but it augments by +7.5% when is backed up by the results of dynamic instrumentation. The same observation stands true for the VirusShare or Drebin datasets. This results actually do not come as a surprise, and is verified by relevant works in the literature [
41].
The same general inference is deduced from
Table 6 with respect to the results obtained from anomaly-based detection. That is, in their vast majority, the scores regarding the most two important classification performance metrics, namely AUC and F1, are superior when hybrid analysis is involved, irrespective of the dataset and the ML classifier used.
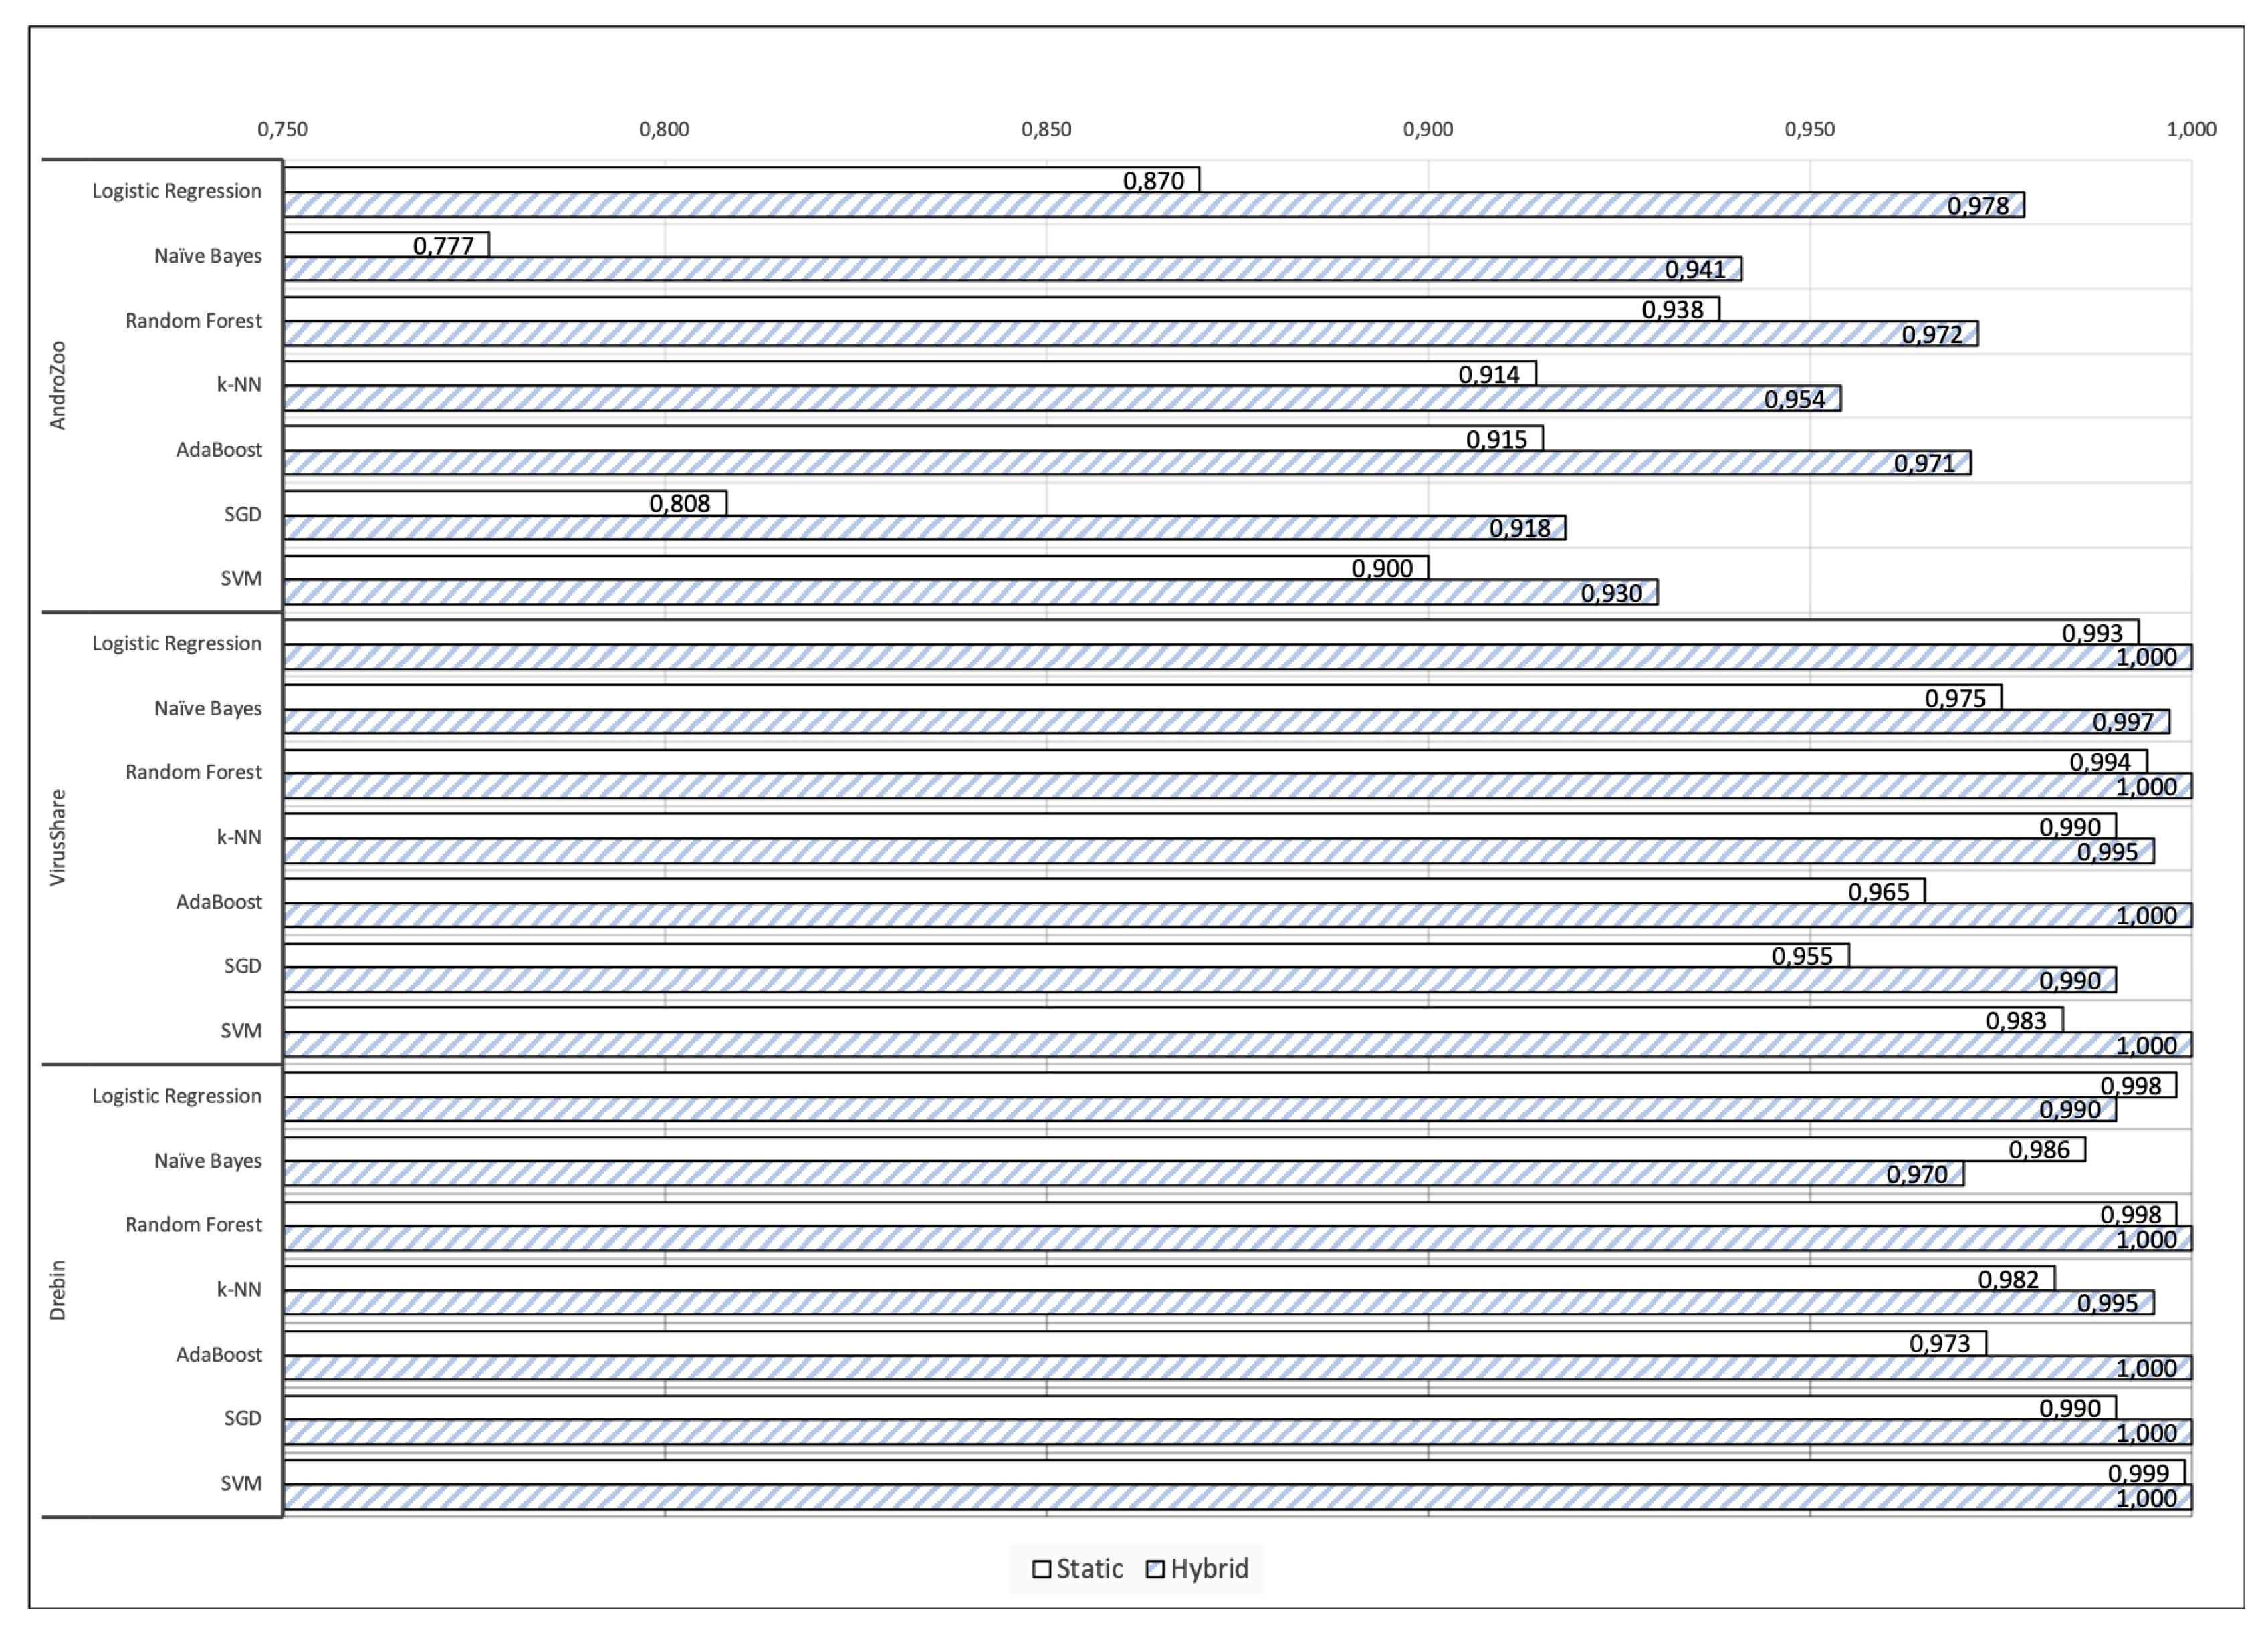
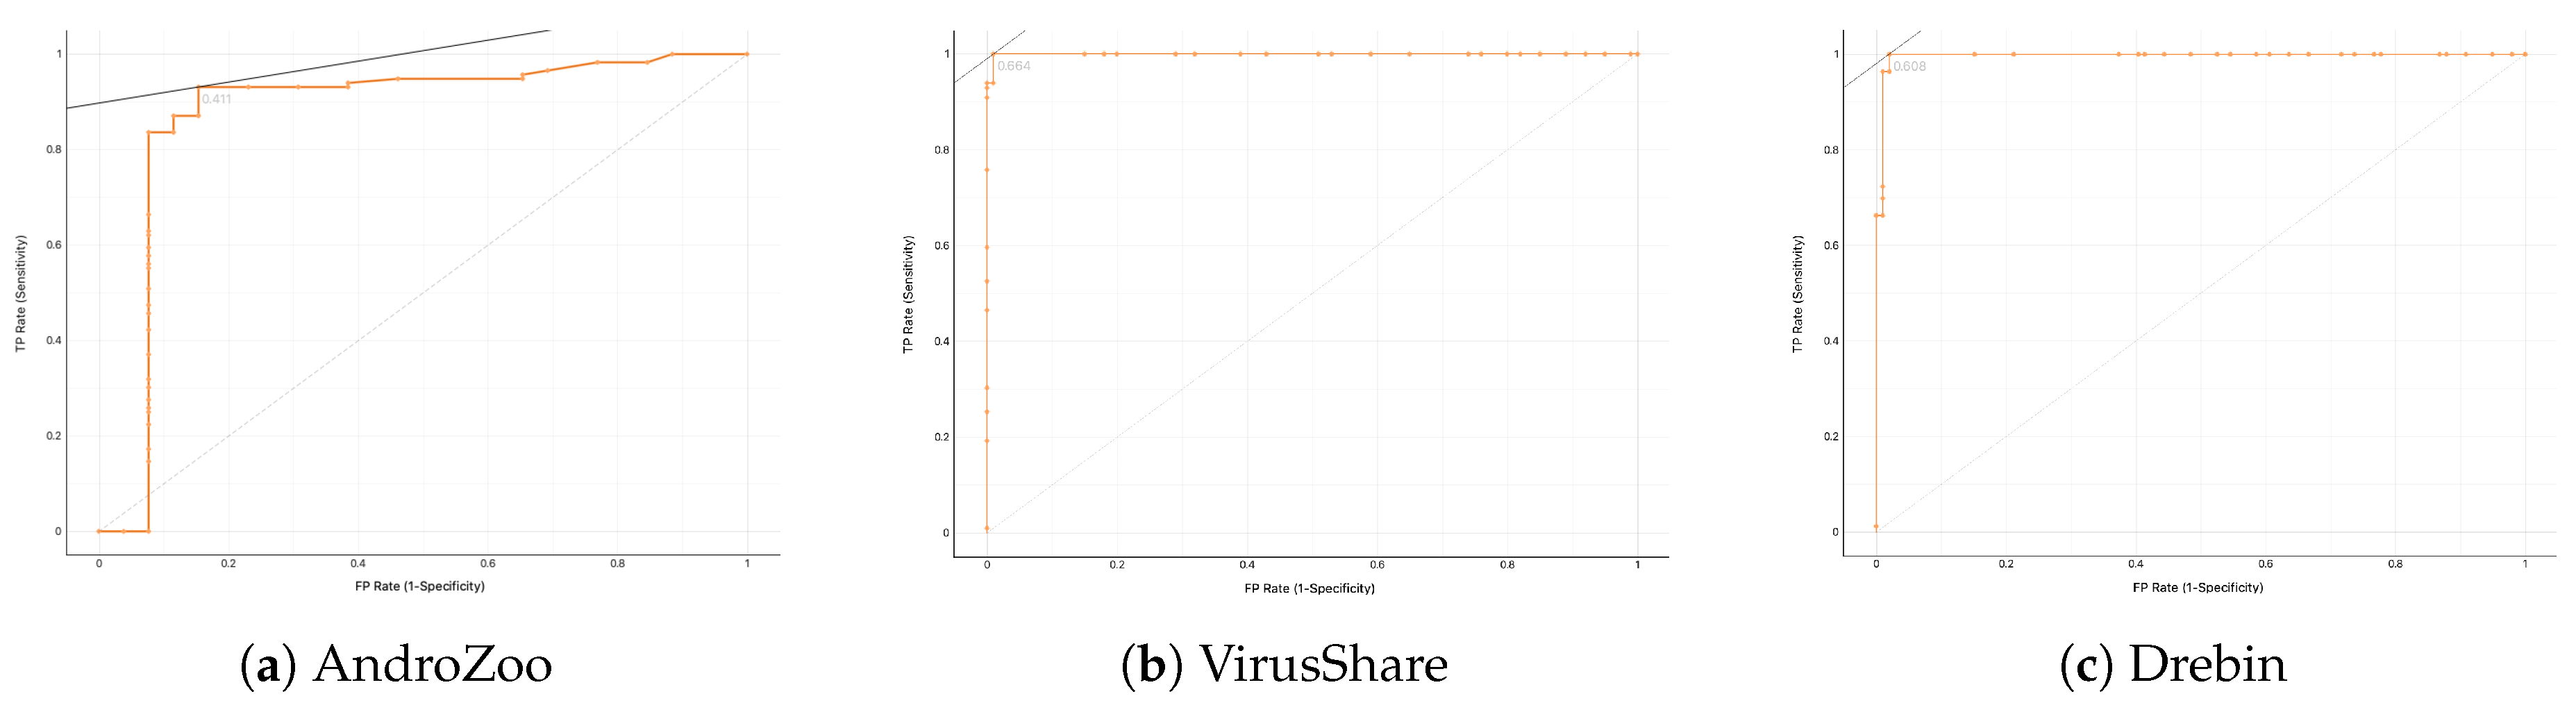
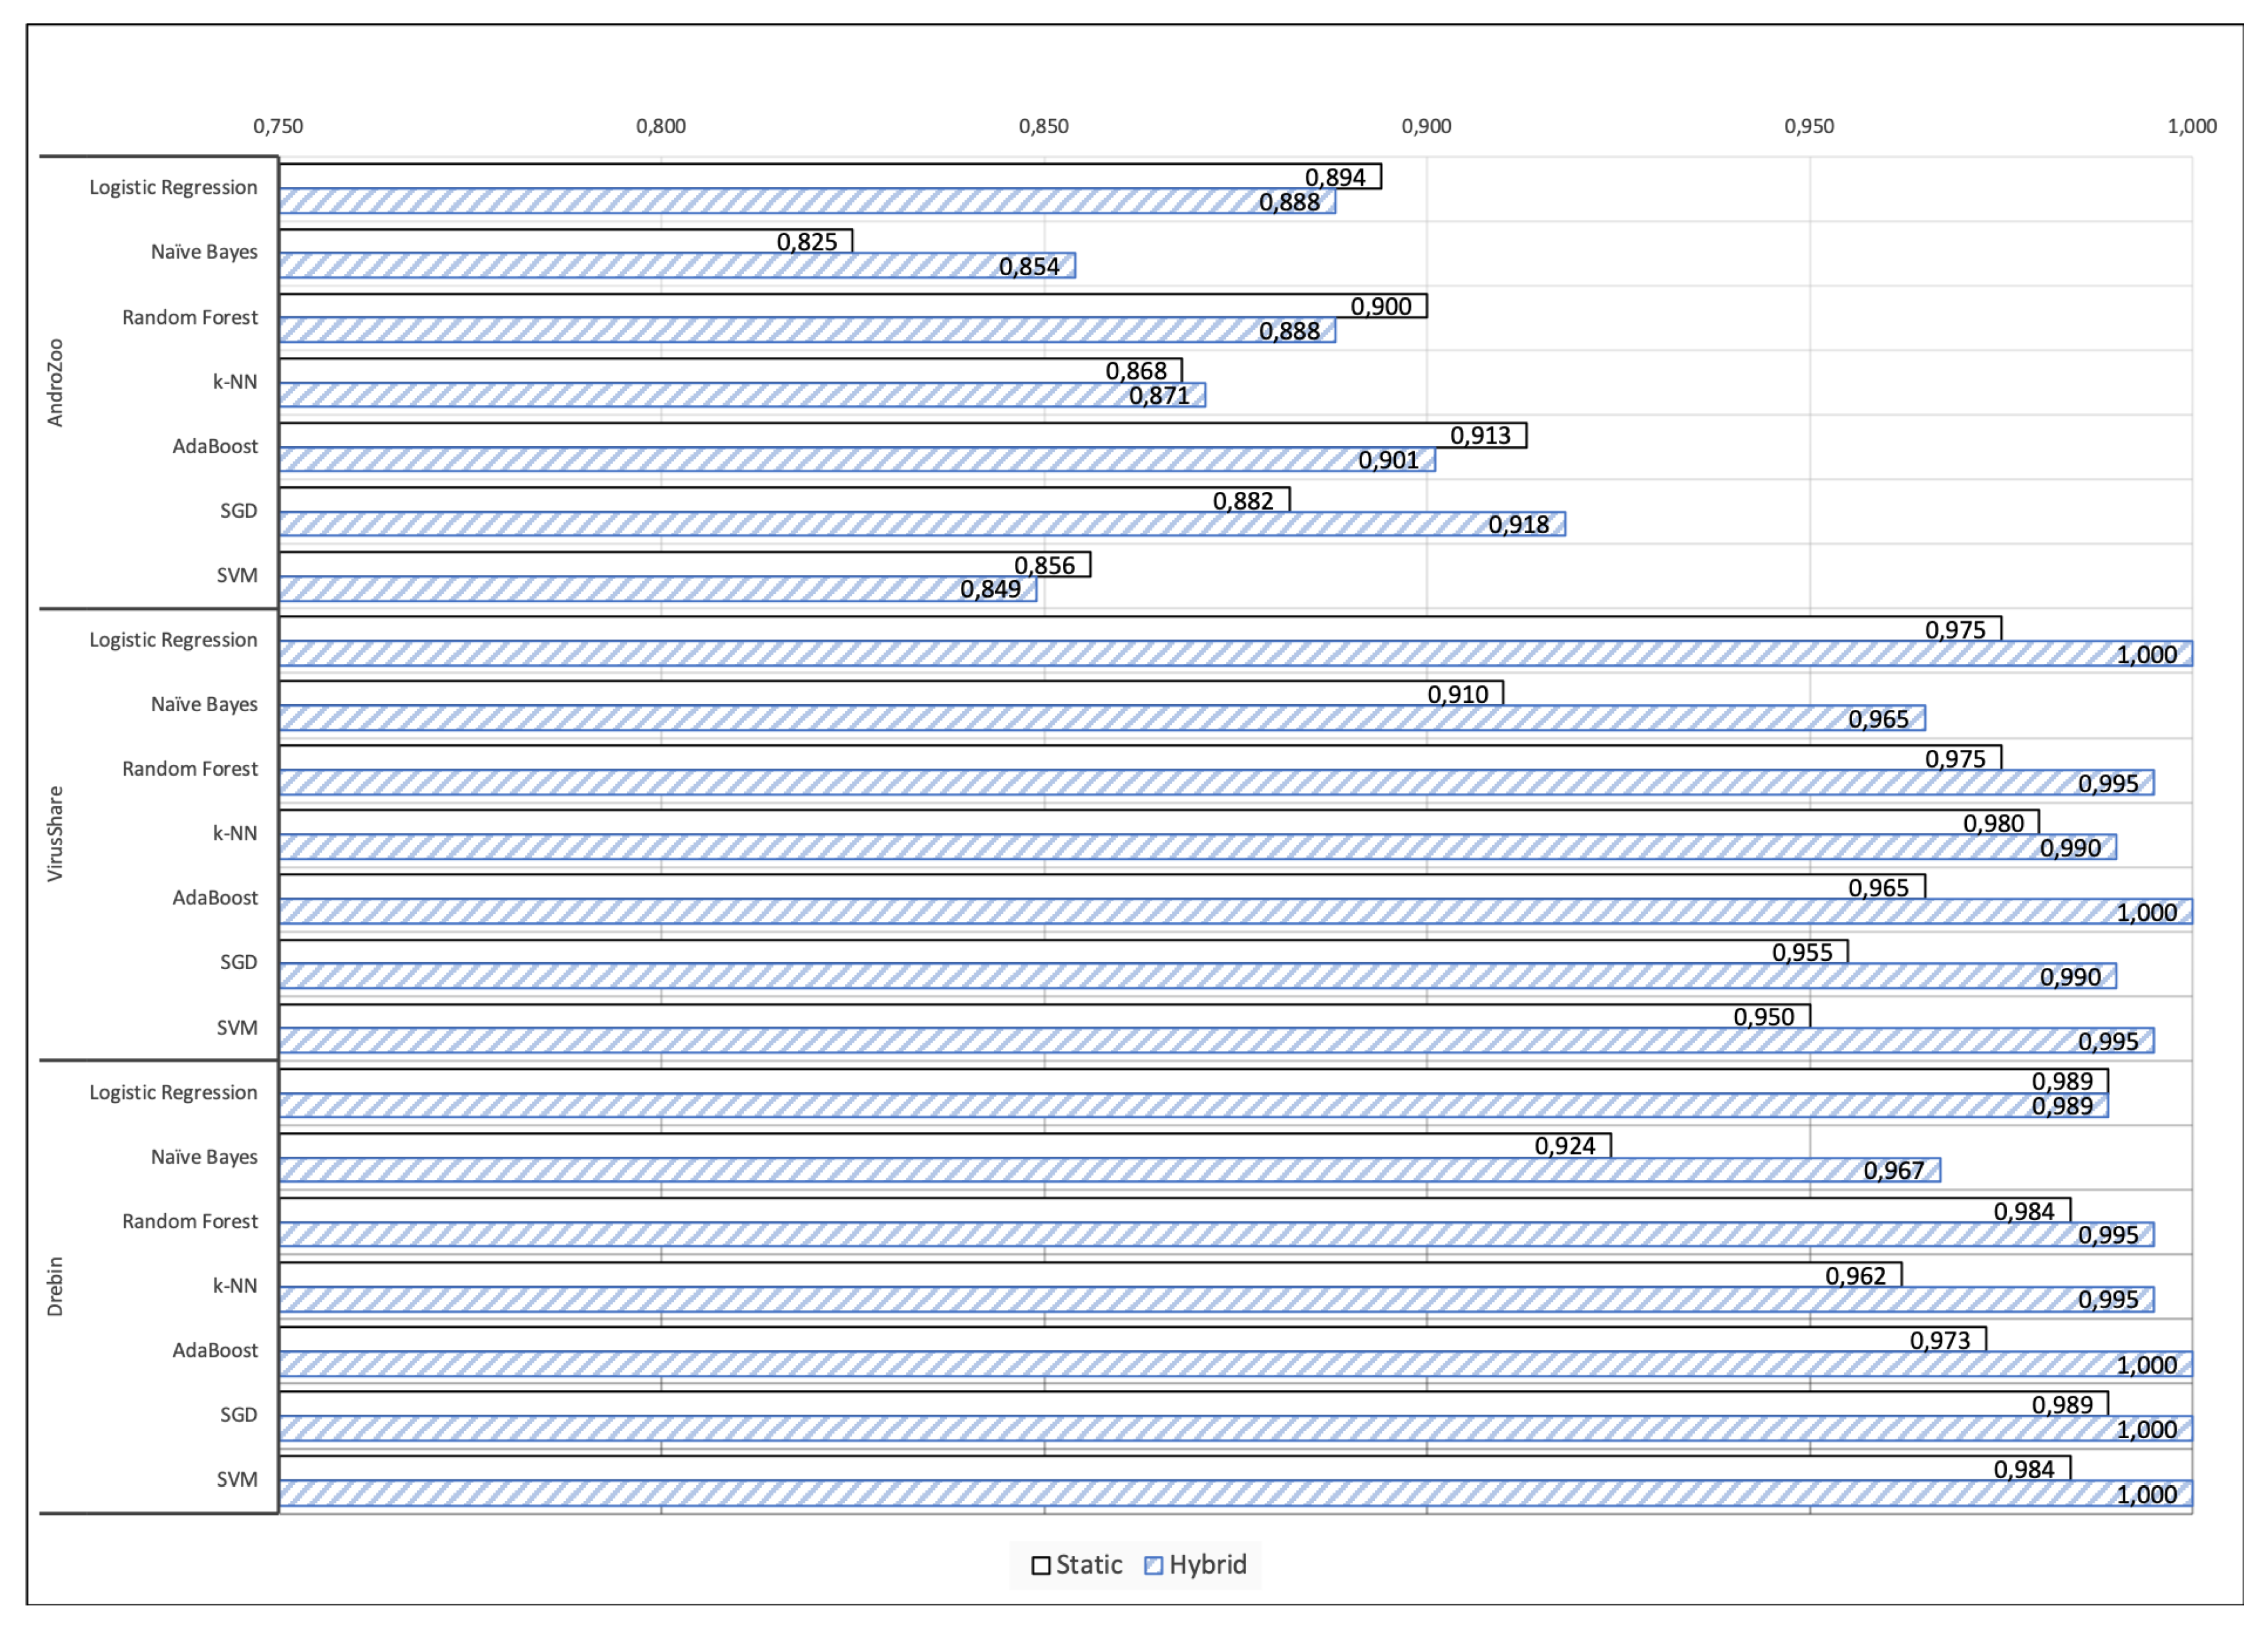
To further demonstrate the usefulness of the examined approaches,
Figure 4 depicts the evaluation results (AUC) of hybrid and static analysis in the employed datasets when applying the seven classifiers. As can be clearly seen, the basic patterns are the same across all the datasets. The proposed hybrid method is more effective, surpassing the approach based on static analysis in almost all cases. As already pointed out in
Section 4.2, the only exceptions are LR and Naïve bays in the Drebin dataset. In both VirusShare and Drebin corpora, the static method is also very effective in all cases.
With respect to the results on AndroZoo corpora, the results suggest that the use of hybrid analysis helps the approach to become more stable. As can be seen, the proposed hybrid approach outperforms in all cases the static method, by a large margin (more than 10%). Recall from
Section 3.3 that the AndroZoo dataset embraces newer instances of malware in contrast to VirusShare and Drebin ones. It seems therefore that this challenging condition significantly affects the performance of static models. The same patterns are provided in case where F1 measure is considered as it is illustrated in
Figure A3 in the
Appendix A.
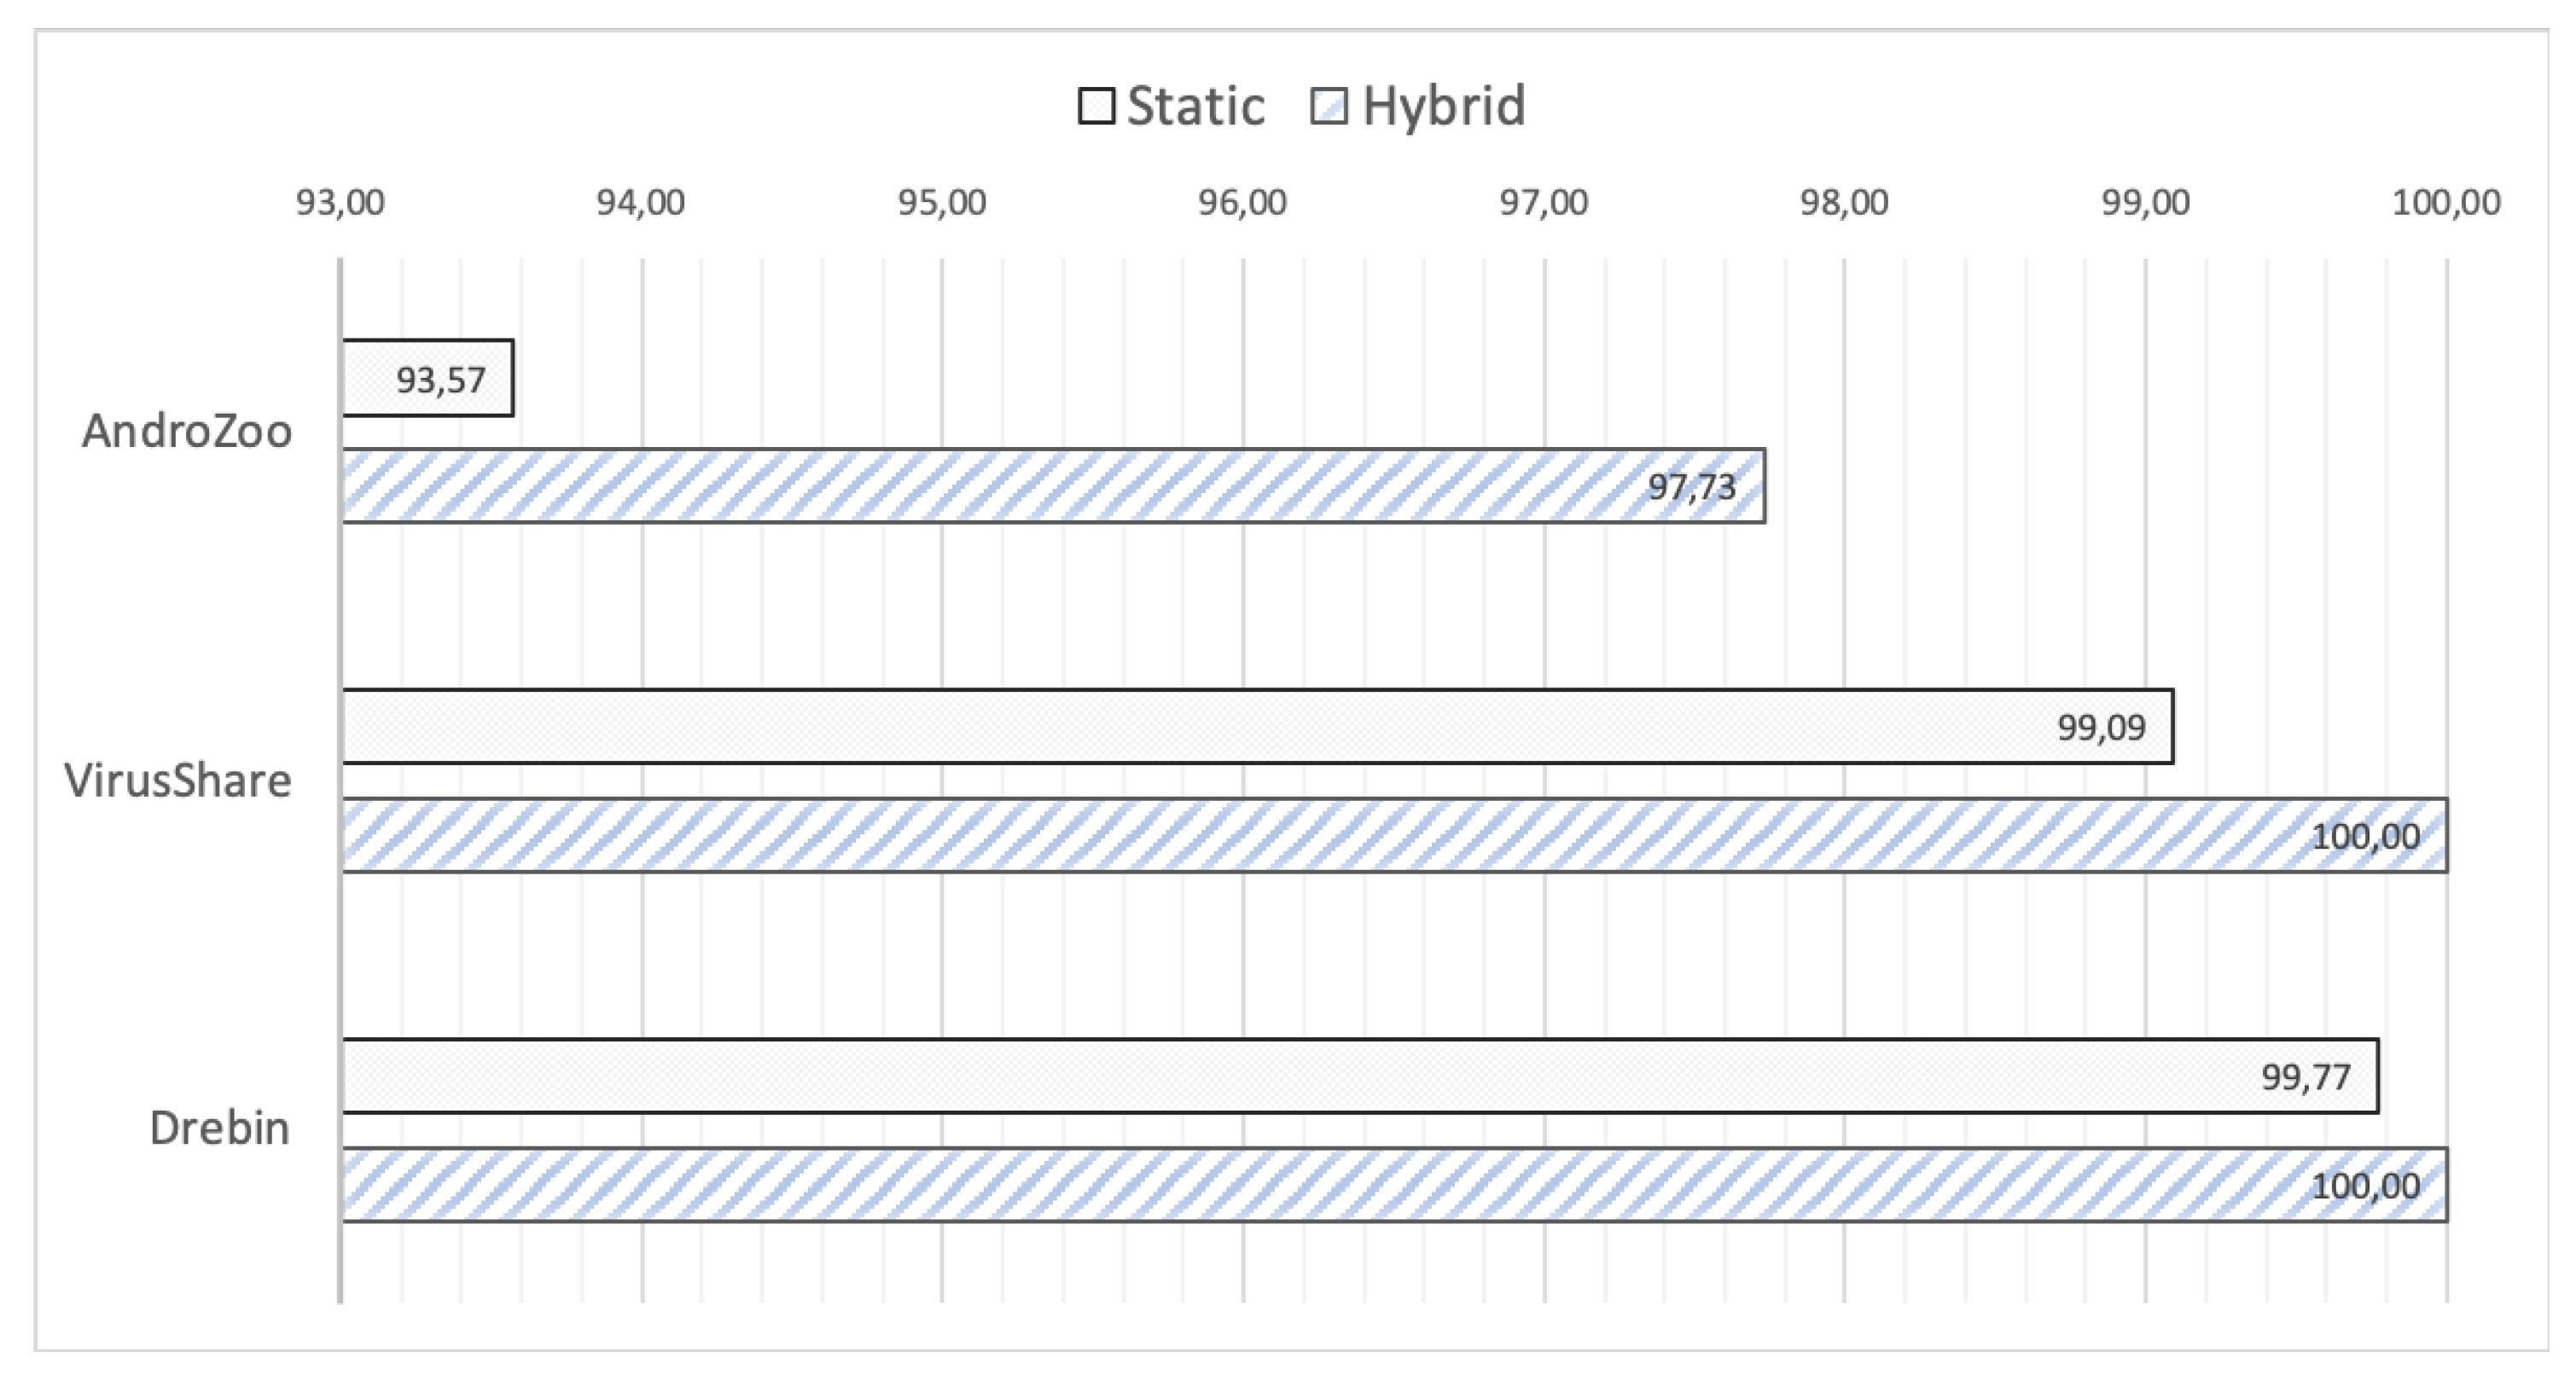
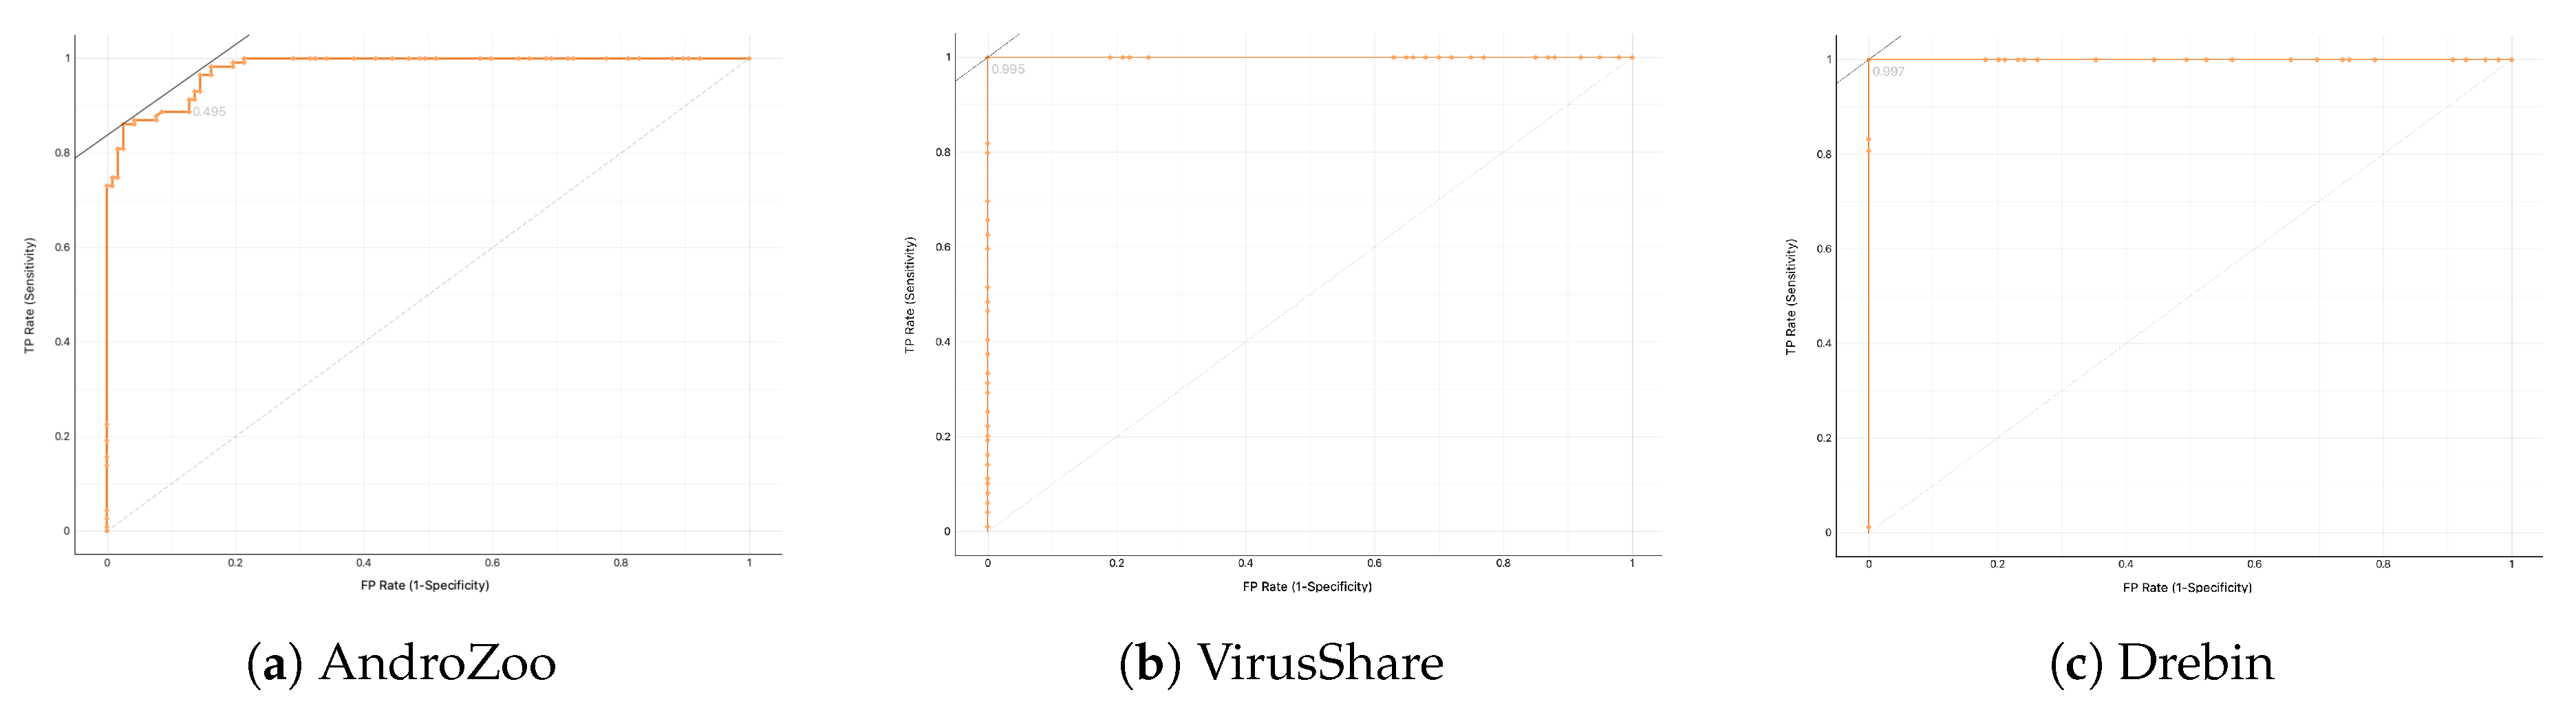
In addition, we also consider the combination of the base classification models (seven classifiers) by averaging their answers per sample on each dataset separately.
Figure 5 demonstrates the percentage in performance (AUC) of both these ensemble methods based on the hybrid and static analysis, respectively. Especially, vis-à-vis the results of
Table 6, the effectiveness of both the ensemble approaches in terms of AUC, is better than that of any single base classifier in the vast majority of the cases. Although, the version of static analysis is effective enough, the version based on hybrid analysis consistently outperforms its performance. Overall, as can be observed, the proposed hybrid ensemble is the most effective one surpassing that of static analysis and improving the reported results of all base classifiers across all the three datasets considered. With respect to the results on AndroZoo corpora, the proposed hybrid ensemble clearly seems to be the top-performing model which achieves the best results not only among all base models, but also in comparison with the static one. The improvement in average performance of the hybrid ensemble model with respect to that of the static is higher than 4%.
Table 7 demonstrates the improvement in performance, that is, difference of AUC scores, of the individual and ensemble models when the hybrid analysis is considered in comparison to the case where only the static one is used. Statistical significance of these differences is estimated using an approximate randomization test [
42]. The null hypothesis is that there is no difference between the two cases and we reject this hypothesis when
p < 0.05. As can be seen, in most of the cases, the models extracted from the hybrid analysis are significantly (
p < 0.05) better than static ones. Notable exception is Naïve Bayes on Derbin dataset where the variance with the corresponding static model is slightly decreased. In AndroZoo dataset, all hybrid base models are more improved than the corresponding static ones as well as the hybrid ensemble model gains more than the static one. This indicates that hybrid analysis is superior, able to handle challenging datasets and better suits more sophisticated malware.
On the other hand, the differences between the hybrid and static ensembles are not statistically significant on the VirusShare and Drebin data sets. As concerns the individual models, in the first corpus, the results of Naïve Bayes, AdaBoost and SGD are improved the most, while in the latter only the difference in results of k-NN and SGD models appears to be significant.The betterment of base models based on static analysis seems not to be correlated with the relative increase in the number of malware samples used to extract the static classification models. Apparently, an increasing number of malware instances on AndroZoo corpus does not help Static analysis to achieve better performance.
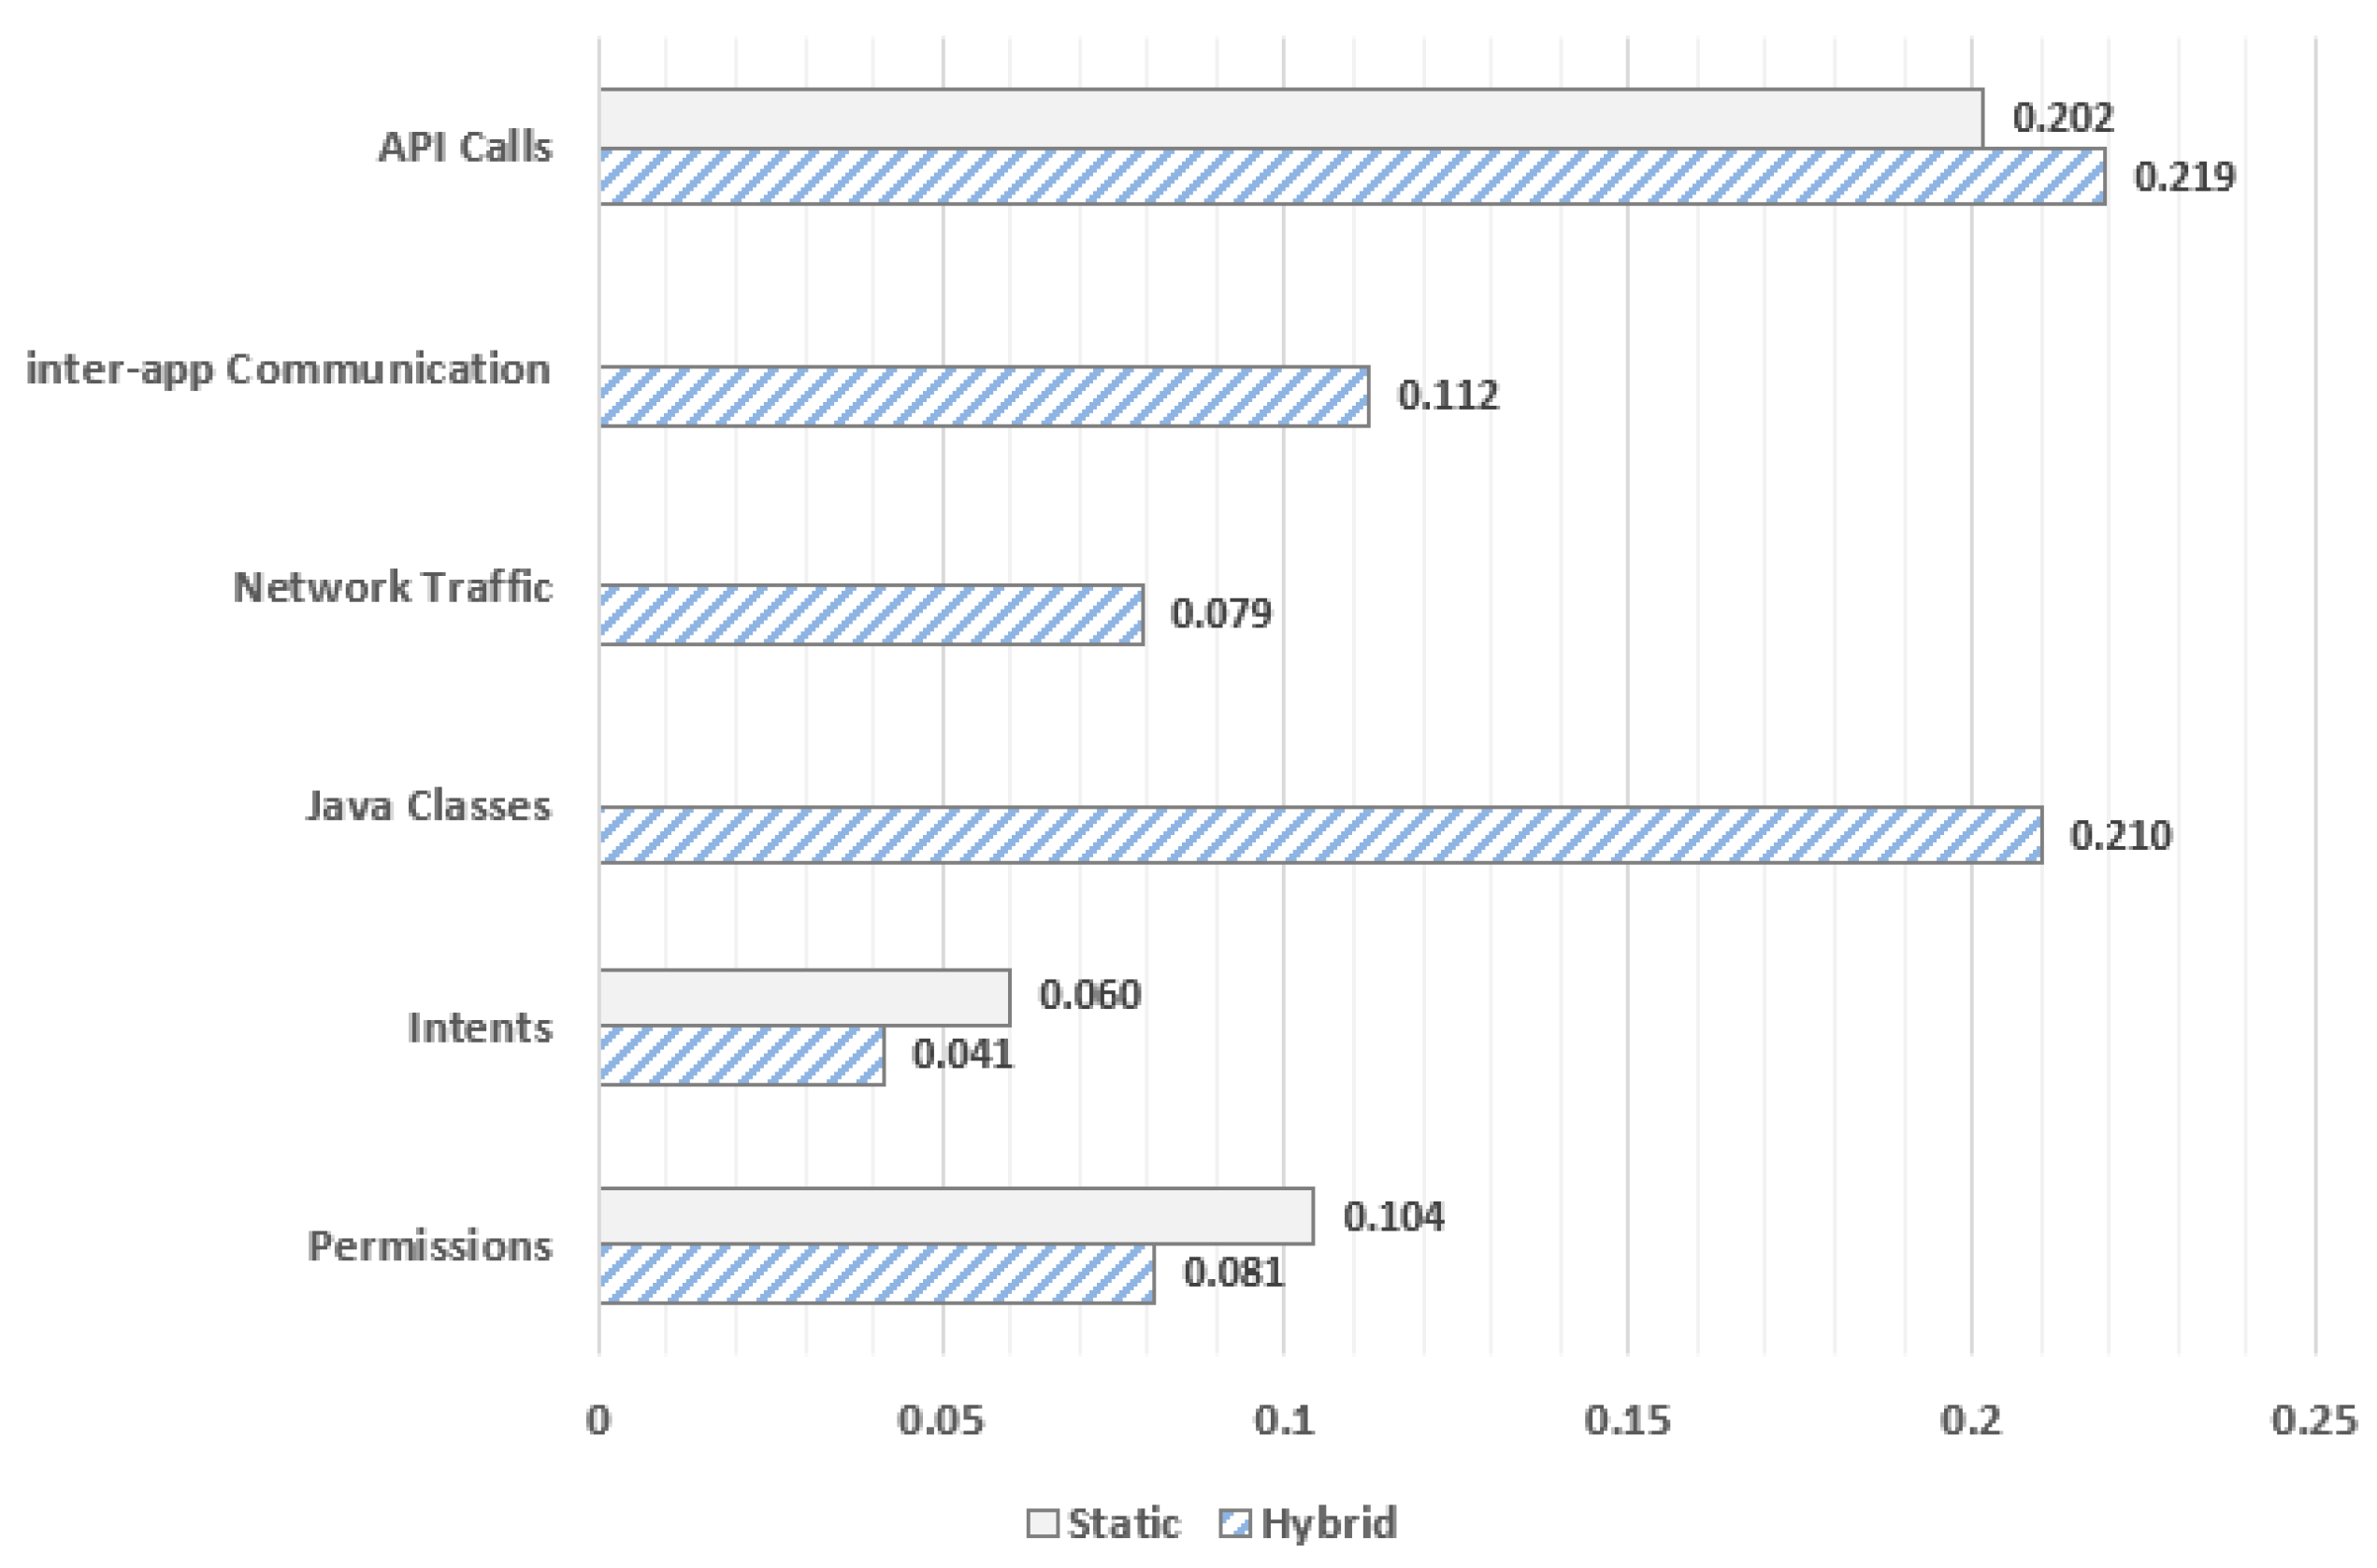
A key factor that affects the performance of malware detection methods is the importance of features contained in malware samples. To study which feature matters more for detecting malware in both the static and hybrid method, we concentrate on the Logistic Regression model, which according to
Table 6, seems to be the top performer across all datasets. To this end,
Figure 6 illustrates the average feature importance scores on all three datasets when Logistic Regression is applied for both hybrid and static method. As feature importance scores have been directly used the average coefficients of each feature category explored following a linear regression algorithm. More specifically, the features importance scores are assigned by coefficients calculated as part of a linear regression model per set of features.
As already mentioned, six categories of features are explored in total; permissions, intents, API calls, network traffic, inter-app communication and Java classes, where only the first three apply to static analysis. In general, from
Figure 6 it is observed that the API calls category is more influential and tends to improve both static and hybrid methods. It is also noteworthy that the category of Java classes achieves also significantly high average importance scores enhancing the effectiveness of hybrid method on all three datasets. On the other hand, the contribution of both intents and permissions categories is lower not only in static, but also in hybrid method. Lastly, network traffic is a category that includes features with slightly better coefficients than intents and permissions categories when hybrid analysis is considered. The case of inter-app communication category seems also to be of particular importance for hybrid method. However, its average coefficient scores similar to intents and permissions categories are significantly smaller than those of both API calls and Java classes categories on hybrid approach.
For the sake of completeness,
Table 8 provides a comparison of the best-case accuracy performance between Bridemaid [
13], HADM [
14], SAMADroid [
16], Surendran et al. [
20], and Androtomist. The comparison reveals that in all the applicable cases Androtomist is able to improve the best results per matching dataset. Precisely, Androtomist surpasses the rest of the state-of-the-art detection systems when using malware from the Drebin or VirusShare datasets. A direct comparison with Bridemaid is not feasible because this system was evaluated using a mixture of malware samples from different datasets, that is,
Genome, which is not shared anymore, and
Contagio which is considered obsolete. Naturally, as a rule of thumb, the performance of any detection model depends on the malware samples used during both its evaluation and testing phases [
43].
For easy reference, the same Table lists the different kind of features collected during the analysis phase per detection system. Recall from
Section 3.1 that during static analysis, Androtomist gathers the most common features seen in the relevant work, namely permissions, intents, and API calls. The same static features are collected in [
14,
16]. On the other hand, for dynamic analysis, Androtomist relies on dynamic instrumentation, enabling the extraction of a wide variety of features. Contrariwise to other schemes included in
Table 8, system calls are consciously neglected as a feature, since its exploitation has been significantly restricted from Android v.7.0 onward [
44]. Precisely, similar to SELinux [
45], Android is anymore based on
Seccomp kernel module [
46] to further limit access to the kernel by blocking certain system calls. Put simply, starting from Android v.7.0, Seccomp kernel has been applied to processes in the media frameworks. Moreover, as of v.8.0, a Seccomp filter is installed into the
zygote, that is, the forking handling process from which all Android apps are derived. Seccomp blocks access to certain system calls, such as swapon/swapoff, which were the root cause for certain security attacks [
47]. Additionally, Seccomp blocks key control system calls, which are not useful to apps. Therefore, when analysing newer Android apps, as those in the AndroZoo dataset, the merit of system calls as a feature in malware detection schemes has been greatly diminished. Last but not least, some of these tools such as SAMADroid are intended to run on the smartphone. In this case, the app’s features are locally collected when the user interacts with it. Then, the collected features are sent to a remote host in which a decision is made about the app. Androtomist on the other hand only runs on a remote host, and therefore the app must be analysed prior to its installation.

 ,
, 


