Abstract
We organize a table of regular graphs with minimal diameters and minimal mean path lengths, large bisection widths and high degrees of symmetries, obtained by enumerations on supercomputers. These optimal graphs, many of which are newly discovered, may find wide applications, for example, in design of network topologies.
MSC:
68R10; 68M10; 20B25
1. Introduction
The next-generation supercomputers reaching exascales require sophisticated interconnection networks to couple hundreds of millions of processing units and these interconnection networks must be scalable at high bandwidth and low latency. In addition to the requirement of many-host clusters, from the aspect of micro-chips, more and more cores are integrated on one chip that require a high-performance interconnection network to couple them. The processing speed of network-on-chip (NoC), an aggregated on-chip infrastructure to enhance the energy performance among others, sensitively relies on its framework design to maximize the latency reduction and throughput. Also, data-centers in cloud computing also demand optimal architectures for dealing with expeditious growth of nodes, memory, and interconnection networks in a supercomputing system.
For this principle challenge, analyzing and optimizing network structures of interconnection networks, graph theory is an acknowledged powerful method by transforming network components into vertices, and communication links into edges. The great focus of structure design hence is on the topologies of interconnection networks and the associated graph properties of them. The current prevailing basic modules include tree, near-neighbor mesh [1], torus [2], star, Heawood graph, Peterson graph, hypercube [3,4], etc. Major operations on these typical base graphs, in searching for optimal network topology, are hierarchical interconnection graphs and Cartesian products. Hierarchical interconnection network enables large network structures to maintain desired properties, such as low diameter and low mean path length (MPL), of the basic graphs [5,6]. Classic examples of hierarchical products graphs include deterministic tree [7], Dragonfly [8], and hierarchical hypercube [9]. The Cartesian product, a straightforward graph operation that generates many eminent combined graphs, permits designers to reach a specified performance of larger-scale interconnection networks at minimal cost with parameters that can be directly required from the corresponding parameters of initial basic graphs [10].
It is obvious that most hierarchical networks are all based on Peterson graph and hypercube. Lacking diversity of orders, they limit the scales of clusters. Deng et al. [11] proposed more optimal graphs and their benchmarks on a Beowulf cluster with these graphs prove to enhance network performance better than the mainstream networks. Xu et al. [12] applied these graphs to creating larger networks by using the Cartesian product, resolving scale limitations. To fill the family of optimal graphs, we use the exhaustive search as mentioned in [13] to find the graphs with the minimal MPL and other properties aiming for optimizing interconnection networks. These graphs can be used in NoC directly or, combining with hierarchical method or Cartesian products, used as the interconnects for clusters. Symmetry, as one of the important properties for graph filtering, is also an essential factor in characterizing and measuring complex networks [14,15] as demonstrated in Conder [16] who organized a series of highly symmetric graphs. Automorphism group directly represents graph symmetry, the computation of which has been extensively studied [17] and applied in structural modeling and design [18,19]. The rest of this paper introduces, in Section 2, our criteria of optimal graphs and our structured table of the optimal base graphs and, in Section 3, our conclusions.
2. Criteria and Optimal Graphs
2.1. Criteria
2.1.1. Diameter and MPL of a Regular Graph
In the study of the components of interconnection networks, a graph with minimal diameter and minimal MPL markedly reduces the communication latency. Among all regular graphs, the Moore graphs and the generalized Moore graphs, with given numbers of vertices and of degrees, have the minimal diameters and minimal MPLs.
Let G be a connected regular graph of N vertices and degree k. The distance between two distinct vertices u and v is the length of the shortest path between these two vertices, while its diameter D is the maximum value [20]. For the generalized Moore graphs with given diameter D and degree k, the upper bound on the number of vertices is achieved as
known as Moore bound, named by Hoffman and Singleton after E. F. Moore who first studied the problem [21]. By inverting the Moore bound with regard to D and k, the lower bound of diameter can be attained (degree of 2 is a trivial case):
The MPL in a graph is the average, taken over all pairs of vertices, of the shortest path lengths between two vertices. If G is a connected graph with N vertices, the MPL is calculated by
Cerf et al. [22] proved a lower bound on MPL for any regular graph G of N vertices and degree k. Moreover, Cerf et al. [22] defines a regular graph with MPL equal to the lower bound as the generalized Moore graph.
2.1.2. Bisection Bandwidth
A bisection of a graph is a bipartition of its vertex set in which the number of vertices in the two parts differ by at most 1, and its size is the number of edges which go across the two parts. The bisection width of a graph is its minimum bisection size. In network topologies, bisection bandwidth is the minimum communication volume allowed into these removed links while recognizing bisection. Bisection bandwidth is commonly used to estimate the achievable throughput and latency of a network, and an increase in bisection bandwidth of a network improves the overall system performance. Let denote the set of edges removed to divide the total vertices N into two disjoint sets and . The number of removed edges is , and the bisection width is calculated as follows [23]:
2.1.3. Automorphism Group Size
An automorphism of a graph G is a permutation map from the vertex set to another vertex set which preserves adjacency of vertices. The set of all automorphisms of a graph G is defined as the automorphism group of G, which is denoted by . Since edge symmetry in interconnection networks ameliorates load balance across the links of the network, we further analyze on our graphs by utilizing automorphism to identify the symmetries. In general, more symmetrical network leads to better performance as in routing and robustness [23,24].
2.2. Optimal Graphs
We denote regular graphs of N vertices and degree k as graphs. For fixed N and k, we filter all graphs by minimizing diameter and MPL and maximizing bisection width and automorphism group size in such specific order, and define the filtered graphs as optimal graphs. The above filtering order is determined by the importance of each parameter in interconnect design as illustrated in [2] and demonstrated by benchmarking performance in [11]. Hence, an optimal graph has the properties of minimal diameter, minimal MPL, high throughput and high symmetry. We searched for the optimal graphs by enumeration using the same method as in [13] on supercomputers, and adopted data partially from [13]. In particular, we exhaustively calculated the diameters and MPLs of ∼ and graphs for and respectively while, for the special case of , the number of non-isomorphic graphs was too massive to exhaustively search. We calculated the bisection widths using the package KaHIP [25] and automorphism groups using the package SageMath [26], both parallelized using software GNU Parallel [27] on supercomputers. The symbols for automorphism groups are defined in Table 1 with information in [28] for additional details. We use table cell background colors to indicate the diameters and other parameters placed around each graph as shown in the legend (Figure 1). The optimal graphs are organized in Table 2, Table 3 and Table 4, which provide a structured representation of the optimal graphs with attributes for concise, convenient, and rich references. The adjacency matrices of these optimal graphs can be provided upon request. In the Table 2 and Table 3, three pairs possess 2 or 3 optimal graphs and one such optimal graph is recorded in Table 2 and Table 3 while the remainder is tabulated in the auxiliary Table 4. The asterisk marked on the parameter indicates not being equal to the theoretical lower bound, but still minimum. Table 5 provides the finite presentations of semidirect product groups in Table 2, Table 3 and Table 4, comparing with the small group databases in GAP [29] and GroupNames [30]. A subset of the optimal graphs are named graphs that are confirmed by comparing with existing graph database in Mathematica [31] and their properties are presented in Table 6.

Table 1.
Illustrations of symbols used for automorphism groups.
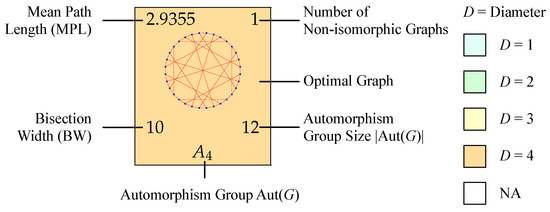
Figure 1.
Graph legends.
Table 2.
The optimal graphs for and .
Table 3.
The optimal graphs for (left) and for (right).
Table 4.
Other optimal graphs.
We also noted that many optimal graphs belong to the same category or have common properties. From Table 6, we see that many optimal graphs are Cayley or circulant or both. Some of the optimal cubic graphs are the smallest crossing number graphs [32]. Within the range of covered by us, cage graphs [33], and complete multipartite graphs of which the automorphism groups are wreath products of symmetric groups, are all optimal. The comparison with named graphs may lead to further study of more potential properties of the optimal graphs, which in return can expand the discovery and application.
3. Conclusions
Using the exhaustive search with supercomputers, we enumerate regular graphs with a wide range of orders, filter them with the diameter, MPL, bisection bandwidth, and symmetry. The benchmarks on a Beowulf also prove that the feature of symmetry affects the performance of networks, and these optimal graphs can be applied to many areas including the designs of microchips and data centers. We supply new base graphs and expansion methods to construct larger and diverse interconnection networks.
Author Contributions
Y.Z. designed the Table 2, Table 3 and Table 4 and composed the initial draft of the manuscript; X.H. calculated graph bisection widths and the automorphism groups and composed Table 6; Z.X. calculated the diameters and MPLs of the graphs and composed tables; Y.D. conceptualized the project and carried out the manuscript revisions and finalization. All authors have read and agreed to the published version of the manuscript.
Funding
The research of Z.X. is partially supported by the Special Project on High-Performance Computing of the National Key R&D Program under No. 2016YFB0200604.
Acknowledgments
The authors thank Stony Brook Research Computing and Cyberinfrastructure, and the Institute for Advanced Computational Science at Stony Brook University for access to the high-performance SeaWulf computing system, which was made possible by a $1.4M National Science Foundation grant (#1531492).
Conflicts of Interest
The authors declare no conflict of interest.
References
- Barnes, G.; Brown, R.; Kato, M.; Kuck, D.; Slotnick, D.; Stokes, R. The ILLIAC IV Computer. IEEE Trans. Comput. 1968, C-17, 746–757. [Google Scholar] [CrossRef]
- Dally, W.J.; Seitz, C.L. The torus routing chip. Distrib. Comput. 1986, 1, 187–196. [Google Scholar] [CrossRef]
- Saad, Y.; Schultz, M. Topological properties of hypercubes. IEEE Trans. Comput. 1988, 37, 867–872. [Google Scholar] [CrossRef]
- Tripathy, C.; Mahapatra, R.; Misra, R. Reliability analysis of hypercube multicomputers. Microelectron. Reliab. 1997, 37, 885–891. [Google Scholar] [CrossRef]
- Lai, P.L.; Hsu, H.C.; Tsai, C.H.; Stewart, I.A. A class of hierarchical graphs as topologies for interconnection networks. Theor. Comput. Sci. 2010, 411, 2912–2924. [Google Scholar] [CrossRef][Green Version]
- Guo, D.; Chen, T.; Li, D.; Liu, Y.; Liu, X.; Chen, G. BCN: Expansible network structures for data centers using hierarchical compound graphs. In Proceedings of the 2011 IEEE INFOCOM, Shanghai, China, 10–15 April 2011. [Google Scholar] [CrossRef]
- Jung, S.; Kim, S.; Kahng, B. Geometric fractal growth model for scale-free networks. Phys. Rev. E 2002, 65, 056101. [Google Scholar] [CrossRef] [PubMed]
- Wu, C.L.; Feng, T.Y. On a Class of Multistage Interconnection Networks. IEEE Trans. Comput. C 1980, 29, 694–702. [Google Scholar] [CrossRef]
- Malluhi, Q.; Bayoumi, M. The hierarchical hypercube: a new interconnection topology for massively parallel systems. IEEE Trans. Parallel Distrib. Syst. 1994, 5, 17–30. [Google Scholar] [CrossRef]
- Hammack, R.; Imrich, W.; Klavzar, S. Handbook of Product Graphs (Discrete Mathematics and Its Applications); CRC Press: Boca Raton, FL, USA, 2011. [Google Scholar]
- Deng, Y.; Guo, M.; Ramos, A.F.; Huang, X.; Xu, Z.; Liu, W. Optimal Low-Latency Network Topologies for Cluster Performance Enhancement. arXiv 2019, arXiv:1904.00513. [Google Scholar]
- Xu, Z.; Deng, Y. Optimal Routing for a Family of Scalable Interconnection Networks. In Proceedings of the International Conference for High Performance Computing, Networking, Storage, and Analysis (SC’19 Poster), Denver, CO, USA, 17–22 November 2019. [Google Scholar]
- Xu, Z.; Huang, X.; Jimenez, F.; Deng, Y. A New Record of Graph Enumeration Enabled by Parallel Processing. Mathematics 2019, 7, 1214. [Google Scholar] [CrossRef]
- Garlaschelli, D.; Ruzzenenti, F.; Basosi, R. Complex Networks and Symmetry I: A Review. Symmetry 2010, 2, 1683–1709. [Google Scholar] [CrossRef]
- Garrido, A. Symmetry in Complex Networks. Symmetry 2011, 3, 1–15. [Google Scholar] [CrossRef]
- Conder, M. Marston Conder Web. Available online: https://www.math.auckland.ac.nz/~conder/ (accessed on 6 October 2019).
- Balasubramanian, K. Computational Techniques for the Automorphism Groups of Graphs. J. Chem. Inf. Model. 1994, 34, 621–626. [Google Scholar] [CrossRef]
- Razinger, M.; Balasubramanian, K.; Munk, M.E. Graph automorphism perception algorithms in computer-enhanced structure elucidation. J. Chem. Inf. Model. 1993, 33, 197–201. [Google Scholar] [CrossRef] [PubMed]
- Balasubramanian, K. Computational Enumeration of Colorings of Hyperplanes of Hypercubes for all Irreducible Representations and Applications. J. Math. Sci. Model. 2018, 1, 158–180. [Google Scholar] [CrossRef]
- Bapat, R.B. Graphs and Matrices; Springer: London, UK, 2014. [Google Scholar] [CrossRef]
- Hoffman, A.J.; Singleton, R.R. On Moore Graphs with Diameters 2 and 3. In Selected Papers of Alan J Hoffman; World Scientific: Singapore, 2003; pp. 377–384. [Google Scholar] [CrossRef]
- Cerf, V.G.; Cowan, D.D.; Mullin, R.C.; Stanton, R.G. A lower bound on the average shortest path length in regular graphs. Networks 1974, 4, 335–342. [Google Scholar] [CrossRef]
- Dally, W.; Towles, B. Principles and Practices of Interconnection Networks; Morgan Kaufmann Publishers: San Francisco, CA, USA, 2003. [Google Scholar]
- MacArthur, B.D.; Sánchez-García, R.J.; Anderson, J.W. Symmetry in complex networks. Discret. Appl. Math. 2008, 156, 3525–3531. [Google Scholar] [CrossRef]
- Sanders, P.; Schulz, C. Think locally, act globally: Highly balanced graph partitioning. In International Symposium on Experimental Algorithms; Springer: Berlin, Germany, 2013; pp. 164–175. [Google Scholar]
- The Sage Developers. SageMath, The Sage Mathematics Software System (Version 8.8). Available online: https://www.sagemath.org (accessed on 6 October 2019).
- Tange, O. GNU Parallel 2018; Lulu.com: Morrisville, NC, USA, 2018. [Google Scholar]
- Dummit, D.S.; Foote, R.M. Abstract Algebra; John Wiley & Sons: New York, NY, USA, 2003. [Google Scholar]
- The GAP Group. GAP—Groups, Algorithms, and Programming, Version 4.10.2. 2019. Available online: https://www.gap-system.org (accessed on 6 October 2019).
- Dokchitser, T. GroupNames. Available online: https://people.maths.bris.ac.uk/~matyd/GroupNames/index.html (accessed on 6 October 2019).
- Wolfram Research. “GraphData” from Wolfram Mathematica. Available online: https://reference.wolfram.com/language/ref/GraphData.html (accessed on 6 October 2019).
- Pegg, E., Jr.; Exoo, G. Crossing number graphs. Math. J. 2009, 11, 161–170. [Google Scholar] [CrossRef]
- Exoo, G.; Jajcay, R. Dynamic cage survey. Electron. J. Combin 2008, 15, 4. [Google Scholar]


© 2019 by the authors. Licensee MDPI, Basel, Switzerland. This article is an open access article distributed under the terms and conditions of the Creative Commons Attribution (CC BY) license (http://creativecommons.org/licenses/by/4.0/).