Abstract
The Chang–Zhu–Tan Metropolitan Area, the first national-level metropolitan region in central China, faces a prominent conflict between urban expansion and the quality of the ecological environment (EEQ) amid rapid urbanization. Investigating the ecological evolution of this area holds both significant scientific and practical value. This study leverages the Google Earth Engine (GEE) platform and long-term Landsat remote sensing imagery to explore the spatiotemporal variations in EEQ in the Chang–Zhu–Tan Metropolitan Area from 2002 to 2022. A modified remote sensing ecological index (MRSEI) was developed by incorporating the Air Quality Difference Index (DI), and changes in EEQ were analyzed using Sen slope estimation and the Mann–Kendall test. Apart from that, using 2022 data as an example, the Optimal Parameter Geodetector (OPGD) was employed to evaluate the impacts of multifarious driving factors on EEQ. The main findings of the study are as follows: (1) In comparison with the traditional remote sensing ecological index (RSEI), MRSEI can more effectively reflect regional differences in EEQ. (2) The overall EEQ in the region is relatively good, with over 60% of the area classified as “excellent” or “good”. The spatial distribution follows a pattern of “higher at the edges, lower in the center”. (3) The EEQ trend in the study area generally suggests reinforcement, though central areas such as Kaifu District and Tianxin District exhibit varying degrees of degradation. (4) Human factors have a greater impact on EEQ than natural factors. Land Use and Land Cover Change (LUCC) is the primary driver of the spatial differentiation in the regional ecological environment, with the interaction of these factors producing synergistic effects. The results of this study strongly support the need for ecological protection and green development in the Chang–Zhu–Tan Metropolitan Area, offering valuable insights for the sustainable development of other domestic metropolitan regions.
1. Introduction
With the deepening of economic globalization, urban development increasingly exhibits regional characteristics. Metropolises have become the mainstream of global cities and urbanization development. Characterized by phenomenal regional influence and driving functions, a metropolitan area is a highly urbanized spatial entity revolving around a large or megacity. Its scope is typically defined by a one-hour commuting zone [1,2]. As a hub for aggregating production factors that not only drive regional economic growth but also foster social progress [3], metropolitan areas play a progressively crucial role in the evolving landscape of urban challenges. In recent years, the development of the Chang–Zhu–Tan Metropolitan Area has gained momentum, yet these regions are also confronting increasing ecological and environmental challenges [4,5]. Human activities have triggered a range of ecological and environmental issues, such as air pollution (e.g., PM2.5), the intensification of the urban heat island effect, and the large-scale encroachment of construction land on ecological spaces [6,7]. These issues not only degrade the quality of the local ecological environment but also undermine key ecosystem services such as climate regulation, air purification, and biodiversity preservation. The above phenomena thereby slow down the sustainable development of metropolitan areas [8,9]. Consequently, a comprehensive and systematic analysis and evaluation of ecological changes in the Chang–Zhu–Tan Metropolitan Area, which enables the timely identification and rational diagnosis of environmental issues, is crucial for promoting high-quality regional development [10].
The EEQ refers to the health status of an ecosystem and its capacity for sustainable development. It is a comprehensive concept that includes aspects such as ecosystem structure and function, productivity, carrying capacity, and resilience. Universally acknowledged for its wide coverage, phenomenal periodicity, and high objectivity. Remote Sensing (RS) technology has become an essential tool for large-scale, long-term monitoring and assessment of EEQ [11,12]. Xu [13] integrated a diverse array of ecological indicators, comprising NDVI [14,15], WET [16], NDBSI [17], and LST [18,19]. The aforementioned factors enable rapid and quantitative assessments of regional EEQ without relying on artificial weights. This approach has been widely applied in ecological and environmental research. Nevertheless, as the Remote Sensing Ecological Index (RSEI) model gains wider application, the heterogeneity of ecological structures across different ecosystems can limit its full effectiveness, hindering optimal results. To address this challenge, several scholars have put forth optimizations to the RSEI index. For instance, Wang [20] incorporated a land degradation index to account for the specific ecological characteristics of the Central Asian Aral Sea Basin. This distinctive index is beneficial for us to develop a drought-sensitive remote sensing index tailored to monitor EEQ in that region. Lu [21] replaced the original NDVI with the kernel normalized difference vegetation index (kNDVI) to strengthen the ecological assessment in the Yellow River Basin. Chen [22] focused on salinization issues in the Tarim River Basin, integrating the Salinity Composite Index (CSI) into the RSEI, thus creating a salinity-adaptive remote sensing ecological index for EEQ assessment in that area.
With its high urbanization rate and dense population, the Chang–Zhu–Tan Metropolitan Area faces significant challenges in maintaining air quality. Particulate matter (PM2.5) in the air is the primary pollutant [23,24]. Feng [25] utilized an Avafield-1 spectrometer to measure the spectral curves of typical vegetation and soil under varying PM2.5 pollution conditions. The study found that particulate matter affected light reflectance in two ways. It increased reflectance in the red-light band, while decreasing it in the near-infrared band. Grounded in these findings, a Difference Index (DI) was developed using the red light and near-infrared bands—both of which are sensitive to particulate matter. The prediction model achieved a high correlation coefficient (r) of 0.796, which strongly confirms its accuracy and demonstrates the index’s effectiveness in tracking PM2.5 concentration. This approach offers a viable method for integrating air quality factors into remote sensing ecological indices. Aside from that, Wang [26] incorporated the DI to develop an ameliorated Remote Sensing Ecological Index (MRSEI), which yielded evaluation results that more closely aligned with real surface conditions. More importantly, the above index has been proven to be more suitable for assessing the EEQ of the Yellow River Delta. Nevertheless, current regional ecological assessment practices have not adequately incorporated air quality as a key factor. This limitation gives rise to an underestimation of its impact on ecosystem structure and function. This oversight results in an incomplete and biased understanding of the overall regional ecological quality. As a consequence, integrating air quality into ecological assessments is crucial for us to assess regional environmental health in a more comprehensive and objective manner.
EEQ changes are caused by a combination of nature and human actions. The influence of these drivers is complex, often being nonlinear and spatially heterogeneous [27,28]. As it effectively quantifies the explanatory power of influencing factors on the spatial distribution of geographical phenomena, the GD model [29,30] is widely used in research on the spatial differentiation of EEQ changes and the identification of driving factors [31,32,33]. Nonetheless, when applied to grid-based spatial data, traditional GD models are susceptible to the Modifiable Areal Unit Problem (MAUP) [34], which may bring about biased estimates of the relationship between driving factors and ecological environmental quality, thereby diminishing the reliability of the analysis results [35]. In contrast, Song [36] incorporated the OPGD model to address this issue. By identifying the optimal combination of spatial discretization and scale parameters, this distinctive model enhances the accuracy of the association analysis between dependent and independent variables. This provides a more robust methodological foundation for studying the driving factors of EEQ changes. Previous studies have successfully applied this method to fields such as geological disasters, vegetation cover, and rural spatial patterns, demonstrating its strong applicability. However, its use in ecological environment quality assessment remains relatively limited.
Based on the analysis above, it is clear that while numerous studies on ecological quality assessments have been conducted, none have specifically examined the ecological environment of the Chang–Zhu–Tan Metropolitan Area by incorporating air quality within the framework of the RSEI. Additionally, no research has combined the OPGD model to more accurately quantify the factors driving changes in ecological conditions. This study leverages the GEE platform to propose a modified remote sensing ecological index. This enhanced index incorporates the air quality DI, addressing the gaps in current methodologies. The modified index is subsequently employed to quantitatively analyze the spatiotemporal dynamics of the EEQ changes in the Chang–Zhu–Tan Metropolitan Area from 2002 to 2022. Furthermore, using 2022 data as an example, the OPGD model is applied to identify key driving factors and their interactions, shedding light on the underlying mechanisms of ecological environment evolution in the region. The objective of this study is to provide scientific support for developing targeted ecological protection and restoration strategies for the Chang–Zhu–Tan Metropolitan Area, thereby promoting sustainable development. Aside from that, the study aims to offer a valuable reference for similar EEQ assessments in other metropolitan areas across the country.
2. Materials and Methods
2.1. Research Area
The Chang–Zhu–Tan Metropolitan Area (27°30′–28°30′ N, 111°30′–113°30′ E) [37] is located in the central-eastern part of Hunan Province (Figure 1). It encompasses 19 county-level administrative units in Changsha, Zhuzhou, and Xiangtan City, with a total area of 18,900 square kilometers. The terrain is predominantly composed of hills and plains, with mountains distributed in the eastern and western regions. Characterized by mild temperatures, the central area is relatively flat and low-lying. It belongs to a subtropical monsoon climate, with an average annual temperature ranging from 16.8 °C to 17.3 °C. It experiences ample rainfall, with an average annual precipitation of 1350 to 1550 mm. In 2021, the permanent population was 14.84 million, accounting for 22.41% of the province’s total. The region’s total economic output reached 1.79 trillion yuan. The Chang–Zhu–Tan Metropolitan Area is an integral part of the Yangtze River Midstream Urban Cluster. With rapid urbanization, the area has seen significant impacts on the regional ecological environment. In the construction of the Chang–Zhu–Tan Metropolitan Area, it has become a key task to accelerate the coordinated and integrated development of urbanization and ecological preservation.

Figure 1.
Study area location map. (a) Geographical location, (b) Administrative division, (c) Elevation.
2.2. Data Sources and Preprocessing
The data used in this study encompasses remote sensing images, land use data, terrain data, climate data, and socio-economic data. The remote sensing imagery was primarily sourced from the GEE cloud platform [38]. For this purpose, we selected data with cloud cover below 20%, preferring surface reflectance imagery from May to September. The five-period composite imagery for the study was then generated using a pixel-level median compositing method. On the basis of previous studies and data availability [39,40], eight influencing factors were selected from both natural and socio-economic aspects to explore the spatial distribution of MRSEI. These factors encompass slope (SLO), digital elevation model (DEM), temperature (TEM), precipitation (PRE), GDP, population density (PD), nighttime light (NTL), and Land Use and Land Cover Change (LUCC) [41]. As the data sources differ in terms of resolution, projection, and spatial extent, projection transformation and resampling were conducted rooted in the study area’s boundaries before analysis, ultimately generating data with a resolution of 100 m × 100 m. The specific details of this data are presented in Table 1.

Table 1.
Data source and pre-processing.
2.3. Research Methods
2.3.1. MRSEI Model
The traditional RSEI integrates individual indicators of Greenness, Humidity, Dryness, and Heat through principal component analysis, providing a quick and intuitive reflection of regional ecological environment quality [42]. Building upon the RSEI, this study introduces the Purity index to represent air quality and develops an MRSEI. Each of these dimensions contributes to MRSEI, representing independent but interconnected factors that, when combined, offer a comprehensive assessment of urban environmental quality.
- (1)
- Greenness: Represents vegetation coverage and serves as an indicator of urban green space and plant health, typically measured by the Normalized Difference Vegetation Index (NDVI).
- (2)
- Humidity: Reflects the moisture content in the landscape, which is crucial for understanding environmental resilience and the health of urban ecosystems. It is represented by the third component of the K-T transformation (K-T transformation).
- (3)
- Dryness: Reflects the water stress in urban areas, highlighting regions that may be more vulnerable to drought or water scarcity. It is comprehensively represented by the Building Index (IBI) and the Soil Index (SI).
- (4)
- Heat: Pertains to the urban heat island effect, focusing on understanding extreme temperature values and their impact on human health and ecosystem well-being. This is represented by the Land Surface Temperature (LST).
- (5)
- Purity: Indicates the concentration of PM2.5 particulate matter in urban areas. It is represented by the difference between the red light and near-infrared bands.
The calculation methods of multifarious ecological indicators are demonstrated in Table 2.
Table 2.
MRSEI parameter and formula.
Principal Component Analysis (PCA) is an efficient dimensionality reduction technique that resolves multicollinearity among variables, enabling a more objective assessment of changes in EEQ. Due to the differing units of measurement across the indicators, normalization of the data is necessary prior to performing PCA. The first principal component (PC1) is extracted through PCA, yielding MRSEI0. To facilitate comparison of the results, MRSEI0 is subsequently standardized, resulting in the final MRSEI. The specific calculation formula is computed as follows:
2.3.2. MRSEI Trend Analysis
The Sen slope estimator [47] and the Mann–Kendall test [48] are extensively utilized non-parametric methods for time series trend analysis. The Sen slope estimator is employed to calculate the rate of trend change in a data series, while the Mann–Kendall test is adopted to assess whether there is a significant trend in the data series. To analyze the trend of EEQ in the Chang–Zhu–Tan Metropolitan Area, this study applies both the Sen slope estimator and the Mann–Kendall test.
The Sen slope estimator is a robust and non-parametric statistical method for calculating trends. The calculation formula is calculated as follows:
In the formula, MRSEIi and MRSEIj represent the MRSEI values for the years i and j, respectively; “Median” refers to the median function; N denotes the sample size; and β indicates the trend change in the time series data.
The Mann–Kendall test is a non-parametric method for testing the trend of time series data. It does not require the data to follow a normal distribution and is unaffected by missing or outlier values, making it suitable for significance testing of trends in long time series data. The formula for calculating the test statistic (S) is presented as follows:
2.3.3. Optimal Parameter-Based Geographical Detectors Model
The OPGD model is an extension of the traditional geographic detector model. In particular, it incorporates a parameter optimization module that encompasses spatial discretization optimization and spatial scale optimization [49]. Spatial scale optimization is necessary because the driving effects of multifarious factors differ at different spatial scales [50]. As the spatial grid increases, the influence of many driving factors (q) tends to grow and stabilize. Existing studies typically compare the 90th percentile (q) of all driving factors across different spatial scales. The optimal scale is then identified as the one that yields the maximum value. Spatial discretization optimization involves applying an extensive spectrum of methods to discretize the independent variables. These approaches encompass natural breaks, equal interval classification, quantile classification, geometric interval classification, and standard deviation classification, etc. [51]. On top of that, the optimal discretization method and the number of intervals are determined by calculating the q values corresponding to different breakpoint combinations of these classification methods. The advantage of the OPGD model is that it addresses the issue of poor quantitative analysis results when relying on experience or uniform discretization methods for different independent variables. By determining the optimal spatial scale and interval partitions, the model not only reduces the within-group variance of the independent variables but also enhances the significance of between-group differences. This approach allows for a more accurate and scientifically robust quantitative analysis of how independent variables drive changes in dependent variables. Consequently, it significantly enhances the overall scientific rigor of the research findings.
This study uses data from 2022 as an example and applies the OPGD model to determine the optimal spatial scale and partition intervals for the analysis of driving factors. On the basis of the study area and incorporating relevant research on spatial scale effects, eight spatial scales were constructed: 0.5, 1, 1.5, 2, 2.5, 3, 3.5, and 4 km. The 90th percentile of the explained variable (q) was proven to reach its maximum at a spatial scale of 2 km, which is considered the optimal spatial scale (Figure 2a). On top of that, referring to previous studies on the classification of eight indicators, the categorization of the explanatory variables was set to 3–8 classes [52]. Five discretization methods—equal interval, natural breaks, quantile classification, geometric interval, and standard deviation methods—were adopted to determine the optimal partitioning of the explanatory variables [53]. The results demonstrate that the optimal discretization parameter combinations for SLO, DEM, TEM. In comparison, GDP are the quantile classification with 8 intervals, while PRE follows the natural breaks method with 8 intervals. For PD and NTL, we recommend the geometric interval method for classification. Specifically, a division into 8 intervals yields the best result (Figure 2b).
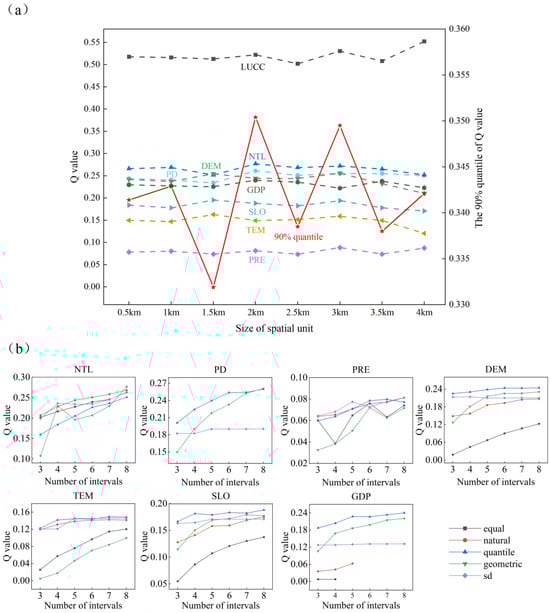
Figure 2.
Scale and partitioning effects of explanatory variables rooted in OPGD models. (a) size of spatial unit, (b) variable discrete.
3. Results and Analysis
3.1. Rationale Analysis for MRSEI
Table 3 presents the results of principal component analysis (PCA) for the Chang–Zhu–Tan Metropolitan Area over different periods. From 2002 to 2022, the contribution rate of the first principal component (PC1) remained stable at approximately 80%, effectively capturing the majority of the characteristic information from an extensive spectrum of indicators. Among them, the NDVI and WET indices showed positive values, suggesting a positive impact on the ecological environment of the study area. Nonetheless, the NDBSI, LST, and DI indices yielded negative values, reflecting adverse effects on the environment. This aligns with real-world observations. Overall, PC1 integrated the most relevant information for the MRSEI. Simultaneously, this index avoided the subjectivity inherent in manually assigning weights in a weighted average calculation. As a consequence, constructing the MRSEI grounded in features extracted from PC1 is both rational and scientifically desirable.
Table 3.
Results of principal component analysis.
3.2. Comparative Analysis of MRSEI and RSEI
We calculated the MRSEI and RSEI indices for the study area in 2022. Figure 3a,b illustrate the spatial distributions of RSEI and MRSEI, illustrating that both indices exhibit a broadly consistent pattern across the Chang–Zhu–Tan Metropolitan Area. The central core of the region displays lower values, whereas the surrounding areas generally exhibit higher values. Nevertheless, some local discrepancies are evident; notably, MRSEI values in the central urban areas are slightly lower than the corresponding RSEI values. Apart from that, the low-value regions in Figure 3c correspond to the high-value areas of the DI in Figure 3d. This pattern can be primarily attributed to intensive human activities in the area, which degrade atmospheric quality and result in relatively high PM2.5 concentrations. As suggested by these findings, MRSEI not only effectively reflects environmental factors such as vegetation, soil, and temperature but also incorporates atmospheric conditions, demonstrating phenomenal integrative capability. Consequently, MRSEI provides a comprehensive representation of the multidimensional ecological environment status.
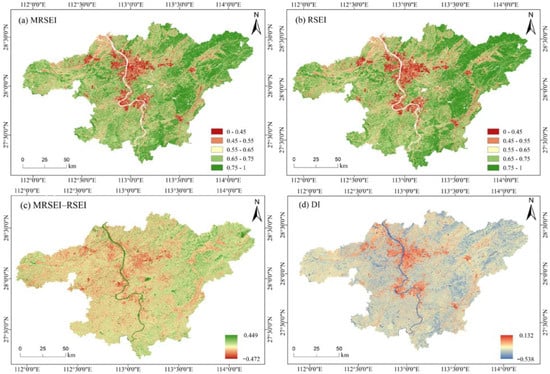
Figure 3.
Spatial distribution of MRSEI, RSEI, and DI in the study area in 2022.
On top of that, the correlation analysis in Figure 4a reveals a significant linear relationship between MRSEI and RSEI, which is significant at the 0.01 level. This strong correlation further validates that the MRSEI index is effective in reflecting the overall ecological condition of the Chang–Zhu–Tan Metropolitan Area. To further compare the distributions of the two indices, we plotted the frequency distribution of MRSEI and RSEI (Figure 4b,c). Figure 4c shows that the MRSEI data has a highly concentrated distribution. Its histogram exhibits a regular shape near the peak, and the fitted curve approximates a normal distribution. Given that the study area is predominantly urbanized with little ecological variation, this concentrated pattern accurately reflects the region’s overall ecological quality.
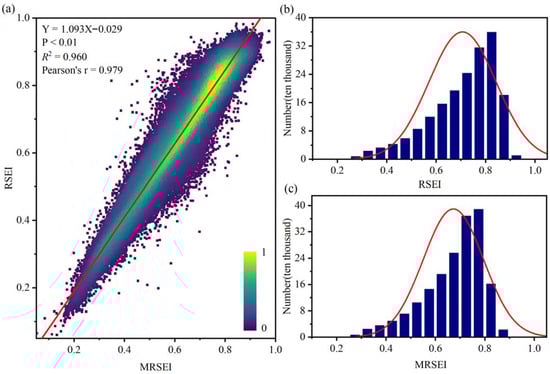
Figure 4.
Comparison of RSEI and MRSEI results in the study area in 2022. (a) Correlation between MRSEI and RSEI, (b) Frequency Distribution of MRSEI, (c) Frequency Distribution of RSEI.
3.3. Spatiotemporal Changes in EEQ
The MRSEI data is predominantly concentrated between 0.3 and 0.8, with a particularly dense distribution between 0.45 and 0.75, which follows a normal distribution. On the basis of relevant literature, the EEQ is divided into five levels: poor [0, 0.45), relatively poor [0.45, 0.55), moderate [0.55, 0.65), good [0.65, 0.75), and excellent [0.75, 1]. As evidenced by the overall distribution (Figure 5), the spatial distribution of the EEQ generally exhibits a “low-center and high surrounding” spatial pattern in the Chang–Zhu–Tan Metropolitan Area. Specifically, the excellent and good ecological zones are principally located in the northeastern, northwestern, and southern key ecological barrier areas of the metropolitan region. These areas are rich in vegetation, with minimal human disturbance, and have a relatively stable ecological environment. In contrast, the poor and relatively poor ecological zones are primarily found in the central core areas of the metropolitan area, such as Yuhua District, Furong District, and Yuhu District. These regions are densely populated. Aside from that, human activities have significant negative impacts on the local ecological environment, ultimately leading to poor ecological quality. With regard to changes over time (Figure 6), in the core region of the Chang–Zhu–Tan Metropolitan Area, the proportion of poor and relatively poor zones increased from 14.09% to 17.84%. This indicates an outward expansion of areas with low and relatively low habitat quality. Meanwhile, the area percentage of excellent and good zones decreased from 63.74% to 62.18%. These zones are principally located in economically developed areas such as Changsha County, Ningxiang City, and Liuyang City.
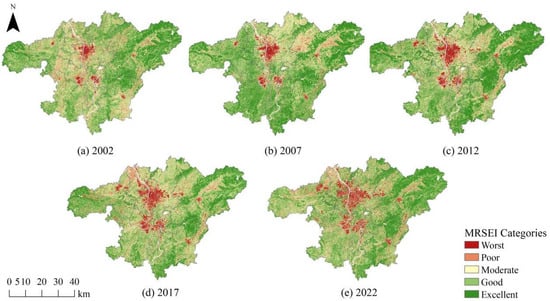
Figure 5.
Spatial distribution map of the EEQ in Chang–Zhu–Tan Metropolitan Area.
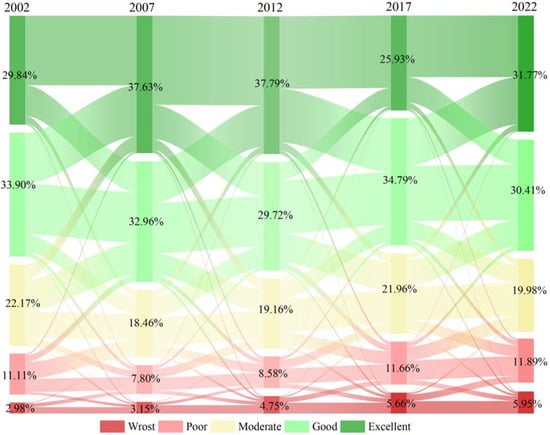
Figure 6.
Sankey diagram of the area transitions in the MRSEI for the study area.
3.4. Trend Analysis of EEQ
The spatial–temporal trend of EEQ in the Chang–Zhu–Tan Metropolitan Area from 2002 to 2022 was analyzed using the Theil–Sen median slope estimation and Mann–Kendall test. The results are demonstrated in Figure 7a. Overall, although there are some localized areas of degradation, EEQ in the research area has ameliorated. The area percentage of tremendously bettered zones is 0.44%, principally located in the northeastern mountainous regions of the study area, such as the eastern part of Liuyang City. The area percentage of slightly ameliorated zones is 80.10%, primarily concentrated in areas with dense vegetation cover, such as the southwestern part of Liling City and most of Lukou District. The area percentage of stable zones is 3.01%, mainly located in river and lake areas. Slightly degraded zones, which account for 16.29% of the area, are primarily located within the built-up areas of the Chang–Zhu–Tan Metropolitan Area. Substantially degraded zones account for only 0.15% of the area and are primarily located in the central core development areas. In these zones, rapid urban expansion has destroyed surface vegetation, leading to a continuous deterioration of the EEQ.
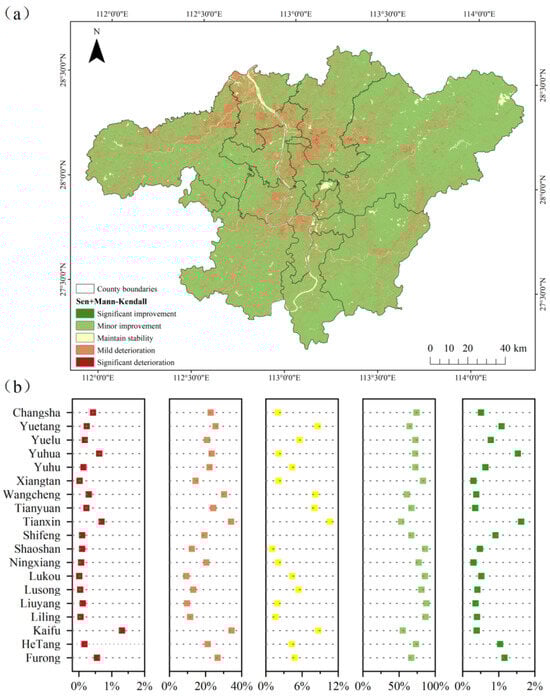
Figure 7.
The spatial distribution and changes in the MRSEI. (a) Overall Change Trend, (b) Change Trend of County–Level Administrative Divisions.
From the perspective of county–level administrative areas (Figure 7b), Kaifu District, Tianxin District, and Wangcheng District account for a relatively large proportion of the degraded EEQ area, representing 35.71%, 34.79%, and 30.53% of their respective urban areas. This is predominantly attributable to the relatively flat terrain, dense population distribution, and frequent economic construction activities in these regions, which have led to a decline in regional EEQ. Liuyang City, Liling City, Lukou District, Lusong District, Shaoshan City, and Xiangtan County have more than 80% area with ameliorated EEQ. Among them, Liuyang City has the highest proportion, reaching 88.22%.
3.5. Analysis of MRSEI–Influencing Factors
This study selects natural factors such as SLO, DEM, PRE, TEM, and human factors such as PD, GDP, NTL, and LUCC as the influencing factors for the EEQ changes in the Chang–Zhu–Tan Metropolitan Area in 2022. On the basis of the optimal spatial scale, zoning methods, and intervals determined by OPGD, the study investigates the impact of these drivers on EEQ through both single-factor and interaction-based analyses.
The results of the single-factor analysis demonstrate that the ecological environment quality is influenced by both natural and human factors in the Chang–Zhu–Tan Metropolitan Area (Figure 8a). Overall, human factors have a more remarkable explanatory power on EEQ than natural factors. Land use type was the strongest predictor of EEQ changes, with the highest q-value of 0.522 among all factors. On this basis, the factors with significant influence encompass NTL, PD, DEM, GDP, SLO, and TEM, while PRE exerted the least substantial impact on the EEQ of the study area, with a q-value of only 0.0814, which can be considered negligible.
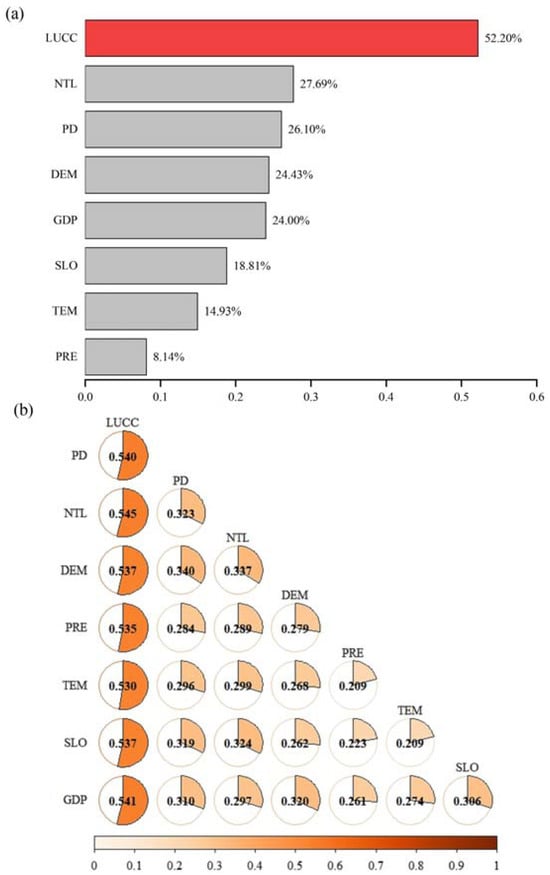
Figure 8.
Results of (a) Single-Factor Detection and (b) Interaction Detection.
Grounded in the single-factor analysis, this study employed five interaction methods from the OPGD model to explore the interactions between driving factors (Figure 8b). The results demonstrate that the interactions between the driving factors are stronger than their individual effects, with all interactions exhibiting a bi-factor enhancement. The interaction between LUCC and NTL presented the most striking impact, with an explanatory q-value of 0.545. LUCC, PD, DEM, NTL, and GDP demonstrate strong interactions with other factors, further underscoring their dominant role in the observed spatial differentiation. Although the explanatory power of PRE, TEM, and SLO as single factors is relatively low, their interactions with LUCC and DEM suggest an enhancement effect. This reveals that under specific conditions, secondary factors can tremendously alter the EEQ within the region.
4. Discussion
4.1. Applicability Evaluation of the MRSEI Model
The RSEI model uses Principal Component Analysis (PCA) to objectively assign weights to a diverse array of factors. In this way, the above approach can avoid subjective interference and simultaneously ensure high credibility of the results. It has been widely applied in ecological environmental quality (EEQ) assessments. Nevertheless, the negative impact of air pollution on the ecological environment has become increasingly significant with the acceleration of urbanization. Traditional remote sensing ecological indices (RSEI) often fail to sufficiently capture the diversity and complexity of regional EEQ. Hence, to enhance the accuracy and applicability of EEQ monitoring, this study proposes a novel Remote Sensing Ecological Index (MRSEI) that integrates multiple dimensions, comprising NDVI, WET, SI, LST, and DI.
Firstly, the MRSEI analysis shows that the contribution rate of PC1 is approximately 80%, with the factor loadings aligning well with actual conditions, indicating that the improved index is both scientifically sound and rational. Secondly, MRSEI integrates the interrelationships among various environmental factors, allowing it to more effectively reveal the ecological pressures brought about by rapid urbanization, thus providing a more comprehensive and accurate assessment of ecological environment quality. Furthermore, MRSEI boasts powerful dynamic monitoring capabilities. By leveraging the GEE cloud platform, MRSEI enables rapid monitoring of EEQ, making it especially suitable for continuous tracking and evaluation of modern metropolitan areas.
The evaluation of ecological environment quality remains difficult to validate with concrete data. Furthermore, a widely accepted standard for assessing the EEQ in this region has not been established. As a consequence, future research will concentrate on exploring independent verification methods for the DI values by using air quality observation data. The principal aim is to provide more accurate and effective support for ecological monitoring in metropolitan areas.
4.2. Spatiotemporal Variation Characteristics of EEQ
The EEQ of the Chang–Zhu–Tan Metropolitan Area exhibits a differentiated pattern of “low in the center and high around the periphery”. The central areas of the urban agglomeration have experienced rapid urbanization and intense human activity, leading to the continuous encroachment of agricultural land—such as cultivated land, grasslands, and forests—by urban development. This process not only alters the region’s original ecological foundation but also transforms natural habitats into new sources of ecological disturbance, ultimately disrupting the balance of local ecosystems. In contrast, the peripheral areas of the urban agglomeration, with concentrated forest resources, have maintained better integrity of natural ecosystems, and biodiversity remains relatively stable.
Over the past two decades, approximately 90% of the ecological habitats in the Chang–Zhu–Tan Metropolitan Area have remained stable, thanks largely to the ongoing improvement of the ecological monitoring system and the gradual enhancement of the ecological compensation mechanism. During this period, regions with higher habitat quality have maintained good conditions, while areas with lower habitat quality have shown signs of improvement. However, habitat degradation remains a prominent issue in certain local areas. Between 2012 and 2017, the construction of major transportation projects, such as the Chang–Zhu–Tan Intercity Railway and the Shanghai–Kunming High-Speed Railway (Chang–Zhu–Tan section), resulted in the conversion of large areas of farmland and green spaces into construction zones, significantly increasing ecological threats. In recent years, against the backdrop of the deepening and implementation of ecological civilization concepts, the Chang–Zhu–Tan Metropolitan Area has gradually established a regional ecological compensation mechanism and promoted a green transformation of development through the “One Core and Three Belts” strategy. As a result, the ecological environment quality has stabilized.
The Sen+Mann–Kendall trend analysis results reveal significant spatial heterogeneity in the ecological environment of the study area. However, as a standard tool for long-term time series analysis, the Sen+Mann–Kendall test has certain limitations when applied with only five time periods in this study. Specifically, each pixel contains only five data points, which may affect the statistical power and independence of the results. Although this design may provide valuable trend information in some cases, the limited number of data points could reduce the reliability of the test results. Therefore, future studies should consider using longer time series or incorporating additional methods to enhance the robustness and reliability of the findings.
4.3. Driving Factors of EEQ
The spatial pattern of MRSEI is influenced by human activities, climatic conditions, and geographical factors. MRSEI exhibits varying responses across different ranges of influencing factors. Generally, MRSEI is positively correlated with PRE, suggesting better EEQ in areas with higher rainfall. As human activities tend to concentrate in flat and plain areas, SLO and DEM have a phenomenal and positive impact on MRSEI. MRSEI reveals noticeable sensitivity to NTL and PD. Accordingly, areas with frequent human activity exhibit markedly lower MRSEI values compared with other regions.
This study employs the OPGD model to conduct both univariate and interactive tests of eight influencing factors on MRSEI. We arrived at the conclusion that LUCC and NTL are the key factors affecting the spatial pattern of MRSEI. As a “background” factor for ecological quality, LUCC directly determines the physical properties of land cover (such as vegetation cover, albedo, etc.) and landscape patterns, fundamentally controlling the spatial differentiation of MRSEI. For another, NTL serves as a “comprehensive indicator” of human activity intensity, reflecting the spatial distribution of population density, energy consumption, and economic activities. It reveals the ecological environmental pressures induced by urbanization (such as urban heat island effects, environmental pollution, and natural space compression). Notably, there is a significant negative correlation between NTL and MRSEI. On top of that, natural factors such as SLO and DEM also play important roles in MRSEI. These factors indirectly influence human activity intensity by limiting the difficulty of regional development. Generally, areas with steeper slopes and higher altitudes not only experience weaker human intervention but also maintain relatively better ecological quality. In contrast, flat regions tend to attract more human activities, leading to more substantial ecological pressures. To alleviate the spatial resource competition caused by population concentration, local governments often promote more intensive regional development. However, this approach may further exacerbate ecological degradation. This creates a negative feedback loop.
Within the Chang–Zhu–Tan Metropolitan Area, the variation in MRSEI is primarily influenced by the level of human development. During this process, intense human interference exerts significant pressure on the ecological environment. The study illustrates that factor interaction analysis enhances the explanatory power (q-value) of influencing factors on MRSEI. Moreover, this finding demonstrates that single-factor analysis alone is insufficient to comprehensively reveal the underlying mechanisms. On the basis of the OPGD model, this approach combines methodological advantages with cross-disciplinary applicability. This study explored the driving factors based solely on data from 2022, reflecting static associations within that year rather than the causal mechanisms underlying dynamic changes over the past two decades. Future research is warranted to further investigate this issue.
5. Conclusions
Rooted in the GEE platform, this study introduces the RSEI and enhances it with the DI, resulting in a modified remote sensing ecological index. We used this index to analyze the EEQ of the Chang–Zhu–Tan Metropolitan Area over the past 20 years and its spatiotemporal characteristics. The main conclusions are as follows:
- (1)
- The MRSEI effectively integrates five key indicators: greenness, humidity, dryness, heat, and purity. It not only maintains a high correlation with RSEI but also mirrors the overall ecological status of the Chang–Zhu–Tan Metropolitan Area more clearly. Particularly in regions with frequent human activity, its evaluation results are more consistent with the actual situation. These findings demonstrate good applicability in ecological assessments at the metropolitan and urban cluster scale.
- (2)
- From 2002 to 2022, the EEQ remained overall good in the Chang–Zhu–Tan Metropolitan Area. The spatial distribution generally followed a pattern of “better in peripheral areas, worse in central areas”. The area of the Chang–Zhu–Tan Metropolitan Area with “excellent” and “good” EEQ accounted for more than 60% on average. The shift to a green development concept has transformed the city’s unregulated expansion model, ultimately leading to an overall MRSEI trend of decline followed by recovery in the study area.
- (3)
- Although some localized degradation has occurred, linear regression analysis suggests that the ecological environment of the study area has primarily ameliorated. Significant degradation is predominantly concentrated in the central urban areas with high levels of urbanization, large population density, and intensive industrial and agricultural activities. Ecological stability in these areas is characterized by high volatility and poor quality.
- (4)
- The OPGD analysis identified a 2 km grid as the optimal spatial scale for this study. This determination accounted for variations in the discretization methods and classification numbers of the driving factors. There is a significant difference in the contribution of driving factors to the evolution of EEQ. Notably, the interaction between natural and human factors has been increasingly pronounced, thereby amplifying their combined impact on ecological quality. Grounded in this finding, it is essential to adequately harness human agency, accurately balance ecological protection with economic development, and leverage projects such as comprehensive land remediation to optimize land spatial structures. This endeavor will be advantageous for us to facilitate gradual reinforcements and systematic restoration of regional ecological environments.
Author Contributions
Conceptualization, T.W. and M.C.; methodology, B.C.; software, X.W.; validation, T.W., H.W., and M.C.; formal analysis, B.C.; data curation, Z.S.; writing—original draft preparation, T.W.; writing—review and editing, T.W.; visualization, X.W.; supervision, H.W.; project administration, M.C.; funding acquisition, M.C. All authors have read and agreed to the published version of the manuscript.
Funding
This research was funded by the China Geological Survey Project (Grant No. DD20230527).
Data Availability Statement
The authors can provide the data upon reasonable request. The data is not publicly available due to privacy restrictions.
Acknowledgments
The authors are particularly grateful to all researchers for providing data support for this study.
Conflicts of Interest
The authors declare no conflicts of interest.
References
- Mathivanan, M.; Duraisekaran, E. Identification and quantification of localized urban heat island intensity and footprint for Chennai Metropolitan Area during 1988–2023. Environ. Monit. Assess. 2024, 197, 91. [Google Scholar] [CrossRef] [PubMed]
- Jin, A.; Li, H. Spatiotemporal assessment of ecological quality and driving mechanisms in the Beijing metropolitan area. Sci. Rep. 2025, 15, 13136. [Google Scholar] [CrossRef] [PubMed]
- Luo, W.; Bai, H. Urbanization-induced ecological degradation in Midwestern China: An analysis based on an improved ecological footprint model. Resour. Conserv. Recycl. 2018, 137, 113–125. [Google Scholar] [CrossRef]
- Bao, C.; He, D. Scenario Modeling of Urbanization Development and Water Scarcity Based on System Dynamics: A Case Study of Beijing–Tianjin–Hebei Urban Agglomeration, China. Int. J. Environ. Res. Public Health 2019, 16, 3834. [Google Scholar] [CrossRef]
- Huang, H.; Chen, W. Analysis of ecological quality in Lhasa Metropolitan Area during 1990–2017 based on remote sensing and Google Earth Engine platform. J. Geogr. Sci. 2021, 31, 265–280. [Google Scholar] [CrossRef]
- Li, J.; Gong, J. Assessment of Urban Ecological Quality and Spatial Heterogeneity Based on Remote Sensing: A Case Study of the Rapid Urbanization of Wuhan City. Remote Sens. 2021, 13, 4440. [Google Scholar] [CrossRef]
- Xu, C.; Li, B. Spatial-temporal variation, driving mechanism and management zoning of ecological resilience based on RSEI in a coastal metropolitan area. Ecol. Indic. 2024, 158, 111447. [Google Scholar] [CrossRef]
- Elmqvist, T.; Andersson, E. Sustainability and resilience for transformation in the urban century. Nat. Sustain. 2019, 2, 267–273. [Google Scholar] [CrossRef]
- Guo, M.; Zheng, H. Developing multiscale landscape planning to mitigate ecological risks: A case study in Nanjing metropolitan area, China. Environ. Impact Assess. Rev. 2024, 108, 107601. [Google Scholar] [CrossRef]
- Zhang, T.; Hu, Y. Spatiotemporal changes and influencing factors of ecosystem services in the Nanchang metropolitan area, China. Front. Ecol. Evol. 2024, 12, 1470912. [Google Scholar] [CrossRef]
- Ermida, S.L.; Soares, P. Google Earth Engine Open-Source Code for Land Surface Temperature Estimation from the Landsat Series. Remote Sens. 2020, 12, 1471. [Google Scholar] [CrossRef]
- Estoque, R.C. A Review of the Sustainability Concept and the State of SDG Monitoring Using Remote Sensing. Remote Sens. 2020, 12, 1770. [Google Scholar] [CrossRef]
- Xu, H.; Wang, M. Prediction of ecological effects of potential population and impervious surface increases using a remote sensing based ecological index (RSEI). Ecol. Indic. 2018, 93, 730–740. [Google Scholar] [CrossRef]
- Peng, W.; Kuang, T. Quantifying influences of natural factors on vegetation NDVI changes based on geographical detector in Sichuan, western China. J. Clean. Prod. 2019, 233, 353–367. [Google Scholar] [CrossRef]
- Huang, S.; Tang, L. A commentary review on the use of normalized difference vegetation index (NDVI) in the era of popular remote sensing. J. For. Res. 2021, 32, 2719. [Google Scholar] [CrossRef]
- Wang, J.; Wang, W. Soil Moisture and Salinity Inversion Based on New Remote Sensing Index and Neural Network at a Salina-Alkaline Wetland. Water 2021, 13, 2762. [Google Scholar] [CrossRef]
- Hu, X.; Xu, H. A new remote sensing index for assessing the spatial heterogeneity in urban ecological quality: A case from Fuzhou city, China. Ecol. Indic. 2018, 89, 11–21. [Google Scholar] [CrossRef]
- Jiang, J.; Tian, G. Analysis of the impact of Land use/Land cover change on Land Surface Temperature with Remote Sensing. Procedia Environ. Sci. 2010, 2, 571–575. [Google Scholar] [CrossRef]
- Li, Z.-L.; Tang, B.-H. Satellite-derived land surface temperature: Current status and perspectives. Remote Sens. Environ. 2013, 131, 14–37. [Google Scholar] [CrossRef]
- Wang, J.; Liu, D. Development of a large-scale remote sensing ecological index in arid areas and its application in the Aral Sea Basin. J. Arid. Land 2021, 13, 40–55. [Google Scholar] [CrossRef]
- Lu, Y.; Li, J. Evaluating Sustainable Development in the Middle and Lower Reaches of the Yellow River Basin Using Multiple Data Sources. IEEE Trans. Geosci. Remote Sens. 2025, 63, 4502116. [Google Scholar] [CrossRef]
- Chen, W.; Wang, J. Detecting Long-Term Series Eco-Environmental Quality Changes and Driving Factors Using the Remote Sensing Ecological Index with Salinity Adaptability (RSEISI): A Case Study in the Tarim River Basin, China. Land 2023, 12, 1309. [Google Scholar] [CrossRef]
- Cai, C.; Li, J. Long-Term Ecological and Environmental Quality Assessment Using an Improved Remote-Sensing Ecological Index (IRSEI): A Case Study of Hangzhou City, China. Land 2024, 13, 1152. [Google Scholar] [CrossRef]
- Zhang, X.; Fan, H. Identifying regional eco-environment quality and its influencing factors: A case study of an ecological civilization pilot zone in China. J. Clean. Prod. 2024, 435, 140308. [Google Scholar] [CrossRef]
- Feng, H.; Feng, Z.; Feng, H. One New Method of PM2.5 Concentration Inversion Based on Difference Index. Spectrosc. Spectr. Anal. 2018, 38, 3012–3016. [Google Scholar] [CrossRef]
- Wang, Y.; Liu, P.; Liu, J.; Zhang, D.; Wang, L.; Huang, L. Analysis of spatiotemporal changes in ecological environment quality of the yellow river delta based on modified remote sensing ecological index. J. Ecol. Rural Environ. 2024, 40, 1179–1190. [Google Scholar] [CrossRef]
- Wang, J.-F.; Zhang, T.-L. A measure of spatial stratified heterogeneity. Ecol. Indic. 2016, 67, 250–256. [Google Scholar] [CrossRef]
- Geng, J.; Yu, K. Analysis of Spatiotemporal Variation and Drivers of Ecological Quality in Fuzhou Based on RSEI. Remote Sens. 2022, 14, 4900. [Google Scholar] [CrossRef]
- Wang, J.F.; Li, X.H. Geographical Detectors-Based Health Risk Assessment and its Application in the Neural Tube Defects Study of the Heshun Region, China. Int. J. Geogr. Inf. Sci. 2010, 24, 107–127. [Google Scholar] [CrossRef]
- Wang, J.-F.; Hu, Y. Environmental health risk detection with GeogDetector. Environ. Model. Softw. 2012, 33, 114–115. [Google Scholar] [CrossRef]
- Ju, H.; Zhang, Z. Driving forces and their interactions of built-up land expansion based on the geographical detector—A case study of Beijing, China. Int. J. Geogr. Inf. Sci. 2016, 30, 2188–2207. [Google Scholar] [CrossRef]
- Song, T.; Cheng, Y. Spatial difference and mechanisms of influence of geo-economy in the border areas of China. J. Geogr. Sci. 2017, 27, 1463–1480. [Google Scholar] [CrossRef]
- Zuo, S.; Dai, S. Determining the Mechanisms that Influence the Surface Temperature of Urban Forest Canopies by Combining Remote Sensing Methods, Ground Observations, and Spatial Statistical Models. Remote Sens. 2018, 10, 1814. [Google Scholar] [CrossRef]
- Gao, F.; Li, S. Understanding the modifiable areal unit problem in dockless bike sharing usage and exploring the interactive effects of built environment factors. Int. J. Geogr. Inf. Sci. 2021, 35, 1905–1925. [Google Scholar] [CrossRef]
- Liu, C.; Li, W. Quantitative spatial analysis of vegetation dynamics and potential driving factors in a typical alpine region on the northeastern Tibetan Plateau using the Google Earth Engine. CATENA 2021, 206, 105500. [Google Scholar] [CrossRef]
- Song, Y.; Wang, J. An optimal parameters-based geographical detector model enhances geographic characteristics of explanatory variables for spatial heterogeneity analysis: Cases with different types of spatial data. GISci. Remote Sens. 2020, 57, 593–610. [Google Scholar] [CrossRef]
- Yi, C.; Wang, Z. Study on the Coupling Degree of Urban Virtual and Substantive Vitality from the Perspective of “Scale-Vitality”—Taking the Changsha-Zhuzhou-Xiangtan Metropolitan Area as an Example. Sustainability 2025, 17, 5059. [Google Scholar] [CrossRef]
- Ghosh, S.; Kumar, D. Cloud-based large-scale data retrieval, mapping, and analysis for land monitoring applications with Google Earth Engine (GEE). Environ. Chall. 2022, 9, 100605. [Google Scholar] [CrossRef]
- Liu, L.; Jensen, M.B. Green infrastructure for sustainable urban water management: Practices of five forerunner cities. Cities 2018, 74, 126–133. [Google Scholar] [CrossRef]
- Yang, X.; Meng, F. Spatiotemporal change and driving factors of the Eco-Environment quality in the Yangtze River Basin from 2001 to 2019. Ecol. Indic. 2021, 131, 108214. [Google Scholar] [CrossRef]
- Shi, C.; Zhu, X. Assessment of urban ecological resilience and its influencing factors: A case study of the Beijing-Tianjin-Hebei urban agglomeration of China. Land 2022, 11, 921. [Google Scholar] [CrossRef]
- Chai, H.; Zhao, Y. Analysis of Ecological Environment in the Shanxi Section of the Yellow River Basin and Coal Mining Area Based on Improved Remote Sensing Ecological Index. Sensors 2024, 24, 6560. [Google Scholar] [CrossRef] [PubMed]
- Yan, J.; Zhang, G. Comparison of time-integrated NDVI and annual maximum NDVI for assessing grassland dynamics. Ecol. Indic. 2022, 136, 108611. [Google Scholar] [CrossRef]
- Estoque, R.C.; Murayama, Y. Effects of landscape composition and pattern on land surface temperature: An urban heat island study in the megacities of Southeast Asia. Sci. Total Environ. 2017, 577, 349–359. [Google Scholar] [CrossRef]
- Zheng, Z.; Wu, Z. Exploration of eco-environment and urbanization changes in coastal zones: A case study in China over the past 20 years. Ecol. Indic. 2020, 119, 106847. [Google Scholar] [CrossRef]
- An, M.; Xie, P. Local and tele-coupling development between carbon emission and ecologic environment quality. J. Clean. Prod. 2023, 394, 136409. [Google Scholar] [CrossRef]
- Li, W.; Samat, A. Spatiotemporal Pattern, Evolutionary Trend, and Driving Forces Analysis of Ecological Quality in the Irtysh River Basin (2000–2020). Land 2024, 13, 222. [Google Scholar] [CrossRef]
- Zhang, X.; Gao, Z. Eco-Environment Quality Response to Climate Change and Human Activities on the Loess Plateau, China. Land 2023, 12, 1792. [Google Scholar] [CrossRef]
- Ding, Y.; Zhang, M. Using the geographical detector technique to explore the impact of socioeconomic factors on PM2.5 concentrations in China. J. Clean. Prod. 2019, 211, 1480–1490. [Google Scholar] [CrossRef]
- Luo, L.; Mei, K. Assessment of the Geographical Detector Method for investigating heavy metal source apportionment in an urban watershed of Eastern China. Sci. Total Environ. 2019, 653, 714–722. [Google Scholar] [CrossRef]
- Duan, Q.; Tan, M. Using a geographical detector to identify the key factors that influence urban forest spatial differences within China. Urban For. Urban Green. 2020, 49, 126623. [Google Scholar] [CrossRef]
- Zhao, X.; Tan, S. Quantitative analysis of fractional vegetation cover in southern Sichuan urban agglomeration using optimal parameter geographic detector model, China. Ecol. Indic. 2024, 158, 111529. [Google Scholar] [CrossRef]
- Zhu, L.; Meng, J. Applying Geodetector to disentangle the contributions of natural and anthropogenic factors to NDVI variations in the middle reaches of the Heihe River Basin. Ecol. Indic. 2020, 117, 106545. [Google Scholar] [CrossRef]
Disclaimer/Publisher’s Note: The statements, opinions and data contained in all publications are solely those of the individual author(s) and contributor(s) and not of MDPI and/or the editor(s). MDPI and/or the editor(s) disclaim responsibility for any injury to people or property resulting from any ideas, methods, instructions or products referred to in the content. |
© 2025 by the authors. Licensee MDPI, Basel, Switzerland. This article is an open access article distributed under the terms and conditions of the Creative Commons Attribution (CC BY) license.