Abstract
Many cities worldwide face decline due to mineral-resource exhaustion, with mining-induced subsidence and land degradation posing urgent land use challenges. At the same time, carbon neutrality has become a global agenda, promoting ecological restoration, emissions reduction, and green transformation in resource-exhausted cities. However, empirical evidence on how carbon neutrality strategies drive land use transition remains scarce. Taking Xuzhou, China, as a case study, we integrate the GeoSOS–FLUS land use simulation model with a Markov chain model to project land use patterns in 2030 under three scenarios: natural development (ND), land recovery (LR), and carbon neutrality (CN). Using emission factors and a land use carbon inventory, we quantify spatial distributions and temporal shifts in carbon emission and sequestration. Results show that LR’s rigid recovery policies restrict broader transitions, while the CN scenario effectively reshapes land use by enhancing the competitiveness of low-carbon types such as forests and new-energy land. Under CN, built-up land expansion is curbed, forests and new-energy land are maximized, and emissions fall by 4.95% from 2020. Carbon neutrality offers opportunities for industrial renewal and ecological restoration in resource-exhausted cities, steering transformations toward approaches that balance ecological function and carbon benefits. Long-term monitoring is required to evaluate policy sustainability and effectiveness.
1. Introduction
Resource-extracted cities worldwide are facing unprecedented pressure to transform. According to the World Cities Report 2022 by UN-Habitat [1], more than 1200 cities are facing multiple related predicaments—economic decline, ecological degradation, and intensified social conflicts—owing to the exhaustion of mineral resources. In China, among 69 resource-exhausted cities, roughly 40% of mining areas have experienced land subsidence, water pollution, and biodiversity loss as a result of prolonged extraction of resources, directly threatening regional sustainability [2].
Extensive coal mining has left significant environmental and land-system problems in many resource-based regions. Mining activities directly damage surface vegetation and topsoil, resulting in substantial losses of carbon pools and a marked reduction in the productivity of terrestrial ecosystems. Recent studies have shown that mining-induced disturbances suppress vegetation growth and weaken regional carbon-sequestration functions; for example, net primary productivity declines sharply in areas subject to prolonged excavation or high-intensity human intervention, and the influence may extend hundreds of meters beyond the mining boundary [3]. In addition to degradation of carbon-sequestration, mining also triggers a series of physical and ecological impacts, including land subsidence, soil erosion, hydrological disruption, and increased landscape fragmentation [4]. These processes often produce large tracts of unused or degraded land that remain ecologically fragile long after resource extraction ends, constraining sustainable regional development [5]. Furthermore, the spatial pattern of land use in mining cities becomes highly unstable, with recurrent transitions among construction land, industrial land, and abandoned surfaces, thereby exacerbating environmental stress [6]. Collectively, the existing research has clearly demonstrated that mining activities fundamentally alter land systems, diminish ecological functions, and generate long-term carbon and landscape challenges that demand systematic assessment and effective policy responses.
In response to the extensive ecological degradation caused by mining, many resource-dependent cities have initiated large-scale restoration efforts aimed at stabilizing landscapes and recovering ecosystem functions [7,8,9]. Existing studies on land cover dynamics reveal that, following the cessation or reduction in mining activities, portions of abandoned land have gradually transitioned toward forests, grasslands, and other ecological land types, supported by national and local investments in environmental rehabilitation [10]. For instance, restoration projects have been shown to reduce landscape fragmentation [11] and enhance vegetation stability [12], demonstrating the ecological potential of mined land when properly managed. These interventions indicate that mining landscapes are not inherently irreversible; rather, they possess the capacity for ecological succession and functional recovery once disturbance pressures diminish [13]. Nevertheless, the dominant approach in earlier restoration policies emphasized converting mining land into pre-mining status, mainly cropland, a strategy that has proven difficult to implement [14]. Many post-mining sites suffer from soil contamination, poor fertility, hydrological disturbance, or geomorphological instability [15], making agricultural reclamation both technically challenging and economically inefficient. As a result, such cropland-oriented restoration often fails to meet broader ecological and developmental goals. This mismatch underscores the necessity of rethinking restoration models and exploring new pathways better aligned with contemporary environmental, economic, and sustainability demands.
Since the 2015 Paris Agreement, over 130 countries have committed to achieving net-zero emissions by the middle of this century. China has set the targets of peaking carbon emissions by 2030 and achieving carbon neutrality by 2060. These targets not only require reduced reliance on fossil fuels but also emphasize enhancing the carbon-sink capacity through ecosystem restoration, green infrastructure investment, and land use optimization. Practically, carbon neutrality actions operate along three dimensions [16]: spatial restructuring (e.g., afforestation and reclamation of mined land), industrial substitution (e.g., development of renewable resources to replace traditional mining industries), and institutional innovation (e.g., carbon markets and ecological compensation). These measures are intrinsically linked to land systems, that is, land functions both as the spatial carrier of carbon sources (for example, the expansion of built-up land intensifies energy consumption) and as the principal medium of carbon sinks (for example, forests and wetlands sequester carbon). Accordingly, carbon neutrality can be understood as a cross-scale policy-space-industry coordination mechanism that provides value orientation and practical tools for guiding land use transitions.
As a central agenda of global climate governance, carbon neutrality offers new opportunities for transforming resource-dependent cities. In this context, integrating carbon-neutral objectives into land use planning may provide a strategic pathway to overcome the limitations of conventional reclamation and support coordinated low-carbon and ecological development. Within mining cities, the pursuit of carbon neutrality therefore requires more than conventional ecological restoration; it necessitates a fundamental restructuring of land systems to reorient spatial patterns toward low-carbon development [17]. This shift highlights the need for land use transition models capable of capturing how different policy pathways—such as reallocating mining land to forests, grasslands, or renewable-energy uses—reshape future carbon sequestration capacity and urban development trajectories [18]. Consequently, integrating carbon-neutral objectives into scenario-based land use simulations become essential for evaluating the long-term sustainability of resource-exhausted cities.
To address this gap, in this study, we took the mining areas in Xuzhou—a representative resource-exhausted city—as a case study. Based on land use data for 2010 and 2020, we applied the Geographical Simulation and Optimization System-future land use simulation model (GeoSOS-FLUS) model to simulate land use patterns in 2030 under three scenarios, namely, natural development (ND), land recovery (LR), and carbon neutrality (CN), and we combined an emission factor approach with a land use carbon inventory to evaluate net carbon emissions under each scenario. The objectives of this study were to (1) assess how the different scenarios affect the land use structure; (2) characterize the spatiotemporal patterns of the land use carbon emissions under multiple scenarios; and (3) elucidate the driving role of carbon neutrality strategies in land use transition, thereby providing scientific support for the low-carbon transition process and sustainable development of coal resource-exhausted cities.
2. Selection of Research Area
Xuzhou is located in the southeastern part of the Huang–Huai–Hai Plain (116°22′–118°40′ E, 33°43′–34°58′ N) and serves as a sub-provincial central city of Jiangsu Province. It administers five districts—Yunlong, Gulou, Quanshan, Tongshan, and Jiawang—with a total area of 306,277 ha and a permanent population of approximately 3.064 million in 2020. The land use in the region is dominated by cropland, and it is supported by favorable natural conditions and abundant mineral resources, particularly coal. The Xuzhou coalfield covers more than 140,000 ha, has a proven coal-bearing area of about 73,550 ha, and contains mineable seams that are 7–8 m thick. The industrial reserves account for 93% of Jiangsu Province’s total. The urban area currently contains 35 closed coal mines. The location of the study area and the distribution of the closed mines in the region are shown in Figure 1.
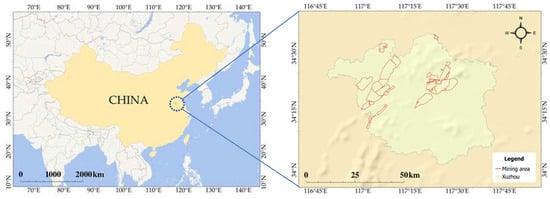
Figure 1.
Location of the study area and distribution of closed coal mines.
Since the 1990s, Xuzhou’s coal resources have been gradually depleted, placing significant pressure on industrial transformation. After 2010, all the coal mines within the urban area ceased production and were subsequently closed, leaving behind large tracts of idle and abandoned industrial–mining land. Prolonged, high-intensity extraction has cumulatively caused 20,000 ha of coal-mining subsidence (about 3% of the municipal area), affecting 118 villages and forcing the relocation of more than 100,000 residents. The land subsidence and ecological degradation in this area have become increasingly severe, thereby constraining the sustainable development of the urban space (Figure 2). The decline of the mining industry has not only fragmented the land use but has also underscored the urgency of Xuzhou’s transformation as a resource-exhausted city. Land reclamation, ecological restoration, and the introduction of new types of land use will be key pathways for advancing urban renewal and development.
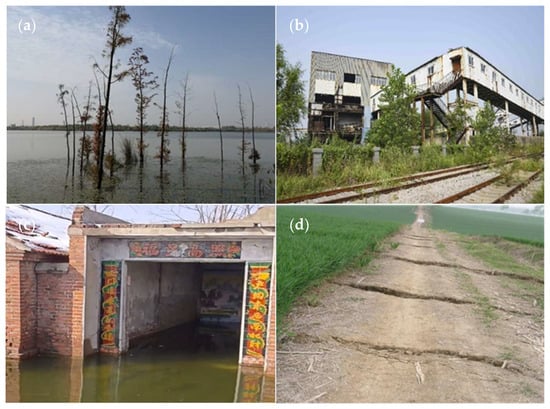
Figure 2.
(a) Subsidence waterbody, (b) abandoned industrial yard, (c) damaged village, and (d) degraded cropland in the study area after mine closure.
3. Materials and Methods
3.1. Data Sources
The data used in this study included natural environmental elements, land use information, and socio-economic indicators. The major data sources included the Data Center for Resources and Environmental Sciences (resdc.cn), Geospatial Data Cloud, Geographic Monitoring Cloud (dsac.cn), OpenStreetMap, and statistical yearbooks (Table 1).

Table 1.
Data types and sources.
The land use data for 2010 and 2020 utilized in this study are based on the classification standards of the Third National Land Survey of China and were integrated and reclassified according to the actual conditions of the study area and the research needs. The land use types were unified into eight classes: cropland, forestland, grassland, water bodies, built-up land, unused land, mining land, and new energy land.
All the vector data were converted into raster data using the ArcGIS PRO 3.0 software and were resampled to a uniform spatial resolution of 30 × 30 m.
To ensure spatial consistency, the coordinate reference system was unified to CGCS2000_3_Degree_GK_Zone_39, and all the raster data were clipped and aligned to the same spatial extent.
3.2. Research Framework
In this paper, the research framework comprises four modules: (1) scenario design; (2) objective optimization and constraints; (3) land use simulation; and (4) carbon-effect assessment and comparison. Three pathways (ND, LR, and CN) are defined to reflect Xuzhou’s coal resource-exhausted context and the national dual-carbon strategy, thereby clarifying the intended land use directions under distinct policy and protection regimes. Using the 2010–2020 land use change features and constraints from mine boundaries, permanent basic cropland, and ecological protection redlines, the optimization module calibrates the transition probabilities and produces a binary transition-cost matrix to achieve optimized allocation of the land quantity and structure. The GeoSOS-FLUS model then simulates the spatial patterns in 2030 under the ND, LR, and CN scenarios by integrating neighborhood factors, multi-source driving factors, and restriction layers. The accuracy is verified using the figure of merit (FoM) coefficient. Finally, land use emission factors are applied to quantify the emissions, sequestration, and net carbon of the cropland, forestland, grassland, water bodies, built-up land, mining land, and new energy land, and scenario-specific maps of the net emissions and carbon stocks are compared to inform decisions on carbon peaking and carbon neutrality (Figure 3).
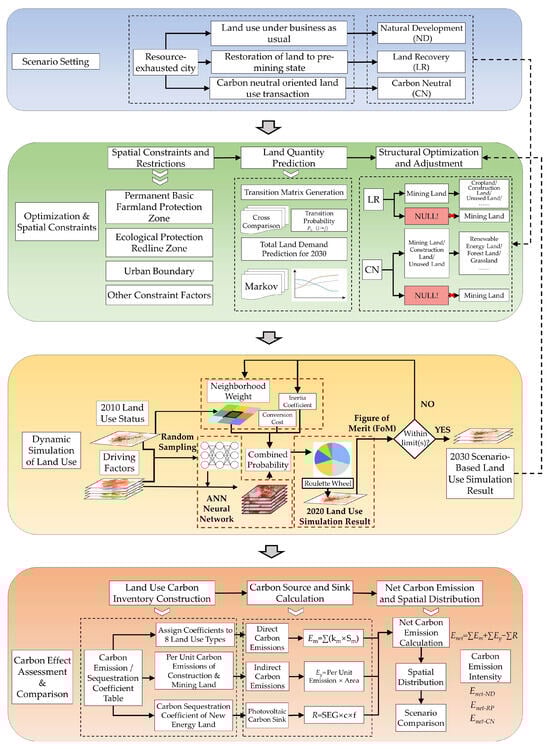
Figure 3.
Research framework for land use transition and carbon emission assessment in the coal resource-exhausted city.
3.3. Research Methods
3.3.1. Scenario Setting
Three land use transition scenarios (ND, LR, and CN) are defined. Under the ND scenario, historical land transfers and spatial drivers continue without policy or human intervention, excluding the influence of urban planning and protection policies [19]; and the GeoSOS-FLUS model projects the future scale of each category under the natural conditions. The LR scenario prioritizes ecological restoration with rigid constraints (mine reclamation and permanent basic cropland protection), emphasizing the restoration of the mining land to its pre-mining land use types, such as cropland and water bodies, while strictly prohibiting the conversion of any other land use type to mining land, thereby reflecting the high level of control required in resource-exhausted areas. The CN scenario embeds China’s 2030 carbon peaking and 2060 carbon neutrality goals into spatial regulation: it reduces the conversion of cropland, grassland, and forestland to high-carbon classes (built-up land and mining land), increases their conversion to forestland, and encourages the conversion of mining land to new energy land. Furthermore, it overlays ecological redlines and negative lists, curbs the expansion of built-up land, implements cropland-to-forest/grassland programs, lowers the probability of cropland being converted to built-up land (diverting the unconverted portion to forestland), decreases the conversion of grassland and forestland to built-up land, and increases the conversion of cropland, grassland, and unused land to forestland. In the CN scenario, only the conversion of mining land to new energy land is allowed, and no other category can convert to mining land.
A binary transfer cost matrix (0 = prohibited; 1 = allowed) encodes these rules (Table 2). Under the ND scenario, built-up land can only be converted to mining land; new energy land cannot be converted to other land use types and is not a target of conversion. There are no other restrictions under this scenario. Under the LR scenario, the conversion of all the land use types, except built-up land, to mining land is prohibited. Under the CN scenario, forestland can only be converted to new energy land; grassland can only be converted to forestland, water bodies, and new energy land; and all the other land use types can be converted to new energy land. Under the LR and CN scenarios, permanent basic cropland and ecological redlines are added as restricted zones. These constraints reflect the carbon and ecological priorities of each scenario. In particular, forestland is preserved as a high-carbon sequestration area, and “conversion” to new energy land does not involve tree removal but rather co-location of solar installations at heights that allow normal tree growth. Grassland conversion is limited to forest, water, or new energy land to maintain ecological function, while other land types can flexibly support renewable energy development.
Table 2.
Land use conversion cost matrix.
3.3.2. Simulation of Land Use
In this paper, we use the GeoSOS-FLUS model to simulate the spatial patterns in 2030 under the ND, LR, and CN scenarios. An artificial neural network (ANN) is trained using the land use data and observed transitions in 2010 to learn the conversion probability functions. The drivers include the slope, elevation, population density, gross domestic product (GDP) density, distance to roads, and distance to mining areas. The neighborhood factors capture each category’s spatial expansion capability, and the transfer cost matrix and restricted zones jointly define the simulation boundaries. The workflow couples an ANN-based suitability surface with a cellular automata (CA) module [20]; and using inertia factors and a roulette mechanism, grid cells are allocated to approach the Markov target structure. The accuracy of the model is verified using the FoM coefficient [21,22,23]. If the accuracy is not sufficient, the parameters are retuned and re-simulated.
The neighborhood factor parameters (0–1) represent the expansion intensity (higher values indicate stronger expansion). Following the methodology of previous research [24], changes in the patch area are used as a proxy for the intensity.
where Xi is the neighborhood weight parameter of the ith land use category; TAi is the expansion area of the i-th category; TAmin is the minimum expansion area among all of the categories; and TAmax is the maximum.
Combined with the study area’s actual conditions, multiple parameter experiments are conducted, and the simulation results are compared. The final neighborhood factor parameters for the three scenarios are presented in Table 3.
Table 3.
Neighborhood factor parameters.
3.3.3. Model Evaluation
To ensure the reliability of the FLUS-based land use simulation, three quantitative indicators commonly used in LULC model assessment—Overall Accuracy (OA), Kappa coefficient, and Figure of Merit (FOM)—were employed to evaluate model performance [25]. The OA and Kappa coefficient were derived from the confusion matrix between simulated and actual land use maps. OA reflects the proportion of correctly classified pixels, while the Kappa coefficient further accounts for agreement occurring by chance:
where
- is the number of correctly simulated pixels for type i,
- is the number of pixels classified as type i in the actual map and type j in the simulated map
- and are row and column sums,
- and is the total number of pixels.
In addition, the Figure of Merit (FOM) was applied to evaluate the accuracy of land use change simulation, which is especially important for dynamic land transitions:
where:
A is the error due to observed change predicted as persistence,
B is the correctly predicted change,
C is the error due to predicted change that did not occur,
D is the error due to predicting the wrong type of change.
To further verify the robustness of the land use simulation, we compared the predicted 2020 land use areas under the ND scenario with the official 2020 municipal-level land use statistics [26]. The relative error for each land use type was calculated as:
where Ai represents the simulated area of land use type i, and Bi represents the corresponding area reported in the official statistical data. This index reflects the proportional deviation between the simulated and official datasets. If the ERROR value for most category remains within 10%, we consider the simulation results to exhibit an acceptable level of accuracy and reliability. ERROR above 10% can also be reliable if supported by reasonable explanations.
3.3.4. Carbon Effect Assessment and Comparison
Using each scenario’s 2030 land use map, we construct a land use carbon inventory to quantify the carbon sources and sinks. The cropland, forestland, grassland, water bodies, and unused land are evaluated using the direct emission/sequestration coefficient method. Built-up land and mining land were evaluated for their indirect carbon emission intensity based on the 2020 per-unit-area carbon emission coefficient. The new energy land is evaluated by avoided emissions related to coal power. We then integrate the category-level emissions and sequestration into a scenario-based net carbon emission model and prepare GIS data for spatial visualization.
Direct emissions use the following:
where Em is the direct carbon emissions from land use (t); em is the carbon emissions from each land category (t); and Sm and km are the area (ha) and carbon emission (absorption) coefficient (t/ha) for category m, respectively. Emissions are defined as positive, and sequestration is defined as negative.
Based on Xuzhou’s conditions and previous studies [27], the coefficients (t/ha) are as follows: cropland (0.422), forestland (−0.581), grassland (−0.021), water bodies (−0.230), and unused land (−0.005).
The indirect emissions from built-up land and mining land are derived from energy use across 11 energy types: raw coal, cleaned coal, coke, fuel oil, kerosene, diesel, gasoline, natural gas, liquefied natural gas, liquefied petroleum gas, and other petroleum products.
where Ey is the indirect carbon emissions (t); mi, φi, and ni are the consumption of the ith energy type (t), its carbon emission coefficient, and its standard coal conversion coefficient, respectively; and n = 11.
The factors follow the 2006 Intergovernmental Panel on Climate Change (IPCC) Guidelines, China Energy Statistical Yearbook, and General Principles for Comprehensive Energy Consumption Calculation. Due to a lack of future energy data, we adopt the 2020 per-area coefficients and assume that they remain the same in 2030: built-up land (181.49 t/ha) and mining land (219.54 t/ha).
For new energy land (PV), the emissions voided during operation are calculated as follows:
where R is the avoided CO2 emissions (t), SEG is the PV generation (kWh), c = 0.0003 t/kWh (standard coal per kWh in coal power), and f = 2.46 t/t (emissions per ton of standard coal). The PV generation capacity is calculated as follows:
where SA is the PV land area (ha); AF is the solar radiation area factor (0.35); ASR is the annual solar radiation per unit area (4300 MJ/m2 for Xuzhou); PE is the PV panel efficiency (16.5%); L0 is the loss rate (7.5%); and AP is the curtailment rate (1.8%).
Employing the method utilized for the built-up land and mining land, the per-area carbon emission coefficient for the new energy land is calculated to be −462.41 t/ha.
4. Results
4.1. Accuracy of the Simulation
To assess the reliability of the GeoSOS-FLUS model in simulating land use patterns in Xuzhou, we compared the simulated 2020 land use map with the actual 2020 land use data. Visual inspection indicates that the model effectively reproduces the spatial distribution of major land types, preserves patch structures, and captures the main land transitions, including areas of urban expansion, forest growth, and mining land reduction.
For a quantitative assessment, we calculated several commonly used accuracy metrics (Table 4). The Overall Accuracy (OA) and Kappa coefficient exceed the widely accepted threshold of 0.80, demonstrating strong agreement between the simulated and observed land use patterns. The Figure of Merit (FOM), which evaluates the degree of correctly simulated change relative to observed change, is slightly lower than OA and Kappa, as is typical in land use change studies, but it remains within the range considered acceptable in recent GeoSOS-FLUS applications.
Table 4.
GeoSOS-FLUS model evaluation metrics for simulation of land use in 2020.
These evaluation results indicate that the FLUS model reliably captures both the static spatial patterns and dynamic land transitions in Xuzhou. The model’s ability to reproduce the major trends and spatial arrangements of land use provides a solid foundation for scenario-based forecasting for 2030, ensuring that subsequent analyses of carbon emissions, carbon sinks, and low-carbon land use transitions are based on credible spatial simulations.
In addition to the pixels-based evaluation metrics, we further compared the simulated 2020 land use areas with the official municipal-level land use statistics to evaluate the consistency of land use quantities (Table 5). A total-area comparison was also conducted to assess the overall agreement between simulated and official data. Since unused land, mining land, and new energy land are research-specific categories not explicitly reported in the official dataset—and their areas are relatively small and generally integrated into categories such as other land, construction land, or garden land. Therefore, unused land, mining land, and new energy land were excluded from the area-based comparison.
Table 5.
Comparison between simulated 2020 land use areas and official municipal statistics, and corresponding ERROR values.
Among the major land use categories with substantial area such as cropland, forest land, and construction land exhibit ERROR values lower than 10%, indicating strong consistency between simulated and official data. The ERROR value of grass land slightly exceeds 10%, primarily because the official statistics introduce a garden land category that reallocates part of the grassland area, resulting in a systematic difference. The water area shows a higher deviation (30.18%), largely due to the exclusion of the northern Weishan Lake section from the official statistical boundary, which leads to an underestimation of the official water area. The total-area ERROR of 7.36% further demonstrates that the simulation maintains an acceptable level of quantitative accuracy at the aggregated scale. Overall, the comparison confirms that the simulation results are quantitatively reliable and consistent with official statistics, despite explainable deviations in a few categories.
4.2. Land Use Change from 2010 to 2020
According to the results of the land use transfer matrix analysis (Figure 4), between 2010 and 2020, the most notable changes in the study area occurred in the cropland and built-up land. In 2010, cropland was the dominant land category, while built-up land and water bodies formed the secondary components of the landscape structure. By 2020, cropland still occupied the largest share, but its proportion had noticeably declined, whereas built-up land and water bodies expanded their shares, indicating a shift toward more intensive land use.
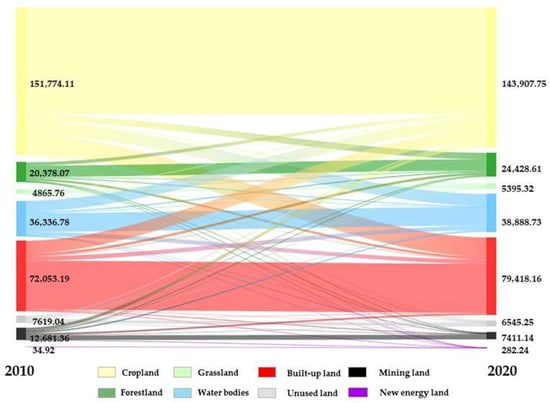
Figure 4.
Sankey map of the land use transition matrix for the study area from 2010 to 2020 (ha).
The area of cropland exhibited a decreasing trend, shrinking by 7866.36 ha. It was also the land category with the largest total area transferred out, with 33,441.84 ha converted into other land use types. Of this area, 13.06% was converted to built-up land and 8.10% was converted to water bodies. This corresponds to a cropland transfer-out rate of 27.42%, with built-up land being the dominant receiver (13.06% of all cropland transfers).
The area of built-up land exhibited an increasing trend, expanding by 7364.97 ha, primarily via the conversion of cropland. Built-up land showed the highest net growth rate among all categories (30.43%), with 69.57% of its newly added area originating from cropland.
The area of mining land decreased by 5270.22 ha, and most of the area lost was converted to built-up land (790.38 ha) and cropland (752.85 ha). Mining land showed a high transfer-out proportion (62.04%), reflecting the accelerated phase-out of mining activities during this period.
Overall, from 2010 to 2020, the cropland, mining land, and unused land were primarily net sources (converted to other categories), while the forestland, built-up land, grassland, and water bodies were primarily net sinks (increases in area via conversion from other categories). These patterns reveal a clear trend of urban expansion, ecological restoration of forest and grassland, and the gradual withdrawal of mining land, consistent with the region’s long-term development and land management policies.
4.3. Land Use Pattern in 2030 Under ND/LR/CN Scenarios
Using the land use data for 2010–2020, the land use distribution in 2020 was simulated and compared with the actual land use in 2020. The FoM coefficient, which more effectively reflects the simulation accuracy, was used to conduct model evaluation. The calculated FoM coefficient was 0.053, indicating that the FLUS model achieved a high accuracy and is suitable for simulating future land use in the study area.
Based on the calculations, Figure 5 illustrates the land use structures and key transition patterns under the ND, LR, and CN scenarios. As shown in Figure 5a, cropland remains the dominant land category across all scenarios, with proportions ranging from 45.96% to 46.89% in 2030, slightly lower than 2020 (47.72%). Forestland shows a steady increase, with the CN scenario achieving the highest share (9.27%). Water bodies and grassland maintain relatively stable proportions with marginal increases. Built-up land expands notably under ND and LR (27.14% and 27.10%, respectively), while CN effectively restricts its growth (25.96%). Mining land experiences substantial shrinkage in all scenarios, particularly under LR (1.10%) and CN (1.28%), compared with 2.41% in 2020. New-energy land remains unchanged under ND and LR (0.09%) but doubles under CN (0.18%).
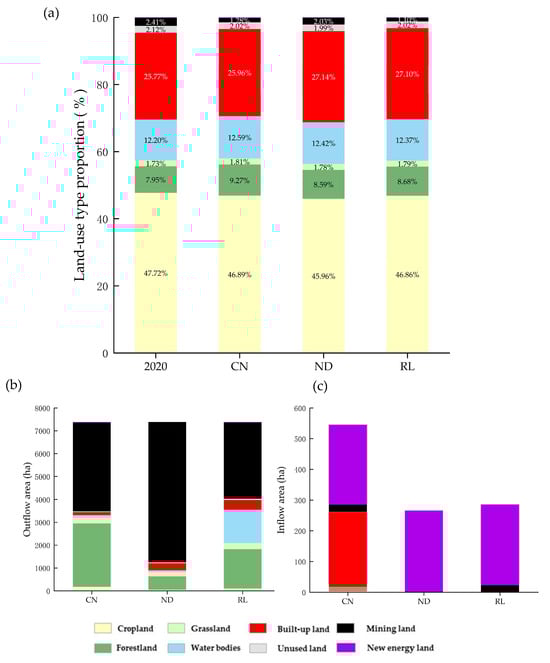
Figure 5.
Land use structures and land use transition from 2020 to 2030 under three scenarios. (a) Land use structure in 2020 and 3 scenarios in 2030; (b) Outflow of mining land in 2020 under 3 scenarios; (c) Inflow of new energy land in 2030 under 3 scenarios.
Figure 5b further quantifies mining-land outflow patterns in 2030. In the CN scenario, mining land is predominantly converted to forestland (37.56%) and built-up land (1.81%), while 52.54% remains unconverted. Under ND, 83.10% of mining land remains unchanged, with only small proportions transferred to cropland or built-up land. In contrast, LR exhibits a more diverse transfer structure: mining land flows primarily into water bodies (19.76%), forestland (23.29%), and built-up land (5.80%). Figure 5c shows the composition of land sources contributing to the expansion of new-energy land. Under all scenarios, built-up land serves as the primary contributor (with CN and LR both exceeding 240 ha), while mining land provides approximately 22–24 ha under CN and LR. Other land types contribute only marginally. These results emphasize that CN not only enhances ecological land expansion but also enables a more substantial and diversified transition into new-energy land.
Based on the simulation results, typical zones representing the land use change characteristics were selected to analyze the spatial distribution patterns of the key land use types so as to identify the land structure adjustment characteristics under the different development scenarios (Figure 6).
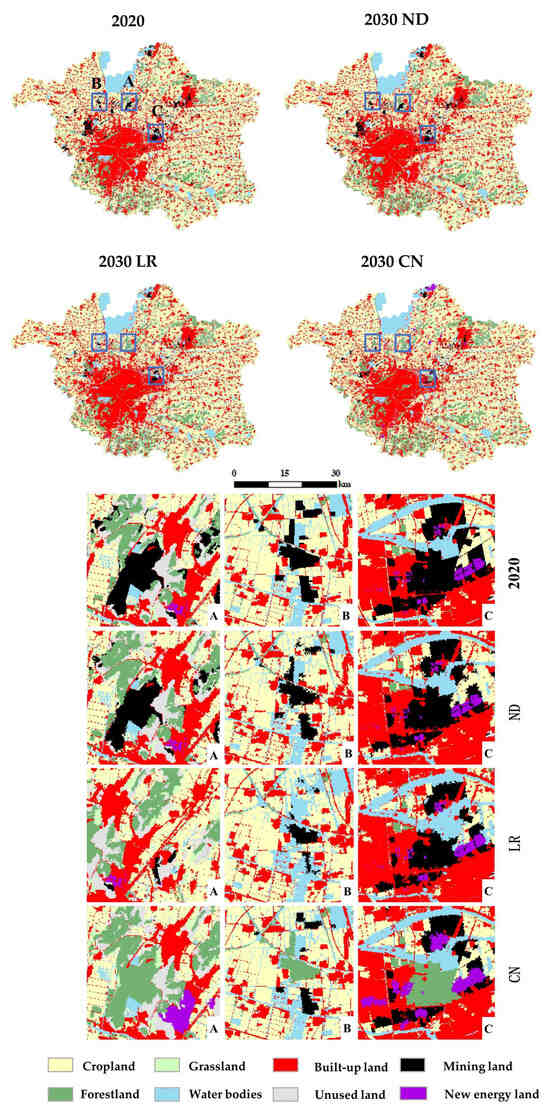
Figure 6.
Results of multiple scenario simulation of land use and typical zones of the land use structure in the study area in 2030.
The results reveal that the contraction patterns and conversion directions of the mining land differ markedly under the three scenarios.
ND: The mining land contracts, mainly within its existing spatial layout, and fewer scattered patches and little land use conversion occur in contiguous areas, indicating weak promotion of low-carbon transition (Figure 6-ND).
LR: The mining land exhibits block-like conversion patterns, is mainly converted to cropland and water bodies, and experiences the largest area reduction among the three scenarios. However, by focusing restoration on only pre-mining land use types, the LR scenario constrains the expansion of forestland and new-energy land, thereby hindering broader land use transformation and limiting improvements of the low-carbon competitiveness (Figure 6-LR).
CN: Contiguous mining land is largely converted into forestland, while the internal structure of the built-up land becomes more regular. Scattered parcels are also reclaimed, reducing fragmentation. More importantly, the CN scenario maximizes the expansion of the forestland and new-energy land, greatly enhancing the spatial competitiveness of the low-carbon land use types and the ecological benefits, thereby best supporting carbon neutrality goals (Figure 6-CN).
Across Areas A, B, and C, the CN scenario consistently promotes the conversion of mining land toward forestland or new energy uses, though with different intensities. Area A shows the most substantial transition: mining land decreases from 446.53 ha in 2020 to 44.44 ha under CN, releasing about 402 ha. Most of this area is absorbed by ecological restoration, contributing to a net forestland increase of 399.73 ha, while new energy land expands by about 30 ha, reflecting strong ecological and low-carbon transformation. In Area B, although the total scale is small, mining land decreases from 2.51 ha to 1.10 ha, releasing about 1.4 ha. This shift primarily supports forest recovery, as forestland increases from 0.47 ha to 1.74 ha (a gain of 1.27 ha). No new energy land is added due to spatial constraints and the dominance of water bodies, but the forest expansion indicates localized ecological improvement. Area C also undergoes significant adjustment: mining land falls from 753.19 ha to 426.40 ha, releasing 326.79 ha. Forestland expands markedly from 52.29 ha to 335.68 ha (+283.39 ha), while new energy land increases by 19.61 ha, demonstrating high photovoltaic suitability.
Overall, the CN scenario drives a clear reallocation of former mining land toward ecological and low-carbon functions across all three areas. A and C exhibit large-scale restructuring, while B shows modest but directionally consistent improvements, collectively illustrating the strong spatial effects of carbon-neutral policies.
4.4. Carbon Emissions Under ND/LR/CN Scenarios
4.4.1. The Carbon Emissions from 2010 to 2030
Based on the areas of the land use types, emission coefficients, and energy-consumption data, the net carbon emissions in 2010 and 2020 were calculated, and the net carbon emissions in 2030 were projected under the three scenarios (Table 6). The study area was a carbon source overall: net emissions increased from 15,888.53 × 103 t in 2010 to 15,947.53 × 103 t in 2020, an increase of 59.03 × 10³ t (0.37%). The built-up land was the principal carbon source, while the new energy land, forestland, and water bodies were the main carbon sinks. The modest increase during 2010–2020 mainly reflects the emission reductions from the mining land (−1157.01 × 103 t) which substantially offset the increased energy use in the built-up land (1336.67 × 103 t). Additionally, the new energy land contributed −117.31×10³ t of sequestration, evidencing notable low-carbon gains.
Table 6.
Net carbon emission estimations for the different land use types in the study area (103 t).
The projected results for 2030 differ under the different scenarios. Under the ND scenario, the net emissions increase by 461.58 × 10³ t (2.89%). Under the LR and CN scenarios, tighter control of built-up land expansion and active reclamation of abandoned mining land yield net decreases of −110.55 × 10³ t (−1.06%) and −729.63 × 10³ t (−4.95%), respectively.
Across the scenarios, the built-up land remains the dominant emission source, with emission increases of 718.93 × 10³ t (ND), 717.34 × 10³ t (LR), and 97.35 × 10³ t (CN). The new energy land, forestland, and water bodies remain the principal sinks. Notably, under the CN scenario, the sequestration provided by the new energy land increases by 124.48 × 10³ t (a 95.38% increase), underscoring the CN scenario’s strong potential to amplify carbon sinks when combined with spatial controls and energy-structure optimization.
4.4.2. The Change in Spatial Pattern of Carbon Emissions
The net carbon emissions from land use in the study area exhibit a distinct spatial pattern, with higher emissions in the central and western parts of the study area and lower emissions in the eastern, southern, and northern parts (Figure 7). Specifically, the high-emission areas are concentrated in the Quanshan District, the Gulou District, the Yunlong District, and the central part of the Jiawang District. The low-emission areas are located near Weishan Lake and in the surrounding hills. The cropland generally exhibits a medium-to-low emission intensity.
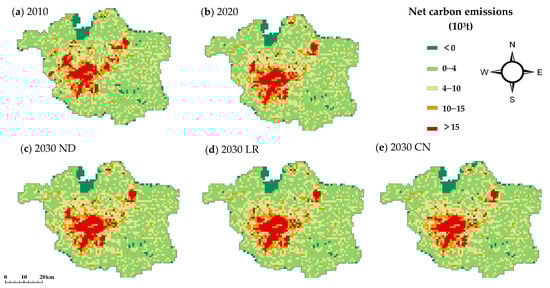
Figure 7.
Spatial distribution of net carbon emissions in the study area.
Between 2010 and 2020, the extent of the high-emission areas decreased, mainly due to the transformation and reuse of mining land. Notable examples include the Pan’an Lake and Jiuli Lake areas. By 2020, the medium–high and medium zones around the urban core had expanded, while the emission differentials of the built-up land in the urban core narrowed.
At the mining area scale (Figure 8), the number of high-emission mining sites decreased significantly; 28 mining sites (84.85% of the total) had lower emissions in 2020 compared to 2010. Notably, 28 mines reduced emissions; and Liuquan achieved neutrality (−294.10 × 10³ t).
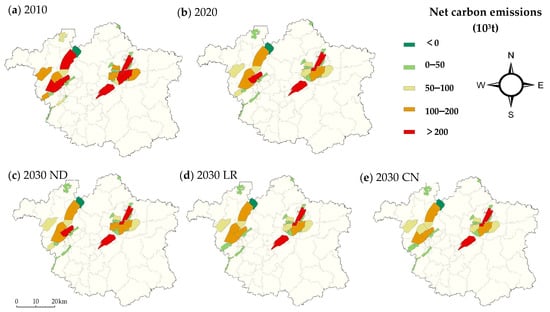
Figure 8.
Spatial distribution of net carbon emissions from closed coal mine in the study area.
It is projected that by 2030, under all three scenarios, the spatial patterns of the net emissions will largely continue along the historical trend during 2010–2020: mining land emissions will continue to decrease, and the high-emission zones will continue to shrink. Under the ND scenario, the distribution will be similar to that in 2020. Under the LR and CN scenarios, the medium-low areas will expand, and the high-emission urban cores will shrink. Under the CN scenario, many medium zones will shift to medium-low zones, especially in the north, and low-emission areas around Liguo Town will increase.
Under all three scenarios, the net carbon emissions from each mining site within Xuzhou’s jurisdiction are expected to decrease by 2030, and the most notable reductions occur under the CN scenario: −106.43 × 10³ t in Pangzhuang, −77.46 × 10³ t in Dahuangshan; and <10 × 103 t for several mines.
This suggests that under the CN scenario, measures such as controlling the expansion of built-up land, actively reclaiming abandoned mining land, reducing the conversion of forestland and grassland, and protecting prime cropland can effectively reduce carbon emissions, keeping their growth within a reasonable range.
5. Discussion
5.1. Carbon Neutrality as a Driver of Land Use Transition in Coal Resource-Exhausted Areas
Carbon neutrality has become both a global climate commitment and a strategic driver for restructuring land use in resource-exhausted cities [28]. These cities must shift from high-energy, high-emission, high-pollution patterns toward intensive, ecological, and low-carbon models [29].
The results of this study indicate that under the CN scenario, carbon neutrality drives land use transition through both direct effects and indirect guidance, producing measurable impacts on land cover in Xuzhou (Figure 9). Specifically, by 2030, cropland decreases by 2314.26 ha, forestland increases by 3954.69 ha, and built-up land expands by only 536.40 ha. These quantitative outcomes demonstrate a shift toward ecological priority and green development, where the direct driving effect is the conversion of mining land to new energy and forestland, and indirect guidance arises from market incentives, carbon trading, and clustering of low-carbon industries.
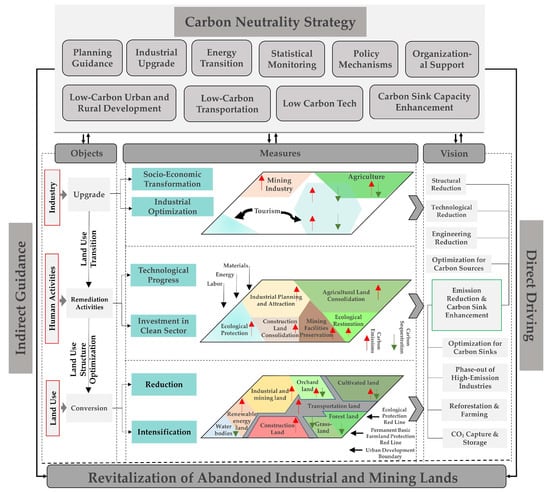
Figure 9.
Driving mechanisms of carbon neutrality of the coal resource-exhausted areas.
When comparing scenarios, the LR scenario demonstrates a slower transformation: built-up land increases by 3875.12 ha, much higher than the CN scenario, while forestland increases by only 2301.45 ha. This shows that without carbon neutrality guidance, the direct and indirect mechanisms are weaker, and urban expansion continues to occupy ecologically important land. The contrast highlights the positive effect of CN-oriented policies in restraining high-carbon land use, accelerating afforestation, and supporting the multifunctional reuse of abandoned mining land. From a socio-economic perspective, the containment of built-up land expansion by 86% under CN compared to LR suggests more targeted urban growth, reducing pressure on housing, infrastructure, and public services, while fostering green industrial development and low-carbon employment opportunities in Xuzhou.
In terms of direct driving effects, Industrial withdrawal, and land reallocation phase out high-carbon industries (coal and metallurgy) under strict emission and energy policies, freeing up mining land for new energy projects, tourism, and smart agriculture [30]. In Pangzhuang, post-mining land redevelopment for photovoltaics, eco-restoration, and leisure boosts value and reduces emissions (Figure 10).
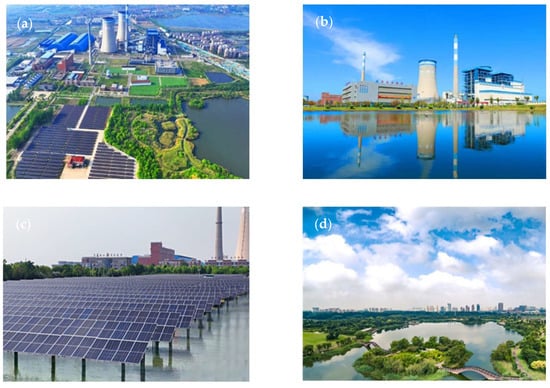
Figure 10.
The transformation practice of the Pangzhuang mine in Xuzhou, (a) Overview; (b) Data Center Park; (c) Photovoltaic Land; (d) Wetland.
Ecological restoration of subsidence and degraded areas through reforestation, wetland rehabilitation, and pit remediation restores carbon sinks, sometimes beyond natural levels. Under the CN scenario, forest area increases by 3954.69 ha while built-up land expansion is effectively contained (only 536.40 ha), maintaining the ecological integrity. Decommissioned mines host carbon capture, storage, or artificial forests, assetizing the land for carbon benefits and new green industries.
Meanwhile, in terms of indirect guidance mechanisms, indirect guidance operates mainly through market-oriented mechanisms. Carbon sink trading values ecological restoration by allowing reclaimed mining land to generate tradable credits, offsetting restoration costs and attracting private investment. Land swap policies further support the redevelopment of abandoned mining areas into compliant built-up land for green industries, tourism, and public facilities [31]. In addition, the low cost and open terrain of mining land make it ideal for photovoltaic, wind, and hydrogen projects, accelerating the development of green energy [32]. In addition, the clustering of clean industries such as smart agriculture and green buildings, driven by technological innovation and capital inflows, enhances the land use efficiency through multifunctional integration [33]. Together, these mechanisms provide flexible optimization compared to rigid policy and engineering controls, and in combination with direct drivers, they converge to reducing carbon sources and enhancing carbon sinks, thereby providing a sustainable transition model for resource-exhausted areas.
5.2. Land Use Transition Regulation Strategies in Post-Mining Cities
- (1)
- Encouraging ecological restoration
The results presented in Section 4 show that under the CN scenario, large-scale reclamation and vegetation restoration increase the forestland by 3954.69 ha, enhancing the carbon sink capacity. Governments should utilize a scientific management system for subsidence areas, goafs, and degraded land [34], including the use functional zoning—strict protection, key restoration, and developable use—based on ecological sensitivity, degradation, and sink potential. Planning should front-load carbon neutrality requirements, integrating carbon-sink enhancement with land consolidation and ecological reconstruction [35]. However, the traditional LR model, which restores land to pre-mining land use types, impedes transition, and innovative models diversifying post-mining uses are needed. Green industries—ecotourism, urban agriculture, and new energy land—should be introduced to couple ecological and economic gains. Vegetation restoration, soil–water conservation, and pollution remediation should be implemented, and this should be supported by dynamic monitoring and long-term stewardship.
Similar ecological restoration initiatives have been implemented in other post-mining regions, such as the Ruhr area in Germany and the Appalachian region in the United States [36,37,38]. In these cases, large-scale reforestation, wetland rehabilitation, and multifunctional land uses were used to enhance carbon sinks and restore ecosystem services. While the specific governance structures and industrial contexts differ, the underlying policy principle of integrating ecological restoration with carbon management appears to be generally applicable. In contrast, the local conditions in Xuzhou, including existing industrial replacement capacity and population density, allow more effective coupling of ecological and economic benefits.
- (2)
- Formulating incentive policies to reduce carbon emissions
Compared with the ND scenario, the CN scenario limits the expansion of built-up land to only 536.40 ha by 2030, and net carbon emissions decrease by 729.63 × 10³ t (−4.95%), the greatest among the three scenarios. Achieving this requires a coherent mix of incentives and constraints. We should link land allocation to carbon performance, prioritize low-carbon industries and restoration, and curb high-carbon uses [32]. We should also embed emission caps in land-supply plans and apply differentiated standards that favor green buildings, clean energy, and ecological industries. In addition, we should deploy subsidies, rewards, and green finance and recognize restoration-generated sinks as tradable assets to sustain funding for governance and ecological recovery of abandoned land.
The effectiveness of such incentive policies is strongly influenced by the regional economic context. Many resource-exhausted mining areas lack alternative industries and face difficulties in achieving economic transition, making incentive measures less effective. In contrast, Xuzhou is located in a developed coastal region of eastern China, where replacement industries such as machinery manufacturing and logistics provide strong support for urban transformation, making incentive policies more effective. This highlights that while the CN-oriented incentives are broadly relevant, their practical impact depends on the local industrial and economic capacity.
- (3)
- Expanding new land use types
The simulation results reveal that under the CN scenario, the new energy land doubles from 2020 to 2030, mainly through the conversion of mining land. Managers should leverage abandoned mining land, subsidence zones, and idle parcels to deploy large-scale photovoltaic, wind, and hydrogen projects for rapid abatement. They should pair restoration with multifunctional uses—eco-tourism, leisure/health, and smart agriculture—to deliver ecosystem services and income [39]. For example, wetland parks in remediated subsidence areas strengthen sinks and create growth poles. We should advance low-carbon urbanization via green-building pilots, low-carbon industrial parks, and circular-economy clusters.
The development of photovoltaic energy on abandoned mining sites has global applicability due to the widespread potential of solar resources. Other innovative land uses, such as pumped-storage facilities, geological CO2 sequestration in mines, and mining-themed parks, also provide new pathways for integrating carbon neutrality with multifunctional land use. These practices illustrate the broader relevance of the CN-guided land use transition model, while the specific choice and scale of interventions may vary according to local environmental and economic conditions.
5.3. Limitations and Future Work
In this study, based on simulation methods, we explored the future evolution of land use in resource-exhausted cities under the carbon neutrality strategy. Despite advances in scenario design, carbon-flux quantification, and spatial simulation, important limitations remain.
First, as the carbon neutrality policy was only officially proposed in China in 2020 and is still in the pilot and framework-building stage, its implementation period is relatively short. Consequently, the 2030 land use projection rests largely on assumed policy goals and development trends; the breadth, depth, and concrete implementation pathways of future policy remain uncertain. Therefore, the model outputs should be treated as conditional and iteratively updated through long-term field observations and dynamic data calibration to enhance the predictive accuracy and policy relevance.
Although carbon neutrality theoretically offers new opportunities for land use transition in resource-based cities, its driving mechanism cannot be explained by a single variable and exhibits significant systemic complexity. Interactions among emission control, carbon-sink enhancement, and land use optimization are shaped by the economic restructuring, policy intensity, and local implementation capacity. In addition, it is important to consider the sensitivity of our results to the carbon emission coefficients applied in this study. These coefficients were adopted from previous literature and may not fully reflect the specific environmental and industrial conditions in Xuzhou, such as local mining practices, energy intensity of industries, and vegetation carbon sequestration rates. Therefore, the absolute values of carbon emissions and carbon storage reported here should be interpreted with caution. Nevertheless, the relative differences among scenarios remain robust because the comparative analysis primarily depends on land use changes and scenario design rather than absolute values. We acknowledge this as a limitation and suggest that future research at the local scale could refine carbon factors through field measurements and region-specific data to improve the accuracy of carbon accounting and scenario-based land use planning. Future work should integrate system-dynamics or coupled models with the proposed simulation framework to capture nonlinear feedbacks between policy execution, economic behavior, and land responses, thereby deepening the causal understanding.
A comparative perspective across international and regional contexts should also be undertaken, especially through systematic comparison of resource-based cities with different mineral types, in different countries/regions, and at different economic development levels. Cross-regional comparisons can reveal common patterns and contextual differences, and the contrasts between developed and developing countries in terms of technology, policy implementation, and industrial transition will yield transferable lessons and guide region-specific strategies.
Increased attention should be paid to land circulation mechanisms and incentive policy design under the CN scenario, and how carbon-sink compensation and carbon-trading revenues can expand low-carbon functional land and balance ecological priority with development demand should be examined. Constructing integrated, multi-objective decision models with stakeholder participation can more comprehensively evaluate carbon neutrality policy performance and ecological benefits, strengthening the basis for sustainable transitions in resource-exhausted cities.
6. Conclusions
Under the dual pressures of mineral depletion and ecological degradation in resource-based cities, this study shows that carbon neutrality is not merely an alternative pathway but a structurally superior model for mining-city transformation. Using Xuzhou as a case, we integrated the GeoSOS-FLUS model with the Markov chain to simulate 2030 land use under three scenarios—ND, LR, and CN—and applied land-use-based carbon accounting to assess shifts in carbon source–sink patterns.
The scenarios produce sharply different carbon outcomes. Under ND, continued expansion of built-up land drives emissions to 16,409.14 × 103 t. LR strengthens ecological restoration, lowering emissions to 15,777.98 × 103 t. The CN scenario fundamentally restructures land allocation—reducing mining and built-up land while expanding forestland and new-energy land—cutting emissions to 15,158.90 × 103 t (a 4.95% reduction) and increasing carbon sink capacity by 95.38%. These results confirm that CN enables deep structural decarbonization rather than incremental adjustments.
CN’s advantage lies in transforming the drivers of land change. Direct mechanisms include withdrawing high-carbon industries, reallocating inefficient land, and restoring degraded areas, which jointly suppress carbon sources and enhance ecosystem functions. Indirect mechanisms—carbon-sink trading, land use substitution, and green-industry incentives—reshape market and policy conditions to elevate ecological land competitiveness and promote compact, ecological, low-carbon spatial forms.
Overall, carbon neutrality offers mining cities a strategic opportunity surpassing traditional reclamation models. Instead of treating ecological restoration and industrial renewal separately, the CN scenario integrates both, achieving simultaneous carbon-efficiency gains and ecosystem recovery. Effective implementation requires moving beyond generic “incentives” toward actionable measures: linking land-quota allocation to carbon performance, prioritizing mining-land conversion to forestland and new-energy land, establishing carbon-oriented land-substitution rules, and building a multi-stakeholder, adaptive regulatory system aligned with carbon-neutrality goals. These measures can help resource-exhausted cities coordinate ecological restoration, industrial restructuring, and climate mitigation, providing a practical and sustainable development pathway.
Author Contributions
Conceptualization, Y.Y. and Y.Z.; methodology, Y.Y. and Y.Z.; software, Y.Z., Y.C., X.C. and D.J.; validation, X.C.; formal analysis, Y.Z.; investigation, X.C.; resources, Y.Y.; data curation, D.J.; writing—original draft preparation, Y.Z.; writing—review and editing, Y.Y.; visualization, Y.Z. and D.J.; supervision, Y.Y.; project administration, Y.C.; funding acquisition, Y.Y. and Y.Z. All authors have read and agreed to the published version of the manuscript.
Funding
This research was funded by Shandong Provincial Natural Science Foundation (ZR2025QC418), the National Key Research and Development Program of China (2023YFC3804202), Humanities and Social Sciences Program of the Ministry of Education (24YJC630272), and the Open Fund of the Key Laboratory of Coastal Zone Exploitation and Protection, Ministry of Natural Resources of China (2023CZEPK10).
Data Availability Statement
Data will be made available on request.
Acknowledgments
We thank LetPub (www.letpub.com.cn, accessed on 20 September 2025) for its linguistic assistance during the preparation of this manuscript.
Conflicts of Interest
The authors declare no known competing financial interests or personal relationships that could influence the work reported in this paper.
Abbreviations
The following abbreviations are used in this manuscript:
| ND | Natural Development |
| LR | Land Recovery |
| CN | Carbon Neutrality |
| FoM | Factor of Merit |
| ANN | Artificial Neural Network |
| GeoSOS-FLUS | Geographical Simulation and Optimization System-Future Land Use Simulation model |
| IPCC | Intergovernmental Panel on Climate Change |
References
- UN-Habitat. World Cities Report 2022: Envisaging the Future of Cities; United Nations Human Settlements Programme: Nairobi, Kenya, 2022. [Google Scholar]
- Zhao, Y.; Dai, R.; Yang, Y.; Li, F.; Zhang, Y.; Wang, X. Integrated evaluation of resource and environmental carrying capacity during the transformation of resource-exhausted cities based on Euclidean distance and a Gray-TOPSIS model: A case study of Jiaozuo City, China. Ecol. Indic. 2022, 142, 109282. [Google Scholar] [CrossRef]
- Hosseini, S.; Barker, K.; Ramirez-Marquez, J.E. A review of definitions and measures of system resilience. Reliab. Eng. Syst. Saf. 2016, 145, 47–61. [Google Scholar] [CrossRef]
- Sonter, L.J.; Moran, C.J.; Barrett, D.J.; Soares-Filho, B.S. Processes of land use change in mining regions. J. Clean. Prod. 2014, 84, 494–501. [Google Scholar] [CrossRef]
- Mishra, A.; Swamy, S.L.; Thakur, T.K.; Kumar, A.; Pandey, M. Impact of coal mining on land use changes, deforestation, biomass, and C losses in Central India: Implications for offsetting CO2 emissions. Land Degrad. Dev. 2022, 33, 3731–3747. [Google Scholar] [CrossRef]
- Alsaggaf, M.I. Exploring the role of land utilization, renewable energy, and ICT to counter the environmental emission: A panel study of selected G20 and OECD countries. Land Degrad. Dev. 2025, 36, 1707–1723. [Google Scholar] [CrossRef]
- Wang, J.; Cui, K.; Yang, F.; Li, J.; Zhang, C.; Du, T.; Zhang, H. Evaluation of spatiotemporal variation and impact factors for vegetation net primary productivity in a typical open-pit mining ecosystem in northwestern China. Land Degrad. Dev. 2024, 35, 3756–3770. [Google Scholar] [CrossRef]
- Dai, L.; Wang, F.; Li, Q.; Yan, Y.; Zhang, Y.; Li, Y.; Jin, S. Multi Scale Evaluation of the Impact of High-Intensity Mining on Vegetation Carbon Sequestration Capacity. Sustainability 2024, 16, 10208. [Google Scholar] [CrossRef]
- Lameck, A.S.; Rotich, B.; Ahmed, A.; Kipkulei, H.; Mnyawi, S.R.; Czimber, K. Land use/land cover changes due to gold mining in the Singida region, central Tanzania: Environmental and socio-economic implications. Environ. Monit. Assess. 2025, 197, 464. [Google Scholar] [CrossRef]
- Peng, Y.; Xia, L.; Liu, Y.; Yang, R.; Zheng, C.; Xie, M. Policy support and the combination of artificial guidance with natural restoration can effectively restore the surface mine ecosystem in South China. J. Environ. Manag. 2025, 392, 126579. [Google Scholar] [CrossRef]
- Bi, Y.; Liu, T.; Pei, Y.; Wang, X.; Du, X. Landscape analysis and assessment of ecosystem stability based on land use and multitemporal remote sensing: A case study of the Zhungeer open-pit coal mining area. Remote Sens. 2025, 17, 1162. [Google Scholar] [CrossRef]
- Zhao, Y.; Wang, Y.; Zhang, Z.; Zhou, Y.; Huang, H.; Chang, M. The Evolution of Landscape Patterns and Its Ecological Effects of Open-Pit Mining: A Case Study in the Heidaigou Mining Area, China. Int. J. Environ. Res. Public Health 2023, 20, 4394. [Google Scholar] [CrossRef] [PubMed]
- Orimoloye, I.R.; Ololade, O.O. Spatial evaluation of land-use dynamics in gold mining area using remote sensing and GIS technology. Int. J. Environ. Sci. Technol. 2020, 17, 4465–4480. [Google Scholar] [CrossRef]
- Misebo, A.M.; Pietrzykowski, M.; Woś, B. Soil carbon sequestration in novel ecosystems at post-mine sites—A new insight into the determination of key factors in the restoration of terrestrial ecosystems. Forests 2022, 13, 63. [Google Scholar] [CrossRef]
- Hu, Z.; Li, Y.; Li, G.; Han, J.; Liu, S. Opportunities and challenges of land reclamation and ecological restoration in mining areas under carbon neutral target. Coal Sci. Technol. 2023, 51, 474–483. [Google Scholar]
- Yang, Y.; Gong, R.; Liu, S.; Wu, Q.; Chen, F. The Loss and Recovery Potential of Net Ecosystem Productivity in Mining Areas: A Global Assessment Based on Data for 2000–2020. Land 2024, 13, 1913. [Google Scholar] [CrossRef]
- Ma, J.; Gonzalez-Ollauri, A.; Zhang, Q.; Xiao, D.; Chen, F. Ecological network analysis assesses the restoration success of disturbed mine soil in Zoucheng, China. Land Degrad. Dev. 2021, 32, 5393–5411. [Google Scholar] [CrossRef]
- Liu, R.; Yuan, K.; Li, X.; Liu, X.; Zhao, X.; Guo, X.; Fu, J.; Cao, S. Extraction and spatiotemporal changes of open-pit mines during 1985–2020 using Google Earth Engine: A case study of Qingzhou City, Shandong Province, China. Environ. Monit. Assess. 2023, 195, 209. [Google Scholar] [CrossRef]
- Zhu, Y.; Wang, L.; Ma, J.; Hua, Z.; Yang, Y.; Chen, F. Assessment of carbon sequestration potential of mining areas under ecological restoration in China. Sci. Total Environ. 2024, 921, 171179. [Google Scholar] [CrossRef]
- Li, L.; Huang, X.; Yang, H. Optimizing land use patterns to improve the contribution of land use planning to carbon neutrality target. Land Use Policy 2023, 135, 106959. [Google Scholar] [CrossRef]
- Rahman, M.T.U.; Tabassum, F.; Rasheduzzaman, M.; Saba, H.; Sarkar, L.; Ferdous, J.; Uddin, S.Z.; Zahedul Islam, A.Z.M. Temporal dynamics of land use/land cover change and its prediction using CA-ANN model for southwestern coastal Bangladesh. Environ. Monit. Assess. 2017, 189, 565. [Google Scholar] [CrossRef]
- Molinero-Parejo, R.; Aguilera-Benavente, F.; Gómez-Delgado, M.; Shurupov, N. Combining a land parcel cellular automata (LP-CA) model with participatory approaches in the simulation of disruptive future scenarios of urban land use change. Comput. Environ. Urban Syst. 2023, 99, 101895. [Google Scholar] [CrossRef]
- Zhang, T.; Cheng, C.; Wu, X. Mapping the spatial heterogeneity of global land use and land cover from 2020 to 2100 at a 1 km resolution. Sci. Data 2023, 10, 748. [Google Scholar] [CrossRef] [PubMed]
- Mutale, B.; Qiang, F. Modeling future land use and land cover under different scenarios using patch-generating land use simulation model. A case study of Ndola district. Front. Environ. Sci. 2024, 12, 1362666. [Google Scholar] [CrossRef]
- Wang, B.; Liao, J.; Zhu, W.; Qiu, Q.; Wang, L.; Tang, L. The weight of neighborhood setting of the FLUS model based on a historical scenario: A case study of land use simulation of urban agglomeration of the Golden Triangle of Southern Fujian in 2030. Acta Ecol. Sin. 2019, 39, 4284–4298. [Google Scholar]
- Ji, H.; Li, X.; Geng, Y.; Chen, X.; Wang, Y.; Cheng, J.; Chen, Z. Delineation of Urban Development Boundary and Carbon Emission Effects in Xuzhou City, China. Land 2023, 12, 1819. [Google Scholar] [CrossRef]
- Zhang, M.; Lai, L.; Huang, X.; Chuai, X.; Tan, J. Carbon emission intensity of land use type conversion in different regions of China. Resour. Sci. 2013, 35, 792–799. [Google Scholar]
- Sun, H.; Liang, H.; Chang, X.; Cui, Q.; Tao, Y. Land use carbon emissions and their spatial correlation in China. Econ. Geogr. 2015, 35, 154–162. [Google Scholar] [CrossRef]
- Shan, Y.; Cheng, Q.; Ke, X.; Zheng, D. Association situation and influencing factors of land use carbon emissions at the county level in Hubei Province from the perspective of space of flows. China Land Sci. 2024, 38, 48–59. [Google Scholar]
- Ai, H.; Tan, X.; Zhou, S.; Liu, W. The impact of supportive policy for resource-exhausted cities on carbon emission: Evidence from China. Resour. Policy 2023, 85, 103951. [Google Scholar] [CrossRef]
- Zhang, H.; Xiong, L.; Li, L.; Zhang, S. Political incentives, transformation efficiency and resource-exhausted cities. J. Clean. Prod. 2018, 196, 1418–1428. [Google Scholar] [CrossRef]
- Mborah, C.; Bansah, K.J.; Boateng, M.K. Evaluating alternate post-mining land-uses: A review. Environ. Pollut. 2016, 5, 14–22. [Google Scholar] [CrossRef]
- Guo, J.; Hu, Z.; Liang, Y. Causes and countermeasures for the failure of mining land use policy reform: Practice analysis from China. Land 2022, 11, 1391. [Google Scholar] [CrossRef]
- Choi, Y.; Song, J. Review of photovoltaic and wind power systems utilized in the mining industry. Renew. Sustain. Energy Rev. 2017, 75, 1386–1391. [Google Scholar] [CrossRef]
- Samer, M. Towards the implementation of the Green Building concept in agricultural buildings: A literature review. Agric. Eng. Int. CIGR J. 2013, 15, 25–46. [Google Scholar]
- Guo, Q.; Meng, X.; Li, Y.; Lv, X.; Liu, C. A prediction model for the surface residual subsidence in an abandoned goaf for sustainable development of resource-exhausted cities. J. Clean. Prod. 2021, 279, 123803. [Google Scholar] [CrossRef]
- Wang, J.; Ying, L.X.; Zhong, L.N. Thinking for the transformation of land consolidation and ecological restoration in the new era. J. Nat. Resour. 2020, 35, 26–36. [Google Scholar] [CrossRef]
- Ma, Y.; Xu, Z. Construction of Low-Carbon Land Use and Management System in Coal Mining Areas. Sustainability 2023, 15, 12486. [Google Scholar] [CrossRef]
- Alexander, S.; Aronson, J.; Whaley, O.; Lamb, D. The relationship between ecological restoration and the ecosystem services concept. Ecol. Soc. 2016, 21, 34. [Google Scholar] [CrossRef]
Disclaimer/Publisher’s Note: The statements, opinions and data contained in all publications are solely those of the individual author(s) and contributor(s) and not of MDPI and/or the editor(s). MDPI and/or the editor(s) disclaim responsibility for any injury to people or property resulting from any ideas, methods, instructions or products referred to in the content. |
© 2025 by the authors. Licensee MDPI, Basel, Switzerland. This article is an open access article distributed under the terms and conditions of the Creative Commons Attribution (CC BY) license (https://creativecommons.org/licenses/by/4.0/).