Abstract
Oasis regions in arid northwestern China represent critical interfaces for watershed ecological security and rural sustainable development. However, under escalating resource constraints and intensifying human–land conflicts, the disorderly expansion of rural settlements has increasingly constrained high-quality territorial development. Liangzhou District, located in the transitional zone of the upper Heihe River Basin at the eastern end of the Hexi Corridor, provides a representative case for examining the spatial evolution of rural settlements in oasis environments. Using multi-temporal land-use data from 2000 to 2023, this study integrates landscape pattern metrics, kernel density estimation, and nearest-neighbor analysis to characterize the spatiotemporal evolution of rural settlements. The Markov–CLUE-S model is further applied to simulate land-use changes under three scenarios for 2035: natural development, new urbanization, and ecological protection. Results indicate that the number of rural settlement patches increased from 1598 to 3009, while their total area expanded from 10,321.83 hm2 to 20,828.34 hm2, demonstrating a sustained expansion trend and a transition from scattered distribution to increasingly clustered patterns along urban centers and major transportation corridors. Scenario simulations suggest that rural settlement areas will decline by 5.27 km2, 12.13 km2, and 11.68 km2 under the three respective scenarios, predominantly converting to cropland, grassland, and urban construction land. Model validation yields a Kappa coefficient of 0.88, confirming high simulation accuracy. This study develops an integrated “pattern evolution–driving mechanism–scenario response” analytical framework for rural settlement dynamics in arid oasis regions, highlighting the combined influences of environmental constraints and socio-economic drivers. The findings provide a scientific basis for rural spatial optimization and watershed-scale territorial governance in arid regions.
1. Introduction
Rural settlements constitute the fundamental spatial units of rural territorial systems, serving as key carriers for production activities, everyday life, and social interaction among rural residents [1]. The evolution of their spatial configurations directly influences regional land-use structures, ecological security patterns, and the overall trajectory of rural revitalization. The United Nations’ 2030 Agenda for Sustainable Development provides a global framework for sustainable development [2], within which SDG11 (Sustainable Cities and Communities) emphasizes the creation of livable, safe, and affordable human settlements; SDG13 (Climate Action) calls for balanced strategies of climate change mitigation and adaptation; and SDG15 (Life on Land) highlights the necessity of maintaining stable terrestrial ecosystems [3,4,5,6,7]. Against this backdrop, the rational allocation and spatial optimization of rural settlements serve as both a pivotal strategy for advancing rural revitalization and an essential pathway for achieving broader sustainability goals [8].
With the deepening transformation of urban–rural spatial relations, the spatial evolution patterns and driving forces of rural settlements have increasingly attracted scholarly attention [9]. Existing studies have primarily focused on settlement expansion, spatial density, morphological characteristics, and distributional patterns, revealing the restructuring of rural settlement space under the joint influence of natural and socio-economic factors [10,11,12,13,14]. Earlier research tended to apply planning-oriented analytical approaches, such as space syntax and figure–ground models, to examine spatial organization [15,16]. With the advancements in remote sensing and geographic information technologies, research has shifted toward quantitative analyses using spatial statistics and landscape pattern metrics. Techniques such as landscape indices, kernel density estimation, and hotspot analysis have been used to identify clustering patterns and spatial differentiation of rural settlement types [17,18,19,20]. Furthermore, multi-scale land-use research suggests that urban and rural land-use changes are influenced not only by local drivers but also by broader processes such as supply chain dynamics and interregional trade [21,22]. Overall, the evolution of rural settlement patterns is shaped by the combined effects of geographical conditions, economic development, institutional arrangements, and socio-cultural contexts, making the optimization of their spatial organization vital for supporting regional sustainable development.
Scenario-based simulation has become an important methodological approach for understanding rural settlement evolution and its future trajectories. By constructing multiple development pathways, scenario simulation enables the assessment of ecological and socio-economic responses to alternative land-use patterns, thereby providing scientific guidance for spatial planning and policy formulation [23,24,25]. Commonly utilized models include Cellular Automata (CA), CLUE-S (Conversion of Land Use and its Effects at Small Region Extent), FLUS-InVEST, and PLUS (Patch-level Land Use Simulation Model) [15,16,26,27]. Although these models demonstrate strong applicability to dynamic land-use simulation, limitations remain: CA models often struggle to capture spatial heterogeneity, InVEST tends to show reduced accuracy under complex geomorphic conditions, and although PLUS offers comparatively higher precision, uncertainties persist in regions with marked topographic variation [23,28,29,30]. By integrating land demand forecasting with spatial allocation mechanisms, the Markov–CLUE-S model exhibits robust reliability in multi-scenario land-use simulations [23,31].
In arid regions, where ecological environments are inherently fragile, oases serve as the principal zones of human activity and natural ecological processes, constituting a core structural and functional component of the “mountain–oasis–desert” system [32,33]. Despite limited water availability and constrained ecological carrying capacity, oases support major agricultural production and rural settlement development. In recent decades, population growth and agricultural expansion have significantly reconfigured rural settlement patterns, resulting in intensified land-use pressures, declining groundwater levels, and increased risks of desertification and soil salinization [34,35]. These trends indicate that human activities have become the dominant force driving land-use change in oasis ecosystems. The spatial reconfiguration of rural settlements directly affects water resource utilization efficiency, ecological security frameworks, and regional socio-economic sustainability. Thus, a systematic examination of the spatiotemporal evolution and driving mechanisms of rural settlements in arid oasis regions is of critical importance for optimizing territorial spatial layouts, ensuring ecological security, and promoting high-quality rural development.
The methodological innovation of this study lies in establishing an integrated analytical framework comprising “pattern identification–mechanism investigation–scenario simulation.” This framework synthesizes multiple analytical techniques—including land-use transition matrices, landscape pattern indices, kernel density estimation, and the average nearest-neighbor index—and couples them with the Markov–CLUES scenario simulation model. Such integration overcomes the explanatory constraints of single-method approaches: transition matrices capture the macro-scale conversion dynamics between rural settlements and other land-use types; landscape metrics and spatial statistical methods quantify changes in internal spatial configurations; and the Markov–CLUES model, through the incorporation of policy constraints such as permanent basic farmland, ecological conservation zones, and water-restricted areas, enables dynamic spatial simulations of settlement evolution under diverse scenarios. Collectively, this systematic approach provides a comprehensive understanding of the spatiotemporal evolution mechanisms of rural settlements in arid-oasis regions and strengthens the applicability of the findings for territorial spatial governance and rural revitalization strategies.
Therefore, this study takes Liangzhou District in Gansu Province as a representative oasis region to: (1) characterize the spatiotemporal evolution of rural settlement patterns from 2000 to 2023; (2) identify the dominant patch-scale transformation pathways of rural settlements; and (3) simulate rural settlement spatial evolution under three scenarios—natural development, new urbanization, and ecological protection—by 2035. Through integrating spatial analysis and multi-scenario simulation, this study aims to elucidate the evolution pathways and spatial response mechanisms of rural settlements in oasis environments, providing scientific evidence and policy references for territorial spatial governance and sustainable rural development in arid regions.
2. Research Area and Data Sources
2.1. Overview of the Study Area
Liangzhou District is located in northwestern Gansu Province and central Wuwei City, positioned at the eastern end of the Hexi Corridor along the northern foothills of the Qilian Mountains (37°23′–38°12′ N, 101°59′–103°23′ E). It represents a typical oasis-based agricultural region. The district is bordered by Inner Mongolia to the east, Zhangye City to the west, Tianzhu Tibetan Autonomous County and Gulang County to the south, and Minqin County and Yongchang County to the north. The terrain generally slopes from the southwest toward the northeast (Figure 1). The physical landscape consists of three major geomorphic units—the Qilian mountainous zone, oasis plains of the corridor, and the Tengger Desert—constituting a characteristic “mountain–oasis–desert” composite system, with elevations ranging from approximately 1440 to 3263 m.
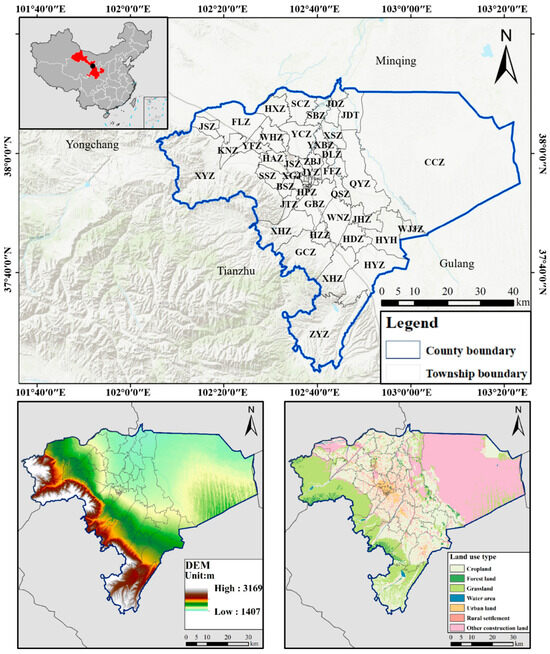
Figure 1.
Location of Liangzhou District. Note: HYZ = Huangyang Township; DZXC = Geoshinchun Street; DGJ = Dongguan Street; DDJ = Dongdajie Street; JSZ = Jinshan Township; XGJ = Xiguan Street; XSZ = Xiashuang Township; RHJ = Ronghua Street; ZBZ = Zhongba Township; HPZ = Heping Township; DLZ = Daliu Township; XDJ = Xidajie Street; KNZ = Kangning Township; HAZ = Huai’an Township; SSZ = Songshu Township; BSZ = Baishu Township; YSZ = Yongfeng Township; HDZ = Hedong Township; JTZ = Jinta Township; HZZ = Hanzuo Township; WJJZ = Hujiajing Township; JDT = Jiuduntan Command; YXBZ = Yangxiaba Township; HYH = Huangyanghe Street; HCZ = Railway Station Street; JHZ = Jinhe Township; FLZ = Fengle Township; JSZ = Jinsha Township; JYZ = Jinyang Township; CCZ = Changcheng Township; JDZ = Jiudun Township; WHZ = Wuhe Township; SCZ = Shuangcheng Township; FFZ = Fafang Township; GCZ = Gucheng Township; WNZ = Wunan Township; YCZ = Yongchang Township; HXZ = Hongxiang Township; QSZ = Qingshui Township; QYZ = Qingyuan Township; XYZ = Xiying Township; XHZ = Xiehe Township; GBZ = Gaoba Township.
The region exhibits a temperate continental arid climate, featuring abundant solar radiation, strong evaporation, and limited precipitation. The mean annual temperature is 9.7 °C, and annual precipitation averages roughly 170 mm. Water resources are primarily derived from glaciers and snowmelt from the northern slopes of the Qilian Mountains, feeding several inland river systems, including the Xiying, Zamu, Jinta, and Huangyang Rivers. However, the imbalance between water supply and demand is pronounced, and the ecosystem is highly sensitive to climate variability and anthropogenic disturbance [36].
Liangzhou District lies within the transitional corridor of the Qilian Fold System. The oasis developed on alluvial–proluvial plains at the mountain front, forming the principal area of population concentration and agricultural production in this arid zone. Historically, the intensive expansion of irrigated agriculture and the overexploitation of water resources have resulted in a spatial pattern in which rural settlements are closely coupled with hydrological and ecological structures, reflecting a distinctive oasis human–environment relationship. As a key ecological node in the fragile arid region of northwestern China, Liangzhou District exhibits strong representativeness and typicality, making it an ideal case for examining the coupled processes of human activity and natural environmental dynamics, as well as the spatial evolution of rural settlements in oasis systems.
2.2. Data Sources
This study employs a comprehensive set of biophysical and socio-economic datasets. Biophysical data consist of land-use maps, digital elevation models (DEM), and water body distributions, while socio-economic data encompass population density, GDP, transportation networks (railways and highways), and nighttime light intensity. The temporal coverage, spatial resolution, sources, and specific applications of these datasets are detailed in Table 1.

Table 1.
Data Sources and Applications.
3. Research Methods
To systematically elucidate the spatial evolutionary patterns of rural settlements in Liangzhou District and to anticipate their future trajectories, this study develops an integrated methodological framework encompassing “pattern analysis–evolution detection–scenario simulation.” The framework first provides a comprehensive assessment of the current status and historical evolution of rural settlements in terms of their scale, morphology, and spatial distribution. It then identifies spatial clustering patterns and characterizes the transition dynamics between rural settlements and other land-use categories. Finally, under alternative policy orientations, it simulates the prospective spatial evolution pathways of rural settlements. Specifically, a land-use transition matrix is employed to analyze intertype conversion processes, while the average nearest-neighbor index and kernel density estimation are used to detect the spatial clustering characteristics and distributional patterns of settlements. Landscape metrics are further applied to depict the structural and morphological attributes of settlement landscapes. Building on these analytical components, the Markov–CLUES coupled model is introduced to simulate rural settlement evolution under multiple scenarios. Collectively, this methodological system provides a rigorous scientific basis for optimizing rural spatial structures and informing territorial spatial planning in arid-region contexts (Figure 2).
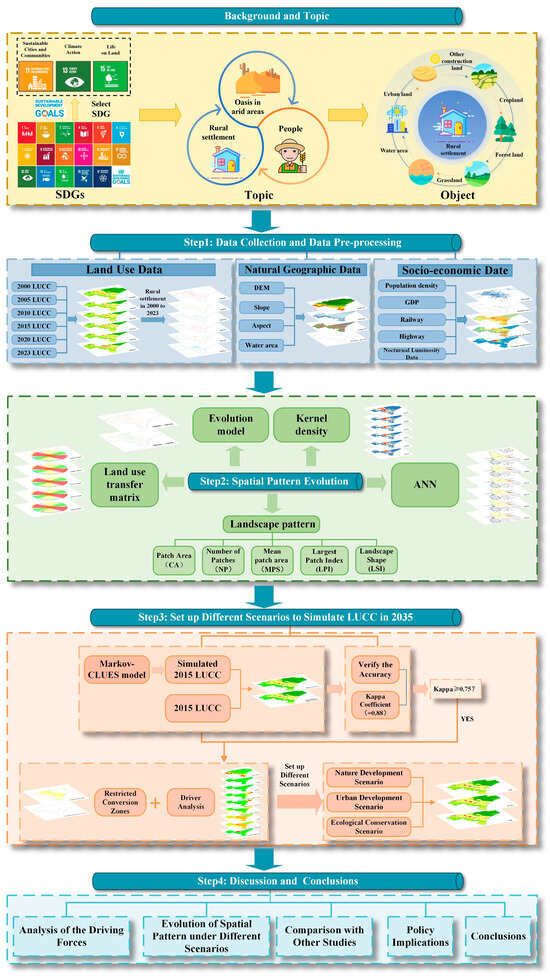
Figure 2.
Research Framework.
3.1. Land Use Transition Matrix
The land use transition matrix reflects changes in the area of various land use types and their mutual conversion relationships during the study period [43]. By analysing the dynamic evolution direction before and after land type conversion, it reveals the structural characteristics and internal conversion patterns of land use change. Its calculation formula is as follows:
In the formula: denotes area, denotes the total number of land use types, and denote land use types, and denotes the area of land converted from type to type .
3.2. Landscape Pattern Metrics
Landscape pattern metrics provide a quantitative basis for describing the composition and spatial configuration of landscape elements, thereby revealing the structural complexity and dynamic evolution of landscapes over time [28]. In this study, five metrics were selected to characterize the spatial pattern of rural settlements: Total Patch Area (CA), Number of Patches (NP), Mean Patch Size (MPS), Largest Patch Index (LPI), and Landscape Shape Index (LSI). The definitions, calculation formulas, and ecological significance of these metrics are summarized in Table A1. Temporal changes in landscape patterns were analyzed using Fragstats 4.3 in conjunction with ArcGIS 10.8, allowing for a systematic evaluation of the spatiotemporal evolution of rural settlement landscapes in Liangzhou District.
3.3. Kernel Density Estimation
Kernel Density Estimation (KDE) is a commonly employed spatial statistical method for calculating the density per unit area of point or line features within a specified range [44]. Higher kernel density values indicate a more concentrated distribution of features. This method offers significant advantages in identifying spatial clustering characteristics and hotspot areas of rural settlements, providing an intuitive representation of variations in settlement density across spatial distributions. Its calculation formula is as follows:
In the formula: denotes the density estimate at position ; represents the number of observations; is the bandwidth or smoothing parameter; is the distance from position to the th observation point.
3.4. Average Nearest Neighbour Index
The Average Nearest Neighbour Index (ANN) is a commonly employed method for quantitatively analysing spatial point pattern characteristics, effectively revealing the spatial distribution and clustering features of rural settlement patches [45]. Its fundamental principle involves comparing the actual observed distances between nearest neighbours with the theoretical expected distances under random distribution conditions. When the actual average distance is less than the expected distance, it indicates that the point distribution exhibits clustering characteristics; conversely, it manifests as a dispersed distribution. ANN values may be calculated using the spatial analysis module within ArcGIS 10.8 software, employing the following formula:
In the formula, represents the observed mean distance between each rural settlement and its nearest neighbour; represents the expected mean distance under the assumption of random distribution; denotes the total number of settlements; signifies the distance between any two points; and indicates the total area of the study region. The ANN value is calculated based on the aforementioned parameters. When ANN = 1, it indicates a random distribution of rural settlements with no discernible clustering or dispersion characteristics. When ANN < 1, it signifies clustered settlement patterns, where inter-settlement distances are shorter than the expected value under random distribution. When ANN > 1, it indicates a relatively dispersed settlement distribution.
3.5. Markov-CLUES Model
The Markov–CLUES model represents a coupled framework integrating the Markov model with the CLUE-S model. The CLUE-S model, developed by Verburg et al. at Wageningen University, is specifically designed to simulate land-use changes at fine spatial scales. In this coupled approach, the Markov model predicts future land-use demand based on transition probability matrices, providing quantitative constraints for the CLUE-S model, which then spatially allocates land-use changes according to the underlying spatial driving forces of land dynamics [23,46]. In this study, land-use data from 1990 to 2010 were employed to construct a Markov chain to quantify historical land-use transition patterns. Using 2010 as the baseline year, the model was subsequently applied to simulate the land-use pattern in 2015. The relevant formulas are presented as follows:
In the equation, and denote the probability of land use states at initial time and time , respectively. By applying the Markov model to process Liangzhou District’s land use data from 1990 to 2010, the transition probability matrix between various land use types during this period can be derived (Table A2).
3.5.1. Non-Spatial Demand Module
The development of the three scenarios follows a progression from “trend extrapolation” to “target-oriented” planning. The natural development scenario relies exclusively on historical trend extrapolation, whereas the new-type urbanization and ecological protection scenarios build upon historical trends while integrating policy-driven adjustments to land-demand structures. These adjustments are informed by policy documents and planning objectives rather than direct forecasts of future socio-economic drivers. Specifically, the three scenarios constructed in this study are defined as follows:
- (1)
- Natural Development Scenario: This scenario aims to capture the natural evolution of land use and rural settlements in Liangzhou District. Using land-use data from 1990 to 2010, a Markov model was developed to calculate transition probability matrices among land-use categories, thereby projecting the future evolution of land-use structure. Model outputs enable the prediction of land-area changes and spatial distributions in 2035, reflecting the natural evolutionary trajectory under conditions absent of policy interventions.
- (2)
- New-Type Urbanization Scenario: This scenario simulates the evolution of rural settlements in Liangzhou District under Wuwei City’s new-type urbanization strategy. Guided by the overarching objectives of the Five-Year Action Plan for New-Type Urbanization in Wuwei and the New-Type Urbanization Plan (2014–2020), it emphasizes the integrated advancement of population concentration, industrial upgrading, and spatial optimization. Within this scenario, the locational advantages of Liangzhou’s central urban areas are expected to facilitate population movement and industrial restructuring, guiding rural settlements toward central villages and promoting rational expansion of construction land. The scenario further incorporates considerations of farmland protection, ecological conservation, and industrial development to coordinate urban–rural land-use layouts and prevent unregulated settlement sprawl.Taking the rural registered population as an example, the variable in the equation denotes the increase in the amount of land occupied by rural settlements within the study area during a given period; represents the growth in the rural population over the same period; while signifies the increase in land occupied by rural settlements resulting from the rise in per capita population.
- (3)
- Ecological Protection Scenario: Under this scenario, arbitrary conversion of natural ecological land is restricted, and excessive expansion of cropland and construction land is strictly controlled, with priority given to preserving critical ecological spaces such as forests, grasslands, and water bodies. Specific measures include reducing the transition probabilities of ecological land to cropland or construction land to maintain landscape stability and uphold ecological security thresholds, thereby determining the rational spatial allocation of land-use demand by 2035.
3.5.2. Spatial Allocation Module for Land Use Change
- (1)
- Spatial Allocation of Land-Use Change
Restricted conversion zones are delineated based on the combined consideration of land-use policy regulations and ecological sensitivity. Leveraging data from the Third National Land Survey, scenario-specific restricted conversion areas were defined for each development scenario (Figure 3). In the natural development scenario, land-use transitions adhere to intrinsic evolutionary trends without policy-induced constraints; therefore, no restricted zones are established. Conversely, under the ecological protection and new-type urbanization scenarios, spatial conversion restrictions were imposed in accordance with the delineation of permanent prime farmland protection redlines [38], ecological control zones [42], and water-area restriction zones [39].
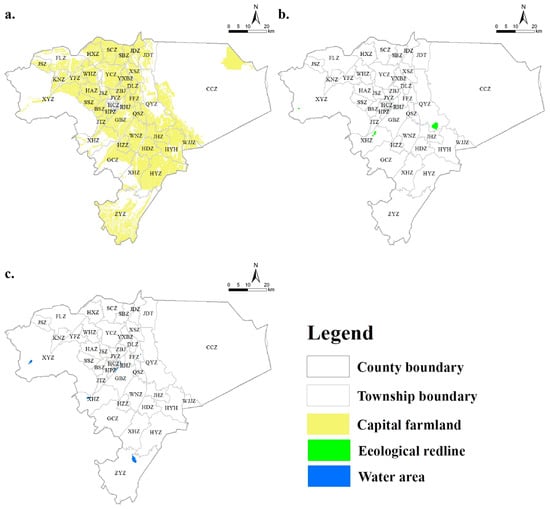
Figure 3.
Restricted Conversion Zones; (a) basic farmland; (b) natural ecological conservation areas and (c) water-area restriction zones.
- (2)
- Analysis of Driving Factors
Land-use changes and the evolution of rural settlements are influenced by a combination of natural and socio-economic factors [47]. To quantitatively characterize the spatial effects of these drivers, nine factors were incorporated into the CLUE-S model: elevation, slope, aspect, distance to water bodies, distance to roads, distance to railways, GDP, population density, and nighttime light intensity [9,35,48]. All factors were resampled to a uniform spatial resolution of 30 m × 30 m and converted to ASCII format as model input, generating nine raster layers representing the driving factors (Figure 4). These factors collectively form the core basis for spatial allocation in the CLUE-S model, defining the potential probability of land-use transitions for each raster cell. During model execution, land demand predicted by the Markov chain is preferentially allocated to cells with the highest transition probabilities that are outside restricted conversion zones. Notably, the driving factor layers are maintained consistently across all scenario simulations to ensure comparability of results. Differences among scenarios arise primarily from variations in total land demand and the configuration of restricted conversion zones, thereby capturing the development constraints and opportunities experienced by identical spatial locations under differing policy orientations.
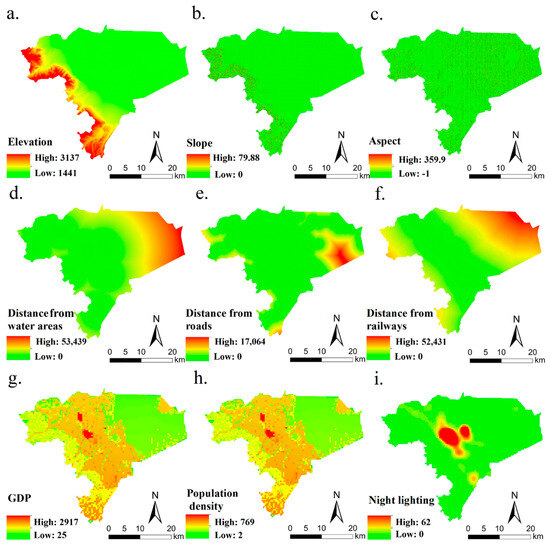
Figure 4.
Driving Factors of Spatiotemporal Evolution of Rural Settlements in Liangzhou District. Note: Spatial distribution of the nine driving factors considered in this study: (a) elevation, (b) slope, (c) aspect, (d) distance to water bodies, (e) distance to roads, (f) distance to railways, (g) GDP density, (h) population density, and (i) night lighting.
3.5.3. Simulation Accuracy Assessment
The Kappa coefficient serves as a crucial metric for evaluating classification accuracy and consistency, widely employed in verifying the precision of land-use simulation outcomes [49]. Prior to employing the CLUE-S model to simulate land use changes under various scenarios, this study validated the model’s simulation accuracy using the Kappa coefficient. Using 2010 as the base year and 2015 as the target year, land-use changes for 2015 were simulated, and the results were compared with observed land-use data to evaluate the reliability and predictive accuracy of the model.
In the formula, denotes the proportion of correct simulations; denotes the proportion of correct simulations expected under random conditions; denotes the proportion of correct simulations under ideal classification conditions. Typically, a Kappa value between 0.41 and 0.60 indicates feasible simulation results with moderate consistency; a value between 0.61 and 0.80 signifies satisfactory simulation results with good consistency. A higher Kappa value indicates superior simulation performance.
4. Results
4.1. Temporal Evolution of Rural Settlements
4.1.1. Land-Use Change Characteristics
From 2000 to 2023, a total of 8371.73 ha of various land types in Liangzhou District were converted into rural settlements. Grassland contributed the largest share of this expansion, accounting for 39.37% of the newly added area, followed by cropland (37.00%) and unused land (12.81%). Notably, the conversion of grassland to rural settlements was most intensive between 2020 and 2023, totaling 94.62 ha (Figure 5). Concurrently, the area of rural settlements transitioning to other land-use types gradually increased, primarily reverting to grassland and cropland, while smaller portions were converted to urban construction land, forest, and water bodies.
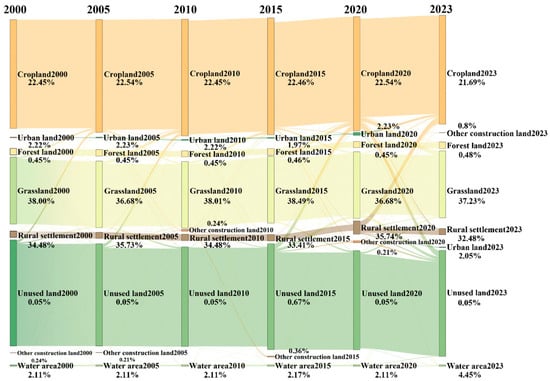
Figure 5.
Land-Use Changes in Liangzhou District, 2000–2023.
4.1.2. Evolution of Patch Size and Structure
From 2000 to 2023, the number and total area of rural settlement patches in Liangzhou District exhibited a consistent upward trend, accompanied by increasing spatial complexity (Figure 6). Between 2000 and 2010, patch numbers increased slightly from 1598 to 1619, corresponding to an average annual growth rate of 0.13%, while total area expanded from 10,321.83 ha to 10,573.02 ha, with an average annual growth of 0.24%. The Landscape Shape Index (LSI) rose modestly to 50.35, indicating a gradual increase in patch complexity. During 2010–2020, patch numbers declined marginally to 1613, whereas total area grew to 11,923.02 ha, with an average annual growth of 1.23%. The Largest Patch Index (LPI) increased from 0.999% to 5.528%, reflecting localized clustering and expansion trends. In the 2020–2023 period, patch numbers surged to 3009, and total area expanded to 20,828.34 ha, representing annual growth rates of 22.7% and 20.3%, respectively. Meanwhile, mean patch area decreased to 6.92 ha, and LSI sharply escalated to 80.33, demonstrating marked fragmentation and dispersal of rural settlements (Table A2).
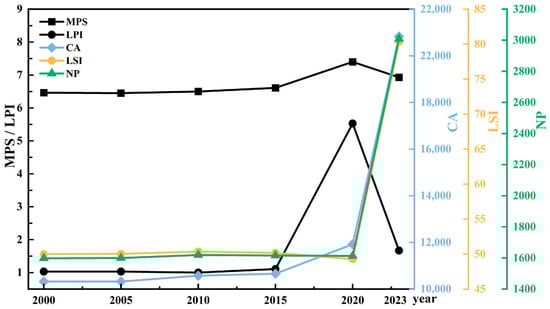
Figure 6.
Landscape Pattern Metrics of Rural Settlements in Liangzhou District, 2000–2023.
4.1.3. Spatiotemporal Distribution Patterns
From 2000 to 2023, the kernel density of rural settlements in Liangzhou District rose from 0.013 km2 to 3.467 km2, reflecting a sustained upward trajectory (Figure 7). Spatially, settlements shifted from a dispersed arrangement to a pattern increasingly concentrated around urban centers and along major transportation corridors. In the early period, settlement distribution was relatively scattered; after 2010, clustering intensified in proximity to the central urban area, expressways, and principal transport arteries, forming a high-density configuration characterized by urban cores interconnected with linear transport corridors.
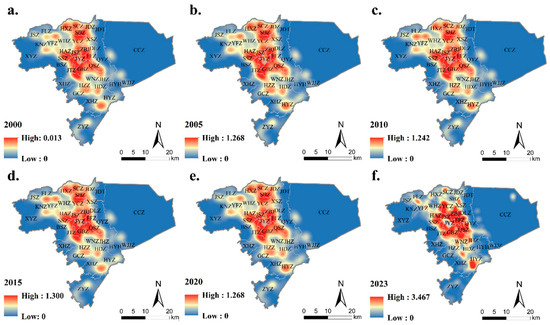
Figure 7.
Kernel Density of Rural Settlements in Liangzhou District, 2000–2023. Note: The subfigures show the kernel density distribution of rural settlements in the years (a) 2000, (b) 2005, (c) 2010, (d) 2015, (e) 2020, and (f) 2023.
4.1.4. Spatial Evolution Types and Phase Characteristics
From 2000 to 2023, the Average Nearest Neighbor (ANN) index of rural settlements in Liangzhou District increased from 0.294 to 0.336. Although exhibiting slight fluctuations, the ANN consistently remained well below 1, indicating a distinctly clustered spatial distribution (Table 2). Integrating temporal dynamics with spatial pattern analyses, the evolution of rural settlements can be classified into four distinct types: expansion, merger, decline, and emergence.
Table 2.
Average Nearest Neighbor (ANN) Index and Clustering Characteristics (Z) of Rural Settlements in Liangzhou District, 2000–2023.
Between 2000 and 2010, rural settlements in Liangzhou District experienced a phase marked by both stability and localized expansion, with a total area increase of approximately 251.19 km2. Expansion-type settlements were predominantly concentrated in Huaian Town, newly emergent settlements were mainly distributed across Fengle, Yongchang, and Wuhe Towns, while decline-type settlements were primarily observed in Jinyang and Wunan Towns. From 2010 to 2020, the district entered a phase of accelerated expansion, with the total expanded area reaching 1350 km2. During this period, expansion and merger processes progressed simultaneously: expansion-type settlements were chiefly located in Gaoba, Heping, and Huangyang Towns, merger-type settlements were concentrated in Fafang and Jinyang Towns, and newly emergent settlements were widely dispersed across Jinsha, Qingyuan, and Hujiajing Towns (Figure 8).
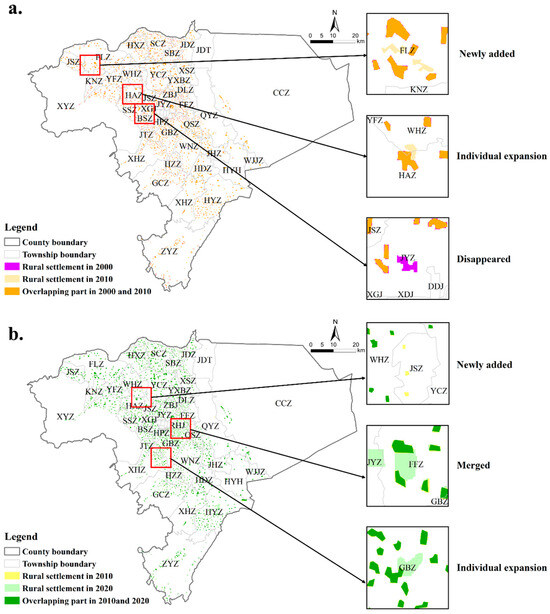
Figure 8.
Evolution Patterns of Rural Settlements in Liangzhou District: (a) 2000–2010; (b) 2010–2020.
4.2. Simulation and Evolution of Rural Settlement Spatial Patterns
4.2.1. Validation of Simulation Accuracy and Model Applicability
Model validation results yielded a Kappa coefficient of 0.88, surpassing the 0.7 threshold for acceptable accuracy. This demonstrates that the model possesses strong extrapolative precision and temporal stability, reliably reflecting the spatial evolution patterns of land use in the study area and providing a solid basis for subsequent scenario simulations (Figure 9).
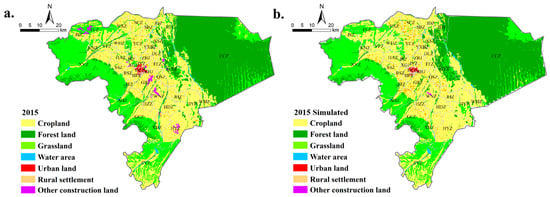
Figure 9.
Current land use status in 2015 (a); Simulated land use in 2015 (b).
4.2.2. Land-Use Change Characteristics of Rural Settlements Under Different Scenarios
Under the natural development scenario, by 2035, the areas of rural settlements, forest land, and grassland are projected to decrease by 5.27 km2, 81.12 km2, and 15.31 km2, respectively, while cropland, urban land, water bodies, and other construction land are expected to increase by 33.56 km2, 26.89 km2, 1.07 km2, and 40.17 km2, respectively (Figure 10; Table A4). The reduction in rural settlements is mainly attributed to competition with cropland, grassland, and construction land, with conversions of approximately 4.13 km2 to cropland, 0.92 km2 to grassland, 2.35 km2 to urban land, and 1.17 km2 to other construction land. Simultaneously, 1.04 km2 of cropland, 1.06 km2 of grassland, and 0.56 km2 of urban land are projected to be converted into rural settlements.
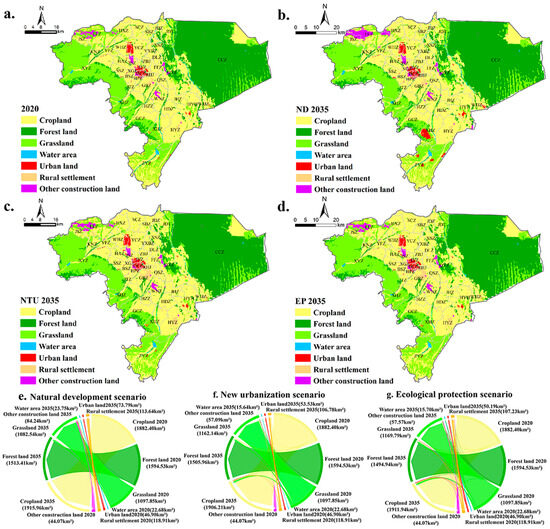
Figure 10.
Land-Use Patterns and Changes in Liangzhou District: (a) Land-use status in 2020; (b) projected land-use under the 2035 natural development scenario; (c) projected land-use under the 2035 new urbanization scenario; (d) projected land-use under the 2035 ecological protection scenario; and (e–g) corresponding spatial distributions of land-use changes.
Under the new urbanization scenario, rural settlements, forest land, and water bodies are projected to decline by 12.13 km2, 88.58 km2, and 7.04 km2, respectively, whereas cropland, grassland, urban land, and other construction land are expected to expand by 23.81 km2, 64.29 km2, 6.63 km2, and 13.01 km2, respectively (Figure 10; Table A5). The decrease in rural settlements is primarily driven by the expansion of cropland and construction land, with conversions of 42.67 km2 to cropland, 1.03 km2 to grassland, 1.00 km2 to urban land, and 0.33 km2 to other construction land. Conversely, 32.23 km2 of cropland is projected to be transformed into rural settlements.
Under the ecological protection scenario, rural settlements, forest land, water bodies, urban land, and other construction land are projected to decrease by 11.68 km2, 99.59 km2,6.98 km2, 6.71 km2, and 13.50 km2, respectively, while cropland and grassland are expected to increase by 29.54 km2 and 71.94 km2, respectively (Figure 10; Table A6). The conversion of rural settlements predominantly occurs toward cropland (42.95 km2) and grassland (1.06 km2), whereas cropland (32.10 km2) and minor portions of grassland and water bodies are projected to revert into rural settlements.
4.2.3. Spatial Evolution Trends of Rural Settlements Under Different Scenarios
To provide a clear depiction of the spatial evolution of rural settlements under different scenarios, the 2035 simulated distributions were overlaid with the actual 2020 settlement patterns (Figure 11). Under the natural development scenario, rural settlements predominantly exhibit a “contraction-dominated with localized expansion” pattern. Areas of disappearance are primarily concentrated in Jinsha, Jinyang, Heping, Xiehe, and Zhangyi towns, whereas expansion is mainly observed in Yongchang, Gaoba, and Wuhe towns. By 2035, the total area of rural settlements is projected to decline by approximately 558.36 hm2 compared with 2020.
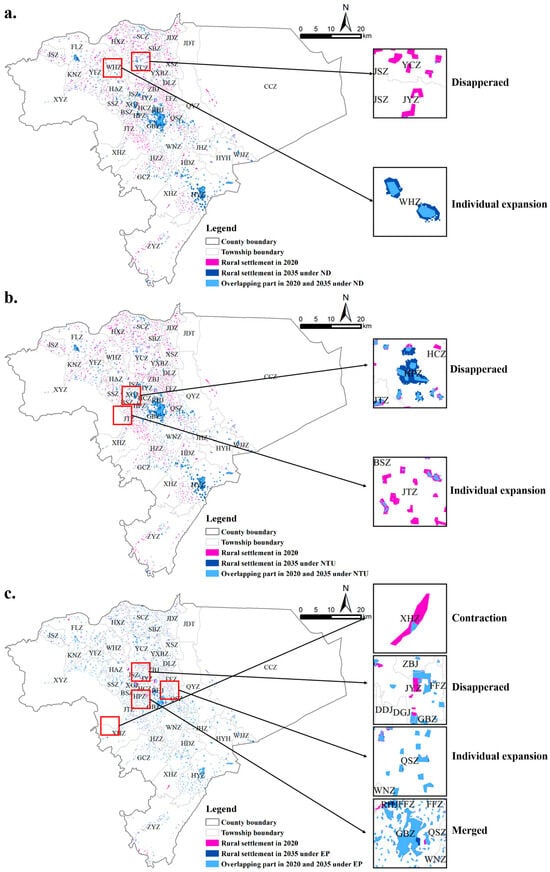
Figure 11.
Projected spatial patterns of rural settlements in 2035 under (a) the natural development scenario, (b) the new urbanization scenario, and (c) the ecological protection scenario.
Under the new urbanization scenario, rural settlements demonstrate an overall contraction, with the intensity of disappearance markedly increased, particularly in Zhongba, Xinhua, Fafang, and Jinta towns. Limited expansion occurs in Huangyang, Heping, and Gaoba towns. By 2035, the settlement area is expected to decrease by approximately 1245.06 hm2 relative to 2020.
Under the ecological protection scenario, the spatial dynamics of rural settlements are characterized predominantly by contraction and disappearance, supplemented by localized expansion and merging. Contraction is mainly observed in Xinhua Town, disappearance in Zhongba, Xinhua, and Fafang towns, limited expansion in Qingshui and Huangyang towns, and merging in Fengle and Gaoba towns. Overall, by 2035, rural settlements are projected to decrease by approximately 1199.97 hm2 relative to 2020.
5. Discussion
5.1. Driving Forces of Spatiotemporal Evolution of Rural Settlements
5.1.1. Foundational Drivers: Physical Geography and Socio-Economic Factors
The spatiotemporal evolution of rural settlements in Liangzhou District is shaped by the interactive effects of natural environmental conditions, demographic dynamics, economic development, and policy interventions. Geographically, the district exhibits a characteristic “mountain–oasis–desert” composite landscape. The southwestern and northeastern regions, with relatively flat terrain and abundant water resources, favor concentrated settlement layouts, whereas the northwestern and southeastern areas, characterized by undulating topography and ecologically sensitive zones, impose constraints on settlement expansion [50]. Water availability is a particularly decisive factor: settlements along the oasis periphery are heavily dependent on river networks and groundwater, resulting in linear, river-aligned, and water-access-oriented spatial configurations.
Population and economic factors display a complex and sometimes counterintuitive relationship. Between 2000 and 2023, the rural population declined significantly, with an average annual decrease of 2.98%, whereas the total area of rural settlements nearly doubled, growing at an average annual rate of 3.08%, resulting in a typical “population decrease–land increase” phenomenon. This indicates that settlement expansion is not directly driven by population growth, but rather by the combined effects of changing residential patterns, utilization of idle homesteads, demand for new housing, and household downsizing trends. These patterns reflect historical issues in rural homestead management, such as “multiple houses per household” and the practice of constructing new dwellings without demolishing old ones, as well as rational household decisions motivated by land value appreciation and retirement security considerations. Additionally, reliance on land-based fiscal revenues has indirectly incentivized local governments to actively organize and regulate rural construction land, further influencing the spatial restructuring of settlements. Simultaneously, rapid economic development—GDP growth exceeding 800%—provided financial resources, infrastructure investment, and industrial guidance. In particular, after 2010, the economic radiation effect became pronounced, promoting a transition in rural settlement patterns from dispersed expansion to a “center–axis” configuration along transportation corridors and urban clusters (Table 3).
Table 3.
Policy Documents Related to Rural Settlement Development at the National, Gansu Provincial, and Wuwei City (Liangzhou District) Levels.
Multi-scenario simulations further clarify the spatial imprint of these driving forces. Under the natural development scenario, settlements experience slight contraction (5.27 km2), predominantly at the edges of historically expanded areas, reflecting the influence of population outflow and urbanization siphoning effects. Under the new urbanization scenario, rural settlements undergo the most substantial reduction (12.13 km2), as population concentration in towns drives widespread conversion of core and peri-urban settlements into urban land, intensifying competition with farmland and grassland. This highlights the direct role of policy and population mobility in shaping spatial patterns. In the ecological protection scenario, settlement contraction (11.68 km2) is constrained by strict ecological redlines, limiting development in sensitive areas; nevertheless, moderate expansion occurs at certain oasis margins, indicating spatial adaptability and flexible settlement configurations under ecological constraints.
Overall, the evolution of rural settlement patterns in Liangzhou District reflects the synergistic influence of natural constraints, demographic and economic drivers, and policy guidance. Water resources and topography define the foundational spatial framework, demographic shifts and economic growth provide dynamic momentum, and policy interventions direct expansion and aggregation intensity. Together, these factors generate a hierarchical “core–corridor–periphery” spatial structure exhibiting a dynamic and evolving pattern.
5.1.2. Institutional Mechanisms and Household Behaviors Shaping Settlement Evolution
The spatial evolution of rural settlements is influenced not only by natural and economic factors but also profoundly shaped by institutional frameworks and micro-level household behaviors. The observed “population decrease–land increase” phenomenon reflects the tension between homestead management policies and household decision-making.
First, although the homestead management system formally emphasizes a “one household, one homestead” principle, its implementation exhibits temporal lags and regional variability. In some villages and towns of Liangzhou District, the coexistence of idle and newly constructed homesteads highlights policy “path dependency” and regulatory gaps.
Second, under the context of land-based fiscal reliance, local governments derive revenue through homestead reclamation, construction land quota transfers, and related mechanisms, indirectly influencing the spatial consolidation and withdrawal of settlements. Particularly under the new-type urbanization scenario, the marked reduction in rural settlement area is partly attributable to policy-driven homestead reorganization and the implementation of projects linking urban–rural land adjustments to construction land allocations.
Finally, household decision-making exhibits clear rationality. On one hand, remaining rural households construct or expand residences to improve living conditions; on the other hand, migrant households retain homesteads to preserve the option of returning or to safeguard land as an asset, resulting in the simultaneous presence of “hollow villages” and expanding construction land. The interplay between these micro-level behaviors and macro-level policies constitutes a key mechanism for understanding the coexistence of fragmentation and aggregation in rural settlement patterns.
5.1.3. The Rigid Boundary Effect of Water Resource Constraints
The multi-scenario simulations reveal the substantial impacts of different development pathways on the water resource system in Liangzhou District. Under the natural development scenario, the area of water bodies increases slightly by 1.07 km2, whereas under the new-type urbanization and ecological protection scenarios, water body areas decrease by 7.04 km2 and 6.98 km2, respectively, reflecting the differentiated influence of policy orientations on the water system. In the natural development scenario, water areas remain relatively stable, although the conversion of rural settlements to cropland may indirectly increase agricultural water demand. In the new-type urbanization scenario, population and industrial activities concentrate in urban areas, leading to the expansion of construction land at the expense of some water bodies. Coupled with insufficient water-saving measures in agricultural restructuring, water resource pressures are further intensified. Moreover, policies emphasizing cropland protection to ensure food security may inadvertently promote high-water-consumption agricultural practices, exacerbating competition between agricultural and ecological water use. Under the ecological protection scenario, the reduction in water bodies highlights potential conflicts among policy objectives. Although ecological protection redlines strictly restrict the conversion of ecological land to construction land, the core focus remains on preserving cropland and maintaining landscape patterns, with insufficient rigid protection for water bodies. Consequently, during ecological restoration, inappropriate land consolidation may indirectly alter local hydrological cycles and encroach upon ecological water allocations, leading to a decrease in water body areas.
These findings underscore shortcomings in current territorial spatial planning and ecological protection policies regarding systemic water resource management. Existing policies emphasize land-use regulation but have not adequately incorporated water resource carrying capacity as a core constraint in spatial allocation decisions. Therefore, future planning—particularly in arid inland river basins—should consider the balance of water supply and demand as a critical criterion for evaluating the feasibility of development or protection under multiple scenarios.
5.2. Comparison with Other Studies
This study systematically reveals the spatiotemporal evolution of rural settlements in Liangzhou District by integrating multi-temporal remote sensing data, landscape indices, and the CLUE-S model, while incorporating policy constraints such as permanent basic farmland and ecological protection areas in multi-scenario simulations, thereby enhancing the practical relevance of the results. Compared with other studies in the Hexi region, our findings indicate that rural settlements in Liangzhou District experienced continuous expansion between 2000 and 2023, with a total area increase of 101.8%. The expansion accelerated notably during 2020–2023, with an average annual growth rate of 20.3%. Previous studies have reported that rural settlements gradually shift from a “shrinking” to an “integrating” pattern over time, resulting in intensified spatial aggregation [51]. However, in Liangzhou District, the number of settlement patches surged from 1613 to 3009 between 2020 and 2023, while the mean patch size decreased, suggesting that, under the Rural Revitalization Strategy, active settlement development may be accompanied by emerging fragmentation issues.
In terms of spatial distribution, rural settlements in Liangzhou District exhibit a pronounced clustered pattern, as indicated by an average nearest neighbor index (ANN) consistently below 1. High-density areas increasingly concentrate around town centers and major transport corridors. Previous research has highlighted the historical continuity and spatial extension characteristics of settlements in oasis regions [52], reflecting the broad spatial development potential in such areas. Compared with other arid-region oases, settlement evolution in Liangzhou District is subject to stronger constraints from water resources and ecological regulations. Consistent with prior findings, this study confirms that water availability and topography constitute fundamental limiting factors for settlement distribution [53]; however, given Liangzhou District’s location in the core of the Hexi Corridor, policy directives and economic development play a more pronounced role in settlement expansion.
Methodologically, simulating the spatiotemporal evolution of rural settlements remains challenging due to patch fragmentation, complex driving forces, and scale dependencies. Traditional land-use change models have limitations in application [45], whereas the Markov-CLUE-S coupled model incorporates region-specific policy constraints [54], improving its suitability for simulating land-use dynamics under policy-sensitive conditions in arid regions. Model validation indicates a Kappa coefficient of 0.88, demonstrating that the CLUE-S model achieves high accuracy in simulating land-use patterns at medium-to-small spatial scales.
In summary, this study not only elucidates the spatiotemporal evolution of rural settlements in Liangzhou District but also, through the integration of policy constraints and multi-scenario simulations, enhances the applicability of the findings for national spatial planning and the implementation of rural revitalization strategies. Furthermore, it provides a methodological reference and empirical case study for research on rural settlements in arid-region oases.
5.3. Policy Recommendations
As a representative oasis region in an arid environment, Liangzhou District exhibits a rural settlement pattern characterized by rapid spatial expansion and pronounced clustering along urban cores and major transportation corridors, while ecologically sensitive zones display localized contraction and degradation. These spatial dynamics reflect the combined influence of natural constraints, demographic and socioeconomic transitions, and institutional interventions. Water scarcity and topographic limitations impose rigid boundaries on settlement expansion; meanwhile, rural depopulation and shrinking household size have generated localized phenomena of “population decline alongside land increase.” In parallel, economic growth and infrastructure investment have reinforced the concentration of rural settlements along development axes. To optimize rural spatial structures and promote regional sustainability, policy formulation should be guided by settlement morphology and underlying driving forces, advancing a governance framework that integrates scientific planning, intensive land use, ecological constraints, and coordinated institutional action.
First, strengthen planning-oriented guidance and promote differentiated spatial regulation. The natural development scenario indicates the risk of continued disorderly expansion in marginal oasis areas and river-dependent zones. County- and township-level territorial spatial planning should therefore delineate settlement expansion boundaries and strictly implement policies such as “one household, one homestead” and the concentrated layout of homestead land [55]. A place-based and classification-oriented planning approach is essential. In areas within the sphere of urban influence, consolidation toward central villages or characteristic conservation villages—guided by accessibility, service capacity, and development potential—should be encouraged to foster compact settlement patterns and enhance infrastructure sharing and land-use efficiency. In ecologically sensitive or persistently depopulating frontier areas, restrictive or contraction-oriented planning should be adopted to strictly regulate new construction and guide population relocation toward towns or central villages, ensuring ecological security while maintaining the coherence of the rural spatial system.
Second, optimize land resource allocation to promote coordinated intensive use and ecological restoration. Multi-scenario simulations reveal clear reductions in rural settlement land under both new-type urbanization and ecological protection pathways, indicating strong competition among rural construction land, cultivated land, and ecological land. Consequently, priority should be given to revitalizing existing construction land and idle homesteads [56]. To address vacated or inefficiently used homesteads resulting from rational household behavior, an integrated mechanism of “voluntary withdrawal–reclamation and value enhancement–land activation” should be established, enabling the reallocation of released quotas to support central village development and rural industrial integration. Strict control of new land conversion is necessary, particularly within ecological redlines and water-scarce zones. Exploring market-oriented homestead allocation and benefit-sharing mechanisms may further incentivize farmer participation, facilitating both efficient land restructuring and the safeguarding of household rights and interests.
Third, improve rural infrastructure layout to enhance spatial guidance functions [57]. The analysis demonstrates that settlement agglomeration is strongly aligned with transportation corridors and urban centers, highlighting the pivotal role of infrastructure in shaping spatial form. Optimizing the rural road network, improving water conservancy systems, and enhancing public service facilities can promote orderly settlement concentration along primary development axes while reducing fragmentation caused by dispersed construction. Targeted infrastructure investment not only elevates residents’ living standards but also strengthens the spatial coupling between settlement patterns and regional economic activities, supporting functional enhancement and structural optimization in rural areas.
Fourth, strengthen multi-stakeholder governance and ecological compensation mechanisms to ensure effective policy implementation. Scenario simulations indicate that settlement contraction and relocation in ecologically fragile or water-limited areas are, to some extent, unavoidable. Establishing participatory governance mechanisms—ensuring farmers’ rights to information [58], participation, and oversight in planning, relocation, and benefit sharing—is crucial. Ecological compensation and homestead withdrawal compensation mechanisms should be developed to achieve a balance between ecological benefits and social equity. For households relocated from urban fringe areas, priority should be given to employment support and industrial transformation. For those relocated from ecological redline zones, ecological compensation and land-value appreciation sharing should be emphasized to enhance relocation willingness and promote positive interactions between ecological protection and livelihood improvement.
In sum, the sustainable governance of rural settlements in Liangzhou District should be grounded in a systematic understanding of the pattern–process–mechanism relationship. Differentiated spatial planning serves as the foundation, intensive land use as the core, infrastructure optimization as the guiding force, ecological protection as the bottom line, and multi-stakeholder governance as the institutional guarantee. Together, these elements form an integrated policy framework capable of supporting coordinated human–land relationships and advancing high-quality rural development in arid-region oases.
6. Conclusions
This study takes Liangzhou District, a representative oasis in the arid northwest of China, as a case study and develops an integrated analytical framework of “pattern evolution–scenario simulation–driving mechanisms” to systematically reveal the spatiotemporal evolution of rural settlements from 2000 to 2033. The main findings are summarized as follows:
Spatiotemporal Evolution of Rural Settlements (2000–2023): Rural settlements in Liangzhou District experienced continuous expansion and significant spatial restructuring. Patch number and total area increased by 88.3% and 101.8%, respectively, with spatial distribution shifting from dispersed to aggregated patterns, forming an axial structure centered on urban cores and transportation corridors. Concurrently, the mean patch size declined while the landscape shape index increased, indicating pronounced landscape fragmentation during settlement expansion.
Scenario Simulation for 2035: Multi-scenario simulations demonstrate that different policy pathways exert substantial impacts on settlement evolution. Compared with the natural development scenario (a reduction of 5.27 km2), the new-type urbanization (−12.13 km2) and ecological protection (−11.68 km2) scenarios both result in more pronounced settlement contraction, highlighting the critical role of policy interventions in promoting spatial intensification and structural optimization of rural settlements. Model validation yielded a Kappa coefficient of 0.88, indicating strong predictive reliability.
Driving Mechanisms: The evolution of rural settlements is jointly driven by natural, socio-economic, and institutional factors. Water resource distribution and topographic conditions impose rigid spatial constraints on settlement expansion. The “population decrease–land increase” paradox reflects profound changes in residential patterns and household livelihood strategies. Meanwhile, homestead management, territorial spatial planning, and ecological protection policies collectively shape the direction and form of settlement spatial restructuring.
Limitations and Future Directions: This study faces limitations, including data resolution constraints and limited responsiveness of the model to micro-level behaviors. Future research should incorporate high-resolution remote sensing and multi-source social data, explore coupled simulations integrating agent-based models (ABM) with water resource constraints, and strengthen cross-scale system analyses and rural social–ecological resilience studies to deepen understanding of rural human–environment system dynamics in arid regions and provide stronger scientific support for sustainable spatial governance.
Based on the findings and limitations of this study, several avenues for further research are proposed: Integrating Water Resource Constraints: Incorporate water carrying capacity as a core constraint, linking outputs from distributed hydrological models (e.g., SWAT) with dynamic indicators such as groundwater depth and agricultural water quotas, thereby shifting from a “land-driven development” to a “water-driven land and population allocation” simulation paradigm. Exploring Cross-Scale Interactions and Feedbacks: Develop coupled basin-scale models to examine how changes in rural settlements influence the broader Heihe River basin’s water–ecology–economy system via virtual water flows, identifying externalities of rural development at larger scales. Expanding Social–Ecological Resilience Research: Building on spatial pattern analyses, assess the adaptive capacity of different settlement configurations to climate variability and market fluctuations, providing theoretical and practical guidance for constructing resilient future rural landscapes.
Author Contributions
Z.D.: Methodology, Software, Validation, Formal analysis, Investigation, Data curation, Writing—original draft; C.L.: Conceptualization, Writing—review & editing; X.W.: Resources, Visualization; X.T.: Conceptualization, Funding acquisition, Supervision, Project administration; S.S.: Writing—review & editing, Supervision. All authors have read and agreed to the published version of the manuscript.
Funding
This research received no external funding.
Data Availability Statement
The datasets used and analyzed during this study are primarily from public repositories or have been cited in the main text. Specifically: Land use data, DEM data, GDP data, and population density data were obtained from the Resource and Environment Science and Data Center (https://www.resdc.cn/ (accessed on 10 May 2025)). Water area data, railway data, and highway data were accessed via OpenStreetMap (OSM) (www.navmaps.eu/ (accessed on 10 May 2025)). Nocturnal luminosity data from Developing Improved Time-Series DMSP-OLS-Like Data (1992–2019) in China by Integrating DMSP-OLS and SNPP-VIIRS. The Permanent Basic Farmland Protection Boundary data were provided by the Gansu Provincial Natural Resources Department and are available upon reasonable request. Nature Reserve data were provided by the China Nature Reserve Specimen Resource Sharing Platform. All public data sources are openly accessible as indicated, while data from the Resource and Environment Science and Data Center are available through real-name registration.
Conflicts of Interest
The authors declare no conflicts of interest.
Appendix A
Table A1.
Definitions and ecological significance of landscape pattern metrics.
Table A1.
Definitions and ecological significance of landscape pattern metrics.
| Landscape Index | Formula | Formula Specification |
|---|---|---|
| Patch Area (CA) | CA denotes the area of rural settlement patches, reflecting the scale of rural settlements. | |
| Number of Patches (NP) | NP denotes the number of rural settlement patches, reflecting landscape heterogeneity. | |
| Mean patch area (MPS) | MPS denotes the average plot area of rural settlements, reflecting the degree of dispersion among rural settlements. | |
| Largest Patch Index (LPI) | LPI denotes the proportion of the largest patch area within a landscape relative to its total area, serving to reflect the dominance of a single patch within the landscape structure. | |
| Landscape Shape Index (LSI) | LSI denotes the complexity of patch shapes within a landscape, specifically the ratio of patch boundary length to the minimum possible boundary length. It serves to measure the complexity of patch shapes relative to simpler forms such as squares or circles. |
Table A2.
Land-Use Transition Probability Matrix for Liangzhou District, 1990–2010.
Table A2.
Land-Use Transition Probability Matrix for Liangzhou District, 1990–2010.
| Cropland | Forest Land | Grassland | Water Area | Urban Land | Rural Settlement | Other Construction Land | |
|---|---|---|---|---|---|---|---|
| Cropland | 0.91578 | 0.02506 | 0.04972 | 0.17592 | 0.56025 | 0.34009 | 5.43284 |
| Forest Land | 0.03514 | 0.93753 | 0.02461 | 0.12700 | 0.00939 | 0.00119 | 2.67164 |
| Grassland | 0.02940 | 0.01165 | 0.92622 | 0.04233 | 0.00000 | 0.00204 | 4.01493 |
| Water Area | 0.00054 | 0.00111 | 0.00059 | 0.81562 | 0.00000 | 0.00000 | 0.00000 |
| Urban Land | 0.00010 | 0.00056 | 0.00000 | 0.00000 | 0.90454 | 0.00000 | 0.00000 |
| Rural settlement | 0.33447 | 0.00036 | 0.00009 | 0.00659 | 0.02034 | 0.65497 | 0.02239 |
| Other construction land | 0.00000 | 0.00000 | 0.00000 | 0.00000 | 0.00000 | 0.00000 | 1.00000 |
Table A3.
Landscape pattern indices in Liangzhou District from 2000 to 2023.
Table A3.
Landscape pattern indices in Liangzhou District from 2000 to 2023.
| 2000 | 2005 | 2010 | 2015 | 2020 | 2023 | |
|---|---|---|---|---|---|---|
| NP | 1598 | 1600 | 1619 | 1616 | 1613 | 3009 |
| CA | 10,321.83 | 10,322.91 | 10,573.02 | 10,656.99 | 11,923.02 | 20,828.34 |
| MPS | 6.46 | 6.45 | 6.50 | 6.61 | 7.40 | 6.93 |
| LPI | 1.03 | 1.03 | 1.00 | 1.11 | 5.53 | 1.67 |
| LSI | 50.00 | 50.03 | 50.35 | 50.17 | 49.28 | 80.33 |
Table A4.
Land use transfer matrix from 2020 to 2035 under natural development scenario (km2).
Table A4.
Land use transfer matrix from 2020 to 2035 under natural development scenario (km2).
| Cropland | Forest Land | Grassland | Water Area | Urban Land | Rural Settlement | Other Construction Land | Area in 2020 | |
|---|---|---|---|---|---|---|---|---|
| Cropland | 1878.17 | 0.21 | 2.37 | 0.022 | 0.28 | 1.04 | 0.31 | 1882.40 |
| Forest Land | 17.55 | 1502.19 | 71.33 | 0.55 | 0.97 | 0.344 | 1.61 | 1594.53 |
| Grassland | 15.37 | 10.98 | 1005.74 | 2.90 | 25.00 | 1.06 | 36.81 | 1097.85 |
| Water Area | 0.59 | 0.04 | 1.73 | 20.28 | 0.02 | 0.02 | 0 | 22.68 |
| Urban Land | 0.09 | 0 | 0.14 | 0 | 44.85 | 0.56 | 1.27 | 46.90 |
| Rural settlement | 4.13 | 0 | 0.92 | 0 | 2.35 | 110.34 | 1.17 | 118.91 |
| Other construction land | 0.07 | 0 | 0.31 | 0 | 0.32 | 0.29 | 43.08 | 44.07 |
| Area under ND | 1915.97 | 1513.41 | 1082.54 | 23.75 | 73.79 | 113.65 | 84.24 | 4807.36 |
Table A5.
Land use transfer matrix from 2020 to 2035 under the new urbanization scenario (km2).
Table A5.
Land use transfer matrix from 2020 to 2035 under the new urbanization scenario (km2).
| Cropland | Forest Land | Grassland | Water Area | Urban Land | Rural Settlement | Other Construction Land | Area in 2020 | |
|---|---|---|---|---|---|---|---|---|
| Cropland | 1765.90 | 9.49 | 65.23 | 0.83 | 4.26 | 32.23 | 4.47 | 1882.40 |
| Forest Land | 53.33 | 1477.91 | 60.51 | 0.49 | 0.66 | 0.35 | 1.27 | 1594.53 |
| Grassland | 37.41 | 18.28 | 1032.59 | 0.38 | 0.44 | 0.08 | 8.66 | 1097.85 |
| Water Area | 6.04 | 0.24 | 2.44 | 13.94 | 0.01 | 0.02 | 0 | 22.68 |
| Urban Land | 0 | 0 | 0 | 0 | 46.90 | 0 | 0 | 46.90 |
| Rural settlement | 42.67 | 0.00 | 1.03 | 0 | 1.00 | 73.88 | 0.33 | 118.91 |
| Other construction land | 0.86 | 0.04 | 0.35 | 0 | 0.25 | 0.22 | 42.35 | 44.07 |
| Area under NTU | 1906.21 | 1505.96 | 1162.14 | 15.64 | 53.53 | 106.78 | 57.09 | 4807.35 |
Table A6.
Land use transfer matrix from 2020 to 2035 under ecological protection scenario (km2).
Table A6.
Land use transfer matrix from 2020 to 2035 under ecological protection scenario (km2).
| Cropland | Forest Land | Grassland | Water Area | Urban Land | Rural Settlement | Other Construction Land | Area in 2020 | |
|---|---|---|---|---|---|---|---|---|
| Cropland | 1767.38 | 8.78 | 64.51 | 0.89 | 4.26 | 32.10 | 4.48 | 1882.40 |
| Forest Land | 55.04 | 1470.77 | 65.67 | 0.53 | 0.75 | 0.51 | 1.27 | 1594.53 |
| Grassland | 38.01 | 15.11 | 1034.99 | 0.47 | 0.43 | 0.07 | 8.76 | 1097.85 |
| Water Area | 6.09 | 0.23 | 2.51 | 13.81 | 0.01 | 0.03 | 0 | 22.68 |
| Urban Land | 1.64 | 0.00 | 0.67 | 0 | 43.53 | 0.72 | 0.34 | 46.90 |
| Rural settlement | 42.95 | 0.00 | 1.06 | 0 | 0.98 | 73.58 | 0.34 | 118.91 |
| Other construction land | 0.84 | 0.038 | 0.37 | 0 | 0.23 | 0.22 | 42.38 | 44.07 |
| Area under EP | 1911.94 | 1494.94 | 1169.79 | 15.70 | 50.19 | 107.23 | 57.57 | 4807.36 |
References
- Sun, T.; Chen, J.; Guo, J. Multi-Source Data-Driven Identification and Spatial Optimization of Rural Settlements: Evidence from Sangxu, China. Sustainability 2025, 17, 7561. [Google Scholar] [CrossRef]
- Kanter, R.; Fort, M.P. Shared burdens, shared responsibilities: Advancing the 2030 Agenda for Sustainable Development. Lancet 2025, 406, 1703–1705. [Google Scholar] [CrossRef] [PubMed]
- Jackson, E.D.; Laaribi, A. Geospatial Information to Support the UN’s Sustainable Development Goals; CRC Press: Boca Raton, FL, USA, 2025. [Google Scholar]
- Ran, H.; Liu, R.; Xing, L.; Zhao, Y.; Zhang, K. Can urban-rural public services drive the realization of sustainable development goals? An empirical study of a typical rural-urban integration pilot area in China. J. Rural Stud. 2025, 120, 103818. [Google Scholar] [CrossRef]
- Lao, X.; Istrate, A.L.; Pilla, F. Navigating vulnerable community-based urban heat adaptation under SDG 11. Npj Urban Sustain. 2025, 5, 49. [Google Scholar] [CrossRef]
- Seddik, G.H.; Sovacool, B.K. Climate policy, Least Developed Countries, and the Sustainable Development Goals: A critical review of SDG13 and infrastructural, institutional, and informational resilience. Environ. Sci. Policy 2025, 170, 104129. [Google Scholar] [CrossRef]
- Chen, G.; Zhang, L.; Zhang, D.; Zhao, J. Temporal and Spatial Carbon Stock Changes and Driving Mechanisms Based on Land Use Multi—Scenario Modeling: An Assessment of SDGs15.3—A Case Study of the Central Yunnan Urban Agglomeration, China. Land Degrad. Dev. 2025, 36, 3017–3036. [Google Scholar] [CrossRef]
- Chen, Y.; Yan, X.; Zhang, J.; Chen, C.; Wang, Y.; Fan, J. Determinants and governance of unused rural residential bases in the context of Rural Revitalisation in China. Sci. Rep. 2025, 15, 33850. [Google Scholar] [CrossRef]
- Li, H.; Song, W. Evolution of rural settlements in the Tongzhou District of Beijing under the new-type urbanization policies. Habitat Int. 2020, 101, 102198. [Google Scholar] [CrossRef]
- Duan, Y.; Chen, S.; Zhang, L.; Wang, D.; Liu, D.; Hou, Q. Spatial Distribution Characteristic and Type Classification of Rural Settlements: A Case Study of Weibei Plain, China. Sustainability 2023, 15, 8736. [Google Scholar] [CrossRef]
- Zhang, R.; Zhang, X. Spatial Pattern Evolution and Driving Mechanism of Rural Settlements in Rapidly Urbanized Areas: A Case Study of Jiangning District in Nanjing City, China. Land 2023, 12, 749. [Google Scholar] [CrossRef]
- Zhu, B.; Li, H.; Hu, Z.; Wen, Y.; Che, J. An Evaluation and Optimization of the Spatial Pattern of County Rural Settlements: A Case Study of Changshu City in the Yangtze River Delta, China. Land 2022, 11, 1412. [Google Scholar] [CrossRef]
- Ren, P.; Hong, B.T.; Liu, Y.; Zhou, J.M. A study of spatial evolution characteristics of rural settlements and influences of landscape patterns on their distribution using GIS and RS. Acta Ecol. Sin. 2014, 34, 3331–3340. [Google Scholar] [CrossRef]
- Zhang, Y.; Duan, S.; Dong, L.; Ding, X. Spatial Sustainability of Agricultural Rural Settlements: An Analysis of Rural Spatial Patterns and Influencing Factors in Three Northeastern Provinces of China. Sustainability 2025, 17, 5597. [Google Scholar] [CrossRef]
- Zhang, J.; Li, L.; Li, Q.; Chen, W.; Huang, J.; Guo, Y.; Ji, G. Multiscenario Land Use Change Simulation and Its Impact on Ecosystem Service Function in Henan Province Based on FLUS-InVEST Model. Ecol. Evol. 2025, 15, e71111. [Google Scholar] [CrossRef]
- Zhang, Z.; Liu, Y.; Sheng, S.; Liu, X.; Xue, Q. Evolving Urban Expansion Patterns and Multi-Scenario Simulation Analysis from a Composite Perspective of “Social–Economic–Ecological”: A Case Study of the Hilly and Gully Regions of Northern Loess Plateau in Shaanxi Province. Sustainability 2024, 16, 2753. [Google Scholar] [CrossRef]
- Yirsaw, E.; Wu, W.; Temesgen, H.; Bekele, B. Socioeconomic Drivers of Spatio-Temporal Land Use/Land Cover Changes in a Rapidly Urbanizing Area of China, the Su-Xi-Chang Region. Appl. Ecol. Environ. Res. 2017, 15, 809–827. [Google Scholar] [CrossRef]
- Zhong, Z.; Peng, B.; Elahi, E. Spatial and temporal pattern evolution and influencing factors of energy–environmental efficiency:A case study of Yangtze River urban agglomeration in China. Energy Environ. 2021, 32, 242–261. [Google Scholar] [CrossRef]
- Yu, H.-X.; Wang, Y.-X. Spatio-temporal variations of ecosystem service value and its spatial heterogeneity mechanism in the Dongjiang River Basin, China. Ying Yong Sheng Tai Xue Bao = J. Appl. Ecol. 2023, 34, 2498–2506. [Google Scholar] [CrossRef]
- Ke, L.; Li, R.; Xu, Y. Study on Land Use Change and Its Impacts in the Nanming River Basin. Sustain. Dev. Res. 2025, 7, 109. [Google Scholar] [CrossRef]
- Han, M.Y.; Chen, G.Q.; Dunford, M. Land use balance for urban economy: A multi-scale and multi-type perspective. Land Use Policy 2019, 83, 323–333. [Google Scholar] [CrossRef]
- Sheng, S.; Song, W. Preferential encroachment of high-quality cropland by urban expansion across China: Past trends and future projections. Habitat Int. 2026, 167, 103655. [Google Scholar] [CrossRef]
- Sheng, S.; Lian, H. The Spatial Pattern Evolution of Rural Settlements and Multi-Scenario Simulations since the Initiation of the Reform and Opening up Policy in China. Land 2023, 12, 1763. [Google Scholar] [CrossRef]
- Kim, D.-S.; Chung, H.-W. Spatial Diffusion Modeling of New Residential Area for Land-Use Planning of Rural Villages. J. Urban Plan. Dev. 2005, 131, 181–194. [Google Scholar] [CrossRef]
- Kim, I.; Kwon, H. Assessing the Impacts of Urban Land Use Changes on Regional Ecosystem Services According to Urban Green Space Policies Via the Patch-Based Cellular Automata Model. Environ. Manag. 2020, 67, 192–204. [Google Scholar] [CrossRef] [PubMed]
- Wu, L.W.; Liu, G. Simulation and prediction of land-use change in Nanjing based on artificial bee colony cellular automata model. Bull. Surv. Mapp. 2022, 2, 95–99. [Google Scholar] [CrossRef]
- Kukuntod, N.; Wijitkosum, S. Escalating Drought Vulnerability Driven by Land Use Change: Insights from a GIS-Based CA-Markov and Multi-Criteria Assessment of Future Scenarios in the Lam Ta Kong Watershed. Earth Syst. Environ. 2025, 1–18. [Google Scholar] [CrossRef]
- Ho, V.H.; Morita, H.; Ho, T.H.; Bachofer, F. Spatiotemporal evolution of ecosystem carbon storage under land use/land cover dynamics in the coastal region of Central Vietnam. Adv. Space Res. 2025, 76, 4815–4837. [Google Scholar] [CrossRef]
- Dai, X.; Li, D.; Zheng, Y.; Liu, C.; Li, N.; Lu, H. Analysis of spatiotemporal changes and driving factors of green and blue carbon stocks in Zhangzhou City based on PLUS and InVEST models. J. Clean. Prod. 2025, 528, 146743. [Google Scholar] [CrossRef]
- Yu, Z.; Zhao, M.; Gao, Y.; Wang, T.; Zhao, Z.; Wang, S. Multiscenario Simulation and Prediction of Land Use in Huaibei City Based on CLUE-S and PLUS Models. Appl. Sci. 2023, 13, 7142. [Google Scholar] [CrossRef]
- Sun, C.; Bao, Y.; Vandansambuu, B.; Bao, Y. Simulation and Prediction of Land Use/Cover Changes Based on CLUE-S and CA-Markov Models: A Case Study of a Typical Pastoral Area in Mongolia. Sustainability 2022, 14, 15707. [Google Scholar] [CrossRef]
- Li, X. Progress in the study of oasis-desert interactions. Agric. For. Meteorol. 2016, 230–231, 1–7. [Google Scholar] [CrossRef]
- Zhang, M.; Zhou, Y.; Li, X.; Sun, Z.; Yang, G.; Xie, Z. Quantifying the Contributions of Regional Human Activities and Global Climate Change to the Regional Climate in a Typical Mountain-Oasis-Desert System of Arid Central Asia From 1979 to 2018. J. Geophys. Res. Atmos. 2023, 128, e2022JD037110. [Google Scholar] [CrossRef]
- Yongchun, Y. The Analysis of the Oasis Environmental Change and Its Reason of the Lower Reaches of the Arid Region—A Case Study of Minqin County in the Lower Reaches of Shiyang River in Hexi Corridor, Gansu Province. Hum. Geogr. 2003, 42–47. [Google Scholar] [CrossRef]
- Song, W.; Li, H. Spatial pattern evolution of rural settlements from 1961 to 2030 in Tongzhou District, China. Land Use Policy 2020, 99, 105044. [Google Scholar] [CrossRef]
- Party Committee of Liangzhou District. Liangzhou Yearbook; Gansu Ethnic Publishing House: Lanzhou, China, 2025. [Google Scholar]
- Xu, X.L.; Liu, J.Y.; Zhang, S.W.; Li, R.D.; Yan, C.Z.; Wu, S.X. China Multi-Temporal Land Use Remote Sensing Monitoring Data Set (CNLUCC); Resource and Environment Science Data Registration and Publication System: Beijing, China, 2018. [Google Scholar]
- Resource and Environment Science Data Center. Provincial Digital Elevation Model (DEM) 30 m Data (SRTM 30 m); Resource and Environment Science Data Center: Beijing, China, 2005. [Google Scholar]
- OpenStreetMap Contributors. Available online: https://www.openstreetmap.org/ (accessed on 10 May 2025).
- Wu, Y.; Shi, K.; Chen, Z.; Liu, S.; Chang, Z. Developing Improved Time-Series DMSP-OLS-Like Data (1992–2019) in China by Integrating DMSP-OLS and SNPP-VIIRS. IEEE Trans. Geosci. Remote Sens. 2022, 60, 1–14. [Google Scholar] [CrossRef]
- Administrative Measures for the Permanent Basic Farmland Protection Red Line. Available online: https://zrzy.gansu.gov.cn/zrzy/c110446/202509/174200162.shtml (accessed on 10 May 2025).
- China Nature Reserve Specimen Resource Sharing Platform. List and Vector Boundaries of Nature Reserves in China; Zenodo: Geneva, Switzerland, 2024. [Google Scholar] [CrossRef]
- Yang, Y.; Fang, M.; Li, J.; Jiao, Y.; Zhang, L.; Shi, L. A Study on the Spatial Evolution and Evolutionary Models of Rural Settlements in 25 Counties (Cities, Districts) along the Yellow River in Shandong Province. J. Life Sci. Agric. 2024, 1. [Google Scholar] [CrossRef]
- Tian, X.; Yu, Z.; Wang, J.; Ou, Z.; Hu, J.; Zhang, L. Tourism-driven spatial restructuring of urban and rural settlements in the Lijiang Intermontane Basin, China. Remote Sens. Appl. Soc. Environ. 2025, 40, 101748. [Google Scholar] [CrossRef]
- Chen, S.; Wang, X.; Lin, Q. Spatial pattern characteristics and influencing factors of mountainous rural settlements in metropolitan fringe area: A case study of Pingnan County, Fujian Province. Heliyon 2024, 10, e26606. [Google Scholar] [CrossRef]
- Xie, B.; Wei, W.; Liu, C.; Zhou, J.; Zhou, L. Optimal allocation for land in an arid inland basin in northwest China: Framework and application based on CLUE-S and MCR models. Environ. Sci. Pollut. Res. Int. 2023, 30, 95758–95772. [Google Scholar] [CrossRef]
- Bekele, B.; Wu, W.; Yirsaw, E. Drivers of Land Use-Land Cover Changes in the Central Rift Valley of Ethiopia. Sains Malays. 2019, 48, 1333–1345. [Google Scholar] [CrossRef]
- Guo, J.; Song, W.; Guo, L.; Zhang, Y. Simulation of the Effects of New Urbanization Policies on Rural Settlement Changes: A Case Study of Dingzhou City, China. J. Resour. Ecol. 2020, 13, 285–298. [Google Scholar]
- Wei, Y.; Zhiqiang, G.; Maosi, C. Dynamic modelling of future land-use change: A comparison between CLUE-S and Dinamica EGO models. In Proceedings of the Remote Sensing and Modeling of Ecosystems for Sustainability IX, San Diego, CA, USA, 12–16 August 2012; Volume 8513. [Google Scholar] [CrossRef]
- Chronicles of Liangzhou District. Available online: http://www.gsliangzhou.gov.cn/ (accessed on 10 May 2025).
- Jia, L.; Liu, Z.; Li, Y. Spatiotemporal dynamics of rural settlement evolution in Guangdong Province, China. Sci. Rep. 2025, 15, 18244. [Google Scholar] [CrossRef] [PubMed]
- Zhang, W.; Ma, L.; Li, H.; Wang, X. Trends in the future evolution of rural settlements in oasis-desert areas under water use simulation scenarios: Take the Hexi Corridor region of China as an example. Landsc. Urban Plan. 2024, 248, 105110. [Google Scholar] [CrossRef]
- Ma, L.; Li, J.; Wang, X.; Zhang, W.; Tao, T.; Zhong, Y. Evolution and simulation optimization of rural settlements in urban-rural integration areas from a multi-gradient perspective: A case study of the Lan-Bai urban agglomeration in China. Habitat Int. 2024, 153, 103203. [Google Scholar] [CrossRef]
- Implementation Plan for Wuwei City’s Five-Year Action Programme to Deepen the People-Wuwei City Territorial Spatial Master Plan (2021–2035). Available online: www.gswuwei.gov.cn (accessed on 28 October 2025).
- Interim Measures for the Management of Rural Homestead Construction in Liangzhou District. Available online: http://www.gsliangzhou.gov.cn/ (accessed on 28 October 2025).
- Interim Measures for the Paid Use of Rural Homestead Sites in Liangzhou District. Available online: http://www.gsliangzhou.gov.cn/ (accessed on 28 October 2025).
- Traffic Organisation Plan for Liangzhou Urban Area, Wuwei City. Available online: http://www.gswuwei.gov.cn/ (accessed on 10 May 2025).
- Measures for the Exercise of Collective Ownership Rights over Rural Homestead Sites in Liangzhou District (Trial). Available online: http://www.gsliangzhou.gov.cn/ (accessed on 28 October 2025).
Disclaimer/Publisher’s Note: The statements, opinions and data contained in all publications are solely those of the individual author(s) and contributor(s) and not of MDPI and/or the editor(s). MDPI and/or the editor(s) disclaim responsibility for any injury to people or property resulting from any ideas, methods, instructions or products referred to in the content. |
© 2025 by the authors. Licensee MDPI, Basel, Switzerland. This article is an open access article distributed under the terms and conditions of the Creative Commons Attribution (CC BY) license (https://creativecommons.org/licenses/by/4.0/).