Abstract
Landscape character assessment (LCA) is a systematic approach used to classify, describe, and analyze the physical and cultural attributes that define the landscape. The traditional approaches to LCA are fundamentally subjective and descriptive, relying on human evaluations of aesthetic value, and they often show inconsistencies in results when assessed by different observers for the same landscape. This research aims to establish a spatial and quantitative methodology through GIS for evaluating the landscape character of King Khalid University (KKU)’s campus in the Southern Province of Saudi Arabia, which is considered crucial for designing a sustainable and context-sensitive landscape. To identify the feasible developed areas and their sustainable characteristics, three key landscape variables were measured and spatially expressed, subsequently averaged to categorize landscape character. The variables include land use and land cover, which were obtained from Sentinel 2 remote sensing data through supervised classification, as well as landforms and hydrological settings derived from a digital elevation model (DEM) utilizing GIS functionalities. The findings revealed three distinct landscape characters, each characterized by quantifiable landscape attributes. The landscapes exhibiting the most significant character encompass approximately 20% (1074 ha) of the study area, whereas those with the least significance account for 6.5% (342 ha). The remaining 73.5% (3884 ha) is classified as landscapes with an average significance character. The results provide a solid scientific basis for choosing locations in the campus’s study area that promote environmentally friendly and sustainable landscape development. This method improves objectivity in LCA and offers a reproducible framework for implementation in arid and semi-arid areas.
1. Introduction
The natural landscape encompasses a dynamic interaction between natural systems and human activities, exhibiting both biophysical patterns and socio-cultural values. Understanding and categorizing landscapes according to their unique attributes is a fundamental focus in landscape architecture, planning, and environmental management. In recent decades, the demand for rigorous and systematic approaches to evaluate landscape character has become intensified, especially due to escalating pressures from urbanization. Landscape Character Assessment (LCA) is a method employed to classify, describe, and analyze the physical and cultural attributes of landscapes [1]. LCA plays a vital role in environmental management, landscape architecture, and planning by offering a spatial framework for multi-functional landscapes [2]. It combines landscape character analysis with biodiversity assessments, historical context, and socio-economic functions [3]. Critics contend that LCA often emphasizes the perspectives of external experts, concentrating on aesthetic and physical attributes [4].
LCA has emerged as a crucial approach for landscape planning throughout Europe [5] and is applicable at several scales, ranging from national to local [3]. Although LCA has gained extensive acceptance in Europe, its implementation in the Mediterranean region remains underestimated [1]. In the United States, LCA is predominantly employed via visual impact evaluations within environmental policy [6].
The Southern Province of Saudi Arabia is home to a remarkable diversity of physical, biological, and cultural attributes, ranging from rocky mountain ranges and terraced farms in the Asir region to vast plateaus and dry valleys leading to Najran and Jazan. This diversity offers both prospects and obstacles for sustainable land use planning, ecological conservation, and cultural heritage safeguarding. In this setting, comprehending and carefully categorizing the region’s unique landscape types is essential. Consequently, LCA is a significant and requisite approach for decision-makers in this region.
LCA in arid and semi-arid regions generally entails the analysis of spatial vegetation patterns and their fragmentation through remote sensing and GIS methodologies. Methods include region growing algorithms [7], map-based indicators integrated with photographs [8], and patch-size distribution analysis [9]. Vegetation indices such as MSAVI2 and NDBSI are utilized to evaluate the status of land degradation [10]. Landscape characterization typically involves various attributes, including climate, ecoregions, biophysical environments, and vegetation [11]. Satellite and aircraft sensor remote sensing data are crucial for monitoring changes in vegetation cover in these regions [12]. These methods assess landscape coherence, complexity, naturalness, and visual quality [8] and also offer insights into ecosystem functionality and desertification processes [9].
LCA methods have evolved to integrate qualitative and quantitative approaches, achieving a balance between objectivity and subjectivity [13]. Traditional qualitative methods, despite their simplicity, can yield dependable classifications of land suitability [14]. Quantitative techniques provide benefits in the analysis of landscape patterns, encompassing patch analysis, mosaic structure, and spatial relationships [15]. Spatial quantitative methods facilitate larger sample sizes and expedite data collection; however, they may neglect the nuanced experiences of stakeholders [16]. Multi-criteria decision analysis (MCDA) systems illustrate the capability of integrating quantitative methods with spatial analysis for landscape evaluation and decision-making [17]. Recent advancements in LCA encompass the integration of LiDAR data and 360° panoramic images, addressing the limitations of traditional qualitative methods [18]. Additionally, innovative approaches involving machine learning, social media analysis, and citizen science have emerged [19].
LCA increasingly employs spatial and quantitative methodologies for the analysis, classification, and mapping of landscape types [7]. These methods integrate both objective and subjective data, employing quantitative and qualitative tools to effectively capture the complexity of landscapes [13]. Quantitative methods, including landscape pattern indices, facilitate comparative analyses of landscape composition and connectivity [20]. Geographic Information Systems (GIS) are essential for the integration of spatial databases and quantitative models in land resource assessment [21]. Recent decades have seen significant advancements in numerical techniques, including methods for analyzing individual patches, landscape element patterns, and mosaic structures [22]. Quantitative approaches offer significant assistance in spatial planning, policy formulation, and sustainable landscape management [23,24].
Recent studies have shown the potential of integrating Geographic Information Systems (GIS) with landscape assessment frameworks, emphasizing terrain features, land cover patterns, and visual or perceptual qualities. LCA methods integrate natural and cultural attributes to identify and map landscape types through GIS tools [25]. These methods have been utilized across different contexts, ranging from regional applications [26] to national implementations [27]. Researchers have investigated the integration of LCA perspectives with traditional views and philosophies [28] and have created GIS-based indicators for assessing landscape coherence [29]. The relationship between objective and subjective methodologies in LCA has undergone critical assessment [13], and certain studies have contrasted evaluations of landscapes by experts and non-experts [30]. The advancements in LCA methodologies enhance landscape management, planning, and conservation efforts across various geographical and cultural contexts.
LCA has been applied in several regions, yet documented applications in Saudi Arabia or the Arabian Gulf countries remain scarce. Nevertheless, certain studies have examined related aspects within Saudi Arabia. Cultural landscapes in southwestern Saudi Arabia investigated, emphasizing the influence of socio-economic changes on traditional landscapes [31]. The potential contributions of landscape architecture to the Quality-of-Life Program in Saudi Arabia was examined [32]. Evaluation of the coastal landscape in Jazan, Saudi Arabia, highlighting the necessity for harmonious tourism development alongside environmental conservation [33]. Although these studies do not explicitly employ LCA, they indicate an increasing interest in landscape evaluation and management within the region, implying potential for future LCA applications in Saudi Arabia and adjacent countries.
Despite its widespread availability and potential benefits, research consistently demonstrates the underutilization of GIS in landscape architecture and related fields. Multiple studies confirm this underutilization, attributing it to lack of awareness and prejudice among professionals [34]. Evidence shows that while landscape architects were among the earliest GIS users, the technology’s full potential remains unrealized in contemporary practice [35], In contrast, landscape planning represents a more developed application area, with GIS being considered indispensable for landscape evaluation, spatial modeling, strategic planning, and environmental impact assessment [36,37]. Landscape design research requires the exploration and development of spatial attributes and the composition of design structures and patterns and natural and cultural contexts, which GIS applications can provide. This study aims to establish a spatial and quantitative methodology for LCA utilizing GIS in the landscape architecture design of KKU’s Campus, in the Southern Province of Saudi Arabia, emphasizing enhancements in objectivity, repeatability, and transparency within the assessment process. This design was a part of a project submitted for the design competition of KKU with a vision of “a university within a park,” promoting an ecological approach to enhance environmental quality, sustainable design, and context-sensitive intervention. This article intends to enhance the investigation and interpretation of quantitative spatial characteristics of landscapes in the assessment of the campus’s character and quality. This research addresses the lack of studies on the integration of these indicators in the landscape architecture projects in Saudi Arabia, thereby filling a significant gap and serving as a reference for future research in this context.
2. Materials and Methods
2.1. Study Area
The study area of King Khalid University (KKU), Al-Fara Campus, is located in Asir Province, southwest Saudi Arabia, approximately 26 km from Abha, the provincial capital. It is defined by the coordinates 42°41′11″ E to 42°45′43″ E and 18°3′40″ N to 18°6′55″ N, encompassing an area of approximately 5300 hectares. The boundary of the site is determined by the design competition’s brief, which includes all areas required for landscape architecture development and design intervention. Figure 1 shows the extent of the study area and the main land use there. The area’s climate is categorized as a hot semi-arid climate (BSh) to cold semi-arid climate (BSk) according to the Köppen–Geiger classification [38], featuring an average annual temperature of 25 °C and average annual precipitation of 220 mm from 1985 to 2018 [39]. The study area features a plateau that exhibits a south-to-north tilt, with an average elevation of 2100 m above sea level. The primary land use characteristics in the area consist of KKU’s Campus, Dalghan Park, and various residential settlements. The region, situated within the Asir Mountains, features a notable landscape and is slated for further development initiatives. Therefore, this research selected the area to examine a quantitative and spatial approach for LCA.
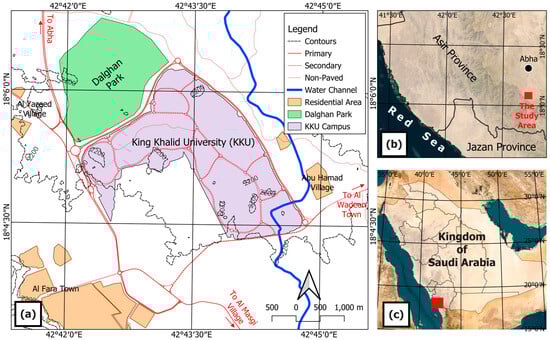
Figure 1.
A multi-scale geographic overview of the study area surrounding King Khalid University. (a) A detailed local map showing the immediate surroundings of King Khalid University (KKU), (b) regional map situating the study area within Asir Province, emphasizing its location relative to the Red Sea and Jazan Province, and (c) national map of Saudi Arabia indicating the study area’s location within the broader national context.
The site was visited in Spring 2024 to investigate the existing landscape, which is characterized by rugged, rocky formations, with a strong atmosphere and an almost sublime landscape. The steep slopes and towering mountains with deep small valleys in the unbuilt zone surrounding the cities of medicine, science and sport, create a striking contrast to the flat areas where buildings were constructed. This landscape terrain is shaped by wind and erosion, giving dramatic rise to cliffs and peaks that catch the changing light of the sun. The slopes are covered in scattered native vegetation that is nourished by the seasonal rainfall. This rocky nature gives the surrounding site a mystical beauty with a strong contrast to the built areas. Figure 2 presents landscape samples prevalent in the study area.
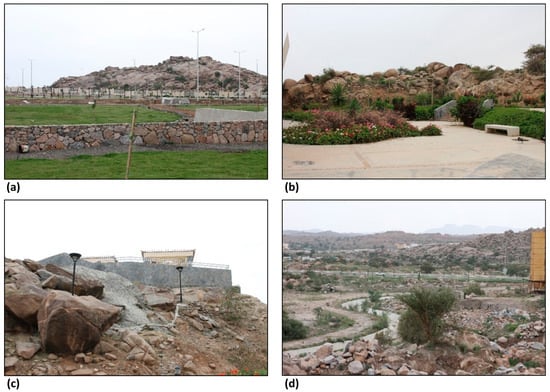
Figure 2.
Landscape Diversity in the study area. (a) A rugged hill with stone enclosures and grass cover, representing mountainous terrain and traditional land management. (b) A landscaped garden among natural rock formations, illustrating the interplay between vegetation and landforms. (c) A rocky escarpment with structural development, showcasing topographic complexity and human settlement. (d) Arid open landscape with sparse vegetation, characteristic of the region’s dry climatic zones.
2.2. Data
The study used a Sentinel 2 image that was acquired on 21 June 2024, and was cloud-free. The image was retrieved from the Copernicus Data Space Ecosystem website. Sentinel 2 provides thirteen bands with different spectral and spatial properties. The image is acquired in Level-1C processing format, indicating that the data are presented as top-of-atmosphere (TOA) reflectance and is orthorectified in the WGS84/UTM Zone 38N projection [40].
A digital elevation model (DEM) acquired by the Advanced Land Observing Satellite-Phased Array-Type L-Band Synthetic Aperture Radar (ALOS-PALSAR), featuring a spatial resolution of 12.5 m, was used to demonstrate the terrain of the study area and to correct remote sensing data for topographical accuracy. It was acquired from the Alaska Satellite Facility (ASF). These types of DEM data are used for various purposes, including watershed management [41], landslide mapping [42], flood assessment [43], and topographic analysis [44]. DEM offers extensive information regarding the topographic, geomorphologic, and hydrologic characteristics of an area [45].
Two hundred locations were chosen in spring 2024 in two field trips. These locations were accessed to serve as training and validation data required for mapping land use/land cover using Sentinel-2 imagery. One hundred location of these locations were used for validation of the landscape character assessment mapping. The Garmin OREGON 550t GPS device was used to identify these sites.
2.3. Methodology
The process of landscape architecture design and site planning starts with site surveying/inventory and evaluation/analysis. This includes gathering information about the unique natural and man-made features of the site, in addition to the behavioral characteristics and users’ socioeconomic aspects. This stage of the site planning is considered the baseline that informs the design decision-making, develops the design philosophy and concept, and articulates how this can be achieved through the actual landscape architecture design. The integration of an understanding of the site’s landscape character into the design process helps achieve context-sensitive spaces with environmentally inherited qualities and sustainable solutions. LCA, as part of the site inventory and analysis, provides base data that drive the landscape change, management, planning, and design [46]. GIS is regarded as a highly valuable tool, which enables the integration, evaluation, and visualization of variable datasets and informs and enriches the site LCA process with evidence-based design research and practice.
Within the framework of this research, the landscape character of the study site comprises three variables: land use and land cover (LULC), landforms, and hydrological conditions. Figure 3 illustrates a flowchart delineating the methodology for evaluating spatial landscape character based on the three variables.
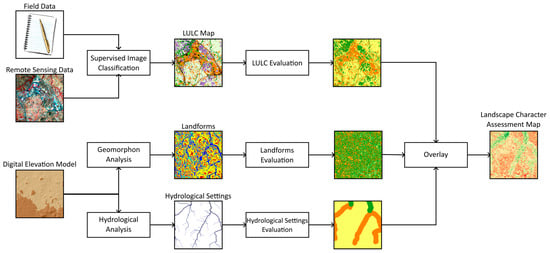
Figure 3.
Flowchart showing the steps for producing a spatial landscape character assessment.
The patterns of land use and land cover profoundly influence the visual character of a landscape. Various land cover types, particularly those associated with plants, affect the color, texture, and overall aesthetic quality, consequently influencing human perception and experience of the landscape. Land Use and Land Cover (LULC) was generated using Sentinel 2 remote sensing data and field-collected information through supervised classification.
Landforms are crucial for evaluating landscape character. They establish the essential visual structure of the landscape, affecting perception, views, and overall aesthetic quality. They delineate the horizon line and enhance the sense of place and identity. They influence the spatial configuration of landscape components, impacting the magnitude and proportion of elements such as flora, water, and human settlements. Hydrological drainage patterns are essential for assessing landscape characteristics. Drainage networks create distinctive visual patterns that improve the spatial configuration of a landscape.
Drainage networks shape the arrangement of landforms, vegetation, and human settlements, influencing the overall landscape character and sense of place. They highlight diverse landforms, which helps clarify the terrain’s physical structure and geomorphological processes. Landforms and hydrological drainage configurations were derived utilizing various GIS capabilities.
Factors of land use and land cover (LULC), landforms, and hydrological conditions were assigned weights to highlight their significance for landscape characterization, and subsequently, these weighted factor maps were superimposed to provide the LCA in the research area. All GIS operations and analyses were conducted utilizing QGIS Desktop 3.42.3 and SAGA GIS 9.7.1. QGIS is free and open-source geographic information system (GIS) software that supports viewing, editing, and analyzing geospatial data. It offers a wide range of spatial algorithms and is often easier to use than other GIS packages due to its various convenience functions [47], while SAGA GIS (System for Automated Geoscientific Analyses) is another open-source geographic information system developed by the Department of Physical Geography at the University of Göttingen, Germany, that offers comprehensive tools for scientific analysis and modeling [48].
2.4. Land Use/Land Cover Mapping
A Sentinel-2 image was used for mapping land use/land cover conditions in the study area. Only bands numbered 2, 3, 4, and 8, which correspond to the blue, green, red, and near-infrared regions of the electromagnetic spectrum, were used. The selected bands possess a spatial resolution of ten meters, enabling precise land use and land cover mapping [49]. Since these bands were acquired as TOA reflectance rescaled using a quantification value of 10,000, they have been inversely rescaled to the original TOA reflectance by dividing the bands by the quantification value [50]. The atmospheric correction process was implemented using the dark object subtraction (DOS) algorithm to mitigate undesirable atmospheric effects. This algorithm assumes that the darkest object in the image possesses no reflectance; if it does exhibit reflectance, such reflectance is attributed to atmospheric scattering. Consequently, subtracting the reflectance value of the darkest object from the image’s band will eliminate the undesired atmospheric effect from the image’s band [51]. Consequently, the minimum value for each band was computed and subtracted from the band. The study area shows rugged topography. Consequently, topographic correction is necessary to mitigate illumination impacts before the land use/land cover classification process. Topographic correction was implemented on Sentinel-2 reflectance after radiometric rescaling and atmospheric correction. The cosine correction method was employed for this purpose. This method asserts that the ratio of the solar zenith angle to the solar incidence angle is equal to the ratio of the corrected reflectance to the reflectance measured in the remote sensing dataset [52]. The solar zenith angle is a characteristic of a remote sensing dataset available in the Sentinel-2 metadata file, while the solar incidence angle is calculated for each pixel in the dataset using the associated digital elevation model. ALOS PALSAR DEM data were resampled to align with the 10-m spatial resolution of Sentinel-2 bands and subsequently used for topographic correction. The result of this procedure was Sentinel-2 surface reflectance bands free of atmospheric and topographic influences. The image was cropped to be consistent with the boundaries of the study area. Six distinctive classes were identified for LU/LC mapping. The classes have been defined in Table 1. Sixty sites of a total of two hundred visited sites were used as training sites. Each site was designated to correspond with a unique LU/LC class and thereafter identified using a handheld GPS device. Subsequently, five training sites were excluded due to their location being outside the study area. The training sites and the cropped Sentinel-2 image were inputted into the Maximum Likelihood Classifier (MLC) to generate a land use/land cover thematic map. MLC is a supervised classification technique employed to allocate each pixel in an image to a certain class according to the highest probability of that pixel’s association with that class [53]. The accuracy of the classified LU/LC thematic map was evaluated using a confusion matrix. The confusion matrix compares the classification map with the matching actual LU/LC classes. One hundred and forty out of two hundred sites were used as ground truth sites for the validation procedure. Nevertheless, eleven locations were situated beyond the study area. Consequently, these sites were eliminated and substituted with other ones obtained from Google Earth Pro. The total number of locations used for validation is 144. A confusion matrix was constructed, from which accuracy metrics, including overall accuracy, producer’s accuracy, user’s accuracy, and Kappa coefficient, were derived.

Table 1.
Description of land use/land cover classes and their characteristics in the study area.
2.5. Mapping and Classification of Landforms
The geomorphon-based mapping and classification of landforms is an algorithm developed to identify a restricted set of dominant landforms from a digital elevation model (DEM) via pattern recognition of ternary identities known as “geomorphons,” defined as an extensive array of potential landform archetypes [54]. This algorithm delineates ten landforms: flat, peak, ridge, shoulder, spur, slope, hollow, foot-slope, valley, and pit. Several studies examined this technique for delineating and categorizing landforms across various applications, including landslide susceptibility [55] and soil science [56]. Landforms in the study area were derived using the ALOS-PALSAR DEM using the Geomorphon module of SAGA GIS software. The radial limit and threshold angle are two parameters utilized for module optimization. The radial limit establishes the maximum radius for evaluating openness criteria, set at 500 m, while the threshold angle determines the upper limit for permissible terrain roughness, assigned at 1°.
2.6. Mapping Surface Hydrological Settings
A DEM-based hydrological analysis for the study area was conducted using SAGA GIS, which aids in the production and comprehension of hydrological conditions. Topography significantly influences hydrogeological systems and is represented by the ALOS-PALSAR DEM. A digital elevation model (DEM) is a raster grid depicting terrain elevation, with each pixel corresponding to an elevation value of the Earth’s surface at that specific point. The sinks represented as pixels in the DEM that lack a natural downslope pathway for water flow, such as depressions or pits, were filled. The directions of surface water flow were ascertained using the D8 method [57] and stored as a new raster grid. The total flow received by each cell from upstream regions was derived from the flow direction raster and stored in a new raster grid. Ultimately, both flow direction and flow accumulation raster grids were employed to delineate the watersheds’ boundaries and channel networks of the study area.
2.7. Mapping and Evaluating Landscape Characters
Landscape character is a unique and identifiable arrangement of landscape variables that distinguishes one landscape from another [58]. Several research investigations have highlighted the significance of various variables in landscape characterization. The mountainous terrain and semi-arid climate of the area necessitated the selection of three factors to characterize its landscape that are land cover and land use, landforms, and drainage patterns. Besides their aesthetic value, these elements contribute to the landscape in various other capacities. Land use and land cover are critical for ethical stewardship and effective management of natural resources [59] and significantly contribute to addressing various issues, such as microclimate modification and facilitating spatially explicit integration [60]. Topographic factors significantly influence environmental conditions, including the distribution of radiation temperature through factors such as elevation, slope, aspect, and surface curvature. These elements also affect climate, water flow, soil formation, and patterns of species distribution [61]. The surface water and drainage system can significantly impact landscape character by altering land use, which in turn affects agricultural productivity and biodiversity [62].
For each variable, the elements comprising it were categorized and prioritized according to their significance. The weights assigned are 1, 2, and 3, according to the least, moderate, and most important elements of the landscape character. The weights were allocated to the components of the three variables, derived from deliberations on their influence in constructing the landscape.
Land use/Land cover highlighted the linkages among human activities, natural systems, and cultural values, facilitating more informed and context-sensitive decision-making. LU/LC types in the study area are natural vegetation, domestic vegetation, rock land, built-up, asphalt, and undeveloped. Natural vegetation enhances the aesthetic quality, biodiversity, and ecological integrity of the environment. It influences the region’s natural characteristics and provides habitats for fauna. Rock formations affect the geomorphological characteristics and visual uniqueness. They enhance the cultural and geological individuality of the landscape. Natural vegetation and rocky land were considered highly significant for the landscape’s character, receiving a weighted score of 3. Domestic vegetation managed in built environments embodies cultural practices and human engagement with the landscape, shaping the feeling of place and aesthetic value. The built-up areas delineate the cultural and functional attributes of the terrain. They influence visual perception, and social dynamics yet may diminish natural beauty. Consequently, domestic vegetation and built-up environments were deemed significant and assigned a weighted score of 2. Although undeveloped lands offer open space, they are frequently transitory and lack distinguishing character. Its importance is contingent upon the contextual environment and the possibility of future alterations. Roads paved with asphalt affect accessibility, connectivity, and landscape fragmentation. They influence movement patterns and visual coherence. Undeveloped land and roads paved with asphalt were deemed the least significant for landscape character, assigned a weighted score of 1.
Analysis of landforms offers an in-depth comprehension of the impact of physical geography on aesthetic, ecological, and cultural dimensions, hence facilitating informed decision-making in planning, conservation, and landscape design. Landforms in the study area are flat, peak, ridge, shoulder, spur, slope, hollow, foot-slope, valley, and pit. Ridges and summits are significant elements that shape the skyline, affect viewsheds, and establish a sense of enclosure or openness. They frequently serve as landmarks that influence the overall spatial configuration of the landscape. Valleys shape drainage patterns, impact vegetation corridors, and are often associated with human settlement and agricultural activities. They enhance the visual depth and dynamism of a landscape. Slopes affect water runoff, erosion patterns, and the suitability of land use. They influence visibility and accessibility, thereby shaping the perception of landscape scale and form. Consequently, ridges, summits, valleys, and slopes were deemed the most significant and assigned a weight equal to 3. Spurs and shoulders serve as transitional forms that enhance the complexity of landform patterns and affect local microclimates and drainage systems. They contribute to the visual diversity of the landscape. Foot-slopes are located at the base of slopes and play a crucial role in drainage and sediment deposition, which in turn influences soil fertility and the distribution of vegetation. These landforms were deemed moderately important and assigned a value equal to 2. Flats, while less visually prominent, play a crucial role in land use, particularly in agriculture and infrastructure development. Depressions and hollows, as localized features, influence hydrology by functioning as water catchments or wetland areas. They affect biodiversity but have a minimal contribution to the overall landscape character. These landforms are the least significant and were assigned a value equal to 1.
Drainage patterns promote visual beauty and recreational opportunities, highlight varied landforms, and provide habitats for wildlife and flora. Each channel order contributes to the physical structure, ecological value, cultural relevance, and visual impact. In the context of this analysis, the channel and a 250 m buffer area around it will be regarded as one whole. Fourth-order channels are the most visually and culturally significant features in the landscape. Their significant impact on landscape structure, cultural identity, and ecological services necessitates the utmost consideration, reflected in a high weighted value that was given for these orders, which is 3. Third-order channels substantially affect landscape character and perception. Their structural and visual preeminence, along with ecological and cultural significance, shows a moderate importance with a weighted value equal to 2. The channels of the second and first orders are many and diminutive, showing localized impact with restricted visual prominence and cultural importance. Consequently, the channels of the second and first orders, with all remaining areas, were deemed the least significant and assigned a weighted value equal to 1.
Table 2 shows the variables that were contributing to the LCA, their significance, and their weighted values. Landforms and LULC raster grids were categorized according to Table 2, resulting in maps of landforms and rated land use/land cover. A 250-m buffer zone was established around the channels, designated with values specified in Table 2, and rasterized to produce a drainage-evaluated map.
Table 2.
Variables contributed to LCA with their significance and weights.
The LCA map was generated by finding the arithmetic mean of landforms, land use and land cover, and drainage-evaluated maps for each pixel as expressed in Equation (1).
where the weight of landscape character (WLC) is calculated as the average of the weight of landform (WLF), the weight of land use and land cover (WLU), and the weight of the drainage system (WD).
WLC = (WLF + WLU + WD)/3,
The produced values range from 0 to 3, where values less than one point to these areas having insignificant or the least important landscape character, while the values more than 2 point to the areas with significant or the most important landscape character as expressed in Equation (2).
To validate the GIS-based LCA results, the LCA map was compared with the actual landscape of the study area. One hundred sites were randomly selected in the study area, visited, investigated to identify their landscape elements, and the anticipated value of their landscape character computed according to Equation (1) and defined using Equation (2). The field observation-derived value of landscape character was subsequently compared with the value indicated on the LCA map. An accuracy metric was computed as the ratio of sites where the field observation-derived landscape character value matches with the GIS-derived value to the total number of sites visited. This measure is shown in the following equation:
where nv is the number of sites where the field observation-derived landscape character matched that in the LCA map, and nt is the total number of sites visited.
Accuracy = nv/nt × 100%,
2.8. Development of the Landscape Masterplan of KKU
In accordance with Saudi Vision 2030 and the “Saudi Green Initiative,” KKU, in partnership with the governor of Asir, has developed a vision for an international competition to design a landscape master plan for the university campus in Alfara, Asir Province, in 2023. The vision encompasses a dynamic and contemporary educational center situated within an appealing, functional, and sustainable landscape, allowing students, university personnel, and visitors to engage in a picturesque and eco-friendly setting. The primary objective of the competition is to articulate the concept of “a University in a Park” through a proposal for a landscape master plan. This concept summarizes the fundamental vision of the landscape architecture design for the proposed KKU campus in Asir Province. This demonstrates an integrative approach in which the campus is designed to operate as an extension of the surrounding landscape, rather than simply being located within a natural setting. This approach employs GIS-based landscape character assessment to identify and preserve essential ecological and visual features, facilitating the designing of a campus that integrates with its surroundings. The concept advocates for improved access to green spaces, visual coherence with the surrounding landscape, and increased biodiversity, thereby converting the university into a dynamic park that fulfills both educational and ecological roles.
The proposed master plan must encompass an overarching landscape planning vision, strategies, and a comprehensive landscape design for the whole study area. The suggested master plan must align with the goal of the competition promoters, emphasizing beauty, sustainability, and utility. The design project program has been established according to the four objectives outlined in the competition brief: (1) to provide a visually appealing and environmentally sustainable landscape architecture design proposal, (2) to reconstruct the campus environment with a vibrant identity and a profound feeling of place, (3) to create multifunctional areas that promote a healthy lifestyle, and (4) to develop environments that accommodate both daily and seasonal activities.
The proposed landscape design concept adapts the notion of the “Mat Ecologies,” which was developed by Chris Reed, an American landscape architect, urbanist, and design theorist [63]. He defined this approach as “a systematic field of consistent and repetitive parts, dispersed across a large-scale territory, and governed by a set of formal or logistical operations” [64]. This arrangement system responds to the indeterminacy of the site’s land use, variations in site topographical conditions, landforms, hydrological settings, landscape character, and flexible campus programs. Moreover, it reorganizes and unites the fragmented nature of the existing site plan.
3. Results
3.1. Results of Land Use/Land Cover Mapping
The result of the supervised classification process, which is shown in Figure 4, reveals a heterogeneous landscape with dominant undeveloped land (approximately 50% of the study area) interspersed with patches of natural vegetation and rock land. The built-up areas and asphalt roads are concentrated within and around the campus of KKU, indicating significant human activity in those zones. Domestic vegetation highlights small-scale cultivation or green spaces in the region. Figure S1 in the Supplementary Materials illustrates a comparison of the areas covered by different classes.
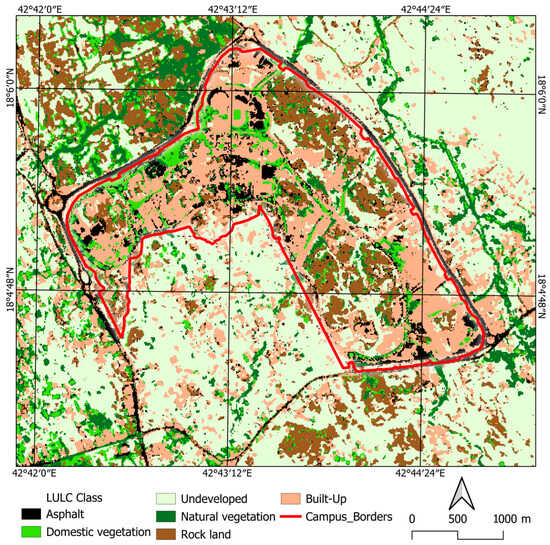
Figure 4.
Land Use/Land Cover map of the study area derived from Sentinel-2 image.
The evaluation of supervised classification was conducted using the confusion matrix presented in Table S1 in the Supplementary Materials. The overall accuracy is 92.36%, signifying that the supervised classification results align correctly with most validation data. The Kappa coefficient is 0.9082. The Kappa coefficient considers chance agreement and offers a more reliable assessment of classification performance compared to accuracy. A value of 0.9082 signifies nearly complete concordance, suggesting that the LU/LC map produced by the supervised classification is even reliable.
3.2. Results of Landform Mapping
Figure 5 displays the results of landform mapping and classification derived from the ALOS-PALSAR digital elevation model using the Geomorphon module, while Figure S2 in the Supplementary Materials illustrates the distribution of landform types in the study area, expressed in hectares (Ha) and as a percentage of the total area. The largest proportion of the study area consists of slopes (32.61% of the study area), covering more than one-third of the total land area. This feature indicates a steep and rugged topography, suggesting high elevation variations.
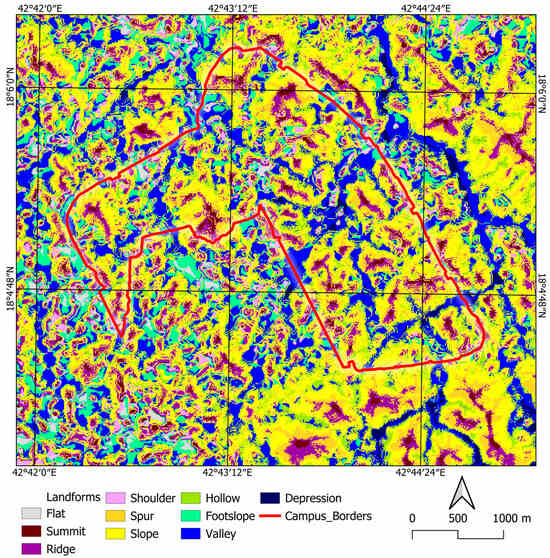
Figure 5.
Landform classification map of the study area, derived from ALOS-PALSAR DEM using the Geomorphon module.
The second most prevalent landform, valleys (15.58%), represent significant drainage pathways and potential water accumulation zones. Spur (13.16%) and ridge (10.94%) indicate the presence of elongated highland structures, common in mountainous or hilly landscapes. Hollow (10.84%) are concave areas that might represent small depressions. Foot-slope (8.28%) represents the transitional zones between slopes and valleys, usually indicating sediment deposition areas. Small areas occupied by summit (2.22%) and flat (1.33%) suggest a lack of extensive plateaus or large peaks. Shoulder (3.98%) represents a minor portion of the terrain that serves as a transition zone between higher and lower elevations.
3.3. Results of Hydrological Settings Mapping
The hydrological settings of the study area were derived by DEM-based hydrological analysis utilizing ALOS-PALSAR DEM data. Figure 6 illustrates watershed boundaries, stream orders, junctions, and spring sites. The study area is partitioned into nine basins, each designated by a number from one to nine. The basins function as essential hydrological units governing water flow and accumulation. Channels are classified according to Strahler’s stream ordering system, where higher orders indicate more advanced drainage systems. Junctions signify the convergence of streams, whereas springs represent points of groundwater discharge. Table S2 in the Supplementary Materials displays basin areas, proportions of total watershed coverage, stream order distribution, and total channel lengths for each basin. Both Figure 5 and Table S2. offer insights into the hydrological settings and surface water distribution in the region.
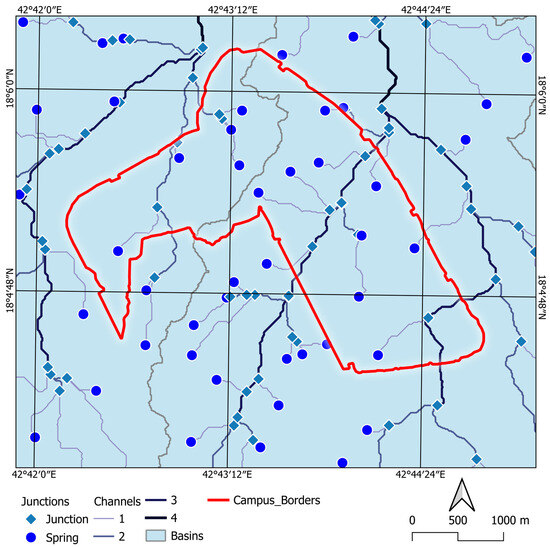
Figure 6.
Hydrological basin delineation and stream network classification of the study area. Numbers in circles.
Basin 7 constitutes 52.32% of the total area, while Basin 6 comprises 35.76%. The two basins predominantly govern the drainage system and regulate the majority of surface runoff. Smaller basins may exert localized hydrological effects but contribute insignificantly to total discharge. Basin 7 and Basin 6 encompass the preponderance of higher-order streams, underscoring their significance in regional hydrology.
3.4. Results of Mapping and Evaluating Landscape Characters
This study identifies three factors that shape landscape character: land use/land cover, landforms, and drainage systems. Each factor was mapped and categorized into three categories based on their relevance in landscape characterization. These factors are shown in Figure 7a, which illustrates the significance of various land use and land cover types in the context of landscape characterization. Natural vegetation and built-up areas play a crucial role in shaping landscape character, impacting both ecological dynamics and visual aesthetics. Areas of least importance are characterized by undeveloped land, which lacks significant distinguishing features. Figure 7b shows the significance of landforms in the characterization of landscapes. Regions exhibiting considerable terrain variation or unique geomorphological characteristics are more critical in delineating landscape character. Flat or uniform regions exert minimal influence on landscape perception. Figure 7c shows the significance of the drainage system in landscape characterization. Higher-order streams and significant drainage structures are key to determining landscape character through their hydrological and ecological effects. Lower-order streams possess moderate importance, whereas flat, poorly drained areas exhibit minimal significance.
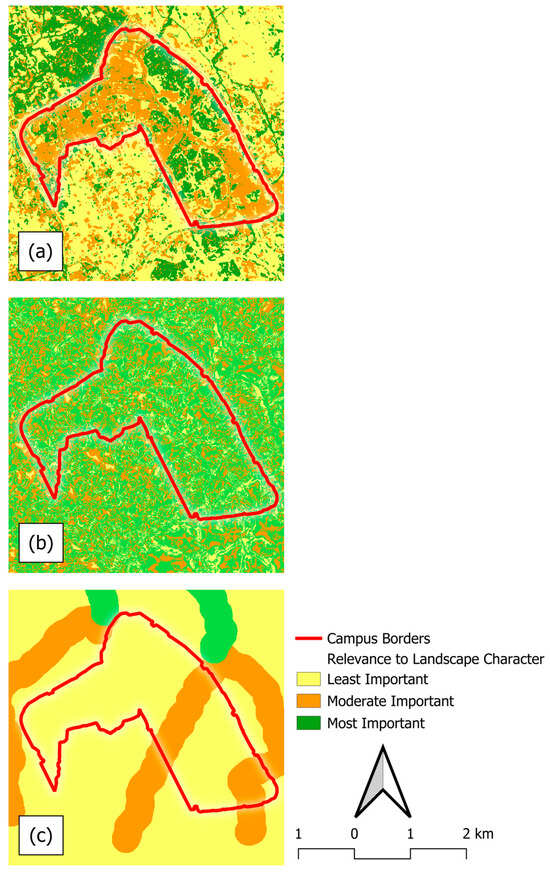
Figure 7.
Evaluation of key factors for Landscape Character Assessment (LCA). (a) LU/LC, (b) landforms, and (c) the drainage system.
The landscape character is evaluated as the arithmetic mean of the weighted values of these three factors. Figure 8 shows the significance of landscape character as determined by the average value of the three factors. The most significant regions are characterized by high landscape character importance, attributed to strong land use and land cover (LULC), prominent landforms, and well-defined drainage features. Conversely, the least significant regions exhibit a less pronounced landscape character due to minimal land use, limited geomorphological variation, or reduced drainage impact. The remaining areas exert a moderate influence on landscape character. Areas with the most significant landscape character comprise approximately 20% (1074 ha) of the study area, whereas areas with the least significant landscape character account for nearly 6.5% (342 ha) of the study area. The rest of the study area exhibits a landscape character of intermediate significance.
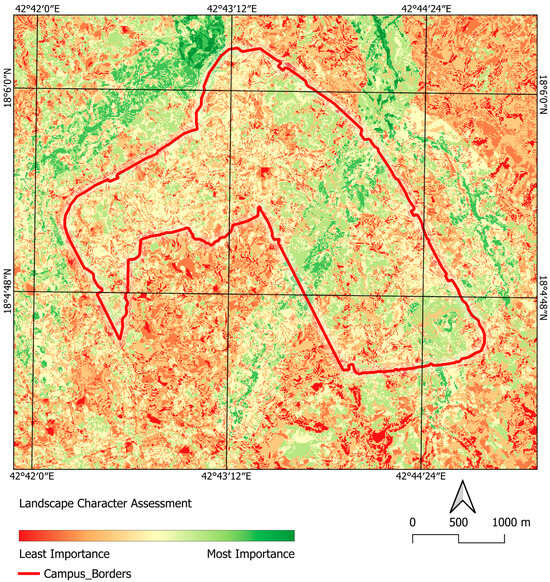
Figure 8.
Final Landscape Character Assessment (LCA) map integrating key landscape factors.
3.5. KUU Landscape Master Plan
The design concept, which depended on the Mat-Ecologies approach, is based on the formal implication of the honeycomb grid, which is borrowed from the long honey-making production history of the Asir region and transformed based on the site’s topography, creating footpaths, ecological zones, urban plazas, and investment development. Figure 9 illustrates the main Mat-Ecologies concept. The site mat acts as an ecological pattern, consisting of repetitive units that form a model for the site landscape components of hardscape paving, furniture, wayfinding strategy, rainwater collectors, and canopy structures. The transformed ground will grow and blend with the existing fields, introducing new landscape ecologies and field conditions for thriving uses, biodiversity habitats, and wildlife.
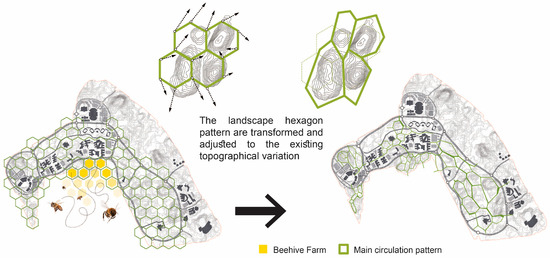
Figure 9.
Design conceptual diagram: the concept of “Mat-Ecologies”.
Considering LCA results and the design concept, the landscape master plan for the KKU campus was proposed. Figure 10 illustrates the overlay of the design conceptual layout and the LCA results map, highlighting how the proposed various zones respond to areas of varying landscape character importance and sensitivity. Figure 11 represents the site’s landscape master plan and architecture layout. The existing university campus comprises a range of university buildings and facilities, creating four zones in which academic, medical, sport, and housing cities are located. In addition to these zones, roads and open spaces, investment, and future expansion sites were recognized by the design proposal.
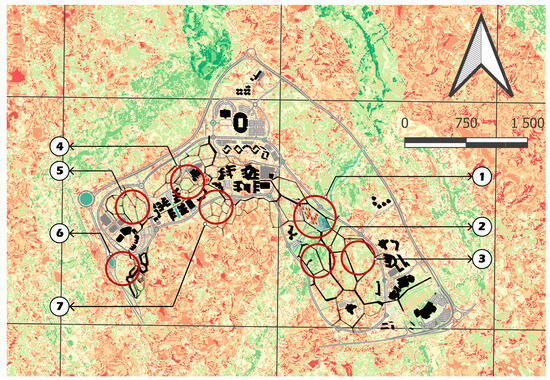
Figure 10.
Design conceptual diagram overlay with the LCA map: 1. Central Plaza and events space. 2. Camping site. 3. Orchard Park. 4. Botanical garden. 5. Observation platform. 6. Investment zone. 7. Beehive farm.
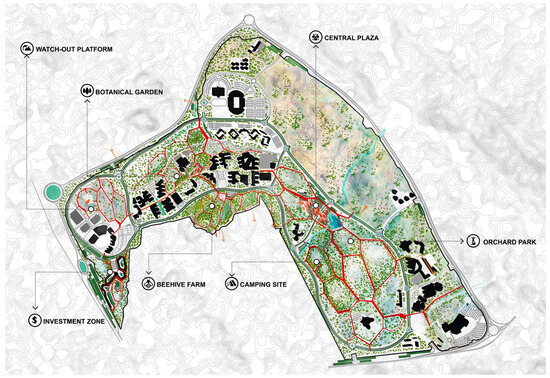
Figure 11.
Proposed landscape master plan of KKU’s campus.
The design process underwent multiple phases. Initially, the team gathered the required data to comprehend the nature of the site. The team conducted a site visit, investigated the site, and interviewed stockholders to collect these data. Alongside the data gathered by the team, additional information was sourced from other references, including site survey data and the campus plan. These data were subjected to extensive analysis by the team. LCA was utilized as one of the analytical methods during the analysis phase. The LCA facilitated the identification of sites with distinctive landscape characters, enabling their integration into the design. The results of the LCA were utilized to aid the designer in the following manner.
The LCA map, shown in Figure 8, represents the site area’s character importance levels, ranging in color from the least value presented in red to the high value in green. In the light of Mat-Ecologies theory, the design decisions regarding the masterplan’s seven zones, highlighted in Figure 10 and Figure 11, respond to the high-importance LCA zones as follows:
- Zone 01: It comprises a central plaza, event space, and food and beverage buildings and creates a vibrant social and cultural hub for the wide university campus. It was intentionally designed in a flat terrain with high visibility from the surrounding landscape. This area allows for flexible open space, accessibility, and visual connection to the rocky backdrop. In the central plaza, a retention water pond is integrated along the natural water collection corridor, in alignment with the hydrological setting map, which acts as an aesthetic and sustainable drainage feature.
- Zone 02: The camping site is located on a mountainous topography in the high landscape character value zone that features steep landforms and dense vegetation. This increases privacy for the camping units and maintains their natural setting and intriguing landscape features.
- Zone 03: The orchard park is strategically situated in the rocky landscape zone, identified as a high-value area according to the LCA results map. This setting is distinguished by a rugged formation, scattered native vegetation, and visual drama, making the park a place to relax, exercise, and socialize.
- Zone 04: This zone comprises the botanical garden and the library plaza and resembles Zone 01 in terms of the flat terrain setting and the high visibility from surrounding buildings and hills. It is easily accessed from surrounding buildings and the main pedestrian route.
- Zone 05: According to the LCA, this mountainous zone achieves a high level of importance due to its physical dominance, landmark quality, and visual connectivity across the wide landscape. It sits at the main gateway to the campus, featuring a welcoming landscape and strong identity. Hence, it was occupied by the observation platform that can provide an expansive 360° panoramic view of the campus and the surrounding landscape.
- Zone 06: In accordance with the LCA results, the investment zone is recognized as an area with a high level of landscape importance and accommodates the investment architecture of commerce, offices, and hotels. It occupies a flat terrain that is suitable for construction and is integrated with the nearby rocky hill.
The undeveloped landscape has been activated through the ecological system of the conceptual mat, creating new biodiversity habitats and regulating the interchangeable relationship between humans and nature. This intervention ensures a minimum impact on the natural system, the rocky land, and the native vegetation. The natural ecosystem in the undeveloped landscape is enriched with the addition of native plants that penetrate to the built-up areas in the science city and the medical city. The new botanical garden, central to the science city, serves as a green transition between the wild and urban environments.
The hexagon pattern of the design scheme, based on the concept of “Mat Ecologies” and landform mapping, has been transformed into a flexible network to accommodate pathways with a maximum gradient of 1:12. This solution allows inclusive design with accessible properties for all the campus’s users. The proposed design scheme organizes architectural developments across the flat terrain in two distinctive areas: the central plaza as a gathering social and event space and the investment zone, which is strategically located next to the main campus’s gate.
The site’s southern area, next to the medical city, and the western area on each side of the main gate are where most of the peak, ridge, and shoulder landforms are distributed. The rocky landscapes of these areas naturally limit flat terrain available for big constructions. Hence, small, lightweight, and carefully designed buildings are proposed to fit into the natural contours of the terrain, such as tent structures for camping and viewing pavilions. The design ensures the integrity and harmony of the new architecture with landscape forms and colors and protects key views and sightlines.
According to the hydrological settings presented before in Figure 6, basins 6 and 7 are identified as the most effective water-collecting basins that control the drainage system through their two class 4 channels. The proposed university central plaza, which sits in between the cities of science and medicine, accommodates a big retention pond that can handle the water overflow of the class 4 channel of basin 7 to manage excess water without interfering with the flow of the main streams. The stream channel penetrates the lake surface, where two controlled inlet and spillway openings are added to allow excess water to flow into the lake when the channel exceeds its capacity. During dry seasons when the water level is low, the pond can maintain a minimum amount of water through water pumping and an underground storage system. In the proposed master plan, the existing water class 4 channel of basin 6 flows freely through an open park landscape without any water alteration. The park design ensures that no buildings or structures are designed to interrupt the flow of the natural stream course. Figure 12 illustrates the proposed site’s hydrological system aligned with the ecological layout.
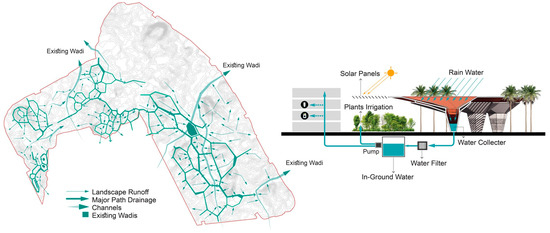
Figure 12.
The proposed hydrological system aligned with the ecological layout.
4. Discussion
The landscape represents a dynamic interplay between natural systems and human endeavors, showcasing both biophysical patterns and cultural values. LCA plays an important role in different applications by offering a spatial framework for multi-functional landscapes for decision-makers. LCA is crucial for conducting site environmental analyses that contribute to the creation of more sustainable and environmentally friendly developments. However, traditional techniques for LCA are inherently subjective and descriptive, depending on human judgments of aesthetic value; hence, they lack consistency in outcomes when evaluated by multiple observers for the same scene [13]. The necessity for an objective, quantifiable, and reproducible approach to landscape evaluation is a significant concern for landscape architects, planners, and environmental managers. The method presented in this research offers a tool for the spatial and quantitative evaluation of landscape character that can help landscape architects make better design decisions. This approach depends on characterizing the landscape using a set of factors that together delineate its character. The next phase involves spatially representing each variable and subsequently assessing its significance for the landscape character. The average of the maps illustrating the variables is computed to provide a new map showing the landscape character value, which may be categorized into levels of significance or importance, allowing for the identification of key landscapes and the calculation of their spatial extents.
In this study, three variables presumed essential for landscape character recognition were selected. The variables include land use/land cover (LULC), landforms, and hydrological conditions. Land Use and Land Cover (LULC) were derived from the Sentinel 2 remote sensing dataset via a supervised classification approach, while landforms and hydrological features were obtained from the ALOS-PALSAR digital elevation model through different GIS functions. Each variable in GIS is represented as a raster grid layer and classified into three degrees of significance. The evaluation was conducted by averaging the classified variables. The landscape character represented on the map illustrates the least, intermediate, and most significant landscape character.
The findings from the LCA are coherent and demonstrate a typical spatial distribution of the character. The importance of the character is determined by the three variables discussed, with its significance rising in relation to the availability and weights of those variables. The least significant landscape denotes a deficient in one or more of the formative variables. Landscapes with the least significant character account for roughly 6.5% (342 ha) of the study area. The intermediate significance character of a landscape indicates that it is influenced by three variables; however, the overall impact of these variables remains relatively minor. The landscapes with intermediate significant character prevail in the study area, covering 3884 ha, which accounts for over 73% of the total area. The most significant landscape character is one that is shaped by the three variables and possesses considerable overall weight. The landscape with the most significant character accounts for over 20% (1074 ha) of the study area. Notable landscapes with the highest values embody locations with a distinct and compelling character, serving as a foundation for the development of diverse environmentally sustainable initiatives, including ecotourism and environmental education.
The landscape character is considered a natural phenomenon. This assumption indicates that any quantization method for the landscape character will yield measures that are statistically normally distributed. Consequently, the regions exhibiting the most and least significant GIS-based landscape character value are anticipated to be restricted. Conversely, the mountainous landscape is diverse, resulting in the classification of 20% of the total study area as possessing the most significant landscape character. Furthermore, the area categorized as having an intermediate significant character comprises over 73% of the total area, while the least significant character is confined to 6.5% of the area.
The landscape architecture proposal of KKU’s campus is informed by and responsive to the findings of this study, based on the three variables of land use/land cover, landforms, and hydrology mappings. The master plan aims to preserve the landscape identity of the site by carefully analyzing the land’s natural and cultural features that compose the final landscape character mapping. The final proposal translates the study’s results into design strategies that maintain the unique landscape character and ensure context-sensitive design outcomes.
5. Conclusions
The proposed approach assumes that all variables, such as LULC and landforms defining the landscape, hold equal significance. In several settings, certain features are more significant than others and play a substantial role in forming the landscape. Future studies might use a mechanism, such as the Analytical Hierarchy Process (AHP), to quantify the varying importance of variables in characterizing landscapes. The study employed data with intermediate spatial resolution to collect and present landscape variables. Nevertheless, this intermediate spatial resolution, while adequate for extensive landscape character evaluations, constrains its utility for comprehensive assessments. To improve geographical precision and generalizability, further research may use higher-resolution datasets.
This study is the first to employ a spatial and quantitative approach for LCA in Saudi Arabia to help landscape architects create more environmental and sustainable designs. The study results present strong evidence regarding the influence of various variables, including land use/land cover, landforms, and hydrological settings, on the formation of landscape character. The research findings serve as a reliable scientific foundation for the selection of sites conducive to environmentally friendly and sustainable landscape development. The LCA, conducted for King Khalid University, is not only a pure theoretical study but also serves as an analytical tool for practical design application. The results of this study have been directly integrated into the landscape master plan to ensure that the design decisions are grounded in a full understanding of the site’s character. This study bridges the gap between theory and practice and science and design, translating the landscape character mappings into design outcomes that shape the identity of King Khalid University’s Campus.
A comprehensive landscape assessment and valuation requires consideration of numerous factors. Numerous elements cannot be effectively represented on maps without comprehensive fieldwork, participant observations, and interviews with land users, among other methodologies. Design decisions should not rely exclusively on landscape character assessment, which evaluates only physical components of the landscape. Considering that, there is no universally applicable landscape research method; rather, each method must be tailored and developed for a specific location. This study does not offer a conclusive method for evaluating landscape character based exclusively on physical landscape elements such as landforms; instead, it introduces an adaptable approach that allows for the inclusion of supplementary physical components in the analysis. This method is one of several proposed approaches for evaluating landscape character. It is advisable to utilize this approach alongside other methods to address their limitations in processing visual and aesthetic data.
Supplementary Materials
The following supporting information can be downloaded at https://www.mdpi.com/article/10.3390/land14112173/s1. Figure S1: A comparison of areas covered by each class in the study area; Table S1: Confusion matrix, producer’s accuracy, and user’s accuracy; Figure S2: Distribution of landform types in the study area, expressed in hectares (Ha) and percentage of total area; Table S2: Summary of hydrological basin characteristics and stream network statistics.
Author Contributions
Conceptualization, W.E.M., O.H.M. and M.M.A.; methodology, W.E.M. and O.H.M.; software, W.E.M. and O.H.M.; validation, M.M.A.; formal analysis, W.E.M., O.H.M. and M.M.A.; investigation, M.M.A.; resources, M.M.A.; data curation, O.H.M.; writing—original draft preparation, W.E.M., O.H.M. and M.M.A.; writing—review and editing, W.E.M.; visualization, W.E.M. and O.H.M.; supervision, M.M.A.; project administration, M.M.A.; funding acquisition, M.M.A. All authors have read and agreed to the published version of the manuscript.
Funding
This research received no external funding.
Data Availability Statement
Data are available from the authors upon reasonable request.
Conflicts of Interest
The authors declare no conflicts of interest.
References
- Vogiatzakis, I.N. Mediterranean experience and practice in Landscape Character Assessment. Eight Const. Med. 2011, 37, 17–31. [Google Scholar] [CrossRef]
- Griffiths, G. Transferring Landscape Character Assessment from the UK to the Eastern Mediterranean: Challenges and Perspectives. Land 2018, 7, 36. [Google Scholar] [CrossRef]
- Gülçin, D.; Yılmaz, K.T. Mapping Landscape Potential for Supporting Green Infrastructure: The Case of a Watershed in Turkey. Land 2020, 9, 268. [Google Scholar] [CrossRef]
- Butler, A. Dynamics of Integrating Landscape Values in Landscape Character Assessment: The Hidden Dominance of the Objective Outsider. Landsc. Res. 2016, 41, 239–252. [Google Scholar] [CrossRef]
- Butler, A. Routledge Handbook of Landscape Character Assessment: Edited by Graham Fairclough, Ingrid Sarlöv-Herlin and Carys Swanwick, Abingdon, Routledge, 2018, 249 pp., £175.00 Hardback, £70.00 Ebook, ISBN 9781138803886. Landsc. Res. 2020, 45, 392–393. [Google Scholar] [CrossRef]
- Palmer, J.F.; Smardon, R.C. US approaches related to Landscape Character Assessment. In Routledge Handbook of Landscape Character Assessment; Fairclough, G., Herlin, I.S., Swanwick, C., Eds.; Routledge: Abingdon, UK; New York, NY, USA, 2018; pp. 131–142. ISBN 978-1-315-75342-3. [Google Scholar]
- Jellema, A.; Stobbelaar, D.-J.; Groot, J.C.J.; Rossing, W.A.H. Landscape Character Assessment Using Region Growing Techniques in Geographical Information Systems. J. Environ. Manag. 2009, 90, S161–S174. [Google Scholar] [CrossRef]
- Martín, B.; Ortega, E.; Otero, I.; Arce, R.M. Landscape Character Assessment with GIS Using Map-Based Indicators and Photographs in the Relationship between Landscape and Roads. J. Environ. Manag. 2016, 180, 324–334. [Google Scholar] [CrossRef]
- Moreno-de Las Heras, M.; Saco, P.M.; Willgoose, G.R.; Tongway, D.J. Assessing Landscape Structure and Pattern Fragmentation in Semiarid Ecosystems Using Patch-Size Distributions. Ecol. Appl. 2011, 21, 2793–2805. [Google Scholar] [CrossRef]
- Abolhasani, A.; Zehtabian, G.; Khosravi, H.; Rahmati, O.; Alamdarloo, E.H.; D’Odorico, P. A New Conceptual Framework for Spatial Predictive Modelling of Land Degradation in a Semiarid Area. Land. Degrad. Dev. 2022, 33, 3358–3374. [Google Scholar] [CrossRef]
- Bourgeron, P.S.; Humphries, H.C.; Jensen, M.E. Landscape Characterization: A Framework for Ecological Assessment at Regional and Local Scales. J. Sustain. For. 1994, 2, 267–281. [Google Scholar] [CrossRef]
- Almalki, R.; Khaki, M.; Saco, P.M.; Rodriguez, J.F. Monitoring and Mapping Vegetation Cover Changes in Arid and Semi-Arid Areas Using Remote Sensing Technology: A Review. Remote Sens. 2022, 14, 5143. [Google Scholar] [CrossRef]
- Terkenli, T.; Gkoltsiou, A.; Kavroudakis, D. The Interplay of Objectivity and Subjectivity in Landscape Character Assessment: Qualitative and Quantitative Approaches and Challenges. Land 2021, 10, 53. [Google Scholar] [CrossRef]
- Bagheri Bodaghabadi, M.; Martínez-Casasnovas, J.A.; Khakili, P.; Masihabadi, M.H.; Gandomkar, A. Assessment of the FAO Traditional Land Evaluation Methods, A Case Study: Iranian Land Classification Method. Soil. Use Manag. 2015, 31, 384–396. [Google Scholar] [CrossRef]
- Costanza, J.K.; Riitters, K.; Vogt, P.; Wickham, J. Describing and Analyzing Landscape Patterns: Where Are We Now, and Where Are We Going? Landsc. Ecol. 2019, 34, 2049–2055. [Google Scholar] [CrossRef]
- Sowińska-Świerkosz, B.; Michalik-Śnieżek, M. Landscape Indicators as a Tool of Assessing Landscape Quality. E3S Web Conf. 2020, 171, 02011. [Google Scholar] [CrossRef]
- Hill, M.J.; Braaten, R.; Veitch, S.M.; Lees, B.G.; Sharma, S. Multi-Criteria Decision Analysis in Spatial Decision Support: The ASSESS Analytic Hierarchy Process and the Role of Quantitative Methods and Spatially Explicit Analysis. Environ. Model. Softw. 2005, 20, 955–976. [Google Scholar] [CrossRef]
- Wróżyński, R.; Pyszny, K.; Sojka, M. Quantitative Landscape Assessment Using LiDAR and Rendered 360° Panoramic Images. Remote Sens. 2020, 12, 386. [Google Scholar] [CrossRef]
- Wartmann, F.M.; Mackaness, W.A.; Bauer, N.; Bolliger, J.; Kienast, F. Towards an Interdisciplinary Understanding of Landscape Qualities: Wilderness, Tranquillity and Dark Skies. In Current Trends in Landscape Research; Mueller, L., Eulenstein, F., Eds.; Innovations in Landscape Research; Springer International Publishing: Cham, Switzerland, 2019; pp. 191–220. ISBN 978-3-030-30068-5. [Google Scholar]
- Mansori, M.; Badehian, Z.; Ghobadi, M.; Maleknia, R. Assessing the Environmental Destruction in Forest Ecosystems Using Landscape Metrics and Spatial Analysis. Sci. Rep. 2023, 13, 15165. [Google Scholar] [CrossRef] [PubMed]
- Chang, K. Introduction to Geographic Information Systems, 9th ed.; McGraw-Hill Education: New York, NY, USA, 2019; ISBN 978-1-260-09258-5. [Google Scholar]
- Baude, M.; Meyer, B.C. Changes in Landscape Structure and Ecosystem Services since 1850 Analyzed Using Landscape Metrics in Two German Municipalities. Ecol. Indic. 2023, 152, 110365. [Google Scholar] [CrossRef]
- Bhermana, A.; Suparman, S.; Tunisa, H.; Hendro Sunarminto, B. Identification of Land Resource Potential for Agricultural Landscape Planning Using Land Capability Evaluation Approach and GIS Application (a Case in Central Kalimantan Province, Indonesia). J. Lahan Suboptimal 2021, 10, 170–177. [Google Scholar] [CrossRef]
- Buczyńska, A. Remote Sensing and GIS Technologies in Land Reclamation and Landscape Planning Processes on Post-Mining Areas in the Polish and World Literature. AIP Conf. Proc. 2020, 2209, 040002. [Google Scholar] [CrossRef]
- Mat Isa, M.; Ismail, N.A.; Abdul Rasam, A.R.; Teh, M.Z. Landscape Characterization Using GIS-Based Landscape Character Assessment in Hulu Langat District, Malaysia. Geografia 2023, 19, 17–33. [Google Scholar] [CrossRef]
- Menasra, A.; Bouzaher, S. GIS Tools for Landscape Character Assessment: Case of Ziban Region in Algeria. Geomat. Landmanagement Landsc. 2021, 4, 19–29. [Google Scholar] [CrossRef]
- Pan, Y.; Wu, Y.; Xu, X.; Zhang, B.; Li, W. Identifying Terrestrial Landscape Character Types in China. Land 2022, 11, 1014. [Google Scholar] [CrossRef]
- Zhao, Y.; Harvey, D.C.; Gao, C. Identifying Shan-Shui Characteristics for National Landscape Heritage: Reconciling Western and Chinese Landscape Characterisation from a Trans-Cultural Perspective. Geogr. J. 2020, 186, 300–313. [Google Scholar] [CrossRef]
- Karasov, O.; Vieira, A.A.B.; Külvik, M.; Chervanyov, I. Landscape Coherence Revisited: GIS-Based Mapping in Relation to Scenic Values and Preferences Estimated with Geolocated Social Media Data. Ecol. Indic. 2020, 111, 105973. [Google Scholar] [CrossRef]
- Chang Chien, Y.-M.; Carver, S.; Comber, A. An Exploratory Analysis of Expert and Nonexpert-Based Land-Scape Aesthetics Evaluations: A Case Study from Wales. Land 2021, 10, 192. [Google Scholar] [CrossRef]
- Eben Saleh, M.A. Value Assessment of Cultural Landscape in Alckas Settlement, Southwestern Saudi Arabia. AMBIO A J. Hum. Environ. 2000, 29, 60–66. [Google Scholar] [CrossRef]
- Addas, A. Landscape Architecture and The Saudi Arabia Quality of Life Program. Emir. J. Eng. Res. 2018, 24, 2. [Google Scholar]
- Alharbi, O.A.; Rangel-Buitrago, N. Landscape Degradation in the Jazan Coastal Desert: Understanding the Impact of Human Activities. Mar. Pollut. Bull. 2023, 190, 114874. [Google Scholar] [CrossRef]
- Nijhuis, S. Applications of GIS in Landscape Design Research. Res. Urban. Ser. 2016, 4, 43–56. [Google Scholar] [CrossRef]
- Adkar, N.; Rajput, B.; Devi, T.O.; Tarawade, S.; Jindam, D. Verifying the Underutilizationof Geographic Information Systems (GIS) in the Realm of Landscape Architecture and Planning. In Proceedings of the 2020 Advances in Science and Engineering Technology International Conferences (ASET), Dubai, United Arab Emirates, 20–23 February 2020; IEEE: Dubai, United Arab Emirates, 2020; pp. 1–6. [Google Scholar]
- Kempa, D.; Lovett, A.A. Using GIS in Landscape Planning. In Landscape Planning with Ecosystem Services; Von Haaren, C., Lovett, A.A., Albert, C., Eds.; Landscape Series; Springer: Dordrecht, The Netherlands, 2019; Volume 24, pp. 77–88. ISBN 978-94-024-1679-4. [Google Scholar]
- Reljić, D.T.; Koscak, V.; Butula, S.; Andlar, G. An Overview of GIS Applications in Landscape Planning. Kartogr. I Geoinformacije 2017, 16, 26–43. [Google Scholar]
- Ahmed, B. Climate of the Kingdom of Saudi Arabia; Kuwait University: Kuwait City, Kuwait, 1993. [Google Scholar]
- Mohammed, W.E.; Algarni, S. A Remote Sensing Study of Spatiotemporal Variations in Drought Conditions in Northern Asir, Saudi Arabia. Environ. Monit. Assess. 2020, 192, 784. [Google Scholar] [CrossRef]
- Delwart, S. Sentinel-2 User Handbook; European Space Agency (ESA): Paris, France, 2015; p. 64. [Google Scholar]
- Mahato, R.; Nimasow, G. Morphometric Analysis of Bichom River Basin, Arunachal Pradesh, India Using ALOS PALSAR RTC DEM and Geospatial Technology. Appl. Geomat. 2023, 15, 853–870. [Google Scholar] [CrossRef]
- Liu, X.; Zhao, C.; Zhang, Q.; Lu, Z.; Li, Z.; Yang, C.; Zhu, W.; Liu-Zeng, J.; Chen, L.; Liu, C. Integration of Sentinel-1 and ALOS/PALSAR-2 SAR Datasets for Mapping Active Landslides Along the Jinsha River Corridor, China. Eng. Geol. 2021, 284, 106033. [Google Scholar] [CrossRef]
- Alves, M.L.P.R.; Oliveira, R.G.L.; Rocha, C.A.A.; Filgueira, H.J.A.; Da Silva, R.M.; Santos, C.A.G. Assessing Flood Susceptibility with ALOS PALSAR and LiDAR Digital Terrain Models Using the Height Above Nearest Drainage (HAND) Model. Environ. Dev. Sustain. 2024. [Google Scholar] [CrossRef]
- Wang, X.; Honda, H.; Djamaluddin, I.; Taniguchi, H.; Mitani, Y. Quantitatively Detecting Ground Surface Changes of Slope Failure Caused by Heavy Rain Using ALOS-2/PALSAR-2 Data: A Case Study in Japan. Sci. Rep. 2024, 14, 23110. [Google Scholar] [CrossRef]
- Saraf, A.K.; Choudhury, P.R.; Roy, B.; Sarma, B.; Vijay, S.; Choudhury, S. GIS Based Surface Hydrological Modelling in Identification of Groundwater Recharge Zones. Int. J. Remote Sens. 2004, 25, 5759–5770. [Google Scholar] [CrossRef]
- Bartlett, D.; Milliken, S. Landscape Character and Ecosystem Services Assessment: A Case Study from India. In Current Trends in Landscape Research; Mueller, L., Eulenstein, F., Eds.; Innovations in Landscape Research; Springer International Publishing: Cham, Switzerland, 2019; pp. 521–543. ISBN 978-3-030-30068-5. [Google Scholar]
- Rosas-Chavoya, M.; Gallardo-Salazar, J.L.; López-Serrano, P.M.; Alcántara-Concepción, P.C.; León-Miranda, A.K. QGIS a Constantly Growing Free and Open-Source Geospatial Software Contributing to Scientific Development. Cuad. Investig. Geogr. 2022, 48, 197–213. [Google Scholar] [CrossRef]
- Conrad, O.; Bechtel, B.; Bock, M.; Dietrich, H.; Fischer, E.; Gerlitz, L.; Wehberg, J.; Wichmann, V.; Böhner, J. System for Automated Geoscientific Analyses (SAGA) v. 2.1.4. Geosci. Model Dev. 2015, 8, 1991–2007. [Google Scholar] [CrossRef]
- Phiri, D.; Simwanda, M.; Salekin, S.; Nyirenda, V.; Murayama, Y.; Ranagalage, M. Sentinel-2 Data for Land Cover/Use Mapping: A Review. Remote Sens. 2020, 12, 2291. [Google Scholar] [CrossRef]
- Pessiot, L. Sentinel-2 Products Specification Document; European Space Agency (ESA): Paris, France, 2024. [Google Scholar]
- Chavez, P.S. Image-Based Atmospheric Corrections—Revisited and Improved. Photogramm. Eng. Remote Sens. 1996, 62, 1025–1036. [Google Scholar]
- Santosa, P.B. Evaluation of Satellite Image Correction Methods Caused by Differential Terrain Illumination. Forum Geogr. 2016, 30, 1. [Google Scholar] [CrossRef]
- Chuvieco, E. Fundamentals of Satellite Remote Sensing: An Environmental Approach, 3rd ed.; CRC Press: Boca Raton, FL, USA; London, UK; New York, NY, USA, 2023; ISBN 978-1-032-65444-7. [Google Scholar]
- Jasiewicz, J.; Stepinski, T.F. Geomorphons—A Pattern Recognition Approach to Classification and Mapping of Landforms. Geomorphology 2013, 182, 147–156. [Google Scholar] [CrossRef]
- Luo, W.; Liu, C.-C. Innovative Landslide Susceptibility Mapping Supported by Geomorphon and Geographical Detector Methods. Landslides 2018, 15, 465–474. [Google Scholar] [CrossRef]
- Flynn, T.; Rozanov, A.; Ellis, F.; De Clercq, W.; Clarke, C. Farm-Scale Soil Patterns Derived from Automated Terrain Classification. Catena 2020, 185, 104311. [Google Scholar] [CrossRef]
- O’Callaghan, J.F.; Mark, D.M. The Extraction of Drainage Networks from Digital Elevation Data. Comput. Vision. Graph. Image Process. 1984, 28, 323–344. [Google Scholar] [CrossRef]
- Tara, A.; Lawson, G.; Davies, W.; Chenoweth, A.; Pratten, G. Integrating Landscape Character Assessment with Community Values in a Scenic Evaluation Methodology for Regional Landscape Planning. Land 2024, 13, 169. [Google Scholar] [CrossRef]
- O’Neill, R.V.; Hunsaker, C.T.; Jones, K.B.; Riitters, K.H.; Wickham, J.D.; Schwartz, P.M.; Goodman, I.A.; Jackson, B.L.; Baillargeon, W.S. Monitoring Environmental Quality at the Landscape Scale. BioScience 1997, 47, 513–519. [Google Scholar] [CrossRef]
- Sohel, M.S.I.; Ahmed Mukul, S.; Burkhard, B. Landscape׳s Capacities to Supply Ecosystem Services in Bangladesh: A Mapping Assessment for Lawachara National Park. Ecosyst. Serv. 2015, 12, 128–135. [Google Scholar] [CrossRef]
- Florinsky, I.V.; Kulagina, T.B.; Meshalkina, J.L. Influence of Topography on Landscape Radiation Temperature Distribution. Int. J. Remote Sens. 1994, 15, 3147–3153. [Google Scholar] [CrossRef]
- Sofia, G.; Tarolli, P. Hydrological Response to ~30 years of Agricultural Surface Water Management. Land 2017, 6, 3. [Google Scholar] [CrossRef]
- Morgan, M. Power, Culture, and Materiality in Modernity. Cult. Sociol. 2022, 16, 112–117. [Google Scholar] [CrossRef]
- Amoroso, N. Representing Landscapes: A Visual Collection of Landscape Architectural Drawings; Taylor & Francis Group: London, UK; New York, NY, USA, 2012; ISBN 978-0-415-58956-7. [Google Scholar]
Disclaimer/Publisher’s Note: The statements, opinions and data contained in all publications are solely those of the individual author(s) and contributor(s) and not of MDPI and/or the editor(s). MDPI and/or the editor(s) disclaim responsibility for any injury to people or property resulting from any ideas, methods, instructions or products referred to in the content. |
© 2025 by the authors. Licensee MDPI, Basel, Switzerland. This article is an open access article distributed under the terms and conditions of the Creative Commons Attribution (CC BY) license (https://creativecommons.org/licenses/by/4.0/).