Abstract
Urban green space, green infrastructure, and horticultural installations are gaining recognition for their potential to foster biodiversity. Green roofs are challenging growing environments for plants, characterized by extreme substrate temperatures, high light intensity, limited moisture availability, and limited substrate depth. Plants have a variety of physiological responses to these unique conditions, but little is known about how green roof growing conditions affect ecological characteristics like plant flowering phenology. Meanwhile, studies are only just uncovering the degree to which green roofs can provide habitat and support urban pollinator biodiversity. We evaluated the flowering phenology and made in situ pollinator observations of 15 plant taxa growing both on green roof systems and at ground level in Denver, Colorado, over two growing seasons. We found that flowering phenology occurs substantially earlier on green roofs compared to ground level among the observed plant taxa and observed a greater number of pollinators on green roofs early in the season, compared to ground level, presumably due to the availability of floral resources among the observed plant taxa. We observed significantly higher substrate temperatures along with wider diurnal temperature amplitude during the growing season that may contribute to the observed phenological patterns. Divergence in flowering phenology between individual plants of the same species on green roofs and plants at ground-level may have implications for organisms that rely on floral resources in urban environments. Earlier flower initiation on green roofs may provide pollinators with unique foraging opportunities and aid targeted conservation where early-season floral resources are limited.
1. Introduction
1.1. Green Roofs as Ecosystems
Green roofs provide urban ecosystem services including wildlife habitats, pollination services, urban heat island reduction, and stormwater management [1]. Recent work has encouraged green roof designers, practitioners, and horticulturists to apply ecological understanding when considering green roofs and to implement ecological theory to enhance the capacity of green roofs to support biodiversity and inform plant selection [2,3,4]. The abiotic conditions of green roof systems are of particular interest because they are likely to have a direct effect on plant growth and survival.
It is widely recognized that green roof conditions present challenges to plant growth and survival, including high and low air and substrate temperatures, high light intensity, limited moisture availability, limited substrate depth, and direct exposure to weather events. Plant selection for green roofs has therefore targeted species that can cope with these conditions [5] and selection is especially important in semi-arid climate regions [6,7]. Researchers have evaluated individual plant responses to green roof conditions, including drought stress and substrate depth [8,9], but most of these studies have operated at an organismal or physiological level. Less is known about how green roof conditions may affect broader ecological characteristics, especially in urban areas and when compared to similar plants and cultivated green space and ecological communities at ground level.
1.2. Phenology and Green Roofs
Plant phenology is a crucial ecosystem characteristic that can influence many ecosystem functions and characteristics, including pollination, and plant reproductive success, but it remains an understudied aspect of green roof ecology. Plants on green roofs have, anecdotally, been noted to bloom earlier than in other urban green spaces at ground-level in the spring. The primary reason for the observed earlier bloom time is unknown, but is thought to be related to green roof air and substrate temperatures, which are presumed to be higher in both spring and fall compared to native soils at ground level. Temperate-zone plants, especially day-neutral species, often bloom when environmental conditions are ideal, which can be influenced by root zone temperatures [10].
Substrate moisture levels are often low on green roof systems, and this has been shown to advance flowering phenology in natural systems through plant physiological water stress [11]. Research in natural systems suggests that flowering phenology is thought to be driven primarily by temperature and photoperiod in most temperate plant species and phenological events are most likely triggered by an interaction between these two variables [12]. In arid and semi-arid climates, moisture may be a primary trigger for flower initiation, but is also thought to interact with temperature and photoperiod to determine the phenological plant response [13,14].
Given that green roofs often exacerbate both temperature and water stress in plants, evidence and theory from basic plant physiology suggests that green roof conditions would also affect plant phenology. Although plants may bloom earlier than in surrounding areas at ground level, the stressful environment of green roofs (limited substrate depth, exposure, and heat) may contribute to shortened bloom time or reduced flowering. Heat and drought, including climate change trends, demonstrably alter the flowering phenology of plants, often reducing floral resources in natural systems [15]. Simultaneously, plants in urban areas already bloom earlier than in surrounding un-urbanized habitats, largely due to the urban heat island effect [16], and green roofs are likely more sensitive to this effect than other types of urban green space due to their broad environmental exposure.
1.3. Substrate Temperature
The substrate temperature on green roofs is the most frequently investigated, as it relates to building energy conservation and the insulating properties of green roofs [17], or how the canopy density or plant type affect the substrate temperature [18], rather than its effects on plant growth. Substrate temperature extremes may likely affect plant growth more strongly in semi-arid environments like Denver, CO, than in more temperate climates due to the wide diurnal temperature variations characteristic of dry, continental climates. Reyes et al. [19] demonstrated that in a semi-arid climate, green roof substrate temperatures frequently reach plant heat-stress thresholds and that substrate depth was the primary factor controlling temperature amplitude.
1.4. Plant Pollinator Interactions
The symbiosis between flowering plants and their pollinators is well established [20]. Plant phenology affects pollinator visitation [21] and plant phenology synchronization with pollinator foraging impacts both plant and pollinator reproductive success [22,23]. If plants on green roofs have an altered flowering phenology that results in earlier bloom in the spring and a repeat bloom in the fall, that would theoretically increase the window of time in which pollinators are able to forage and therefore increase their chances of survival. With pollinator populations in decline across North America [24], widening the window of time to forage may benefit pollinator species. Simultaneously, climate change has encouraged pollinators to emerge from hibernation earlier in the spring and remain active later in the fall. For example, a study in the UK demonstrated that bumblebees emerged about 2 weeks earlier due to the effects of climate change [25] and other work suggests similar patterns of altered pollinator emergence along rural-to-urban gradients as urbanization increases ambient temperatures [26].
Planting combinations and diverse functional planting groups appear to enhance abiotic ecosystem functions such as water capture, evapotranspiration, and ambient temperature reduction on green roofs [27]. Similarly, green roofs have been shown to host comparable measures of biodiversity compared to their green space counterparts at grade [28]. However, research investigating pollinator richness on green roofs has been conflicting. Native bee [29] and general pollinator [30] diversity and abundance has been shown to be lower on green roofs than in surrounding reference habitats, and bee abundance has been shown to increase with plant diversity and complexity of planting composition. Other work indicates that green roofs have a significantly higher abundance of some species of native bees and may provide unique habitat and foraging opportunities compared to sites at ground level [31].
1.5. Study Aims
The aims of this study were to (1) quantify differences in flowering time and duration between the same plant species that were growing under green roof conditions compared to ground-level, (2) determine if apparent differences in phenology were related to differences in substrate temperatures between locations, and (3) determine if pollinator foraging on green roofs exhibits different temporal patterns compared to that at ground level while also describing differences in pollinator abundance and diversity between the two spaces.
2. Materials and Methods
2.1. Study Site
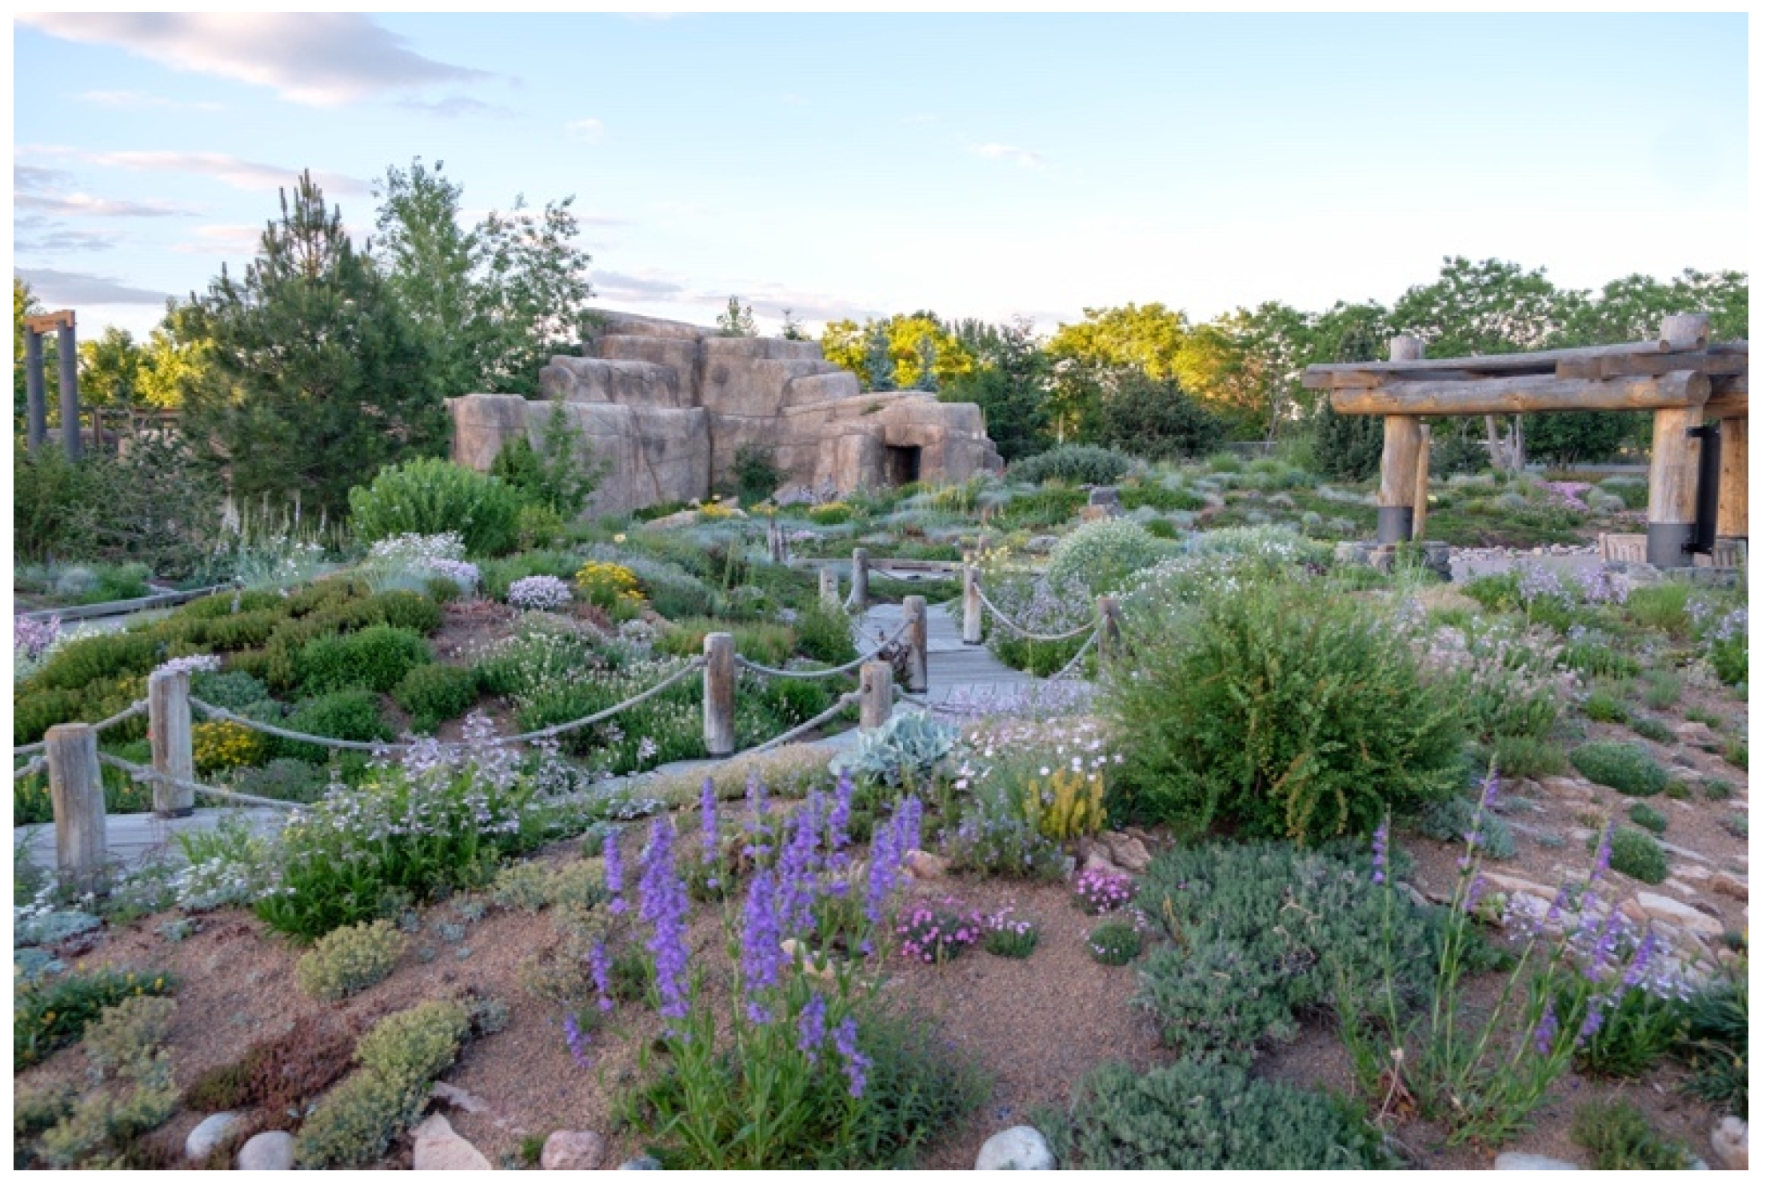
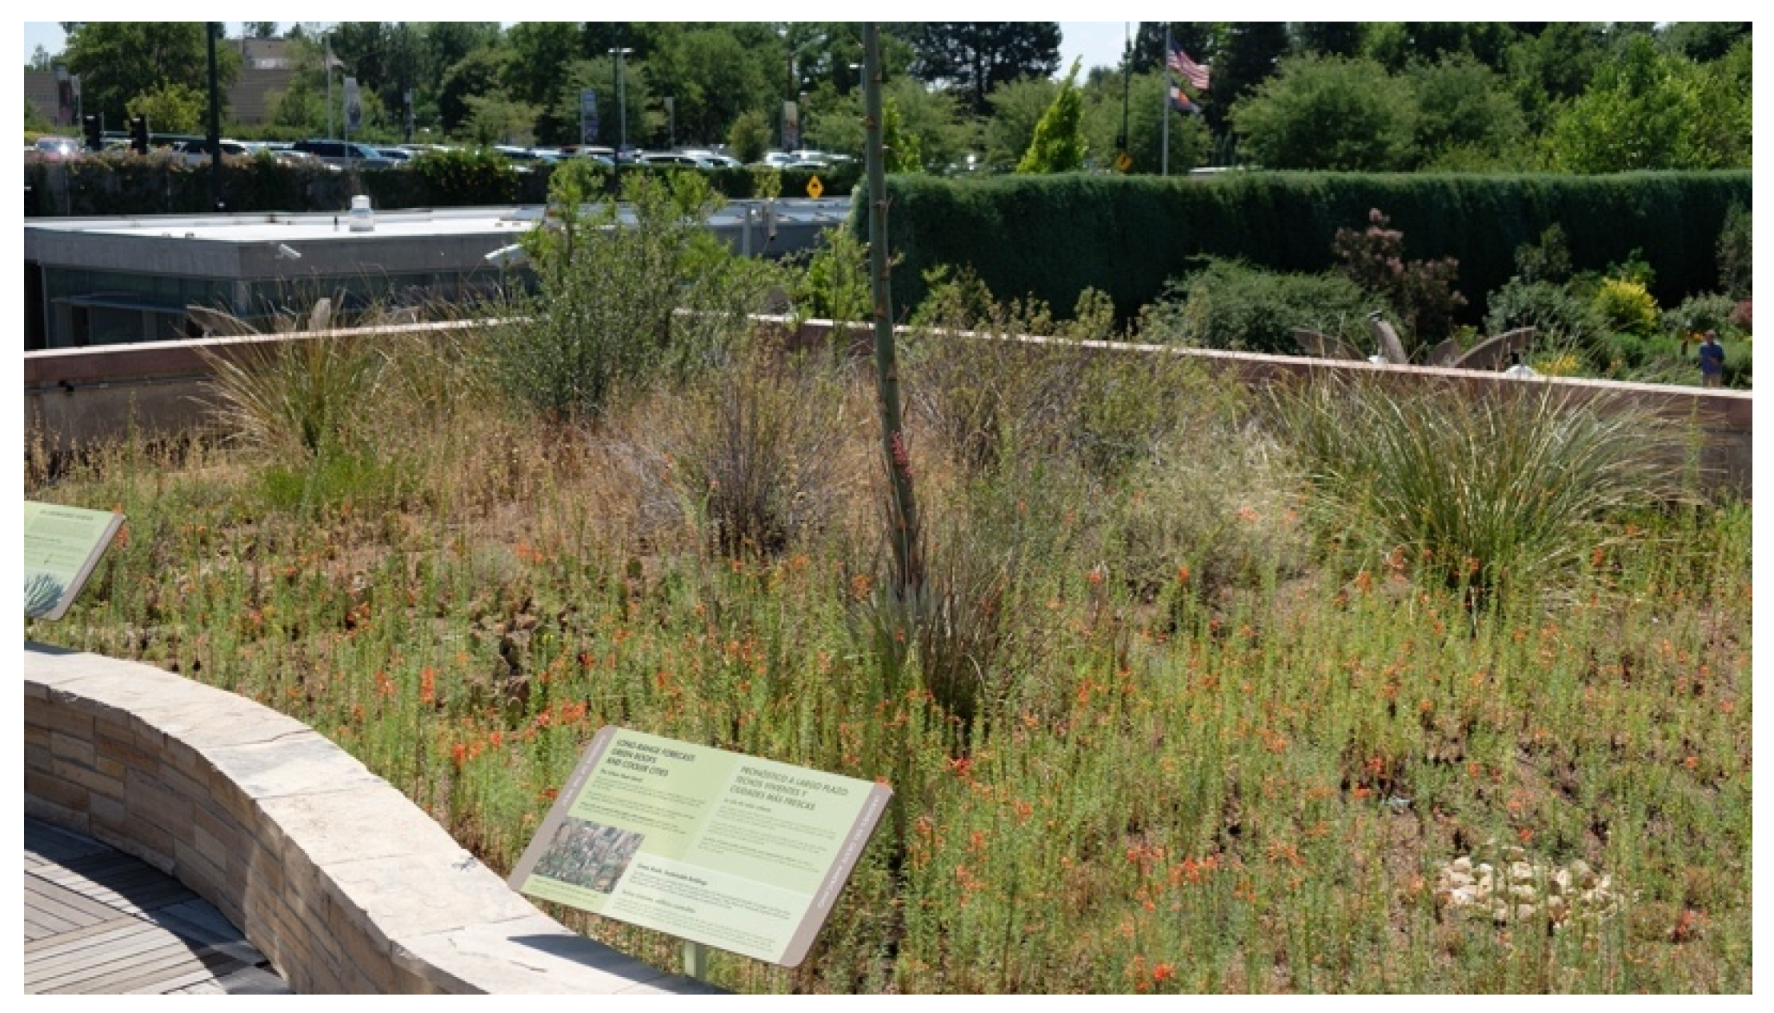
The study was conducted at the Denver Botanic Gardens (DBG) in Denver, Colorado (39.732072, −104.960823). Observations occurred on two green roof installations and at various locations within a 24-acre campus of ornamental gardens at ground level and all observations were made within a 200 m radius of one another. The primary green roof used in this study is a large mixed-intensive green roof, the Mordecai Children’s Garden (Figure 1). The installation contains diverse horticultural plantings, the planting bed area is 1230 m2, the substrate depth ranges from 5 cm to 61 cm, and the overall height rises 5–8 m above grade. A second 195 m2 extensive green roof at the same site is located 4 m above grade and has substrate depths ranging from 10 cm to 45.7 cm (Figure 2). Both green roofs have similar substrate media; the larger intensive green roof consists of 75% expanded shale aggregate, 20% compost and 5% zeolite, whereas the smaller extensive green roof has media composed of 80% expanded shale and 20% compost.

Figure 1.
The mixed intensive green roof site at Denver Botanic Gardens.
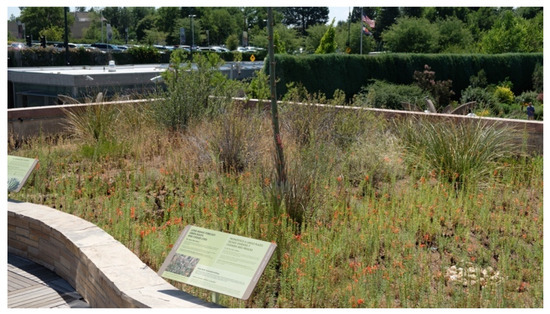
Figure 2.
The extensive green roof site at Denver Botanic Gardens.
2.2. Local Climate Conditions
Denver, Colorado (USA) is a cold steppe climate according to the Köppen–Geiger climate classification. The climate is characterized by hot summers and cold, dry winters. The mean temperature is 10.3 °C and the mean annual precipitation is 363 mm [32]. The majority of precipitation occurs in the spring (March–May) or in mid-summer storms driven by the North American monsoon. Denver, CO, has a significant urban heat island effect with daily summer urban–rural temperature differences of 3.3 °C [33].
2.3. Plant Selection and Inclusion Criteria
Ground-level gardens at DBG house many of the same plant species as the onsite green roofs; therefore, we evaluated 15 plant species (Table 1) that are represented on both a green roof system onsite and at ground level on the main campus of DBG; six species were observed in 2019 and the full array of 15 was observed in 2020. Fourteen out of fifteen plants were found on the intensive green roof, while a single taxon, Ipomopsis aggregata, was observed on the extensive green roof system. Plants were selected based on availability (already growing in both locations), a wide phenological range (i.e., early, mid, and late-season bloom times), and a broad taxonomic range. Accession records from BG-BASE, a database application written primarily to handle the information management needs of institutions holding collections of biological material, including botanic gardens, arboreta, and herbaria, were used to control for differences in plant age or origin; only accessions 3–10 years old were included to minimize phenological differences associated with plant age. Accessions from wild-collected germplasm were excluded, meaning that the evaluated plants were of cultivated origin. Five of the species are native to the US state of Colorado and eight are native to the continental US (Table 1).

Table 1.
Plant species evaluated in the study. Bloom times are subdivided as follows: early (April–May), mid (June–July), and late (August–October).
2.4. Substrate Temperature and Abiotic Conditions
During the course of the study, HOBO temperature data loggers (HOBO Pendant® MX MX2201) were installed in the soil within 2 m of every observed plant at a depth of 15 cm and recorded temperature readings every 15 min. Air temperature and other weather data were collected onsite at DBG using an automated weather station and precipitation data were measured onsite (data extracted from CoCoRaHS) (Supplementary Table S3). We extracted monthly mean high and low temperatures and average monthly precipitation over the course of the study period. Irrigation rates as well as any key maintenance that would affect the study plants were noted over the course of the study. Selected plant species were growing under analogous conditions in both green roof and ground-level locations, including similar exposure, aspect, and irrigation schedules. Edaphic conditions were not controlled due to the observational nature of the study; however, soils at ground level were high in coarse inorganic material, similar to the green roof media (see edaphic properties in Table 2).
Table 2.
Edaphic characteristics of green roof and ground-level garden soil and soilless media (AG = At grade, GR = green roof).
2.5. Phenology Observations
Five individual plants per species on both the green roof and the ground-level gardens (a total of ten plants per species) were marked with zinc labels and evaluated weekly for flower development, bloom time, fruit, and seed development during the growing seasons (15 March through 31 October) of 2019 and 2020. We recorded the timing and number of flowers as well as the timing and presence of flower buds, fruits or seed capsules, and ripe fruits or seeds. The presence of fruit or seeds was recorded when seed capsules or fruits began to swell and ripe fruits and seeds were recorded when seeds were dehiscent and mature.
Since flower morphology and the arrangement of inflorescences on flowers differs among plants, we defined our floral units in several different ways to make data collection feasible and provide useful comparisons. For plants with distinct unclustered flowers, and for plants with clustered stems of flowers (e.g., Dianthus plumarius and Penstemon strictus, respectively) we counted individual flowers. For plants with small, clustered inflorescences composed of many indistinct individual flowers (e.g., Eriogonum jamesii), we estimated the total number of flowers by counting flower heads and multiplying by the average number of flowers per head. For plants with composite flowers, we counted capitula (e.g., Chrysothamnus nauseosus ssp. nauseosus). Plant width was recorded as an average of diameter measurements on an x-y horizontal axis to control for the effect of plant size on flower counts. Mat-forming plants with indistinguishable individuals were observed by counting all floral units within 90 cm2 square quadrats with 5 samples per location. For woody shrubs, one primary stem was marked, its length measured, and observations only included inflorescences on the tagged stem. Phenology observations of vegetative stages (leaf budding and flush) were not made, as the focus of this study was flowering phenology.
2.6. In Situ Pollinator Observations
In accordance with Mason et al.’s [34] methodology, we conducted two-minute observations of five individuals from each observed plant species every week during the growing season, between 9:00 a.m. and 11:00 a.m. Morphospecies were utilized to classify pollinators during the in situ observations, following the protocol established by Mason et al. [34]. Only visiting pollinators that made contact with the floral reproductive structures within the designated two-minute observation window were tallied. Species replicates lacking active flowers with intact reproductive structures were excluded from the observations.
2.7. Data Analysis
Mean first budding observations, flowering day, flowering duration, and weekly flower count were calculated for each plant species. The mean first flowering dates were calculated by converting dates to calendar (ordinal) days and calculating the mean day number on which open flowers were first observed on a given plant species at each location. The maximum flowering day was calculated by converting dates into calendar (ordinal) days and taking the mean of the day on which the maximum number of flowers was observed for each plant species over the course of the growing season. Standard deviations were calculated for each mean and for the maximum flowering dates. Flower counts were totaled for each species at ground level and on the green roofs and, to account for plant size, were normalized by dividing the total flower count by the size index of the plant.
Mean monthly, mean monthly maximum, and mean monthly minimum substrate temperatures and standard deviations were calculated and the temperature amplitude was calculated by calculating the difference between daily high and low temperatures for each day of the month, and standard deviations were calculated for the difference in temperature. All data were analyzed in R and visualized using Microsoft Excel or the ggplot2 package in R [35].
3. Results
3.1. Plant Phenology
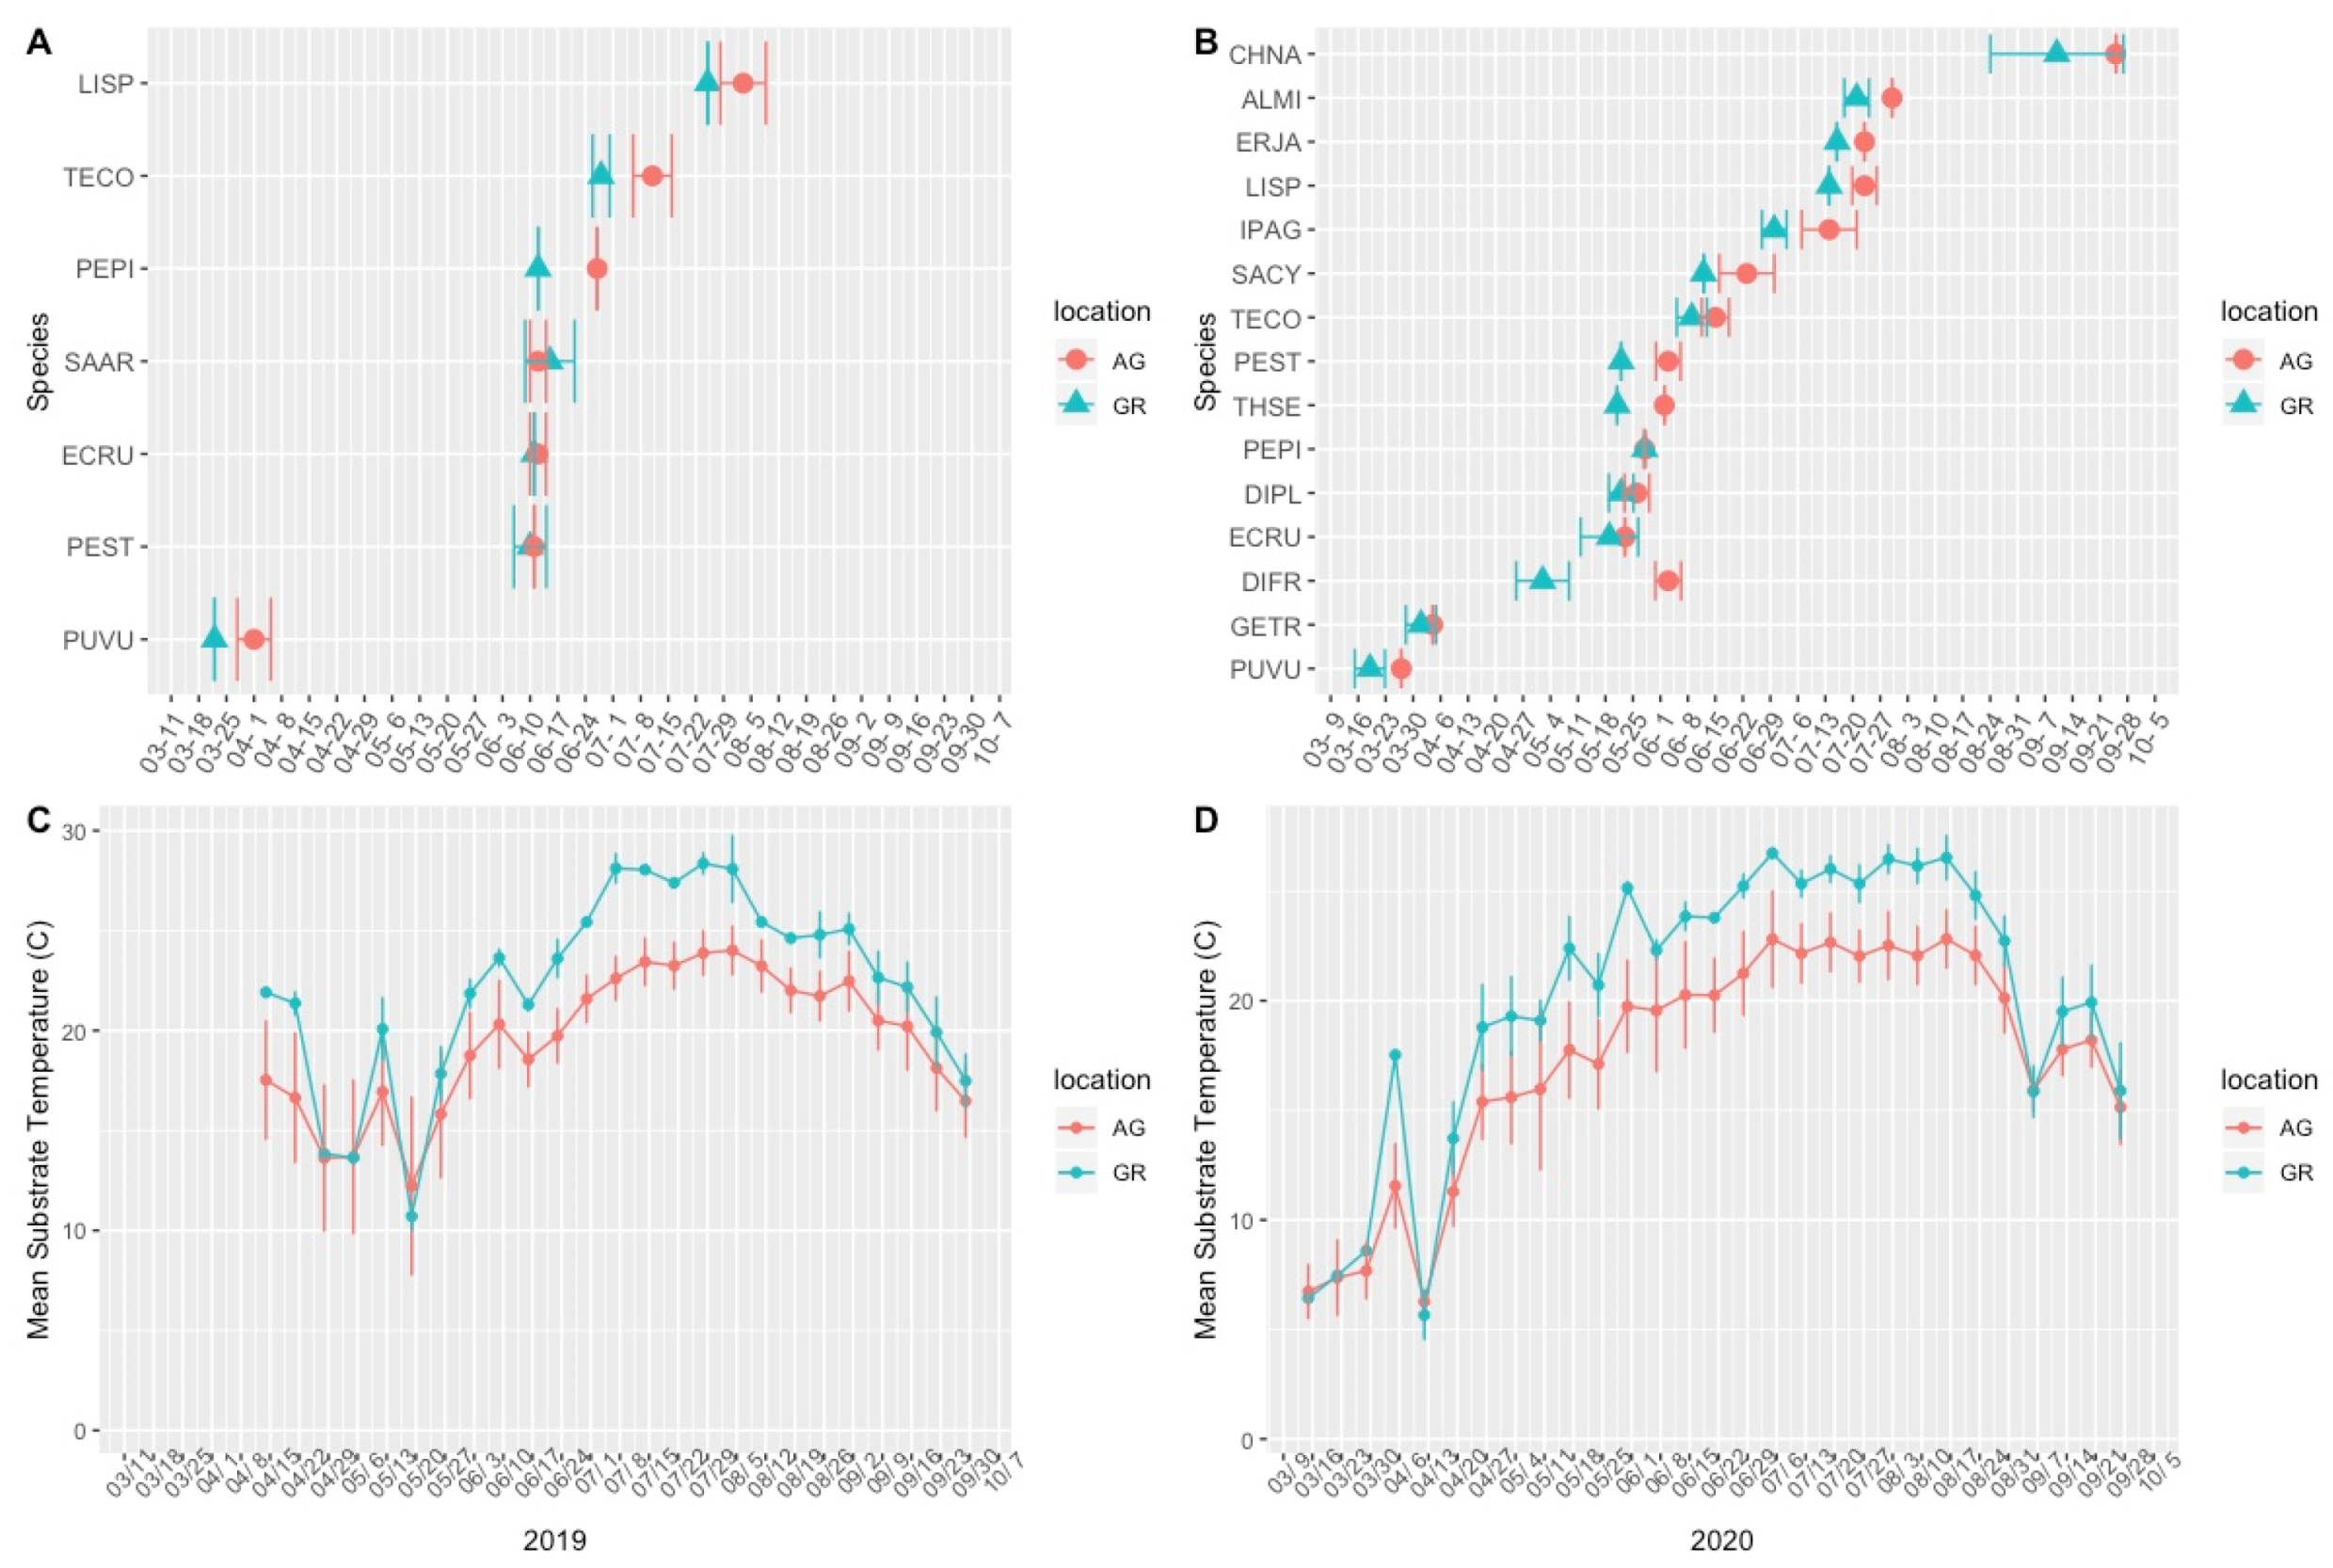
Over the course of the study, we made 2480 flowering phenology observations. In 2019, five out of the six observed plant taxa bloomed earlier on the green roof than at ground level, while one species (Salvia) bloomed 2.4 days later on the green roof (Table 3, Figure 3). In 2020, fourteen out of fifteen plant taxa bloomed earlier on the green roofs compared to ground level, with Penstemon pinifolius initiating flowering concurrently in both locations (Table 3, Figure 3). The mean first flowering date was an average of 5.3 days (range: −2.4–15) earlier in 2019 and 9.4 (range: 0–32.5) days earlier in 2020 for plants growing on the green roofs compared to ground level (Table 3).
Table 3.
Initiation date of flowering, difference in flowering time (GR-AG), maximum number of flowers, total number of flowers, and duration of flowering among our study species. Plant species are abbreviated with the first two letters of the genus and species (i.e., Echium russicum = ECRU). * CHNA flowering duration was not calculated due to a sudden freeze event which prematurely terminated flowering.
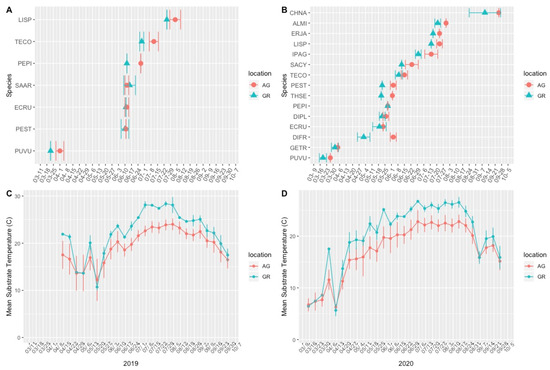
Figure 3.
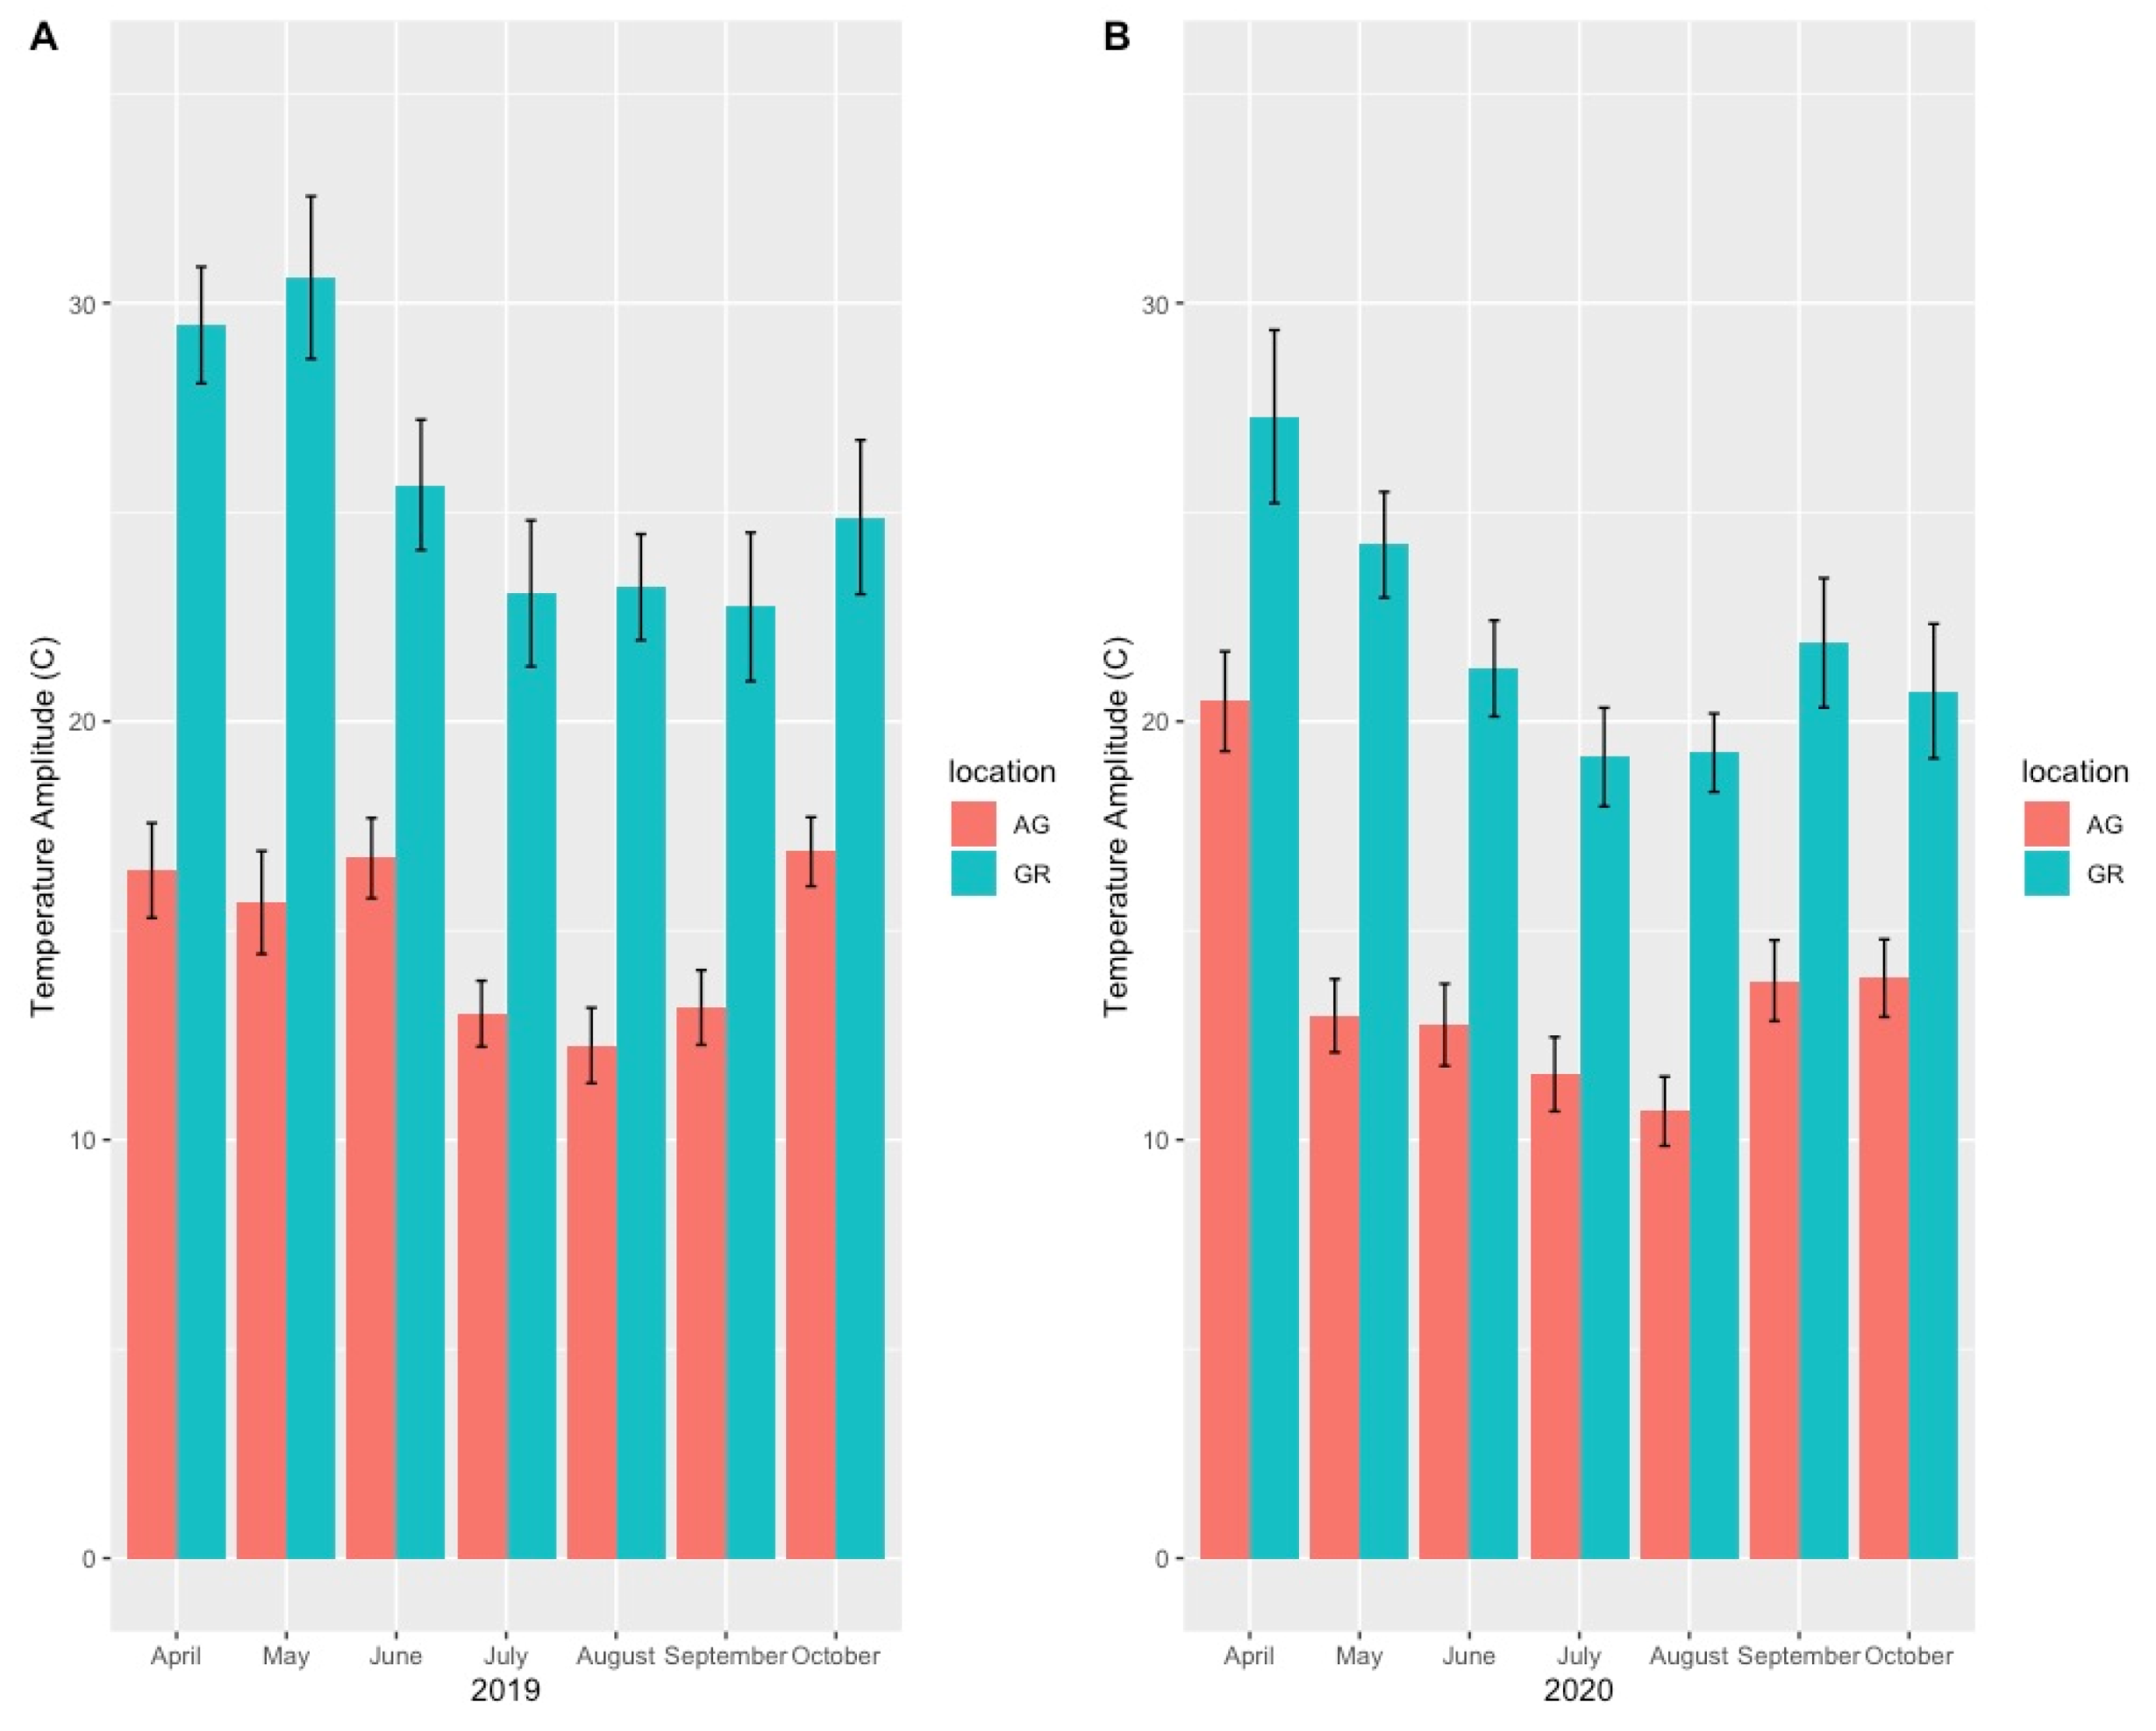
Mean first flowering date in the 2019 (A) and 2020 (B) growing seasons and mean substrate temperature during the 2019 (C) and 2020 (D) growing seasons. Error bars represent the standard deviations (+/−) of the means. AG = ground level, GR = green roof.
The difference in the first flowering date was greatest among early blooming (e.g., Pulsatilla vulgaris and Geum triflorum) and late-blooming plant taxa (e.g., Chrysothamnus nauseosus ssp. nauseosus; Table 3). There was considerable variation in both the first flowering date and the flowering duration between years for both locations (i.e., species did not bloom at the same time year to year), but plants on the green roofs (excepting Salvia) all bloomed relatively earlier, despite absolute changes in the first flowering date (Figure 3, Table 3).
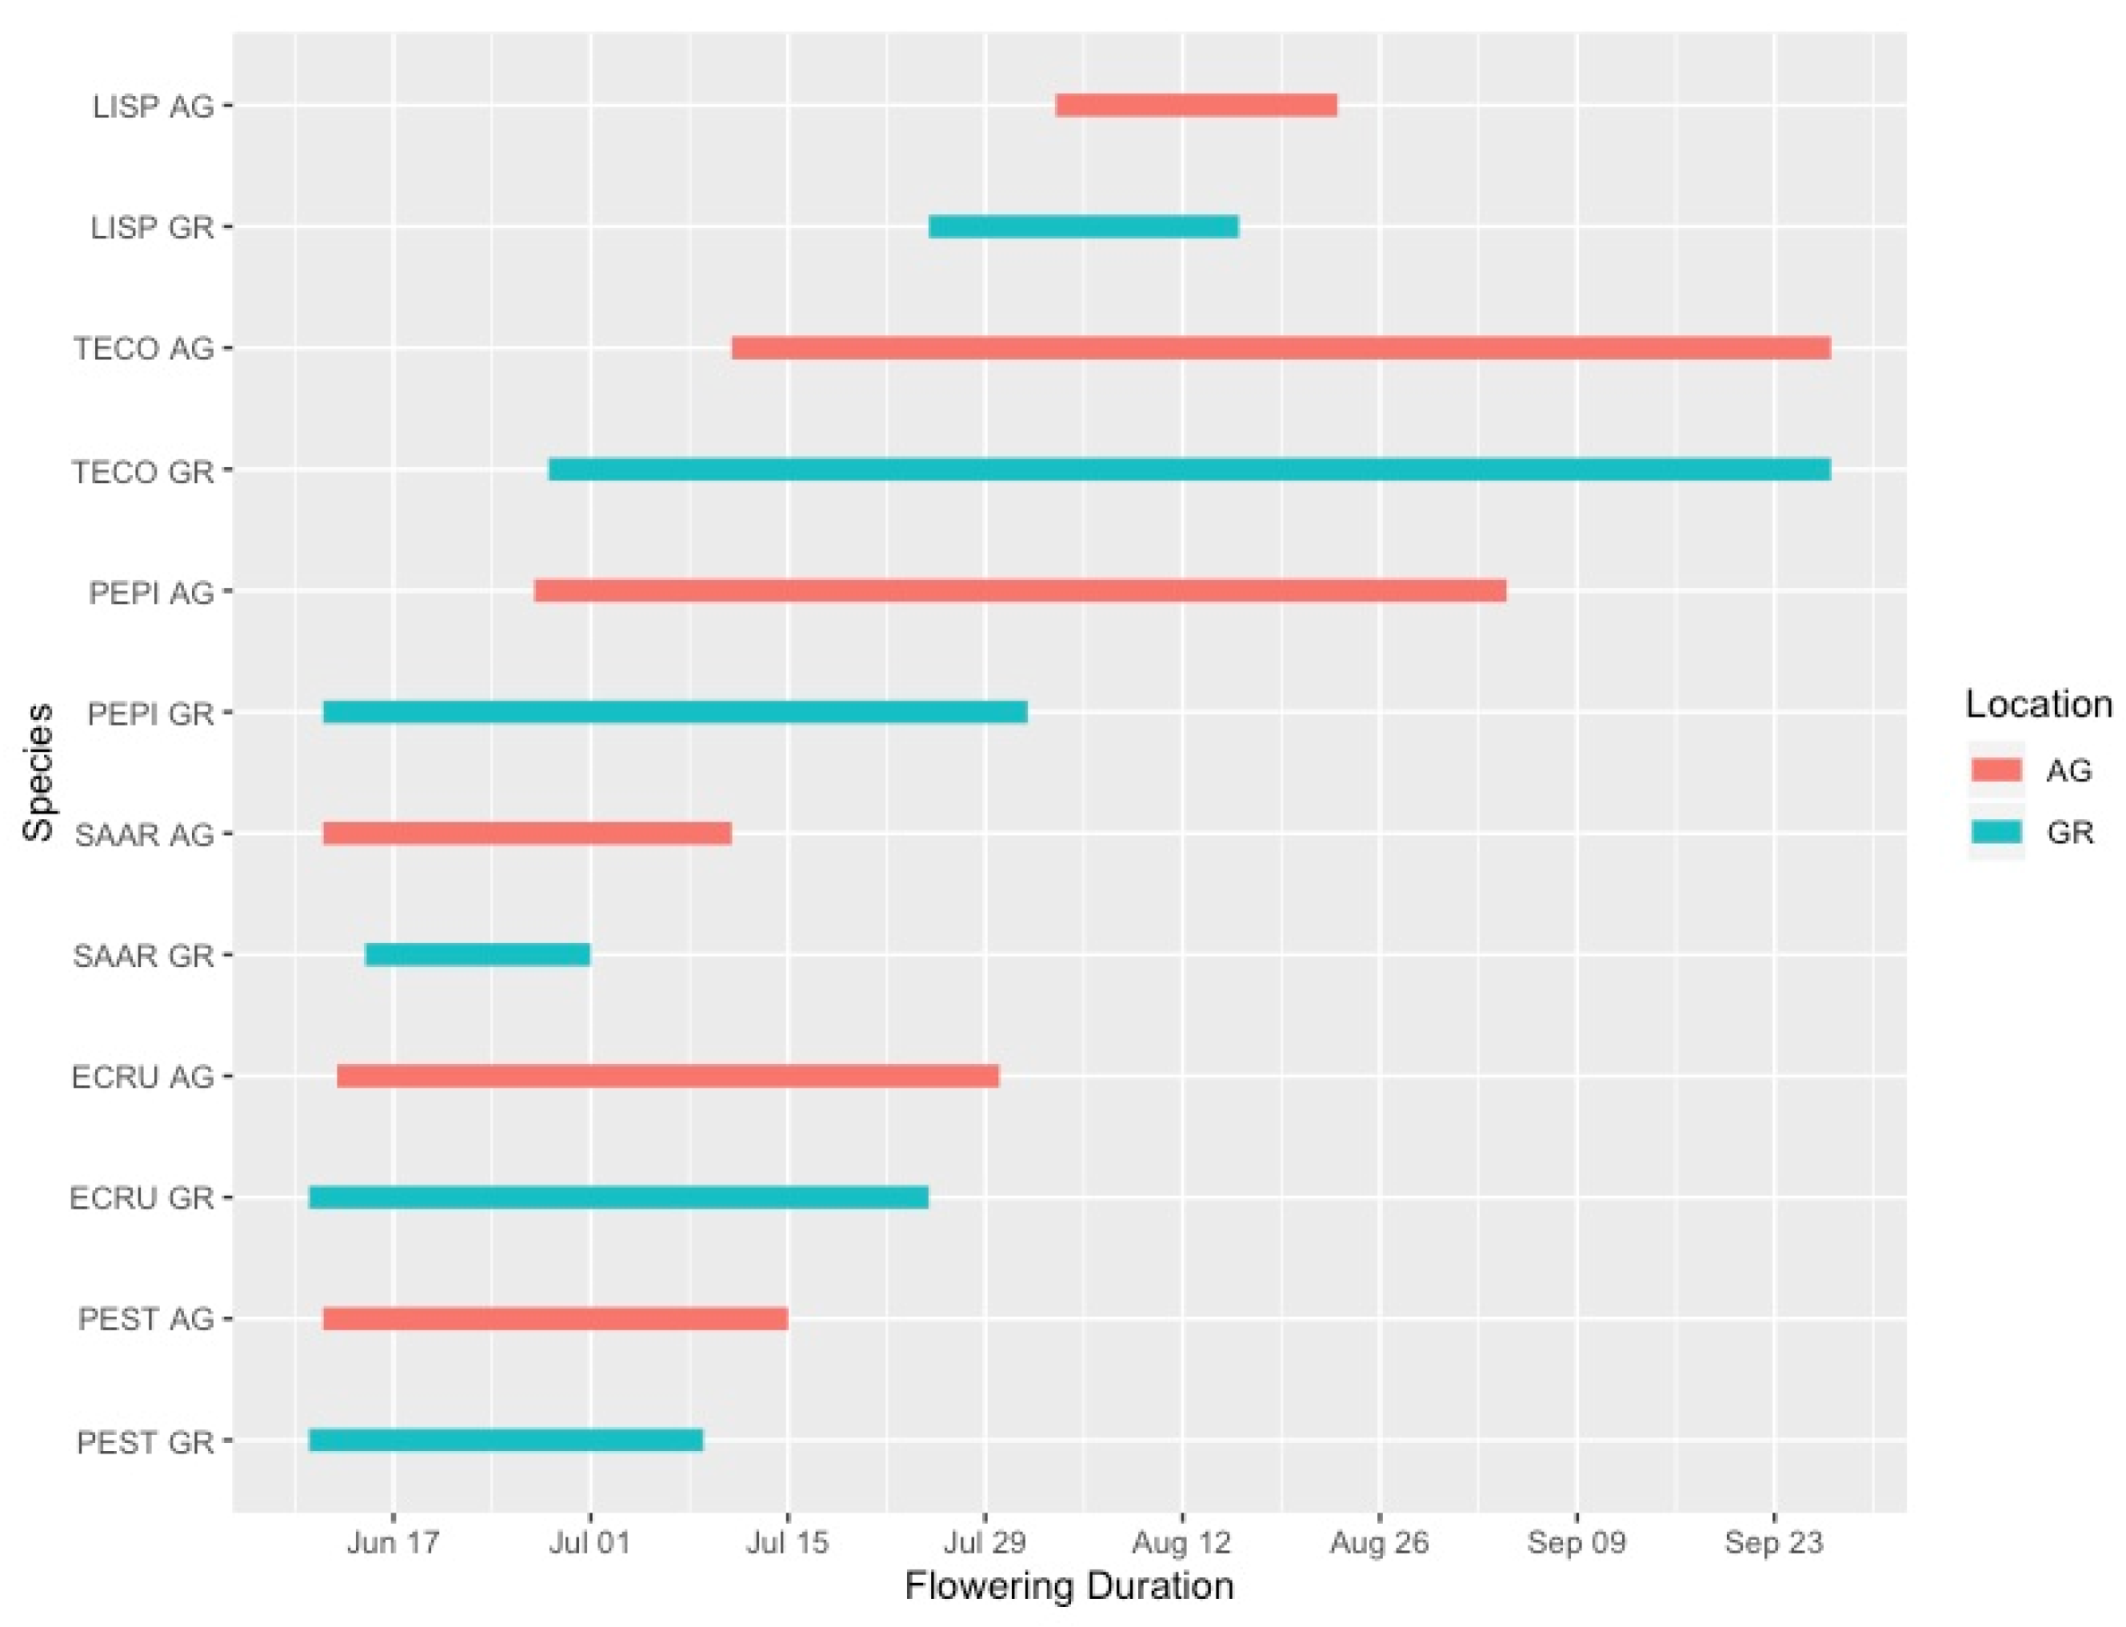
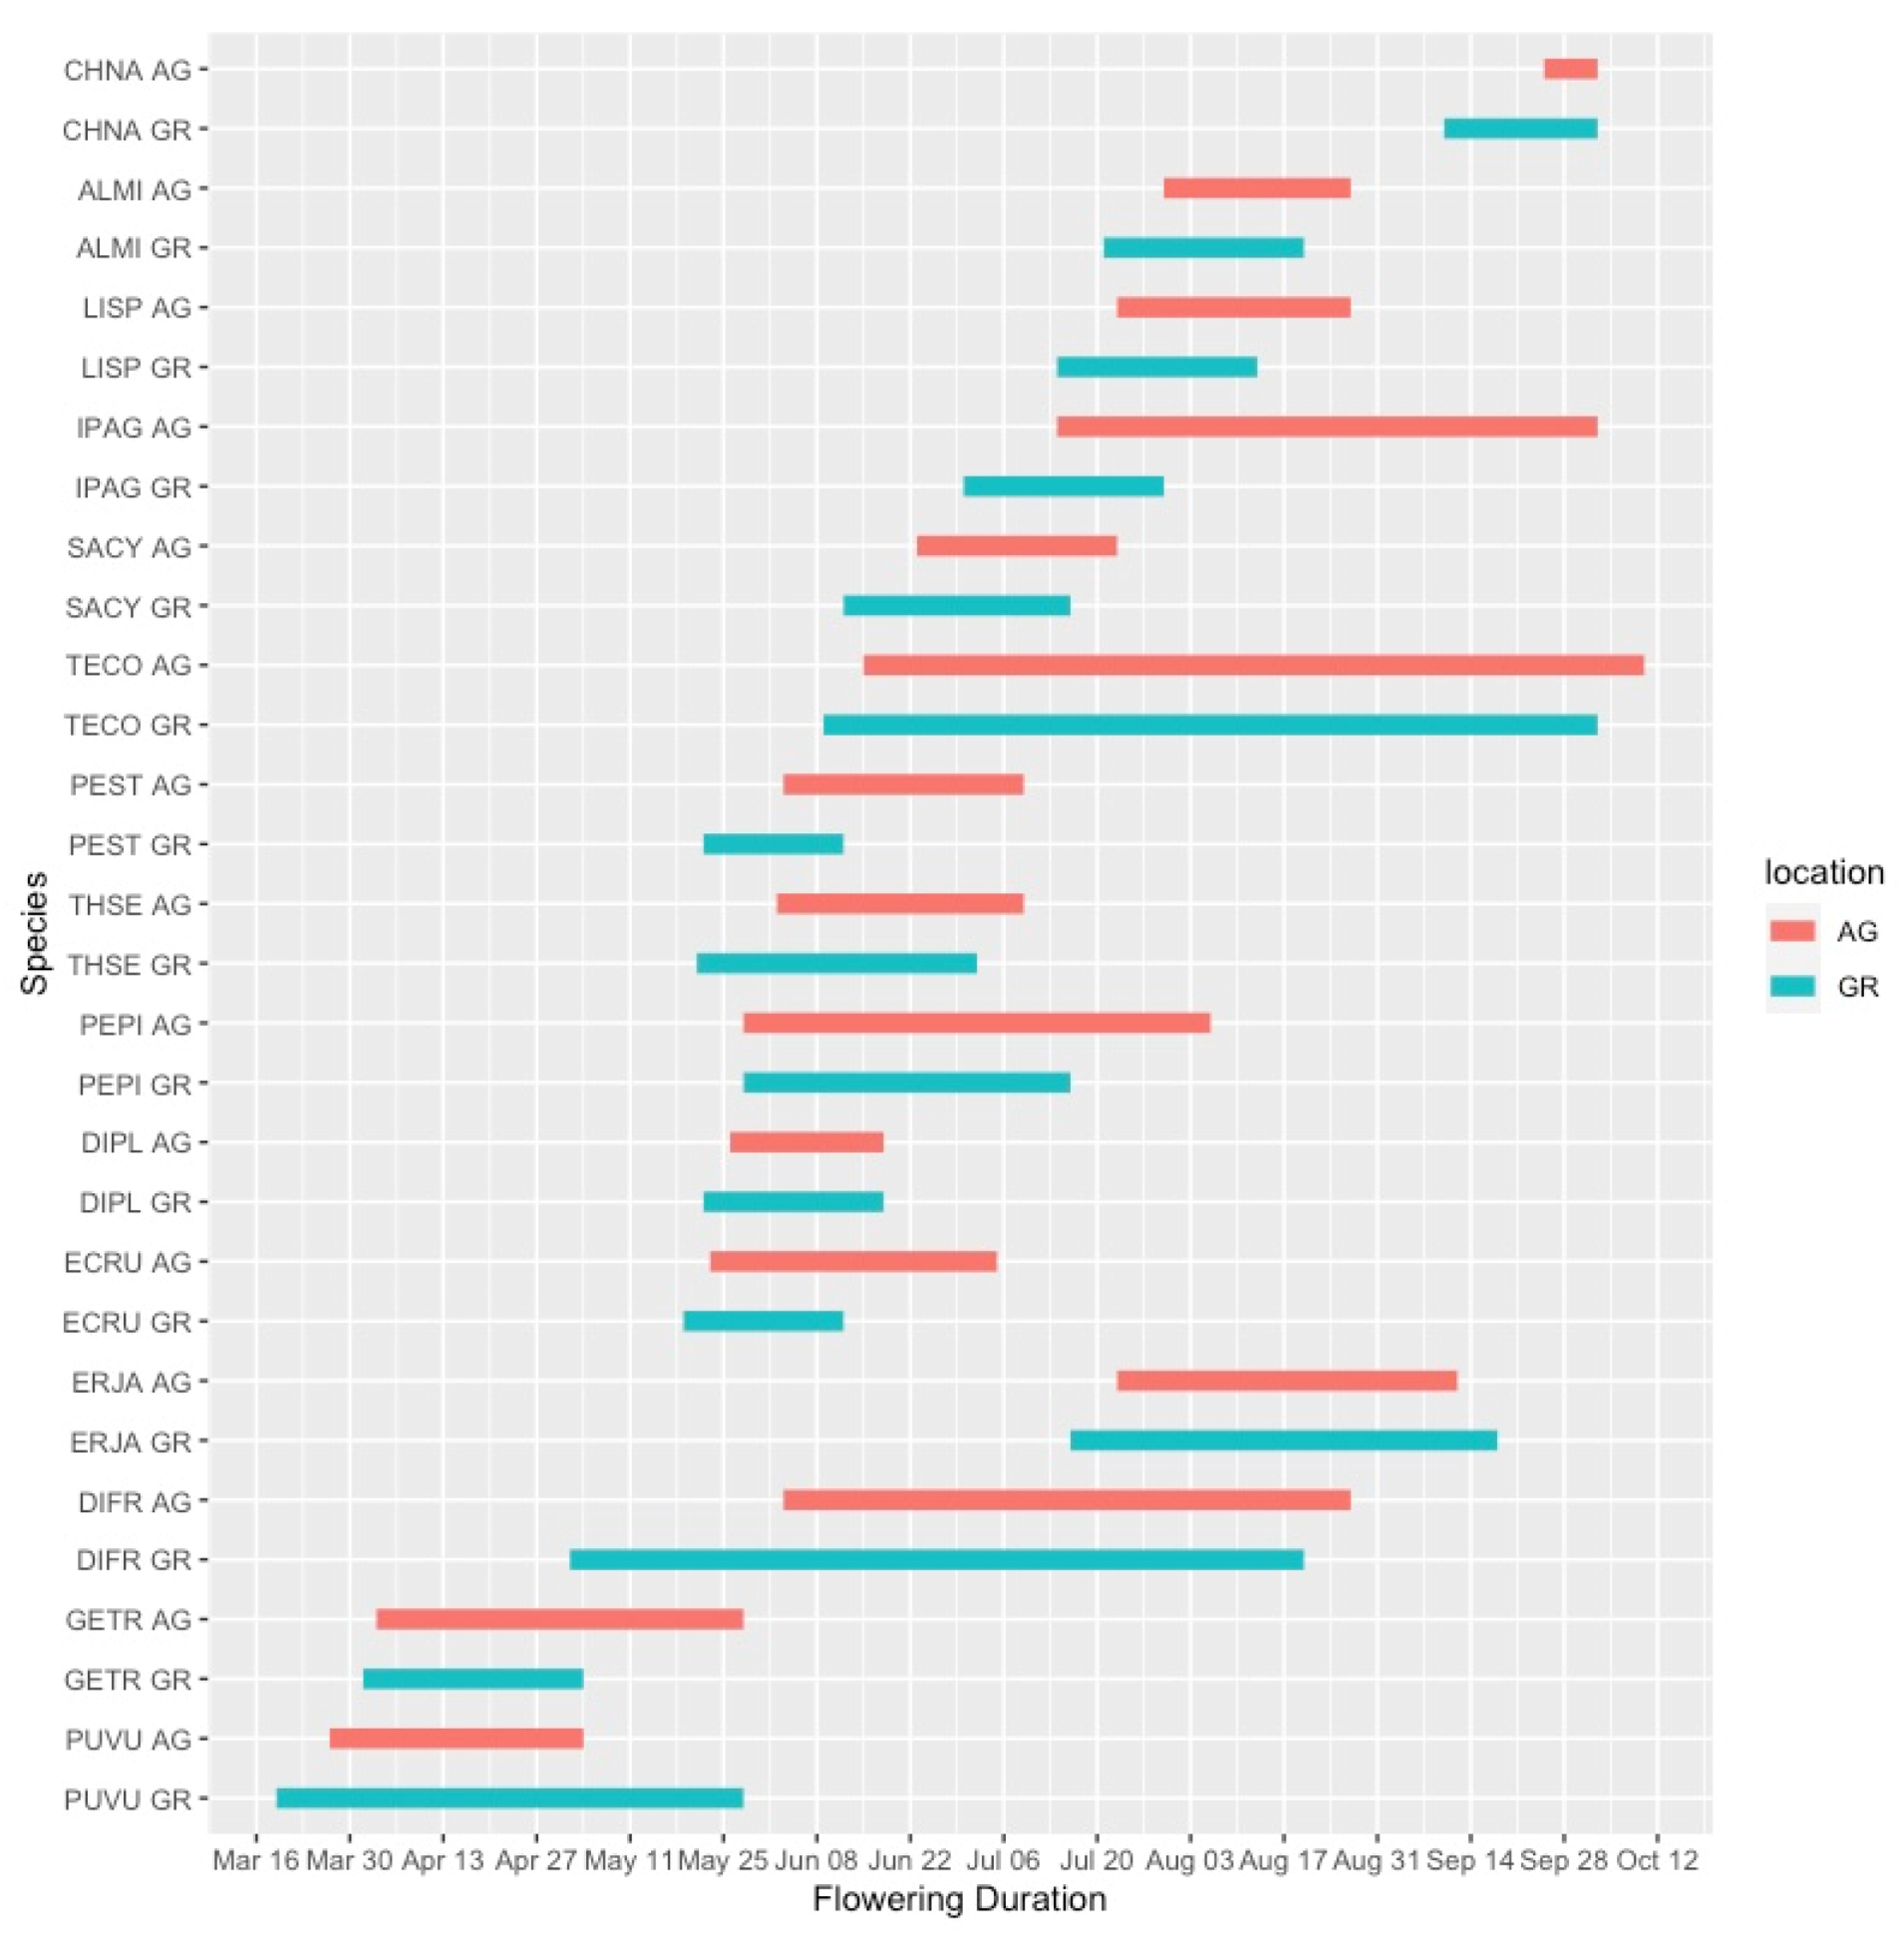
Flowering duration was more variable than the initiation date of flowering, and plants growing in the green roof locations did not have substantially different flowering durations than those at ground level. In 2019, five out of six species flowered for a shorter duration on the green roof relative to ground-level (Figure 4). However, during the 2020 season, only 4 out of 15 species flowered for a longer duration at ground level compared to the green roof locations (Figure 5). One notable exception was Ipomopsis aggregata, which had a flowering duration of 22 days on the green roof location and 111 days at ground level.

Figure 4.
Flowering phenology of observed plant taxa during the 2019 growing season. AG = ground level, GR = green roof.
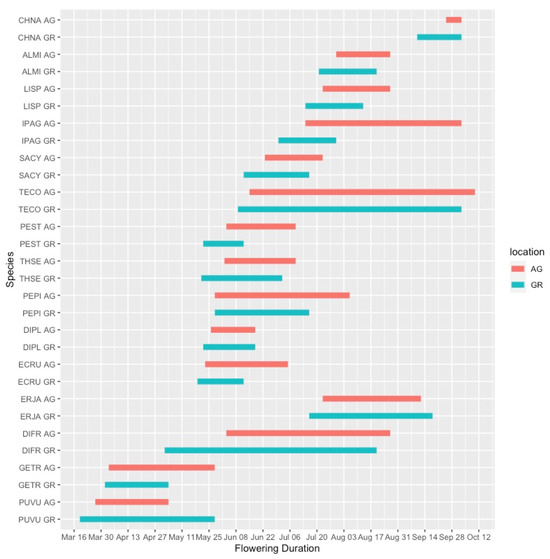
Figure 5.
Flowering phenology of observed plant taxa during the 2020 growing season. AG = ground level, GR = green roof.
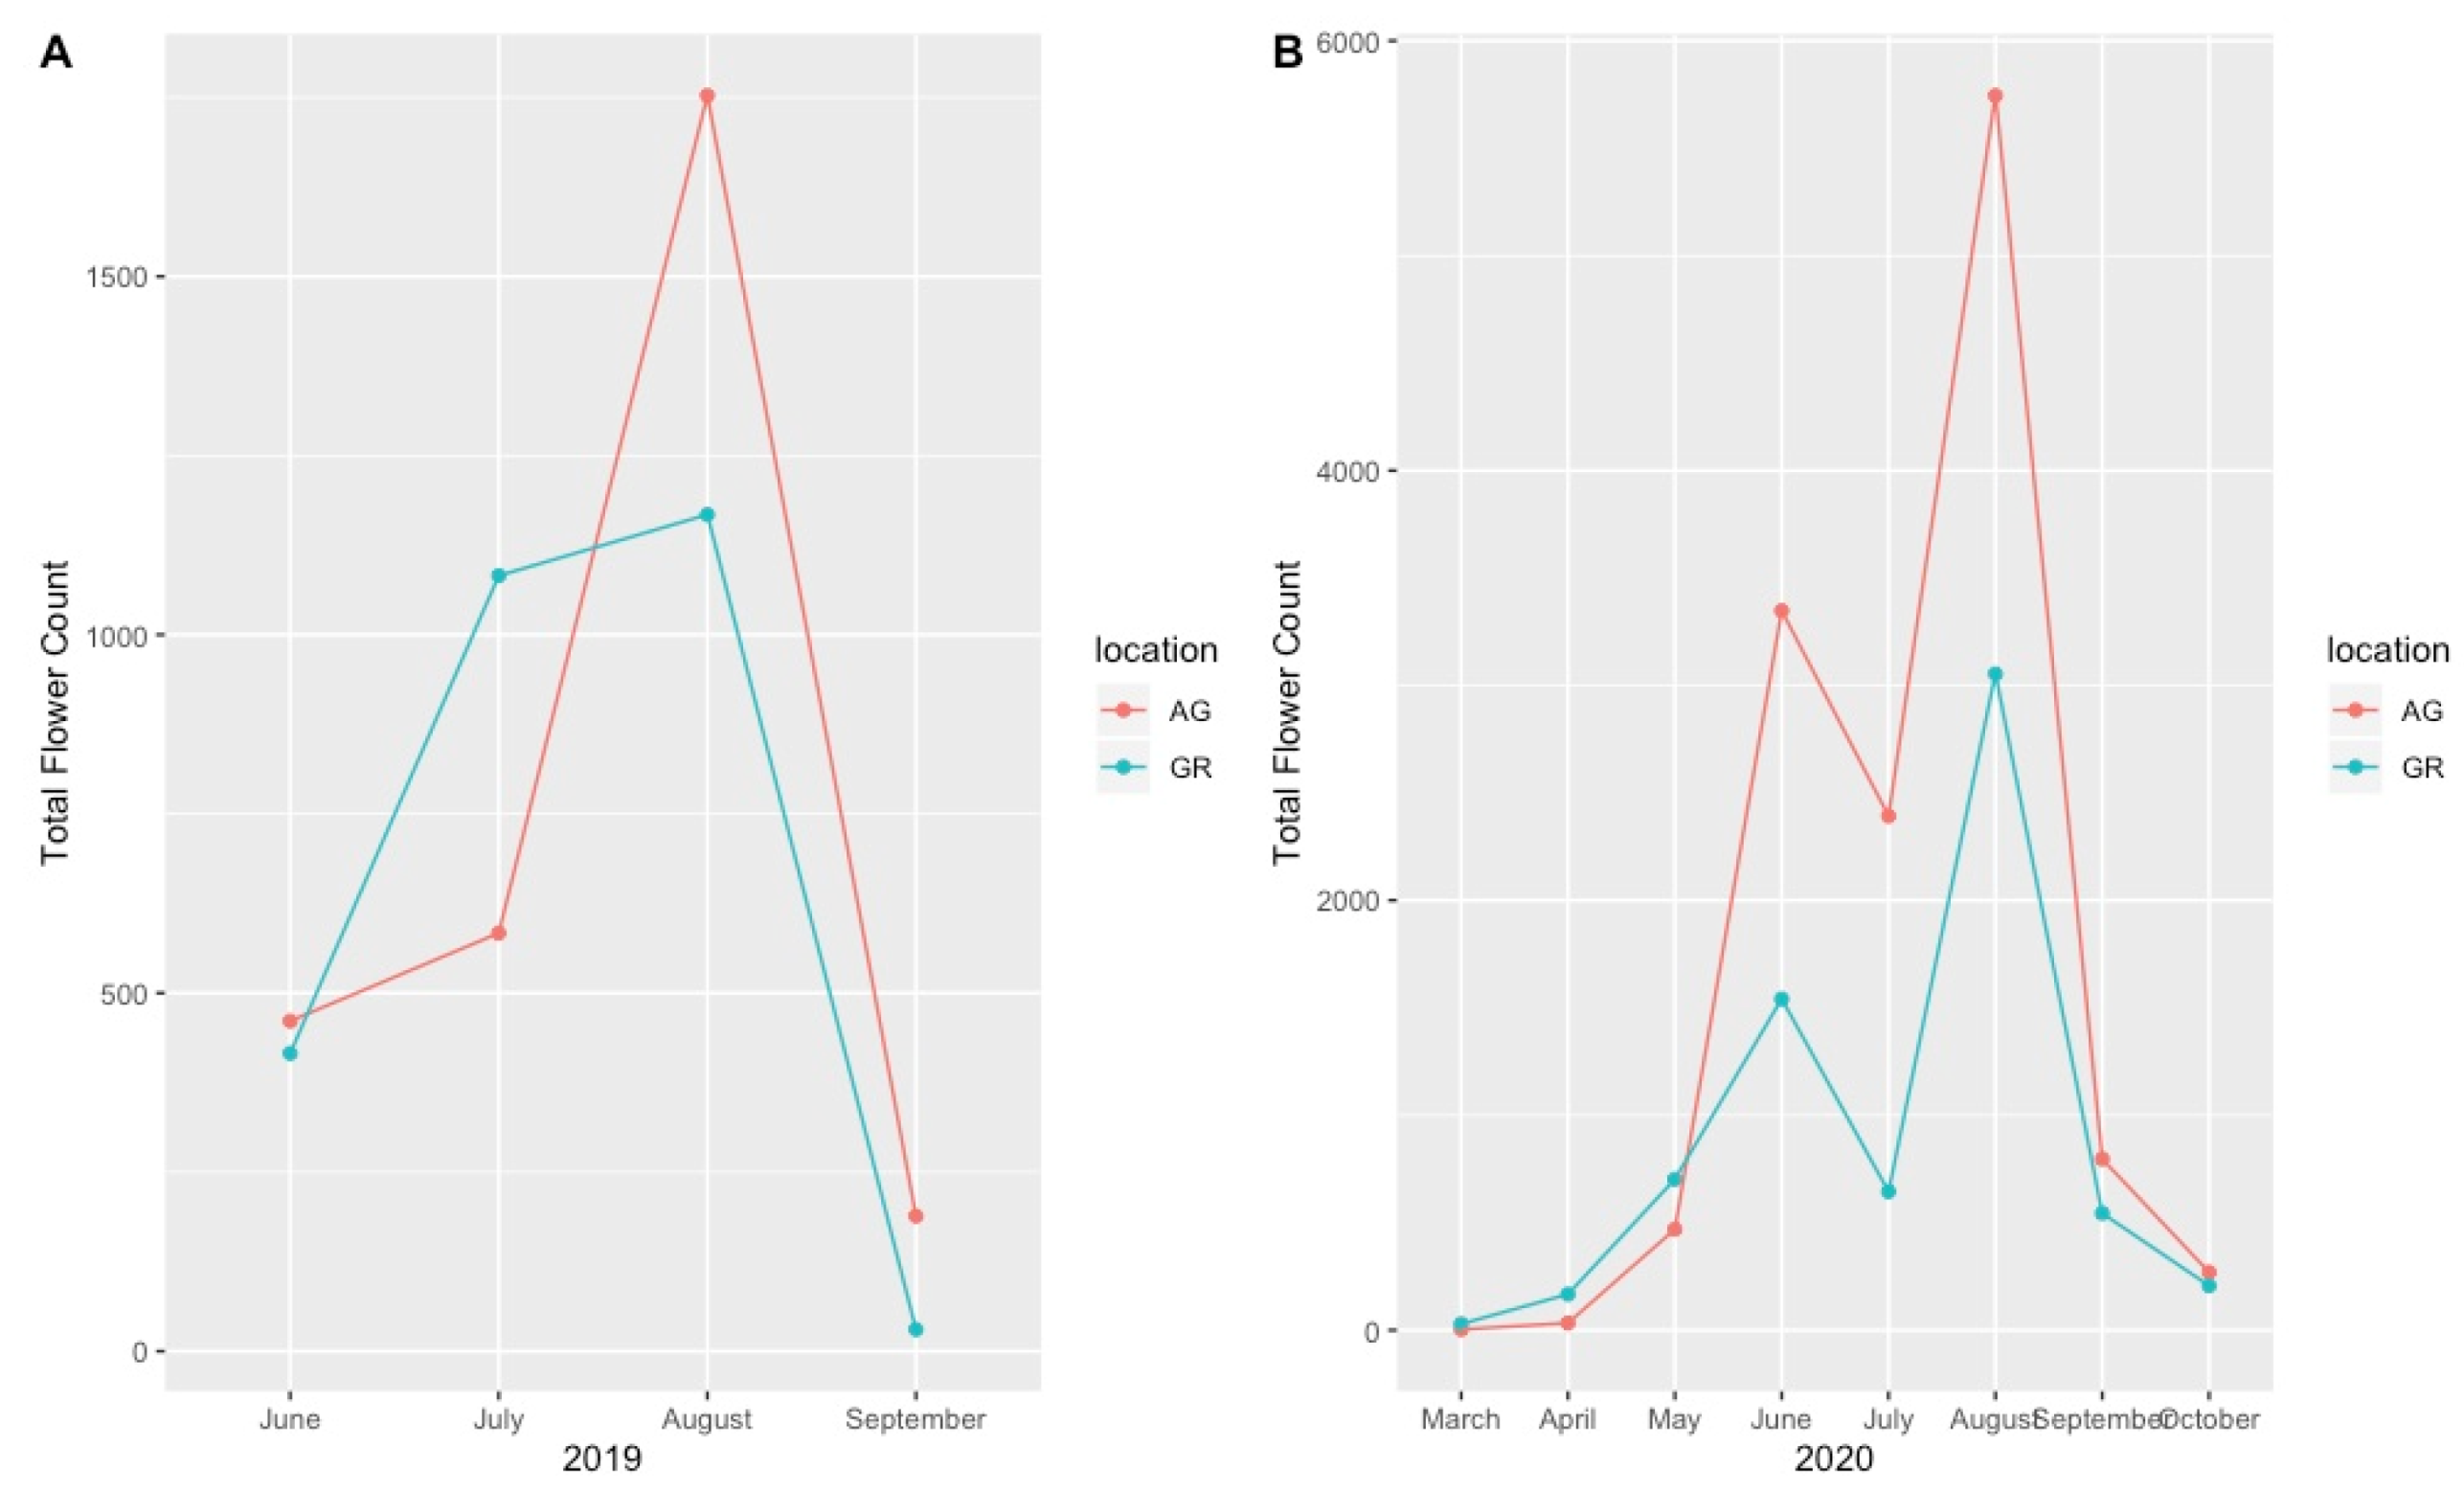
Although we recorded the number of flowers for all observed plant taxa, these data were highly variable and did not demonstrate a clear pattern at the species level. However, when considering total flower production across the growing season, the plants on the green roofs produced more flowers early in the season (March, April, May) compared to those at ground level during both the 2019 and 2020 growing season, even when flower count was normalized by plant size (Figure 6A,B). During the mid to late growing season (June–September), however, the plants at ground level produced more flowers than the plants on the green roofs, although this pattern was highly species-specific.
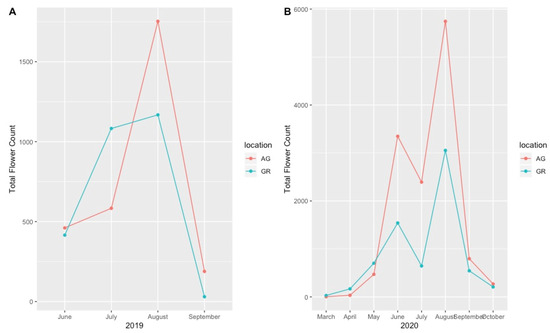
Figure 6.
Total number of observed flowers (normalized by plant size) during the 2019 (A) and 2020 (B) growing seasons on the green roofs compared to ground level. AG = ground level, GR = green roof.
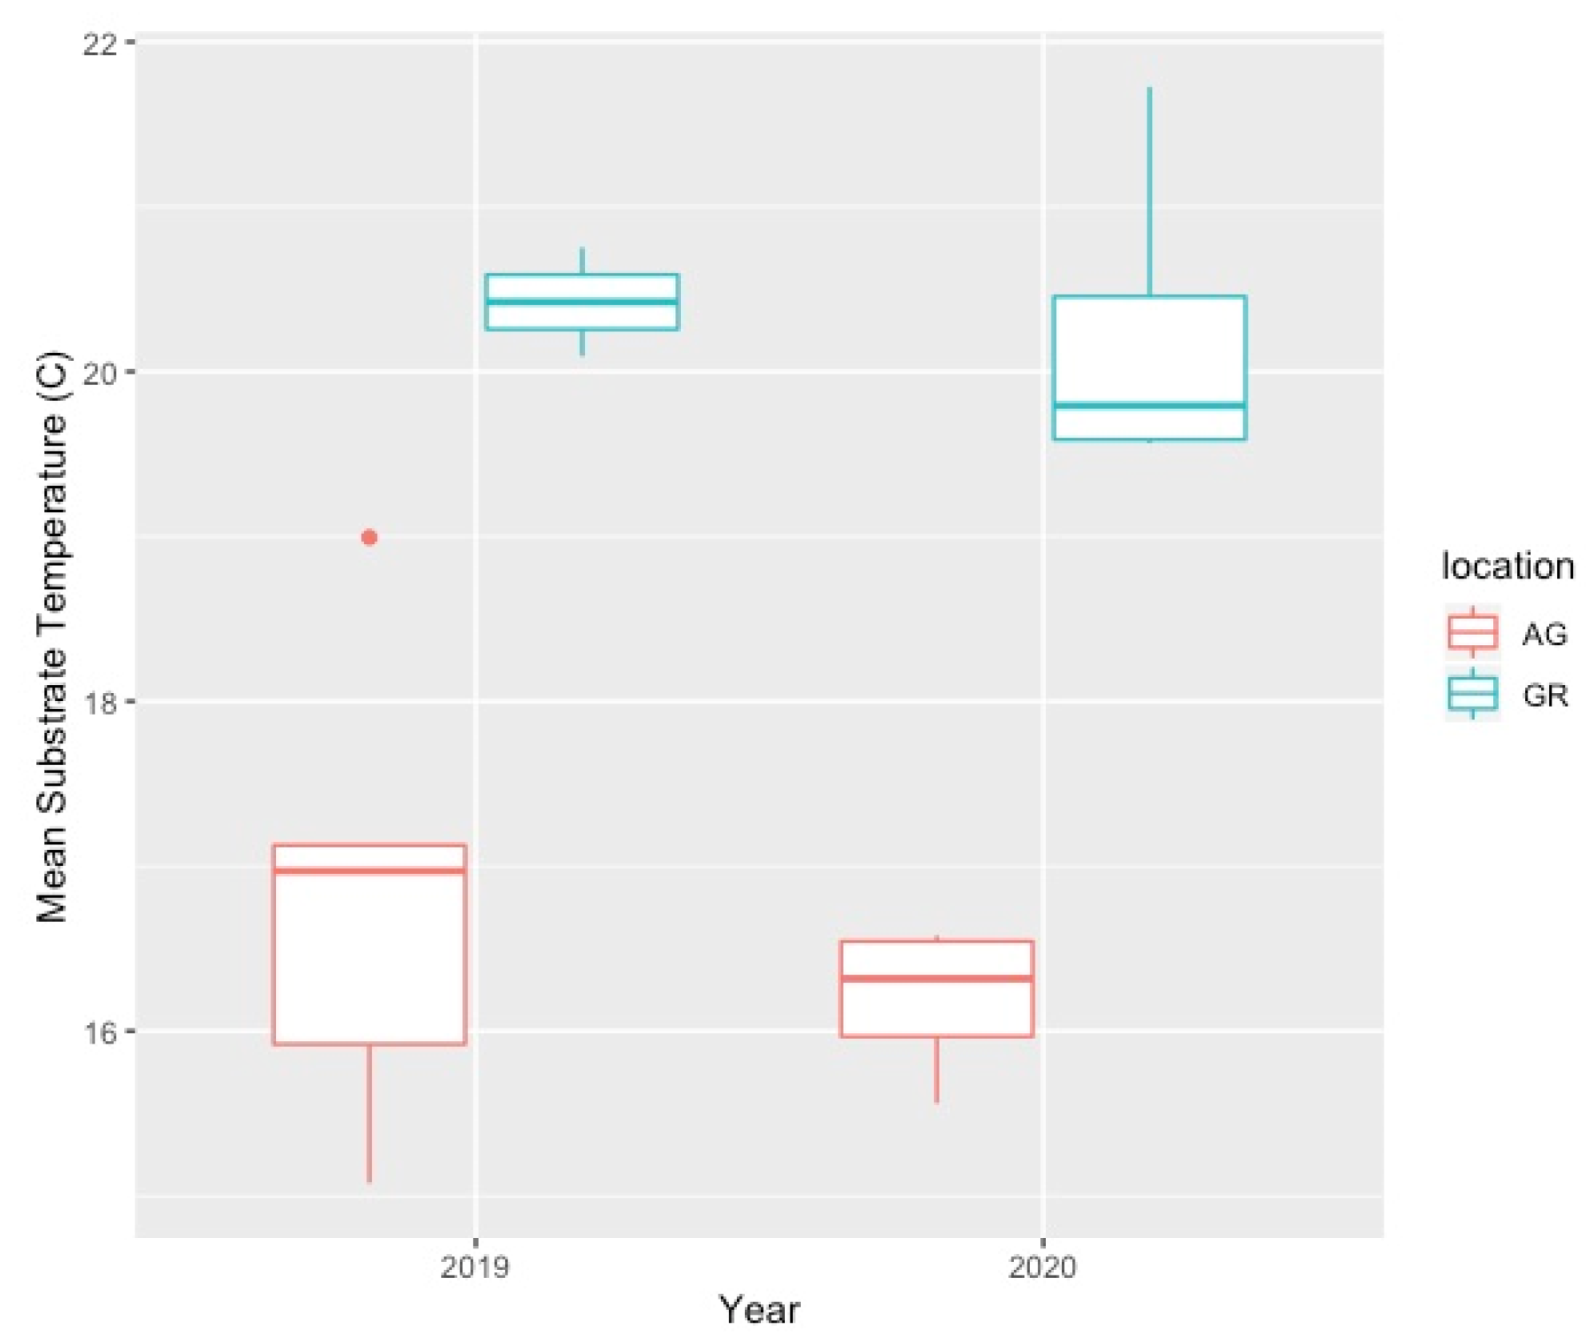
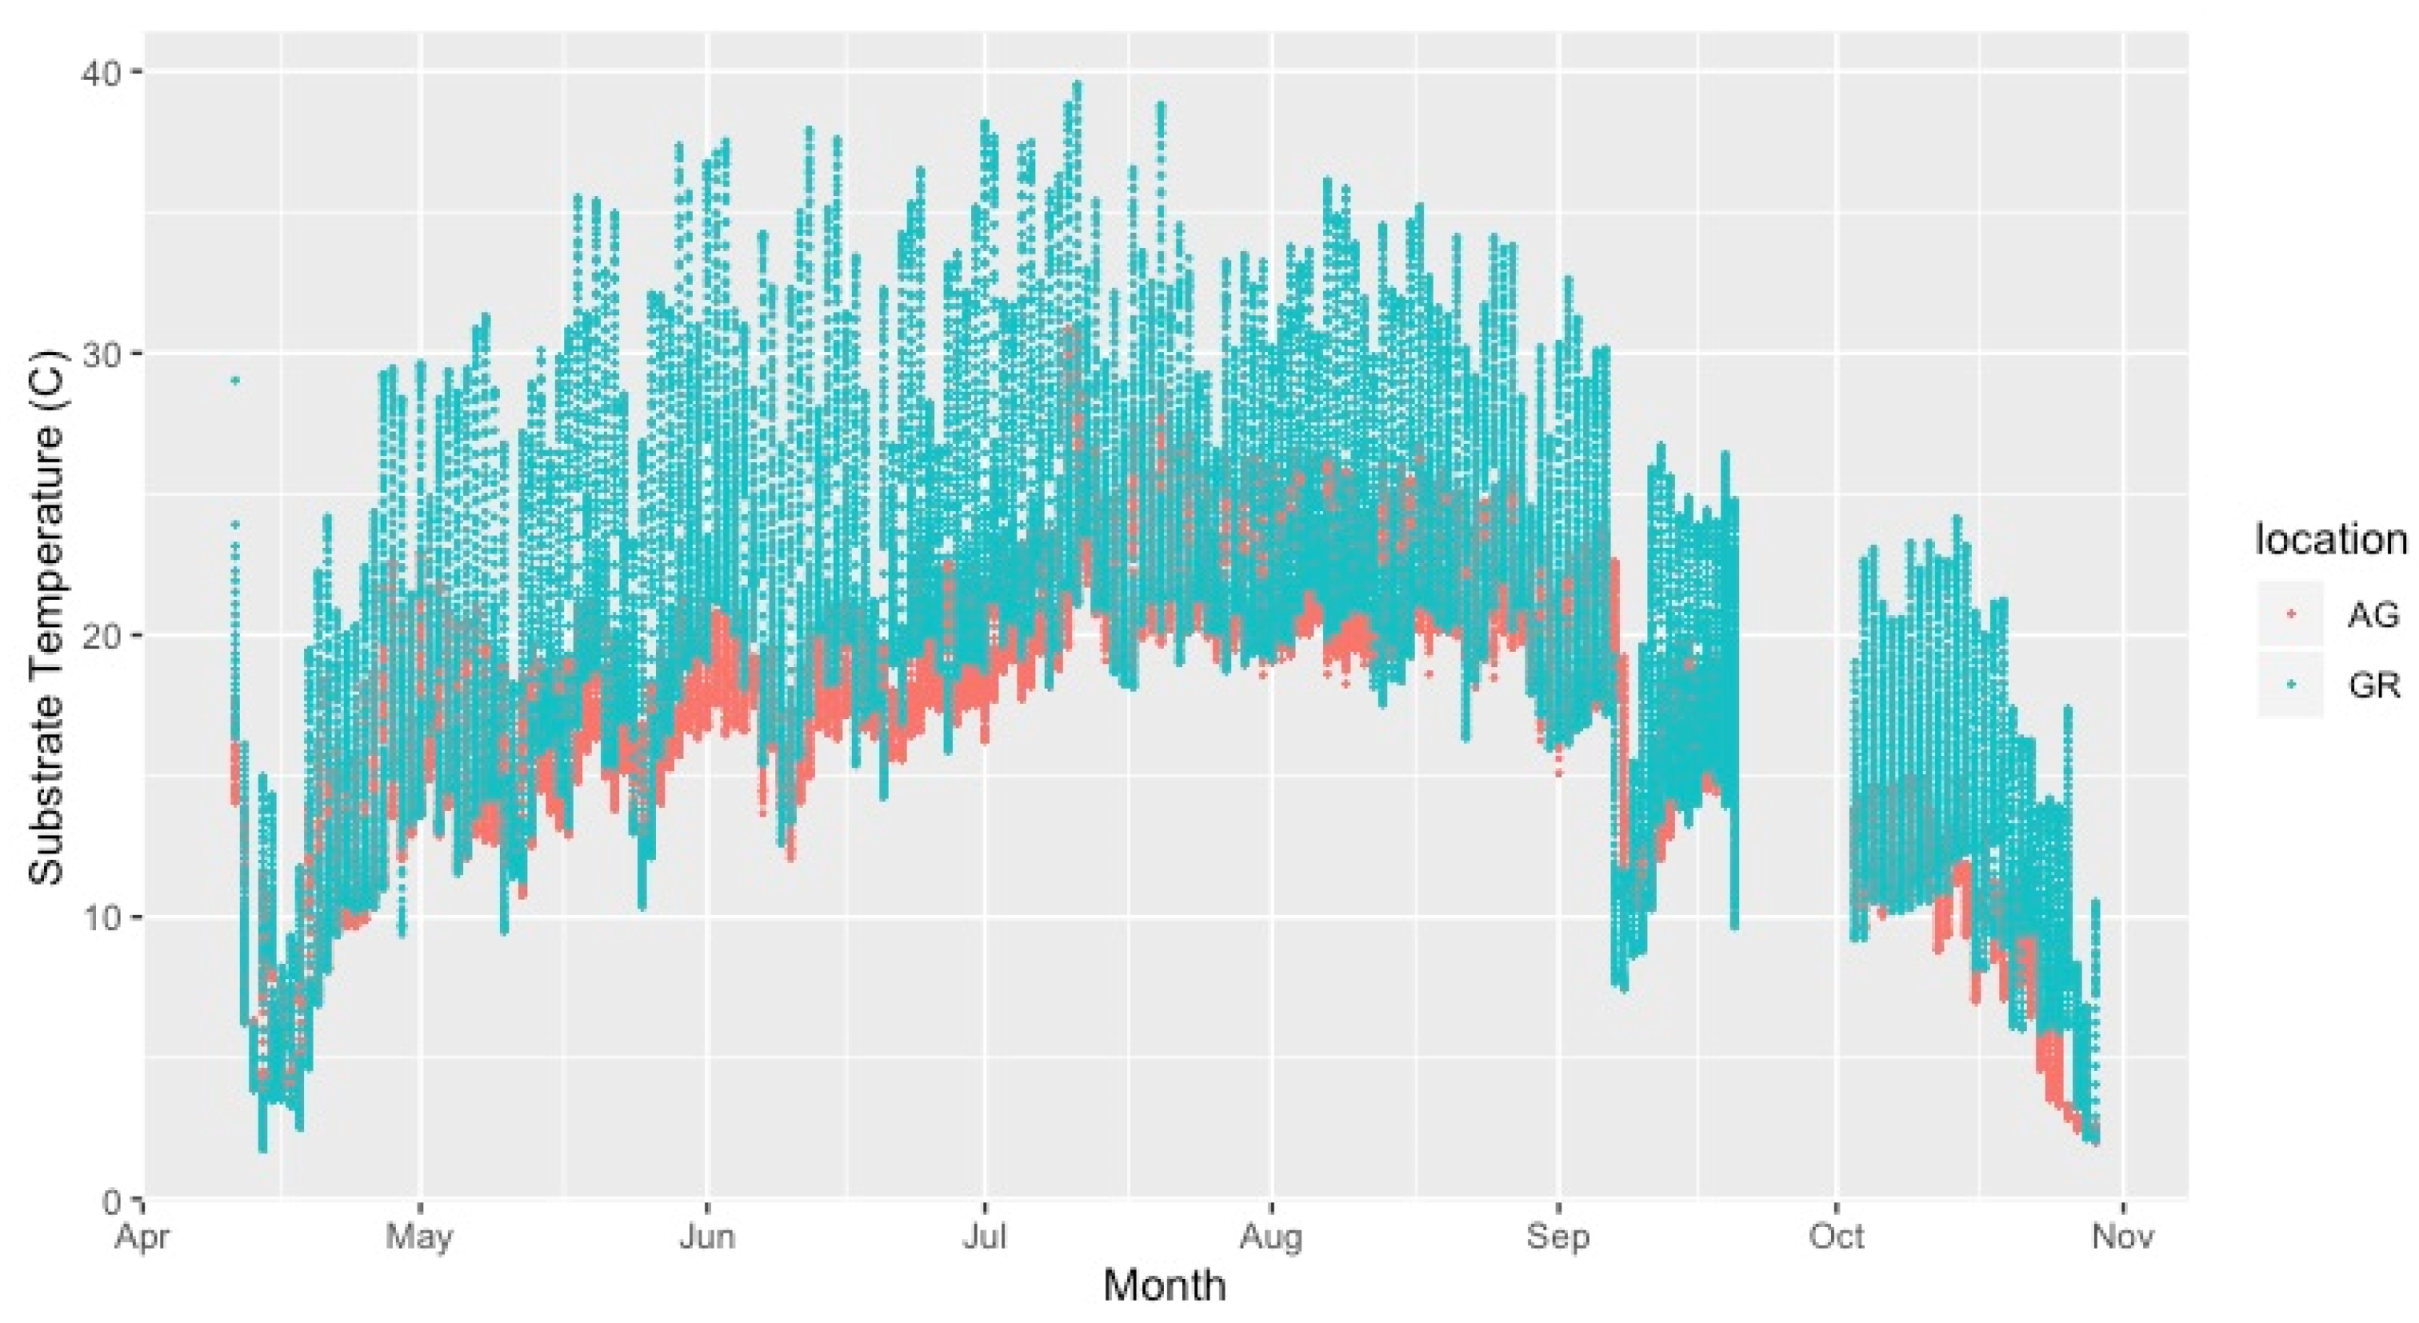
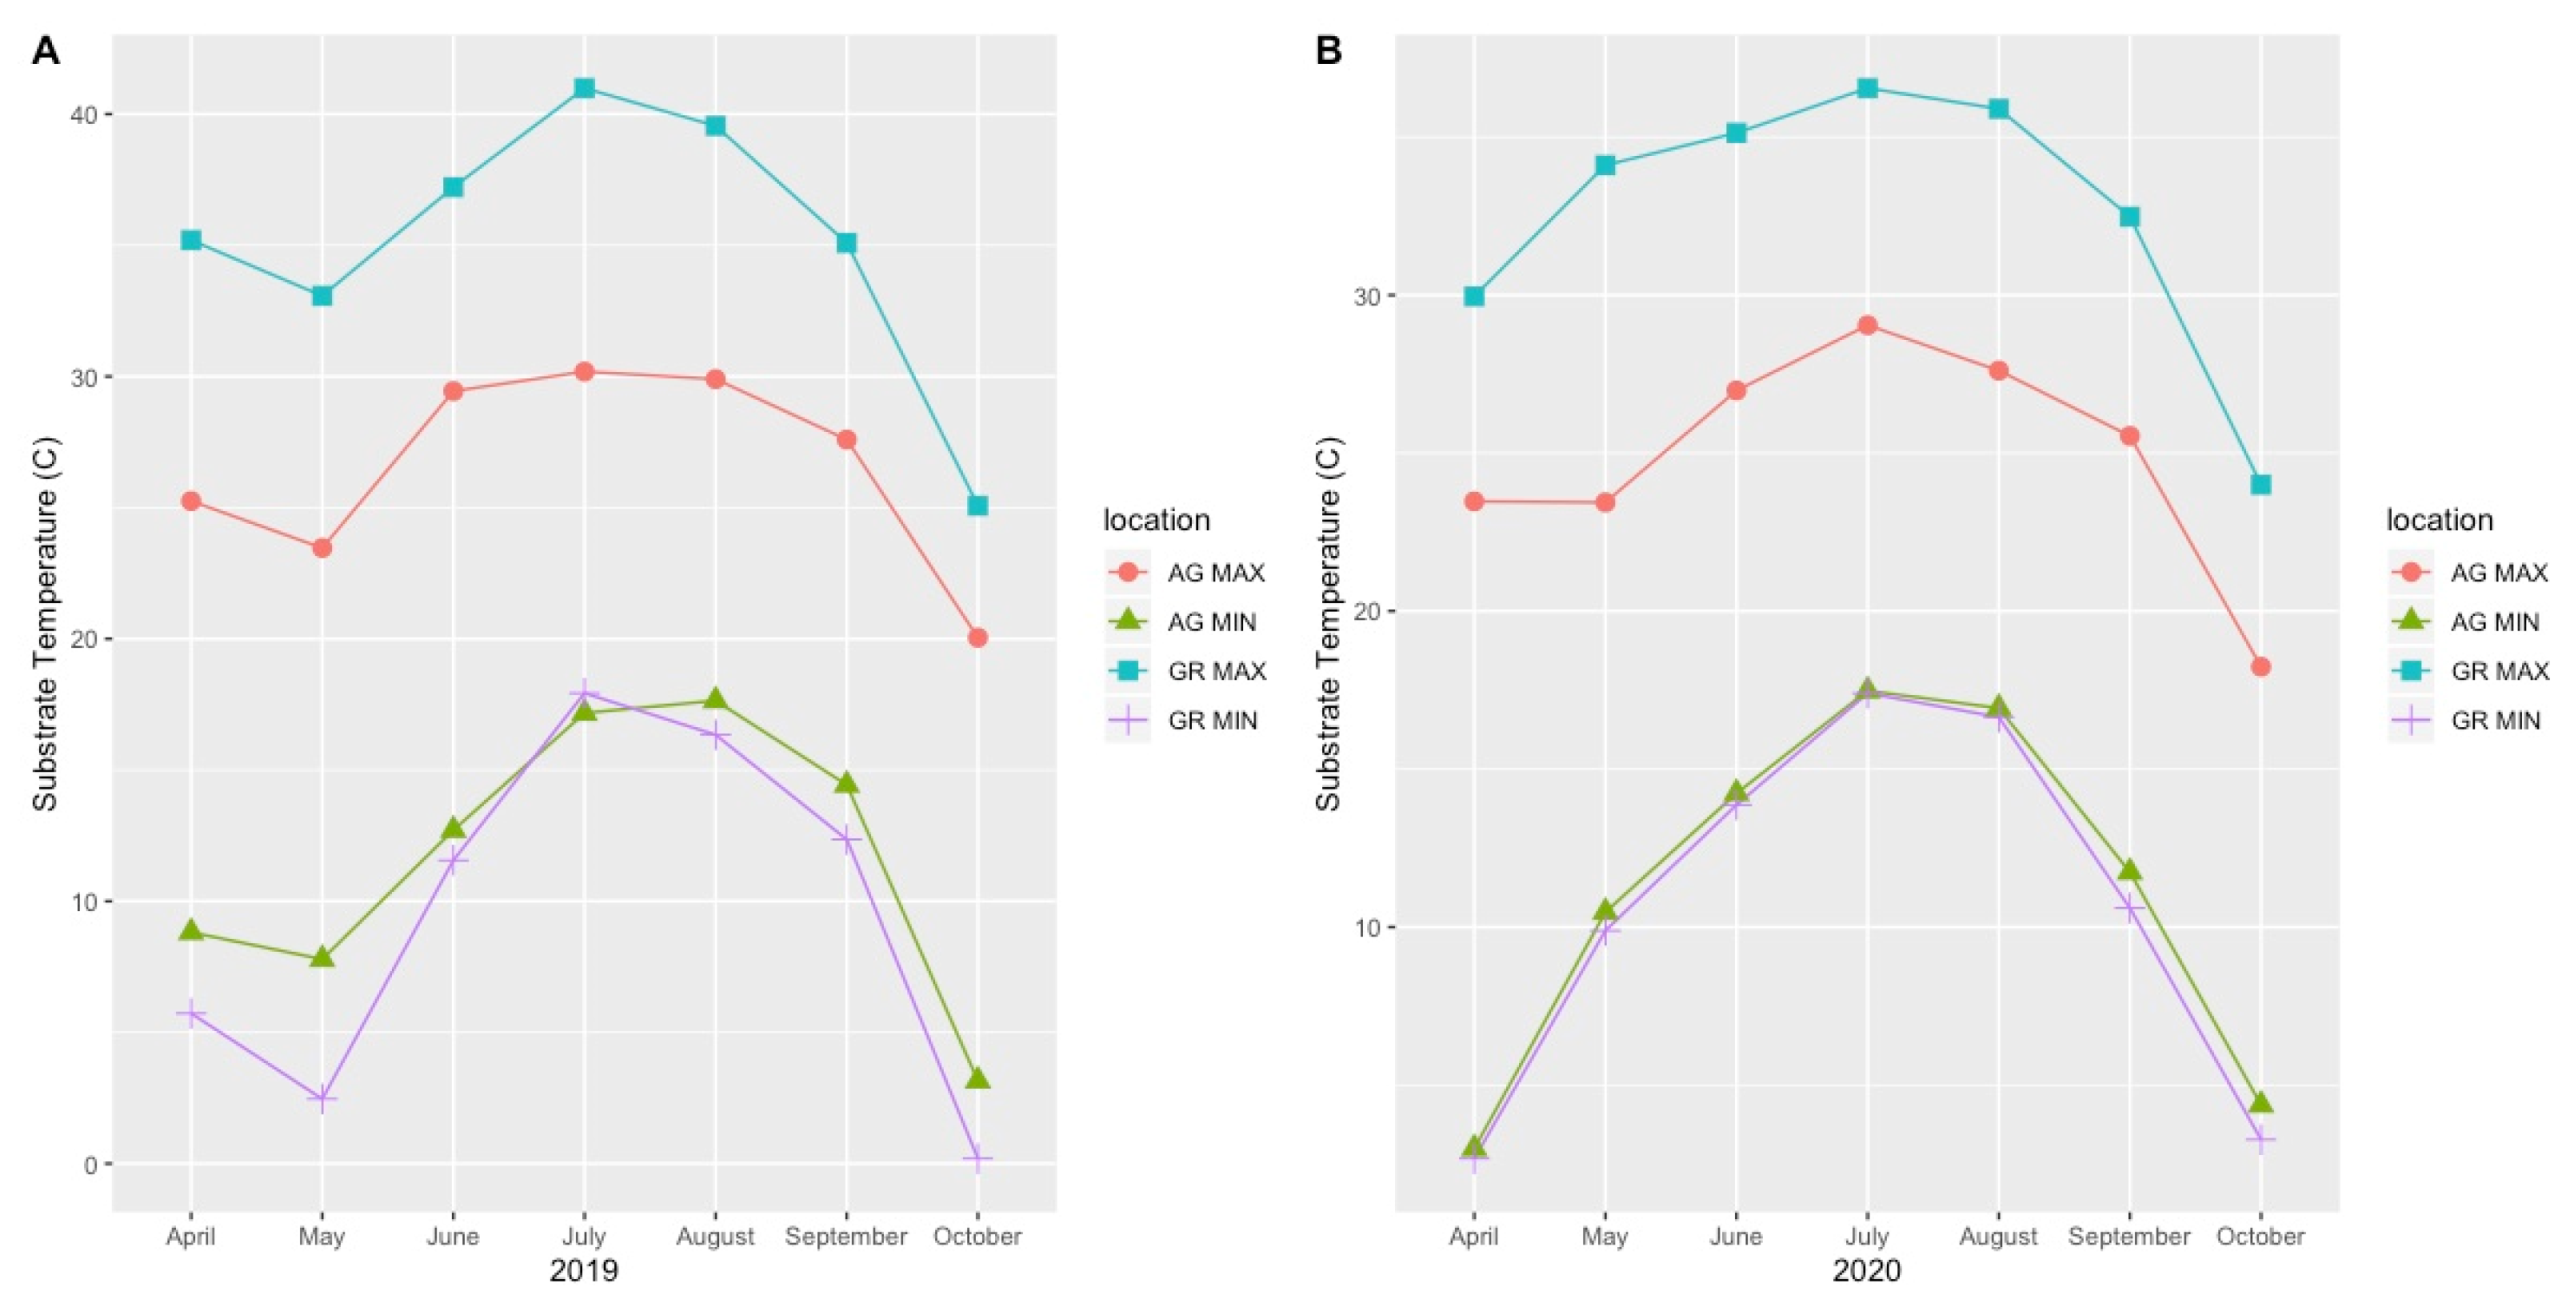
Mean substrate temperatures were substantially higher on the green roofs (M = 20.28 °C, SD = 0.46) than at ground level (M = 16.54 °C, SD = 1.47) in both 2019 and 2020 (Figure 7, Table 4). The maximum substrate temperature in 2019 and 2020 on the green roofs was 40.9 °C and 36.9 °C, respectively, compared to 30.3 °C and 27.4 °C at ground level. Additionally, the diurnal temperature amplitude of the green roof substrates was greater than at ground level. Throughout each growing season, the green roof substrate routinely experienced larger temperature oscillations (i.e., temperature amplitude) compared to ground level (Figure 8 and Figure 9). In 2019, the mean temperature amplitude was 14.9 °C (SD = 2.0 °C) at ground level and 25.7 °C (SD = 3.2 °C) on the green roofs, while during the 2020 growing season, the mean temperature amplitude was 13.7 °C (SD = 3.19 °C) at ground level compared to 22.0 °C (SD = 2.9 °C) on the green roofs and the difference in substrate temperature amplitudes was greatest early in the growing season, specifically April and May, except in April 2020 (Figure 9). Temperature data during March are incomplete because of data logger failure (presumably due to temperature stress on the battery units); however, the incomplete data show temperature amplitude values similar to those obtained in April and May. Greater temperature amplitude on the green roofs was due to maximum temperatures, which routinely exceeded ground-level temperatures, rather than lower minimum temperatures, which were comparable to ground-level minimum temperatures (Figure 10). Detailed monthy data for data loggers can be found in Tables S1 and S2 in the Supplementary Materials.

Figure 7.
Comparison of green roof and ground-level mean substrate temperature (°C) during the growing season (Apr–Oct). AG = ground level, GR = green roof.
Table 4.
Summary of substrate monthly mean temperature (°C), annual mean temperature (°C), maximum annual temperature (°C), and minimum annual temperature (°C) for the green roof and ground-level plant locations during the growing season (Apr–Oct) in 2019 and 2020.

Figure 8.
Substrate temperature on the intensive green roof compared to ground level during the 2020 growing season. AG = ground level, GR = green roof.
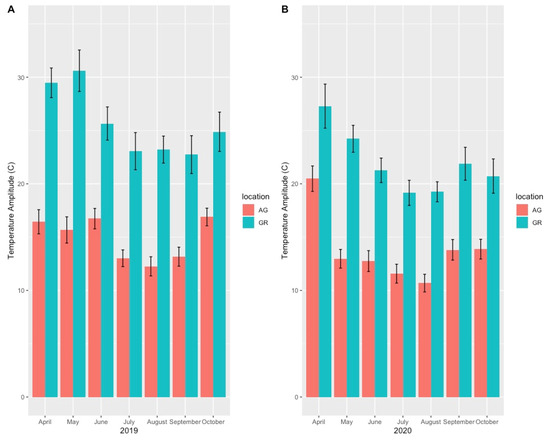
Figure 9.
Monthly mean substrate temperature amplitude (high–low daily temperatures) on the green roofs compared to ground-level sites during the 2019 (A) and 2020 (B) growing seasons. AG = ground level, GR = green roof.
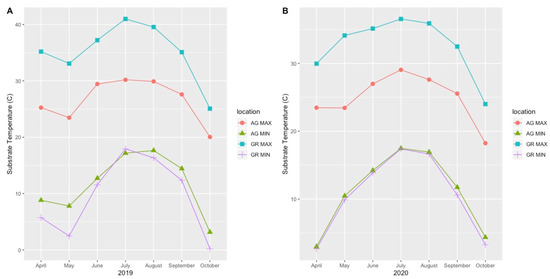
Figure 10.
Monthly maximum and minimum substrate temperatures during the 2019 (A) and 2020 (B) growing seasons. AG = ground level, GR = green roof.
3.2. Pollinator Visitation
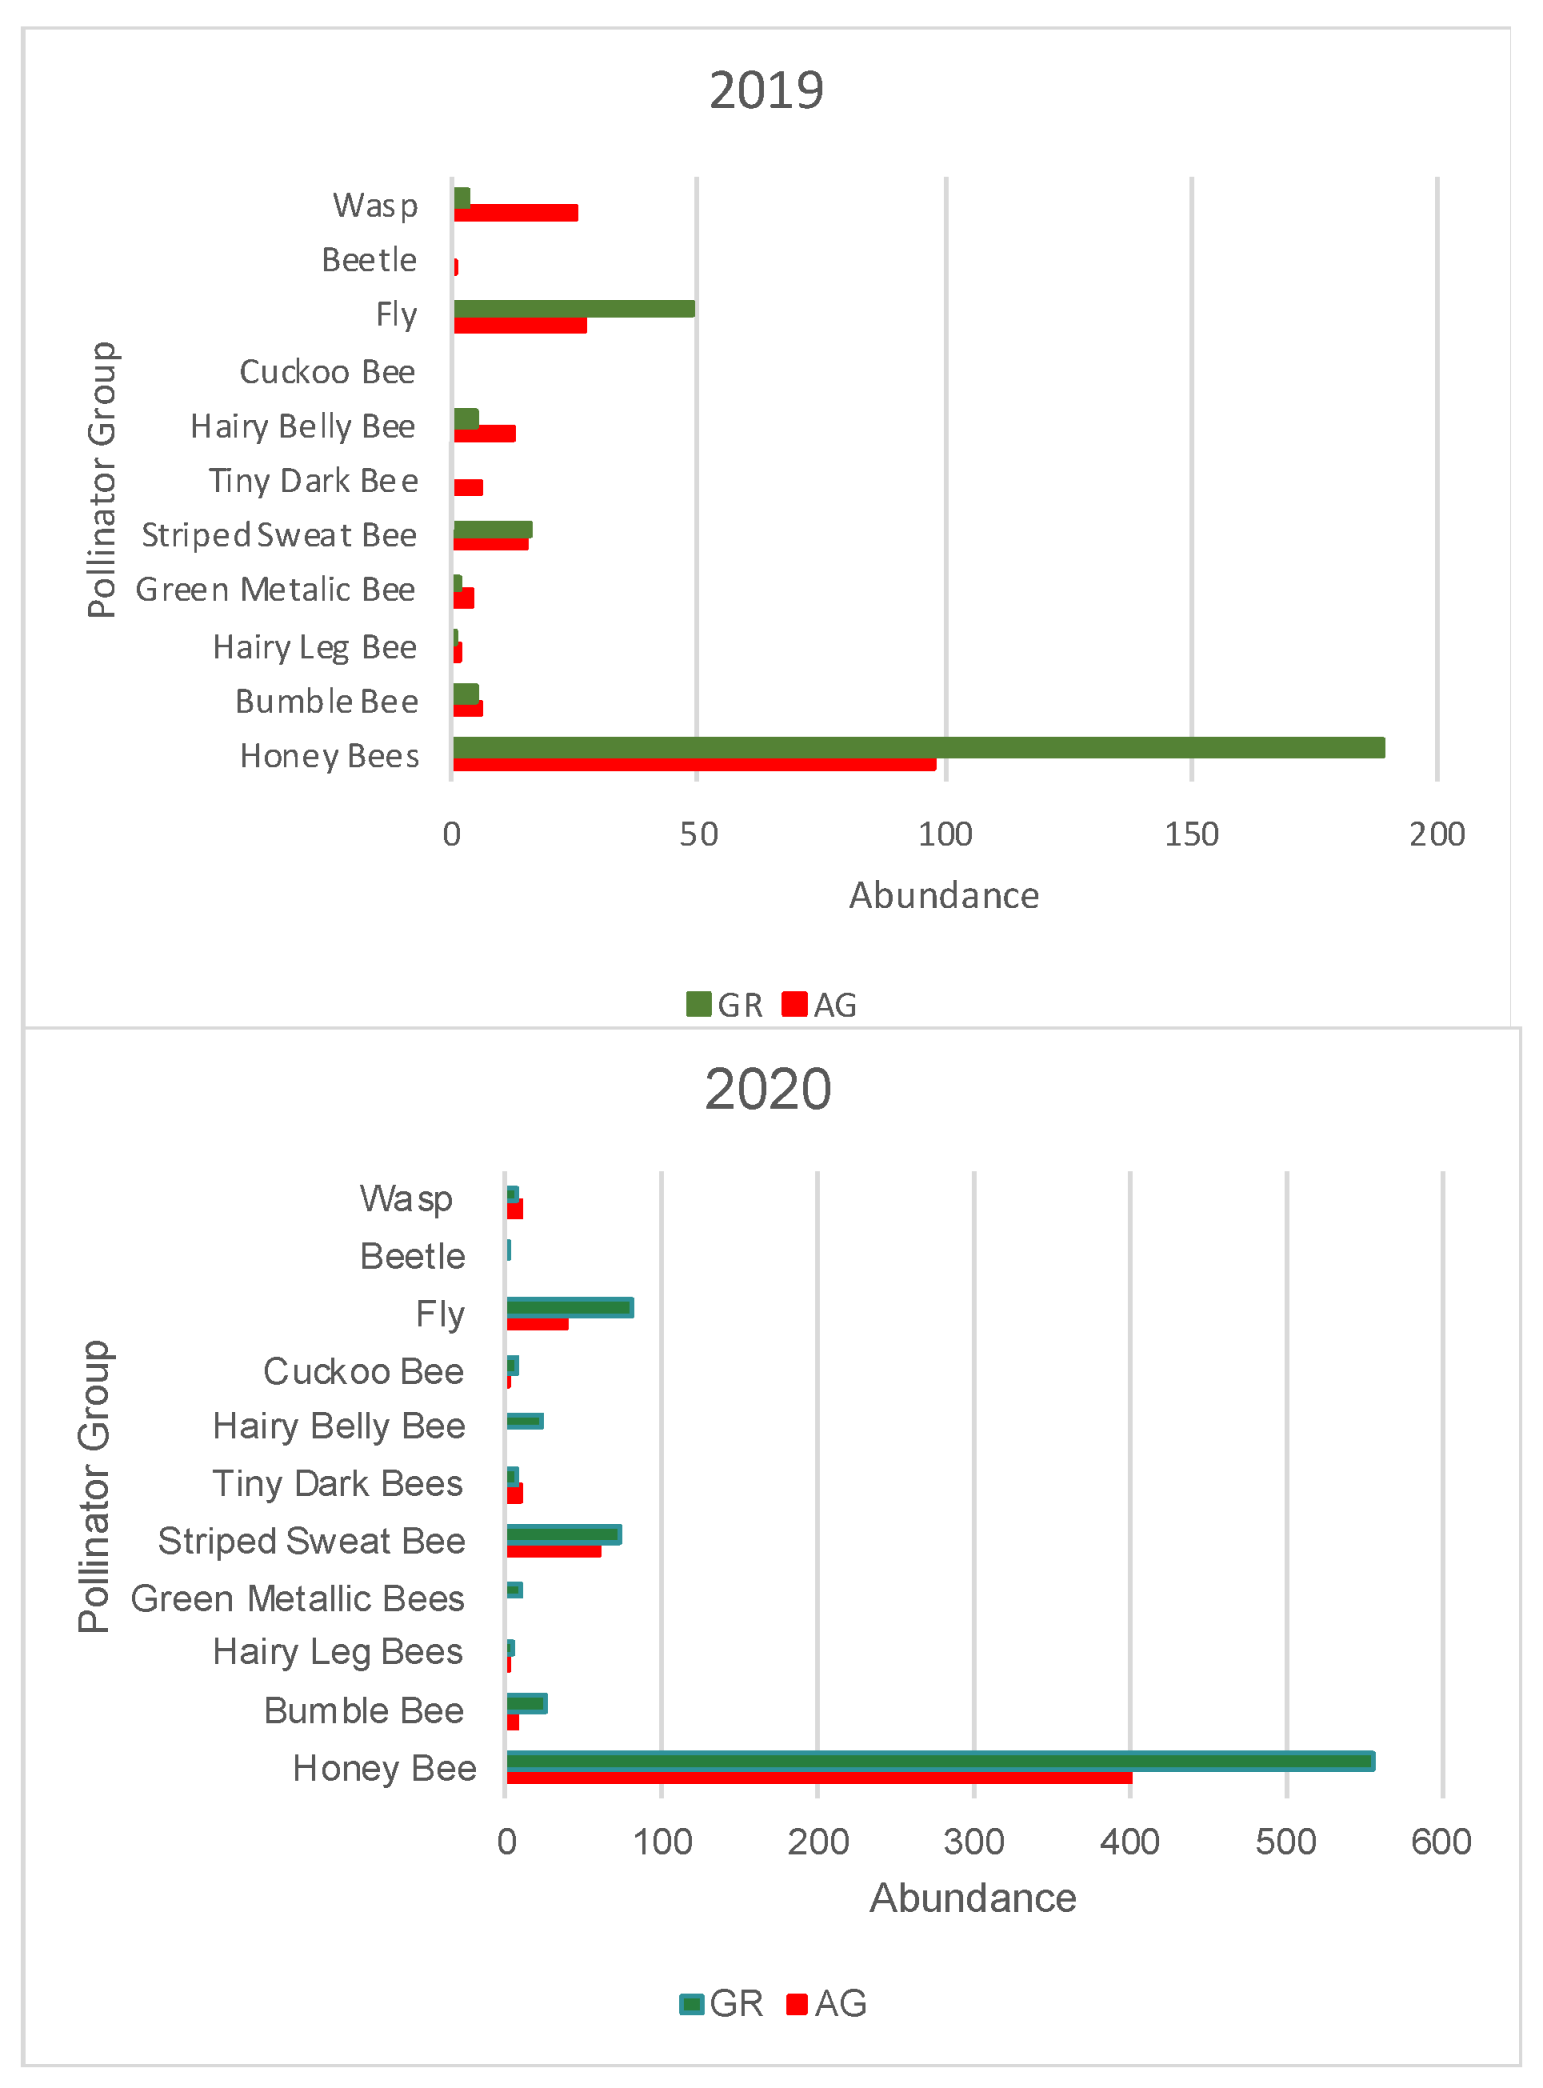
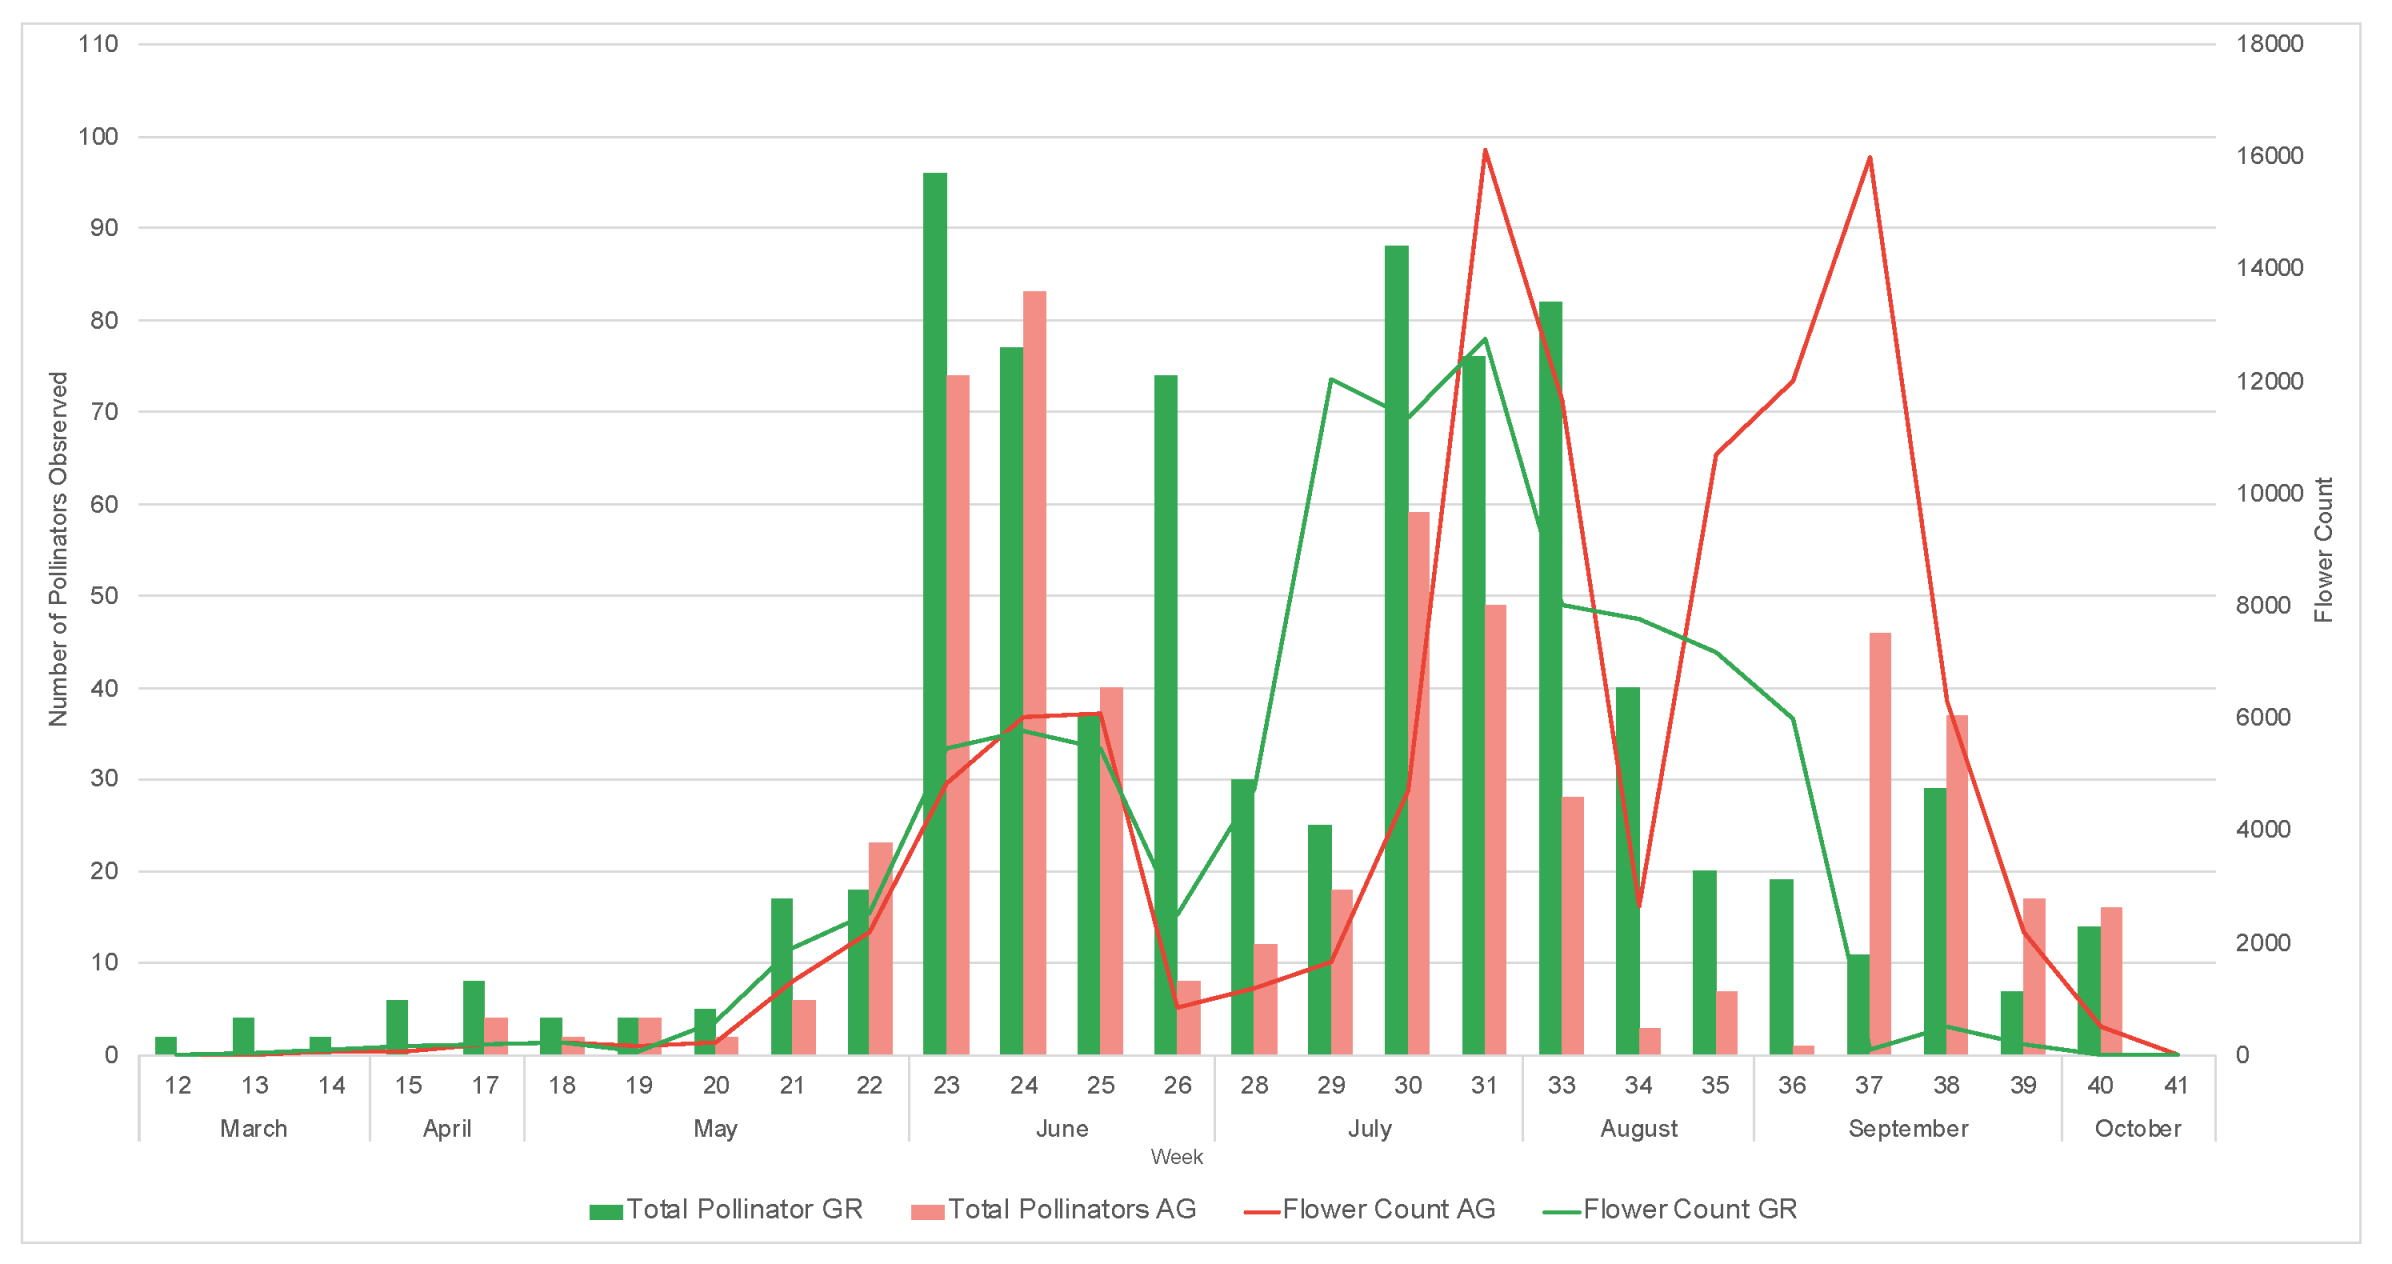
During the study, we observed a total of 1795 pollinators, among which 1550 were bees. During both 2019 and 2020, a greater number of pollinators was observed on the green roofs compared to ground level (2019: GR = 270, AG = 197, 2020: GR = 795, AG = 533) (Table 5 and Table 6). All bee morpho species groups outlined in Mason et al. (2018) [34] along with other pollinator groups included in the study (Diptera, Coleopter, and Vespidae) were represented on the green roofs. Honeybees (Apis mellifera) were the most common pollinators regardless of location, comprising 61% and 74% of all observations in 2019 and 2020, respectively. The next most abundant pollinator groups for all locations were flies and striped sweat bees (Figure 11). The relative abundance of pollinator groups was similar between the green roofs and ground level for both years (Figure 11). Pollinator observations during the 2019 growing season did not begin until June, however a greater number of pollinators were observed during the weeks 23–25, concurrent with earlier flowing initiation of the observed plant taxa (Figure 12). Likewise, during the 2020 growing season, which encompassed a full range of observations from March–October, no pollinators were observed at ground level during weeks 12–14, corresponding to a time period during which there were no floral resources among the observed plant taxa at ground level (Figure 13).
Table 5.
The aggregated in situ observations following the protocol developed by Mason et al. (2018) [34] the green roof sites (GR) and the sites at grade (AG) during the 2019 growing season. Other pollinator observations include flies (Diptera), beetles (Coleoptera), and wasps (family Vespidae).
Table 6.
The aggregated in situ observations following the protocol developed by Mason et al. (2018) [34] the green roof sites (GR) and the sites at grade (AG) during the 2020 growing season. Other pollinator observations include flies (Diptera), beetles (Coleoptera), and wasps (family Vespidae).
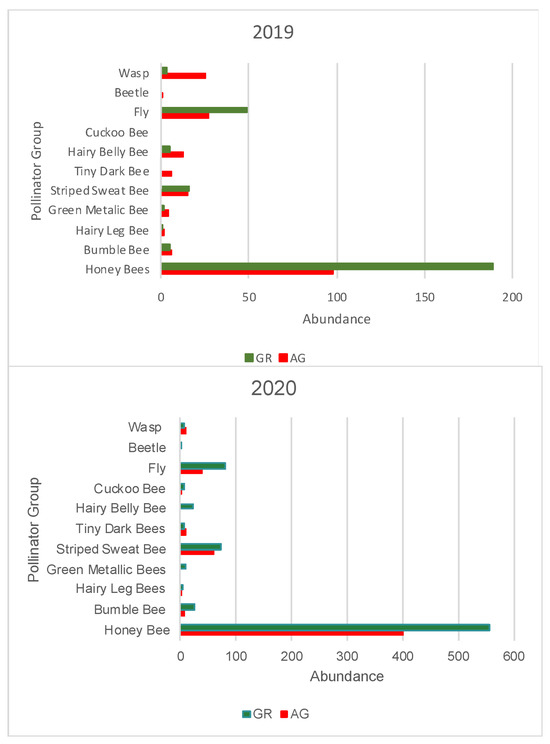
Figure 11.
Total abundance of pollinator groups recorded in 2019 (top) and 2020 (bottom) at each location (GR or AG). AG = ground level, GR = green roof.
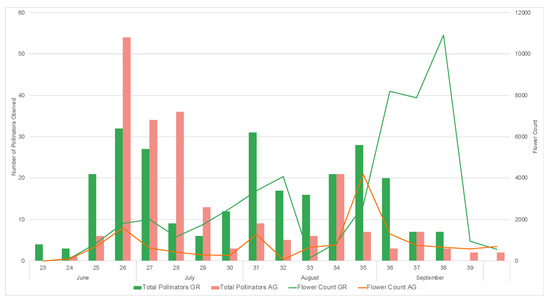
Figure 12.
Weekly pollinator visitation and flower counts for study plants on the green roof (GR) and ground level (AG) during the 2019 growing season.

Figure 13.
Weekly pollinator visitation and flower counts for study plants on the green roof (GR) and ground level (AG) during the 2020 growing season.
4. Discussion
4.1. Green Roof Phenology
Overall, the phenology of nearly every species was advanced on the green roofs compared to their ground-level counterparts. The duration of flowering was variable, and no clear pattern could be discerned from the data between plants grown on the green roofs compared to those at grade. Some of the variability was likely due to the observational nature of the study, which could not precisely control every aspect of the plant growing conditions. Importantly, work in the same climate using a similar suite of plants demonstrated that flowering phenology was advanced relative to green roof counterparts in an experimental system [36]. This work represents the first experimental evidence that green roof plant phenology is accelerated compared to ground level and, notably, found that peak flowering times were also accelerated on the green roof plots compared to those at ground level. Ruszkowski [37], however, found no evidence that phenological patterns on green roofs were associated with differential pollinator visitation timing. This may be because the main observation window for pollinators and plants occurred between June and early September, which excluded shoulder seasons, the time when notable differences in visitation rates were observed in this study.
The number of inflorescences and duration of flowering were extremely variable, likely due to species-specific characteristics. For example, stress-tolerating species [38] like Eriogonum jamesii, Penstemon pinifolius, and Teucrium cossonii exhibited relatively small temporal differences in flowering phenology compared to the other taxa that were studied. All three of these species inhabit highly moisture-limited systems on shallow, nutrient-poor substrates and therefore have less of a phenological response to altered environmental conditions, a concept supported by work in natural systems [39]. The overall phenological pattern of green roofs will almost certainly be affected by plant selection due to differential responses to environmental conditions.
4.2. Variation in Abiotic Study Conditions
The primary green roof used for this study has unusually deep substrate in most locations, often over 30 cm deep. There is negative association between temperature and substrate depth [19], meaning that extensive and semi-intensive systems would be likely to have even higher substrate temperatures and extremes than our main study roof. Indeed, the single taxon (IPAG) that was observed on the smaller extensive green roof had earlier flower initiation and a substantially shorter flowering duration compared to its counterparts at ground level (12.6 days earlier (mean = 9.4 days, see Figure 2). Additionally, over the course of the study, we noted other plant species (including Echium russicum) on the extensive roof had conspicuously early flower initiation and short flowering durations compared to those at ground level; however, they were not included in the analysis as they did not meet the study’s inclusion criteria. Given that extensive and semi-intensive green roof systems are far more common than intensive systems, it is possible that the observed phenological trends on a large, intensive green roof are relatively modest compared to extensive systems. Additionally, DBG is a public garden that must maintain display standards for public visitors, and therefore, the large intensive green roof received additional irrigation during periods of drought to maintain the aesthetic value of the space. It is unclear how this might have affected our results, but it is possible that it acted to dampen the magnitude of the observed phenological differences by moderating substrate temperatures and lessening plant drought stress.
4.3. Implications for Pollinators and Sampling Considerations
Earlier flowering times can potentially benefit urban pollinator conservation efforts. Certain bee species are showing earlier emergence in the season, likely influenced by global temperature increases and the urban heat island effect [25]. Green roof plant species that bloom earlier than their ground-level counterparts, in particular, offer unique foraging opportunities for urban pollinators. There is a growing concern known as the plant–pollinator phenological gap, which results from mismatches in the timing of pollinator emergence and plant blooming due to climate change. This asynchrony can limit pollinators for plant reproduction and early-season foraging opportunities for bees [39]. Leveraging the adjusted bloom schedules of green roof plant species could help reduce this phenological gap, enhancing pollinator abundance and diversity management within urban ecosystems. Our results demonstrate that it is possible for flowering phenology to advance several weeks and for pollinators to take advantage of the earlier floral resources. However, the results also suggest that intentionally managing phenology on green roofs will require a deeper investigation into the environmental characteristics of green roofs and species-level qualities of plants that modulate observed phenological shifts.
Observation methodology will also have an impact on the results of pollinator surveys and may have influenced the results of this study. While sampling only between 9 a.m. and 11 a.m. standardized our methodology, it is possible that certain bees and other pollinators active at different times of day were excluded. Similarly, in situ observations made sightings of Lepidoptera and birds unlikely, as they are not expected to fly in close proximity to human observers. Pan traps have been a common choice for bee collections in previous studies [29,31,40,41]. The pan trap method tends to capture a higher proportion of small bee species [40], and would help to obtain a more comprehensive sample in addition to in situ observations. Following the approach of Pardee and Philpott [41], future studies should consider a combination of pan traps, netting, and in situ pollinator observations to better encompass small-bodied bee species [40] when attempting to infer the general pollinator and bee diversity of green roofs compared to ground-level habitats.
5. Conclusions
This study provides evidence that substrate temperatures are significantly higher in green roof systems, with greater temperature extremes compared to those at ground level. Greater temperature extremes are driven by substantially higher daytime substrate temperatures on green roof systems, which has implications for plant growth, phenology, and survival. We also demonstrate that flowering phenology is advanced on green roof systems relative to ground level and that substrate temperature differences appear to be associated with the timing of earlier flowering phenology in some cases. This suggests that differences in flowering phenology on green roofs may be driven by extreme substrate temperatures, likely in concert with other abiotic factors such as air temperatures, limited substrate depth, and low water availability. The observational nature of the study makes it impossible to apply causality to the observed phenomenon of earlier flowering phenology on our green roof systems, but the consistency of the phenology observations over two growing seasons suggests this may be a widespread phenomenon on green roofs, especially in semi-arid climates. Similarly, we found evidence of increased pollinator foraging during early in the season compared to that observed at ground level, presumably due to the availability of floral resources on the green roof while they remained absent at ground level. Earlier flowering phenology has implications for ecological green roof design and may provide unique foraging opportunities to pollinators on green roofs and increase floral resources during key periods in the growing season in urban environments.
Supplementary Materials
The following supporting information can be downloaded at: https://www.mdpi.com/article/10.3390/land13020178/s1. Table S1: Substrate temperature data (substrate monthly mean temperature (°C), annual mean temperature (°C), maximum annual temperature (°C), and minimum annual temperature (°C)) for all Data Loggers operating in 2019. Table S2: Substrate temperature data (substrate monthly mean temperature (°C), annual mean temperature (°C), maximum annual temperature (°C), and minimum annual temperature (°C)) for all Data Loggers operating in 2020. Table S3: Mean monthly average temperatures (°C), mean monthly maximum temperatures (°C), and precipitation (mm) [42] at DBG in 2019 and 2020 over the course of the study.
Author Contributions
Conceptualization, M.G. and J.B.; methodology, M.G.; software, M.G. and J.B.; formal analysis, M.G.; writing—original draft preparation, M.G.; writing—review and editing, M.G. and J.B.; visualization, M.G. All authors have read and agreed to the published version of the manuscript.
Funding
This research received no external funding.
Data Availability Statement
The data presented in this study are available on request from the corresponding author. The data are not publicly available due to privacy restrictions.
Conflicts of Interest
The authors declare no conflicts of interest.
References
- Getter, K.L.; Rowe, D.B. The role of extensive green roofs in sustainable development. HortScience 2006, 41, 1276–1285. [Google Scholar] [CrossRef]
- Oberndorfer, E.; Lundholm, J.; Bass, B.; Coffman, R.R.; Doshi, H.; Dunnett, N.; Gaffin, S.; Köhler, M.; Liu, K.K.Y.; Rowe, B. Green roofs as urban ecosystems: Ecological structures, functions, and services. BioScience 2007, 57, 823–833. [Google Scholar] [CrossRef]
- Dvorak, B.; Bousselot, J. Theoretical Development of Ecoregional Green Roofs. In Ecoregional Green Roofs; Springer: Berlin/Heidelberg, Germany, 2021; pp. 41–79. [Google Scholar]
- Blaustein, L.; Kadas, G.J.; Gurevitch, J. Integrating ecology into green roof research. Isr. J. Ecol. Evol. 2016, 62, 1–6. [Google Scholar] [CrossRef]
- Rayner, J.P.; Farrell, C.; Raynor, K.J.; Murphy, S.M.; Williams, N.S.G. Plant establishment on a green roof under extreme hot and dry conditions: The importance of leaf succulence in plant selection. Urban For. Urban Green. 2016, 15, 6–14. [Google Scholar] [CrossRef]
- Schneider, A.; Fusco, M.; Bousselot, J. Observations on the survival of 112 plant taxa on a green roof in a semi-arid climate. J. Living Archit. 2014, 2, 10–30. [Google Scholar] [CrossRef]
- Schneider, A.; Landis, M.; Bousselot, J. Observations on the survival capacity of 118 plant taxa on a green roof in a semi-arid climate: 12 year update. J. Living Archit. 2021, 8, 19–40. [Google Scholar] [CrossRef]
- Thuring, C.E.; Berghage, R.D.; Beattie, D.J. Green Roof Plant Responses to Different Substrate Types and Depths under Various Drought Conditions. HortTechnology 2010, 20, 395–401. [Google Scholar] [CrossRef]
- Nektarios, P.A.; Ntoulas, N.; Nydrioti, E.; Kokkinou, I.; Bali, E.-M.; Amountzias, I. Drought stress response of Sedum sediforme grown in extensive green roof systems with different substrate types and depths. Sci. Hortic. 2015, 181, 52–61. [Google Scholar] [CrossRef]
- Greer, D.H.; Wünsche, J.N.; Norling, C.L.; Wiggins, H.N. Root-zone temperatures affect phenology of bud break, flower cluster development, shoot extension growth and gas exchange of ‘Braeburn’ (Malus domestica) apple trees. Tree Physiol. 2006, 26, 105–111. [Google Scholar] [CrossRef] [PubMed]
- Aronson, J.; Kigel, J.; Shmida, A.; Klein, J. Adaptive phenology of desert and Mediterranean populations of annual plants grown with and without water stress. Oecologia 1992, 89, 17–26. [Google Scholar] [CrossRef] [PubMed]
- Zhang, X.; Friedl, M.A.; Schaaf, C.B.; Strahler, A.H. Climate controls on vegetation phenological patterns in northern mid-and high latitudes inferred from MODIS data. Glob. Chang. Biol. 2004, 10, 1133–1145. [Google Scholar] [CrossRef]
- Abd El-Ghani, M.M. Phenology of ten common plant species in western Saudi Arabia. J. Arid Environ. 1997, 35, 673–683. [Google Scholar] [CrossRef]
- Friedel, M.H.; Nelson, D.J.; Sparrow, A.D.; Kinloch, J.E.; Maconochie, J.R. What induces central Australian arid zone trees and shrubs to flower and fruit? Aust. J. Bot. 1993, 41, 307–319. [Google Scholar] [CrossRef]
- Dunne, J.A.; Harte, J.; Taylor, K.J. Subalpine meadow flowering phenology responses to climate change: Integrating experimental and gradient methods. Ecol. Monogr. 2003, 73, 69–86. [Google Scholar] [CrossRef]
- Neil, K.; Wu, J. Effects of urbanization on plant flowering phenology: A review. Urban Ecosyst. 2006, 9, 243–257. [Google Scholar] [CrossRef]
- Lundholm, J.T.; Weddle, B.M.; MacIvor, J.S. Snow depth and vegetation type affect green roof thermal performance in winter. Energy Build. 2014, 84, 299–307. [Google Scholar] [CrossRef]
- Lundholm, J.T. Green roof plant species diversity improves ecosystem multifunctionality. J. Appl. Ecol. 2015, 52, 726–734. [Google Scholar] [CrossRef]
- Reyes, R.; Bustamante, W.; Gironás, J.; Pastén, P.A.; Rojas, V.; Suárez, F.; Vera, S.; Victorero, F.; Bonilla, C.A. Effect of substrate depth and roof layers on green roof temperature and water requirements in a semi-arid climate. Ecol. Eng. 2016, 97, 624–632. [Google Scholar] [CrossRef]
- Johnson, S.D.; Steiner, K.E. Generalization versus specialization in plant pollination systems. Trends Ecol. Evol. 2000, 15, 140–143. [Google Scholar] [CrossRef] [PubMed]
- Rafferty, N.E.; Ives, A.R. Effects of experimental shifts in flowering phenology on plant-pollinator interactions: Experimental shifts in flowering phenology. Ecol. Lett. 2011, 14, 69–74. [Google Scholar] [CrossRef]
- Thomson, J.D. Flowering phenology, fruiting success and progressive deterioration of pollination in an early-flowering geophyte. Philos. Trans. R. Soc. B Biol. Sci. 2010, 365, 3187–3199. [Google Scholar] [CrossRef]
- Ogilvie, J.E.; Griffin, S.R.; Gezon, Z.J.; Inouye, B.D.; Underwood, N.; Inouye, D.W.; Irwin, R.E. Interannual bumble bee abundance is driven by indirect climate effects on floral resource phenology. Ecol. Lett. 2017, 20, 1507–1515. [Google Scholar] [CrossRef]
- Potts, S.G.; Biesmeijer, J.C.; Kremen, C.; Neumann, P.; Schweiger, O.; Kunin, W.E. Global pollinator declines: Trends, impacts and drivers. Trends Ecol. Evol. 2010, 25, 345–353. [Google Scholar] [CrossRef]
- Bartomeus, I.; Ascher, J.S.; Wagner, D.; Danforth, B.N.; Colla, S.; Kornbluth, S.; Winfree, R. Climate-associated phenological advances in bee pollinators and bee-pollinated plants. Proc. Natl. Acad. Sci. USA 2011, 108, 20645–20649. [Google Scholar] [CrossRef] [PubMed]
- Fisogni, A.; Hautekèete, N.; Piquot, Y.; Brun, M.; Vanappelghem, C.; Ohlmann, M.; Franchomme, M.; Hinnewinkel, C.; Massol, F. Seasonal trajectories of plant-pollinator interaction networks differ following phenological mismatches along an urbanization gradient. Landsc. Urban Plan. 2022, 226, 104512. [Google Scholar] [CrossRef]
- Lundholm, J.; MacIvor, J.S.; MacDougall, Z.; Ranalli, M. Plant Species and Functional Group Combinations Affect Green Roof Ecosystem Functions. PLoS ONE 2010, 5, e9677. [Google Scholar] [CrossRef] [PubMed]
- Filazzola, A.; Shrestha, N.; MacIvor, J.S. The contribution of constructed green infrastructure to urban biodiversity: A synthesis and meta-analysis. J. Appl. Ecol. 2019, 56, 2131–2143. [Google Scholar] [CrossRef]
- Tonietto, R.; Fant, J.; Ascher, J.; Ellis, K.; Larkin, D. A comparison of bee communities of Chicago green roofs, parks and prairies. Landsc. Urban Plan. 2011, 103, 102–108. [Google Scholar] [CrossRef]
- Domínguez, M.V.S.; González, E.; Fabián, D.; Salvo, A.; Fenoglio, M.S. Arthropod diversity and ecological processes on green roofs in a semi-rural area of Argentina: Similarity to neighbor ground habitats and landscape effects. Landsc. Urban Plan. 2020, 199, 103816. [Google Scholar] [CrossRef]
- Colla, S.R.; Willis, E.; Packer, L. Can green roofs provide habitat for urban bees (Hymenoptera: Apidae)? Cities Environ. 2009, 2, 4. [Google Scholar] [CrossRef]
- US Department of Commerce. 2020 Annual Climate Summary. Available online: https://www.weather.gov/bou/2020AnnualClimateSummary (accessed on 1 April 2021).
- Smith, E.; Pattni, K.; Saladino, C.; Brown, W.E. The Urban Heat Island Effect in Nevada. 1-5. 2020. Available online: https://digitalscholarship.unlv.edu/bmw_lincy_env/1 (accessed on 1 April 2021).
- Mason, L.; Kondratieff, B.; Seshadri, A. Native Bee Watch: A Colorado Citizen Science Field Guide. Doctoral Dissertation, Colorado State University, Fort Collins, CO, USA, 2018. [Google Scholar]
- R Core Team. R: A Language and Environment for Statistical Computing; R Foundation for Statistical Computing: Vienna, Austria, 2022; Available online: https://www.R-project.org/ (accessed on 1 April 2021).
- Ruszkowski, K.M. Green Roof Effects on Floral Phenology and Floral Nectar Resources. Master’s Thesis, Colorado State University, Fort Collins, CO, USA, 2023. [Google Scholar]
- Grime, J.P. The C-S-R model of primary plant strategies—Origins, implications and tests. In Plant Evolutionary Biology; Gottlieb, L.D., Jain, S.K., Eds.; Springer: Dordrecht, The Netherlands, 1988; pp. 371–393. [Google Scholar] [CrossRef]
- Zhang, X.; Tarpley, D.; Sullivan, J.T. Diverse responses of vegetation phenology to a warming climate. Geophys. Res. Lett. 2007, 34, 207. [Google Scholar] [CrossRef]
- Kudo, G.; Ida, T.Y. Early onset of spring increases the phenological mismatch between plants and pollinators. Ecology 2013, 94, 2311–2320. [Google Scholar] [CrossRef] [PubMed]
- Ksiazek, K.; Tonietto, R.; Ascher, J.S. Ten bee species new to green roofs in the Chicago area. Great Lakes Entomol. 2014, 47, 13. [Google Scholar] [CrossRef]
- Pardee, G.L.; Philpott, S.M. Native plants are the bee’s knees: Local and landscape predictors of bee richness and abundance in backyard gardens. Urban Ecosyst. 2014, 17, 641–659. [Google Scholar] [CrossRef]
- CoCoRaHS. Community Collaborative Rain, Hail & Snow Network. Available online: https://www.cocorahs.org/ (accessed on 1 April 2021).

Disclaimer/Publisher’s Note: The statements, opinions and data contained in all publications are solely those of the individual author(s) and contributor(s) and not of MDPI and/or the editor(s). MDPI and/or the editor(s) disclaim responsibility for any injury to people or property resulting from any ideas, methods, instructions or products referred to in the content. |
© 2024 by the authors. Licensee MDPI, Basel, Switzerland. This article is an open access article distributed under the terms and conditions of the Creative Commons Attribution (CC BY) license (https://creativecommons.org/licenses/by/4.0/).