Abstract
Soil is a natural capital which supplies valuable ecosystem services including carbon and nitrogen storage. Agroecosystems play an important role in soil organic carbon (SOC) and soil total nitrogen (NT) accumulation. The aim of this study was to analyse SOC stock (SOCS) and NT stock (NTS) in relation to land use (arable land-AL, permanent grasslands-PG), management, soil depth, and selected soil properties of six soil subtypes (Rendzic Leptosol—LPrz, Dystric Cambisol—CMdy, Stagnic Cambisol—CMst, Haplic Fluvisol—FLha, Gleyic Fluvisol—FLgl, Haplic Chernozem—CHha) which are the most widespread in Slovakia. SOCS for a 50 cm deep soil profile ranged from 161 t.ha−1 in CHha to 59 t.ha−1 in FLgl in grasslands, and in arable lands from 111 t.ha−1 in CHha to 38 t.ha−1 in CMst. In grasslands, FLs and CMst showed the significantly lowest SOCS and NTS in comparison to CMdy, LPrz, and CHha. The mean soil NT content in arable land and grasslands was 2.21 g.kg−1 and 2.82 g.kg−1, respectively. ANOVA showed that soil subtype, land use, and site have significantly affected SOCS but not NTS. The correlation analysis revealed correlations between SOCS and NTS. SOCS was also correlated with C:N, pH, P, and K. This study should help to encourage practices to maintain soil C and soil properties and to ensure the sustainability of the functions of many soil types in Slovakia.
1. Introduction
Soils are the largest reservoir of terrestrial carbon stocks, comprising both soil organic carbon (SOC) and soil inorganic carbon [1]. The global SOC stock ranges from 1500 to 2400 PgC [2].
In 2021, the world total agricultural land was 4.8 billion hectares, one-third of the global land area. Cropland covered 1.6 billion hectares, and permanent grasslands covered 3.2 billion hectares [3]. Croplands and grasslands are major land uses in Europe, occupying around 126.5 and 62.7 Mha in the EU25 plus Norway and Switzerland, respectively [4]. Globally, cropland soils store a lower amount of SOC (90 Mg.ha−1) than grassland soils (118 Mg.ha−1) [5,6]. Grasslands store about 34% of the terrestrial carbon stock, of which 90% is stored belowground as root biomass and SOC [7]. Soils of agriculturally managed cropland are also an important source of CO2. Soils of agroecosystems have been a major source of CO2 ever since the dawn of settled agriculture [1]. A significant amount of loss of SOC is caused by the intensive tillage that emits CO2 into the atmosphere [8]. The concentration of atmospheric CO2 may be impacted by the changes in the SOC [9]. Soil carbon content is under threat worldwide due to resource demands and the increasing intensification of land use [10].
Nowadays, the research is focused on soil carbon, and its stocks and soil nitrogen stocks are not so much considered. The reason may also be its greater dynamics in the soil environment. Its storage and availability in the soil is a crucial factor that influences crop growth and helps to satisfy global food demand [11]. Nitrogen (N) has a key role in the regulation of terrestrial ecosystems [12]. Soil is the largest nitrogen pool in terrestrial ecosystems and sufficient content of total nitrogen (NT) is critical for crop productivity. Human activities such as fossil fuel combustion, intensive animal farming, and the application of fertilizers have affected the nitrogen cycle with negative consequences for soil microbial communities, soil properties (soil pH and soil carbon to nitrogen ratio), and ecosystem services [13]. Chen et al. [14] reported that intensive farming requires high N doses, depleting soil N stocks, and thus nitrogen is a major fertilizer for agriculture. About 67.84 million tons of N are applied annually to agricultural land all over the world [15] and the total cost is up to USD 44.2 billion. Knowledge of soil NT and soil total nitrogen stock (NTS) is fundamental for soil management, precision agriculture, nutrient flow assessment, and biochemical modelling [16].
Apart of nitrogen, phosphorus (P) and potassium (K) are the most important nutrients for grassland and crop production [17]. The amount of phosphorus in soils varies from 0.02% to 0.15%, and a major part of total soil phosphorus is not available for plants [18]. Therefore, soil phosphorus is replenished with mineral or bio-based fertilizers [19]. Potassium is a crucial nutrient regarding physiological and biochemical functions in plants [20]. In agricultural ecosystems, soil potassium content is controlled by soil type, parental material, and land use history.
SOC, NT, and the content of P and K depend on a wide range of factors, e.g., soil texture, depth, chemical and biological properties, land use, and management [21,22]. The SOC is influenced by nitrogen, phosphorous, and other soil nutrients because they are coupled with SOC in terrestrial cycles [23], e.g., the turnover of SOC is constrained by the availability of N and P [24]. On the other hand, the effects of nitrogen on SOC were observed to differ from one study to another [25]. Some studies showed that N addition inhibited soil organic carbon turnover, whereas in hardwood forest, SOC accumulation increased after N addition. A meta-analysis of 88 studies showed that the effects of nitrogen availability on carbon dynamics depend on ecosystem type and nitrogen addition rate [26]. It is commonly acknowledged that nutrient contents decrease with soil depth [27]. Climate and vegetation can also shape this descending curve [28]. In addition to land use, a changing climate can impact soil systems. Climate change affects nutrient cycling, soil respiration, and carbon storage [29]. Increasing temperature, fluctuations in CO2 concentration, and precipitation have a negative effect on carbon allocation in soil. On the other hand, a higher temperature can increase N mineralization and can stimulate plant growth and crop yield. Changes in soil moisture and water availability affect nutrient availability. In dry soils with higher soil temperature, phosphorus becomes less available to plants [30]. Carbon storage is one of the important ecosystem services provided by agricultural soils. Various policy strategies and programs such as the European Grean Deal, the Australian Carbon Farming Initiative, and the American Clean Energy and Security Act support farmers to adopt agricultural management that can enhance soil carbon sequestration. Some studies have focused on the monetary valuation of soil carbon sequestration, and primary production in grassland ecosystems [31,32]. However, there are still many uncertainties for designing the carbon payment scheme [33].
In terms of carbon stocks, previous studies reported from Slovakia have focused mainly on changes driven by land use [34,35], but few have addressed nitrogen stocks and plant-available nutrients content. Slovakia is a suitable country for the evaluation of various soil characteristics and relationships because it is a highly diversified country with respect to its natural environment. It is largely located in the mountainous territory of the western Carpathian arch, which forms the boundary between important physical and bio-geographic zones and several main European watersheds. Only a small part of Eastern Slovakia belongs to the eastern Carpathian region, and the southwestern part to the Pannonian Basin. The mountain regions cover more than 55% of the total land territory. The climate is temperate but is influenced locally by elevation and type of relief. Communities vary from thermophilous in the southern parts of the country, to mountainous at the higher altitudes. There is also a high diversity of soil types, which is the result of varying geological, topographical, and climatic conditions [36]. In light of all these geographical and ecological aspects, Slovakia is an interesting laboratory for conducting a this type of research.
Estimating C and N stocks, their vertical distribution in agricultural soils, interactions and their dependence on different variables are necessary for understanding their responses to global change. The comparison between these parameters in different soil types and agroecosystems could reveal the relations and interactions which could provide guidance for proper management measures for C and N conservation in soils. The main objectives of this study were (1) to estimate Slovakia’s soil carbon and nitrogen stocks under arable land and grassland, (2) to identify the vertical distribution of soil carbon and nitrogen stocks, (3) to examine how management intensity, soil, and environmental factors influence carbon and nitrogen storage, and (4) to assess the economic value of soil carbon storage.
2. Materials and Methods
2.1. Sites Description
Slovakia is largely located in the mountain territory of the western Carpathian arch. Only a small part of Eastern Slovakia belongs to the eastern Carpathian region. The lowlands of Southern Slovakia belong to the Pannonian Basin. The mountain regions cover more than 55% of the total land territory. The climate is temperate but is influenced locally by elevation and type of relief.
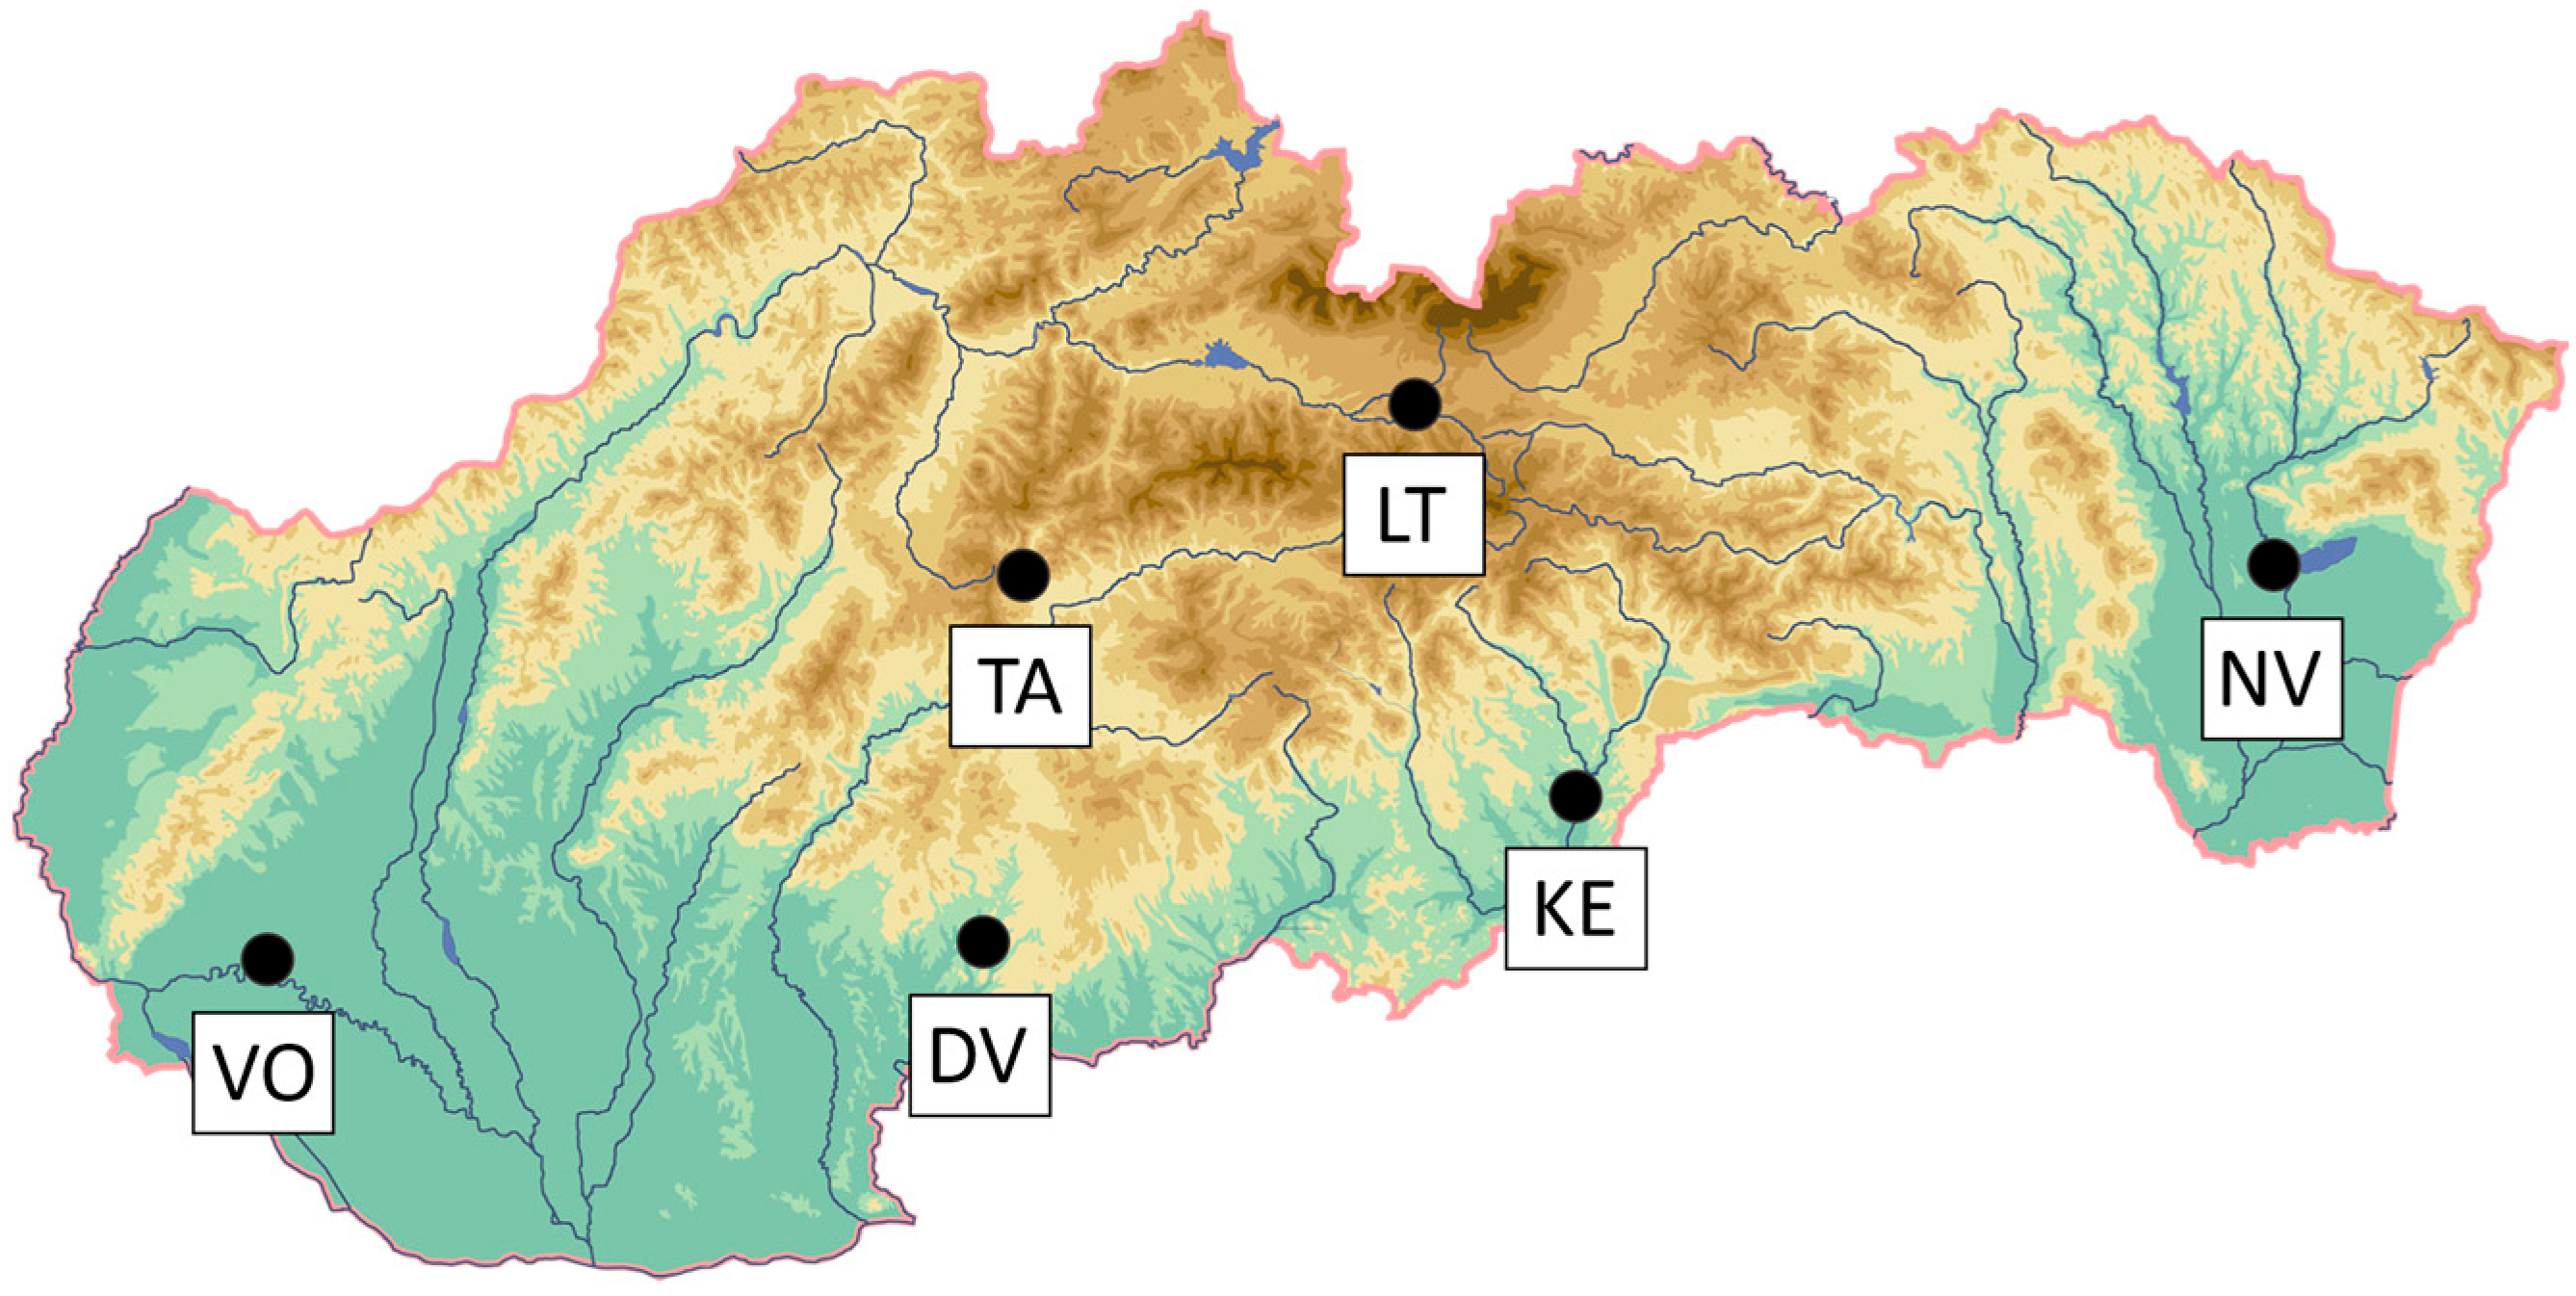
Six study sites located in different natural conditions were selected. They were situated between the altitudes 121 m and 950 m high in different geographic and climatic conditions of Slovakia with the different soil subtypes (classified according to the World Reference Base for Soil Resources [37], different land use and management practices (Figure 1, Table 1)).

Figure 1.
Map of six study sites in Slovakia. Abbreviations: LT—Liptovská Teplička, TA—Tajov, KE—Kečovo, NV—Nacina Ves, DV—Dvorníky, VO—Voderady.

Table 1.
Characteristics and land management of the six study sites.
In Liptovská Teplička (LT), the soil type classified as Rendzic Leptosol (LPrz) developed on carbonates and dolomites. At arable land, A horizon, 30 cm in depth, overlying a thin 10 cm A/C horizon. At grassland, A horizon, 20 cm in depth, overlying a thin 15 cm A/C horizon. At arable land, rye was grown as an intercrop. The permanent mesotrophic lowland pasture and aftermath-grazed meadow (grassland habitat of national importance) were cut at the end of June and the aftermath was grazed by sheep.
In Tajov (TA), the soil type classified as Dystric Cambisol (CMdy) developed on slope sedimentary rocks. At arable land and grassland, A horizon, 30 cm in depth, overlying a 20 cm B horizon, which in turn overlies a C horizon starting at approximately 50 cm depth. At arable land, oat and maize were grown during the 1st and 2nd experimental years. The permanent mesotrophic lowland pasture and aftermath-grazed meadow (grassland habitat of national importance) were extensively grazed by sheep.
In Kečovo (KE), the soil type classified as Stagnic Cambisol (CMst) developed on slope sedimentary rocks. At arable land, A horizon, 20 cm in depth, overlying 20 cm B horizon, which in turn overlies a C horizon starting at approximately 40 cm depth. At grassland, A horizon, 10 cm in depth, overlying a 40 cm B horizon, which in turn overlies a C horizon starting at approximately 50 cm depth. At arable land, mono cropping of maize was performed. The permanent grassland was extensively used by one cut in June and grazed by suckler cows in the second half of the growing season.
In Nacina Ves (NV), the soil type classified as Haplic Fluvisol (FLha) developed on fluvial sediments. At arable land and grassland, A horizon, 20 cm in depth, overlying a thin 15 cm A/C horizon. At the arable land, barley and soya were grown during the 1st and 2nd experimental years. Grass-clover mixture was oversown into permanent pasture in the 1st year and grazed by dairy cows during both experimental years.
In Dvorníky (DV), the soil type classified as Gleyic Fluvisol (FLgl) developed on fluvial sediments. At arable land, A horizon, 25 cm in depth, overlying a 40 cm A/C horizon. At grassland, A horizon, 20 cm in depth, overlying a thin 15 cm A/C horizon. At arable land, mono cropping of winter wheat was performed. The permanent grassland was extensively used by one cut in June and the aftermath was grazed by sheep.
In Voderady (VO), the soil type classified as Haplic Chernozem (CHha) developed on loess. At arable land, A horizon, 50 cm in depth, overlying a 40 cm A/C horizon. At grassland, A horizon, 30 cm in depth, overlying a 30 cm A/C horizon. At the arable land, maize and winter wheat were grown during the 1st and 2nd experimental years. Permanent grassland was situated at the edge of the arable parcel.
2.2. Soil Sampling, Analysis, and Calculations
At each site, four sampling points with a Z-shaped pattern were selected. Soil samples were collected at 0–10 cm and 35–45 cm layers, in order to capture the soil characteristics of the A humic horizon with the highest accumulation of organic matter and the subsequent horizon with a lower or no accumulation of organic matter, such as the subsurface B or the C horizon.
To assess chemical properties, soil samples were air-dried and sifted through a 2 mm mesh sieve. Soil reaction was determined as pH in 1 M KCl solution (with a ratio of 1:2.5). SOC content was determined using the oxidimetric method according to Tjurin (a modification of Nikitin) [38], NT content was determined by the Kjeldahl method [39], and plant-available nutrients K and P were extracted by Melich III [40]. P was determined calorimetrically on the analyzer Scalar and K by flame photometry. To quantify bulk density (BD), undisturbed soil samples were hermetically sealed in stainless steel tubes and taken to the laboratory for analyses using the gravimetric method according to Novák [41].
SOC stock (SOCS) (t.ha−1) and NT stock (NTS) (t.ha−1) were calculated as follows [42]:
where SOCS is SOC stock pool (t.ha−1) of the assessed soil profile, SOCi is SOC content (g.kg−1), BDi is bulk density (g.cm−3), Hi is the soil thickness (m), G is the volume percent of gravel and stones (particle size > 2 mm) in layer i, respectively.
A similar approach was used to calculate NTS (t.ha−1):
where NTS is total nitrogen stock (t.ha−1) of the assessed soil profile, NTi is total nitrogen content (g.kg−1), BDi is bulk density (g.cm−3), Hi is the soil thickness (m), G is the volume percent of gravel and stones (particle size > 2 mm) in layer i, respectively.
The value of soil carbon sequestration (VC) was calculated using the carbon price extracted from the European Union Emission Trading System (EUR 70/Mg C) [43].
where PC is the price of the carbon tax in Slovakia, SOCSi is the organic carbon stock of ith soil layer (t/ha).
The statistical analyses were conducted by using the statistical program package SPSS Statistics 28. ANOVA analysis of variance was followed by post hoc comparison using the Tukey HSD test to identify differences among soil subtypes, sites, and land management. The relationships between soil properties and C, N parameters were identified through Pearsons’s correlation analysis.
3. Results
3.1. Basic Soil Physical and Chemical Properties
Table 2 presents basic soil physical and chemical properties. We determined BD and G content as basic physical soil properties as main variables used for SOCS and NTS calculations (Table 2). BD generally increased with depth in all soils apart from FLgl used as AL, but differences were found between the soil subtypes and land use types. In grassland, the BD varied between 0.88 g.cm−3 (LT, LPrz) and 1.52 g.cm−3 (DV, FLha). In arable land, the lowest BD was found in CMdy in TA (0.98 g.cm−3) and the highest in CMst in KE (1.61 g.cm−3). The volume percent of gravel and stones generally increased with depth or was at the same level (in case of FLgl and FLha used as arable lands). In grassland, the G varied between 1.1% (TA, CMdy) and 30% (LT, LPrz). In arable land, the lowest G was found in FLha in NV (0.1%) and the highest in CMst in KE (40%).
Table 2.
Mean values of basic soil physical and chemical properties.
In grassland, the topsoil pH varied between 4.67 (TA, CMdy) and 7.24 (VO, CHha). In arable land, the lowest soil pH was found in CMst in KE and CMdy in TA. In VO (CHha) and LT (LPrz), the soil was neutral and little difference was observed between grassland and arable land, and soil depth. In arable land, the mean soil pH slightly decreased with the soil depth from pH 5.8 (0–10 cm) to pH 5.7 (35–45 cm), whereas in grassland the opposite pattern was observed. (Table 2).
The considerably lowest content of plant-available P was found in KE (CMst) with grassland and arable land. In arable land, the highest content of plant-available P (50.67 g.kg−1) was observed in TA (CMdy). In arable land, the content of plant-available P significantly decreased with the depth. A similar pattern was found in grassland soil with the exception of NV (FLha) and DV (FLgl) sites. Out of six soil subtypes, the highest content of plant-available K was found in CHha in the VO site. In the topsoil of arable land, the content of plant-available K ranged from 157.51 mg.kg−1 in KE (CMst) to 283,64 mg.kg−1 in DV (FLgl) (Table 2).
The ANOVA showed significant differences between the soil subtypes, the sites, and the pH, plant-available P, plant-available K. The ANOVA did not show any difference between land use and soil depth (Table 3).
Table 3.
Analysis of variance of soil parameters.
3.2. Soil Organic Carbon and Soil Total Nitrogen
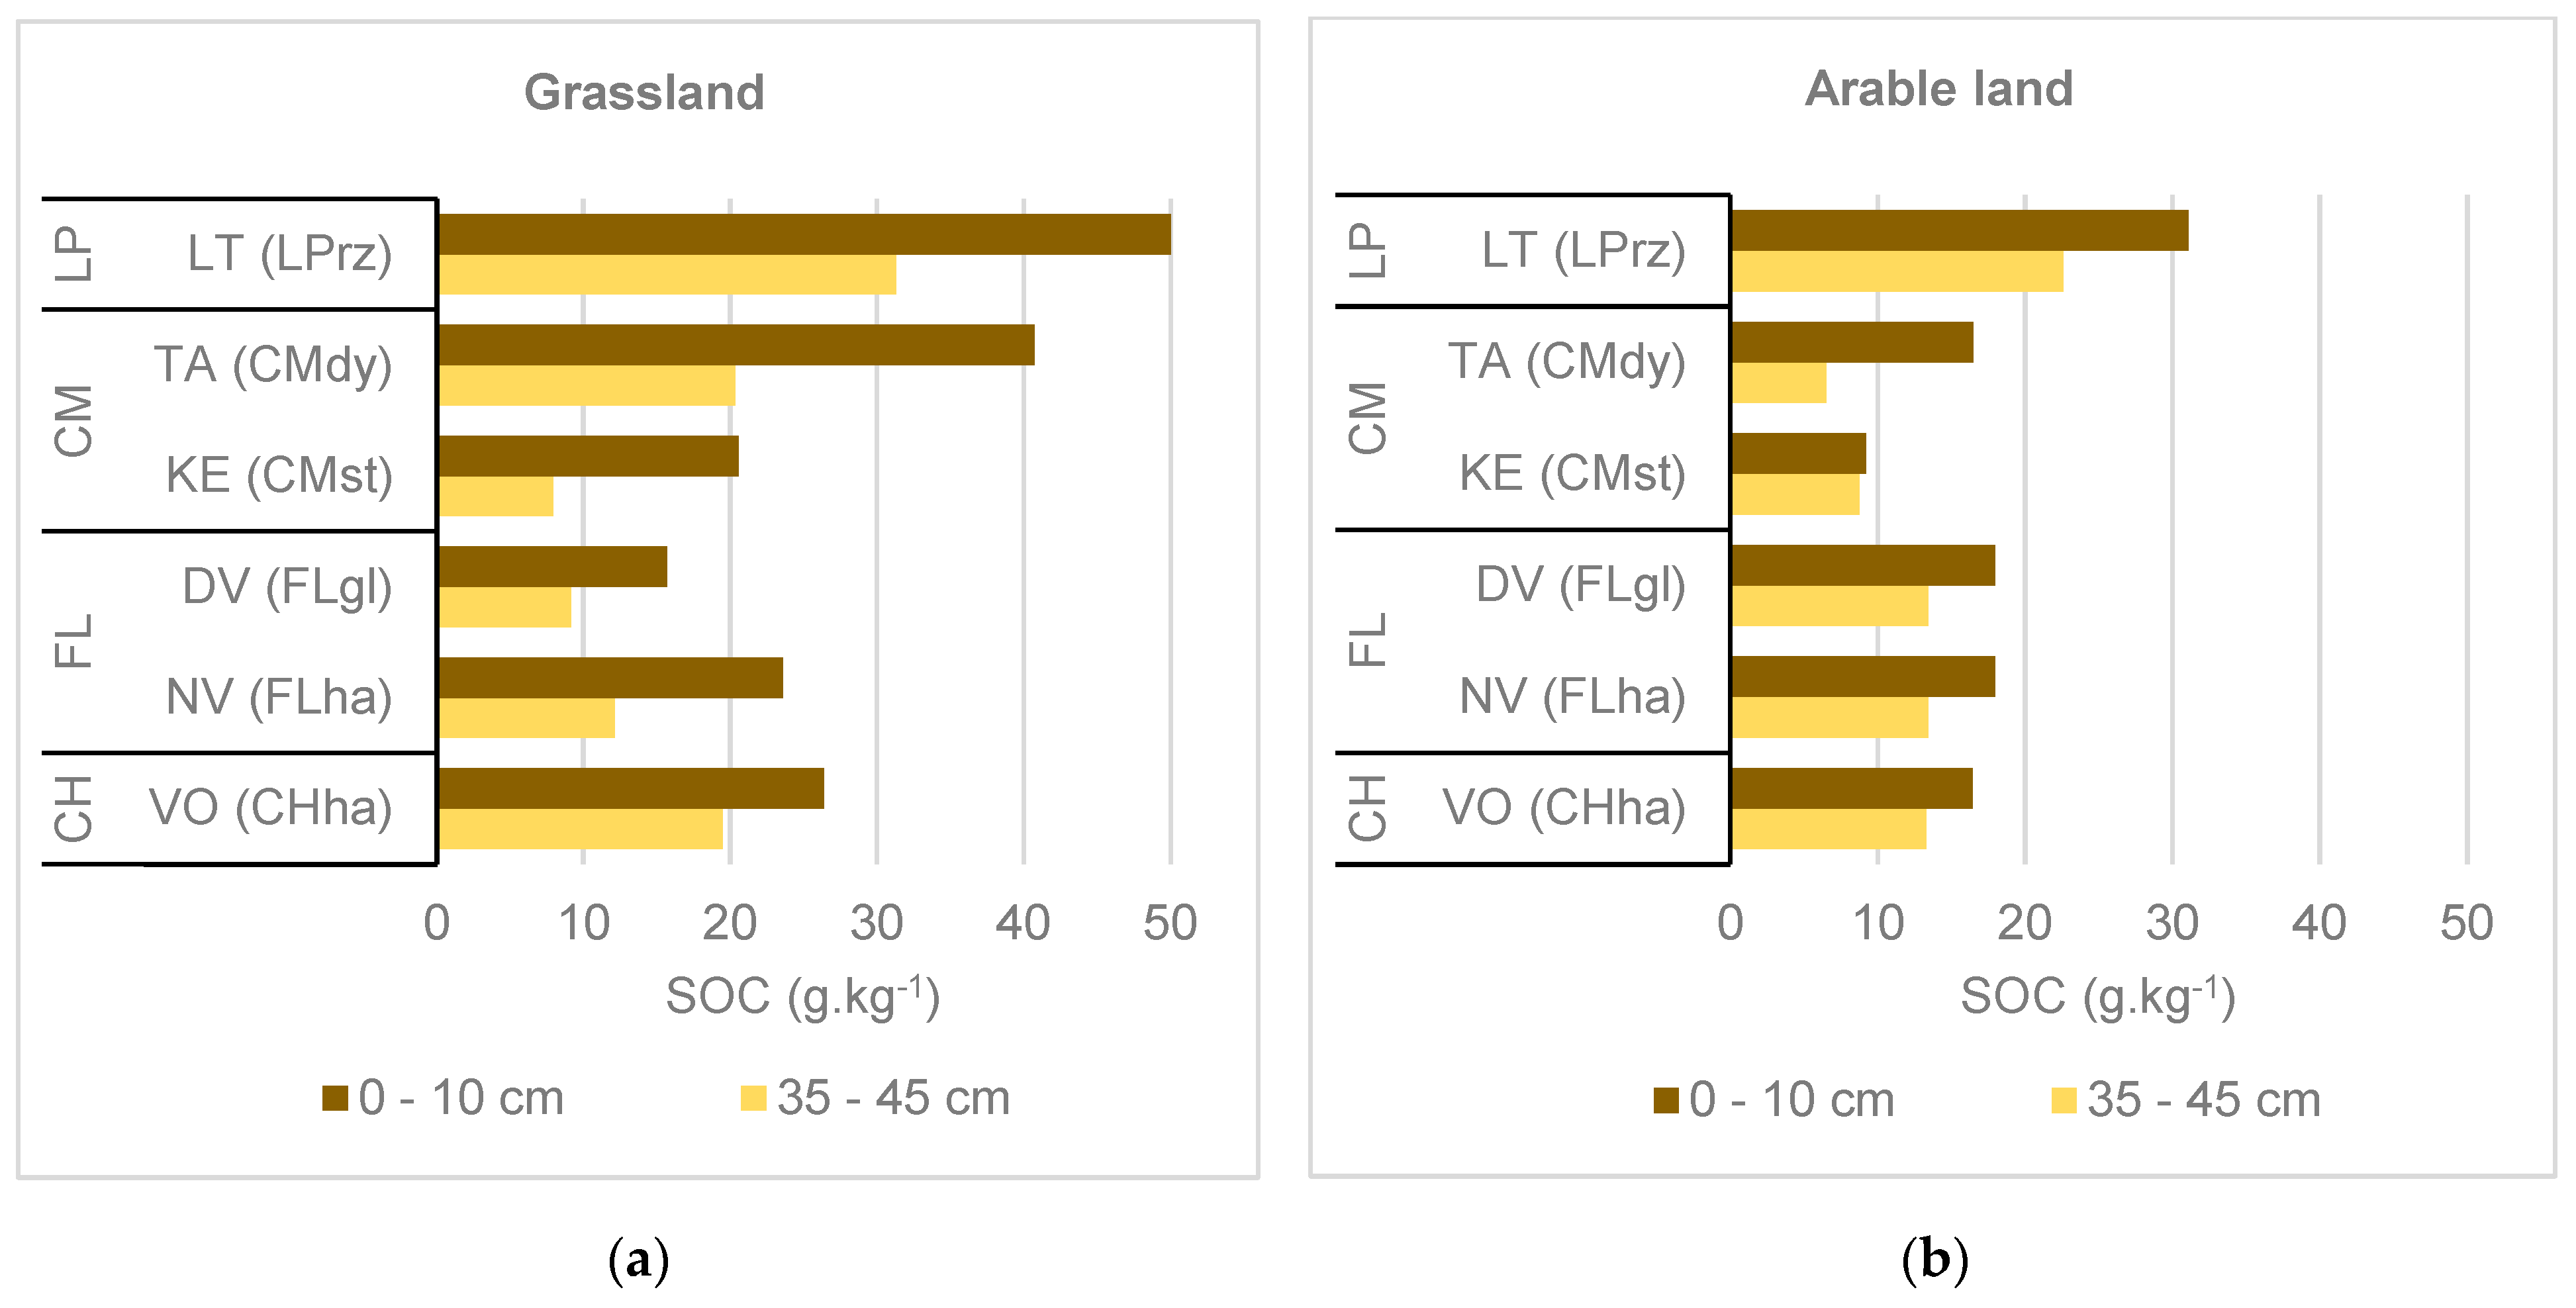
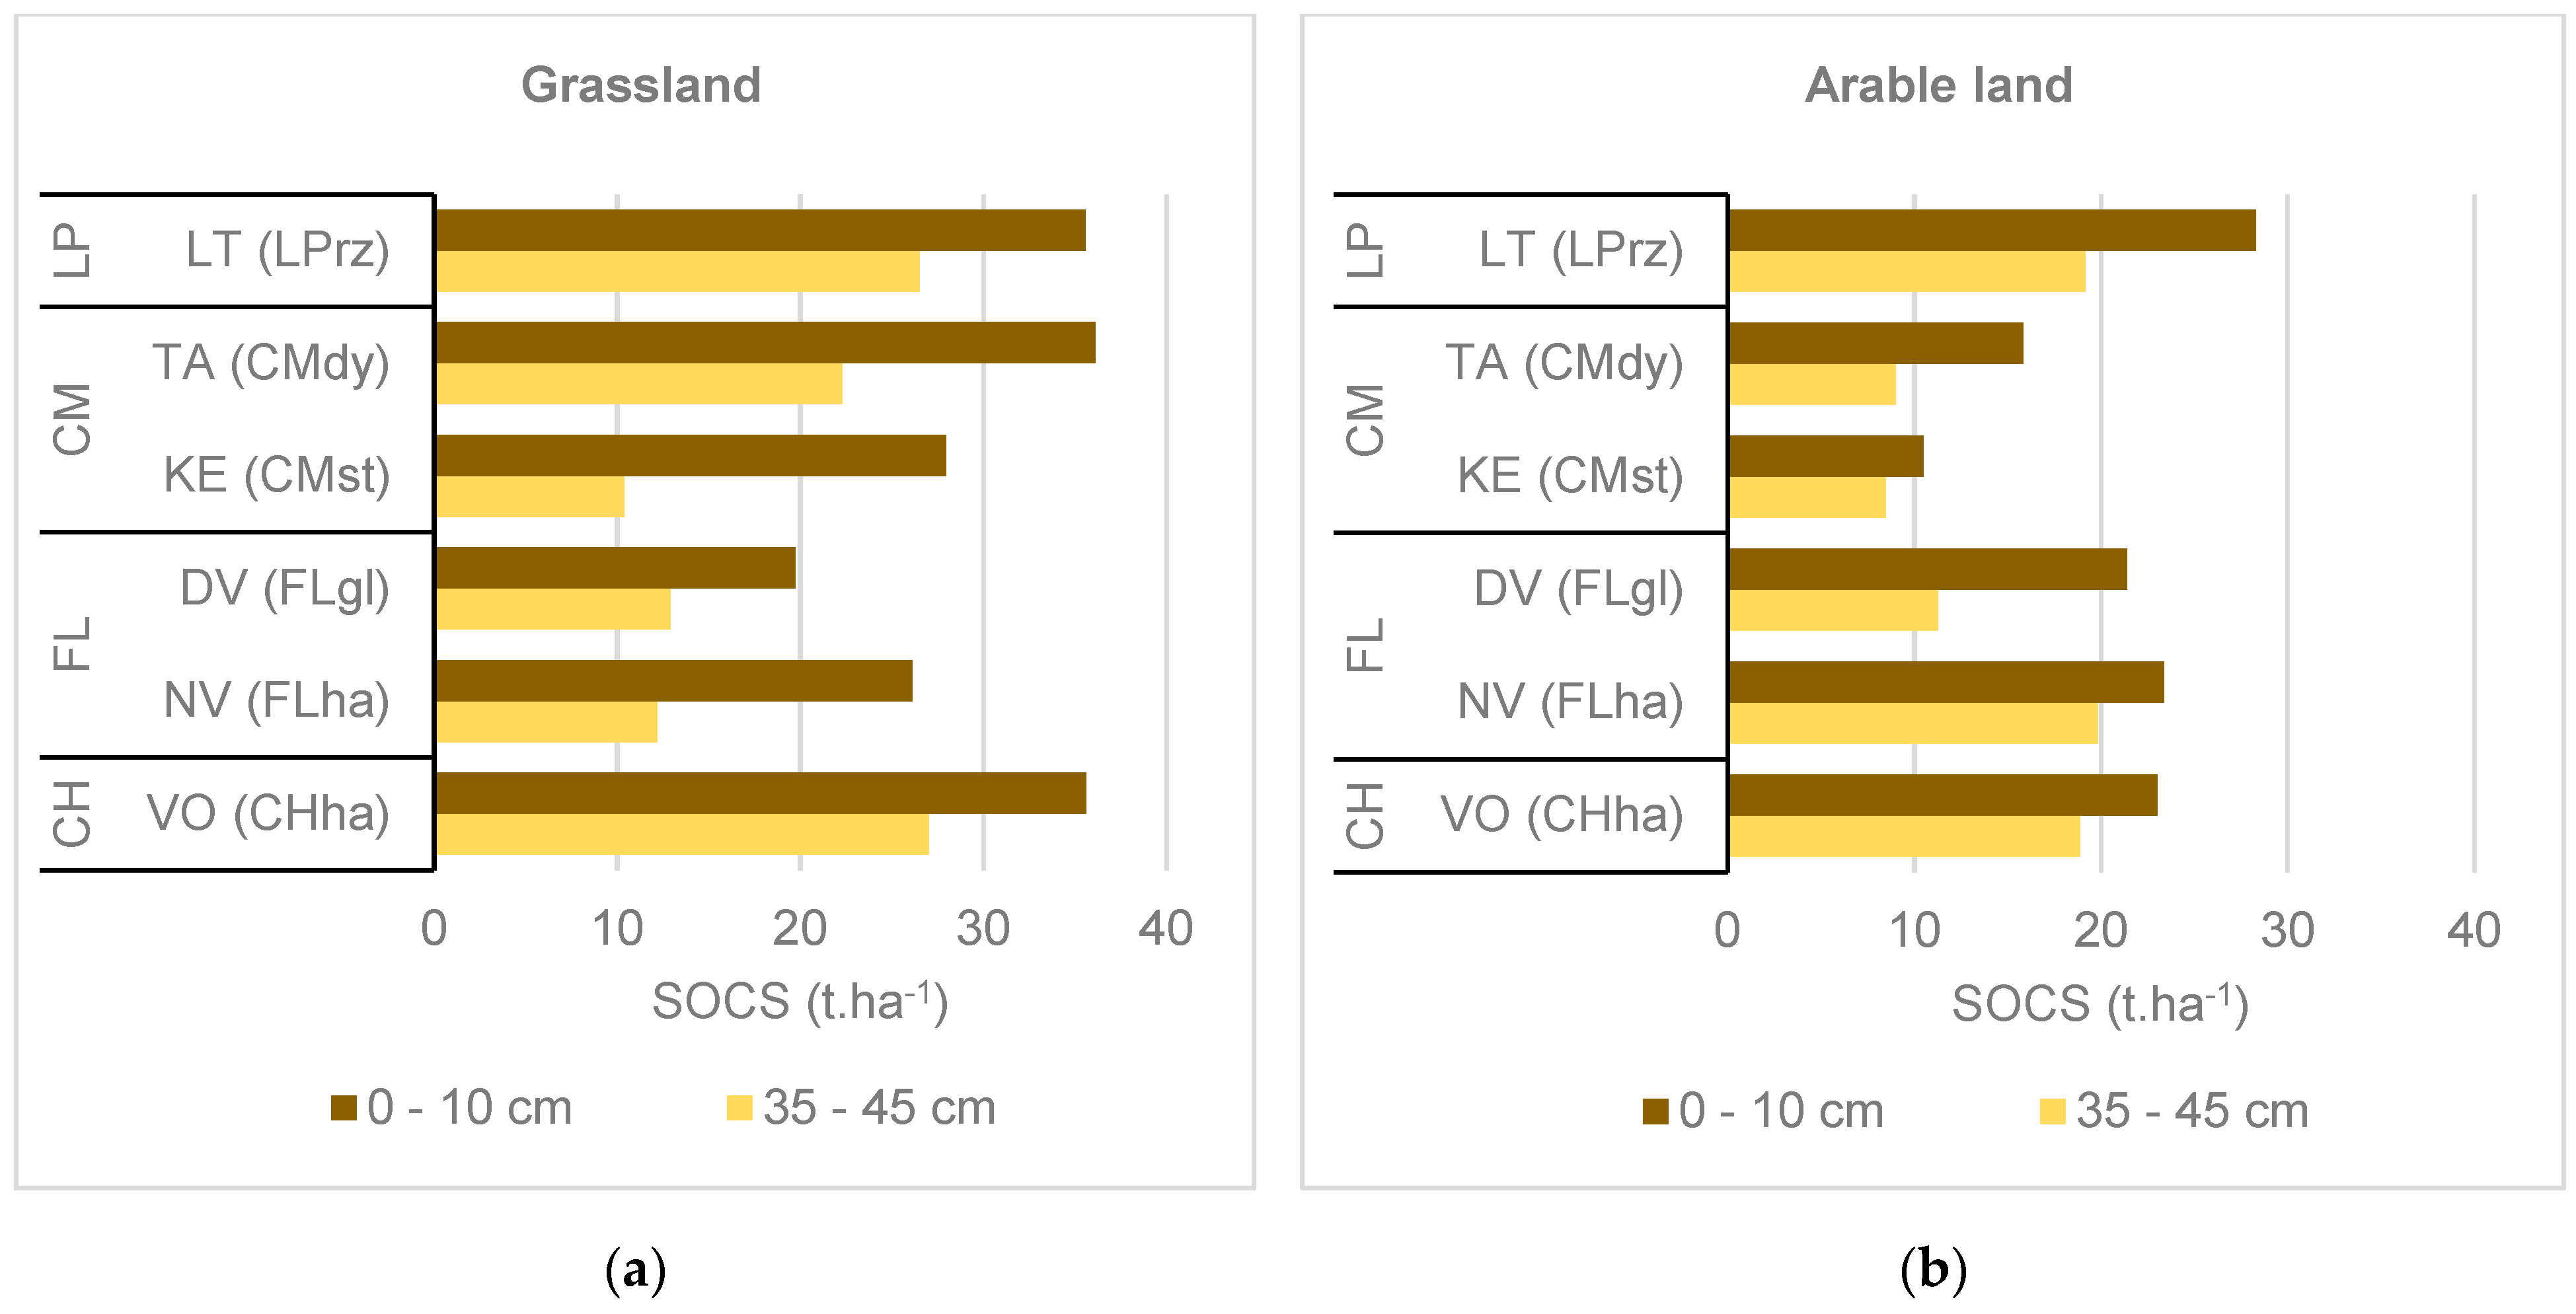
Figure 2 shows the SOC content and Figure 3 SOCS in two soil layers in grassland and arable land in different soil subtypes and sites. In grasslands, the SOC content at the 0–10 cm depth ranged from 15.68 g.kg−1 in DV (FLgl) to 50.04 g.kg−1 in LT (LPrz). Similar to grasslands, the highest SOC content was found in LT with LPrz in arable land. For NV and DV with Fluvisols, the SOC content was 17.96 g.kg−1, and for TA (CMdy) and VO (CHha) it was 16.48 g.kg−1 and 16.44 g.kg−1, respectively. The lowest SOC content was observed in KE (CMst). The SOC content and SOCS were significantly higher (p < 0.01) at the 0–10 cm depth than at the 35–45 cm depth. Regarding the soil subtypes in both soil depths, at grasslands, FLgl, FLha, and CMst showed the significantly lowest SOCS in comparison to CHha, LPrz, and CMdy. At arable land, CMst showed the significantly lowest SOCS and LPrz showed the highest SOCS. ANOVA showed significant differences between soil subtypes, sites, land use, soil depth, and SOCS (Table 3).

Figure 2.
Soil organic carbon content; (a) Grassland; (b) Arable land.
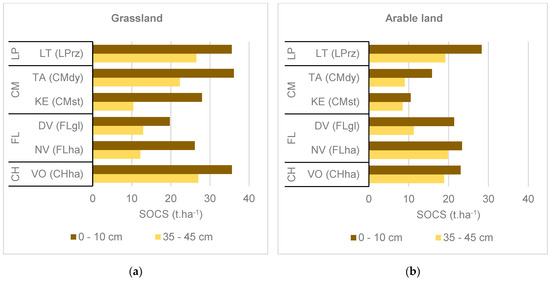
Figure 3.
Soil organic carbon stock; (a) Grassland; (b) Arable land.
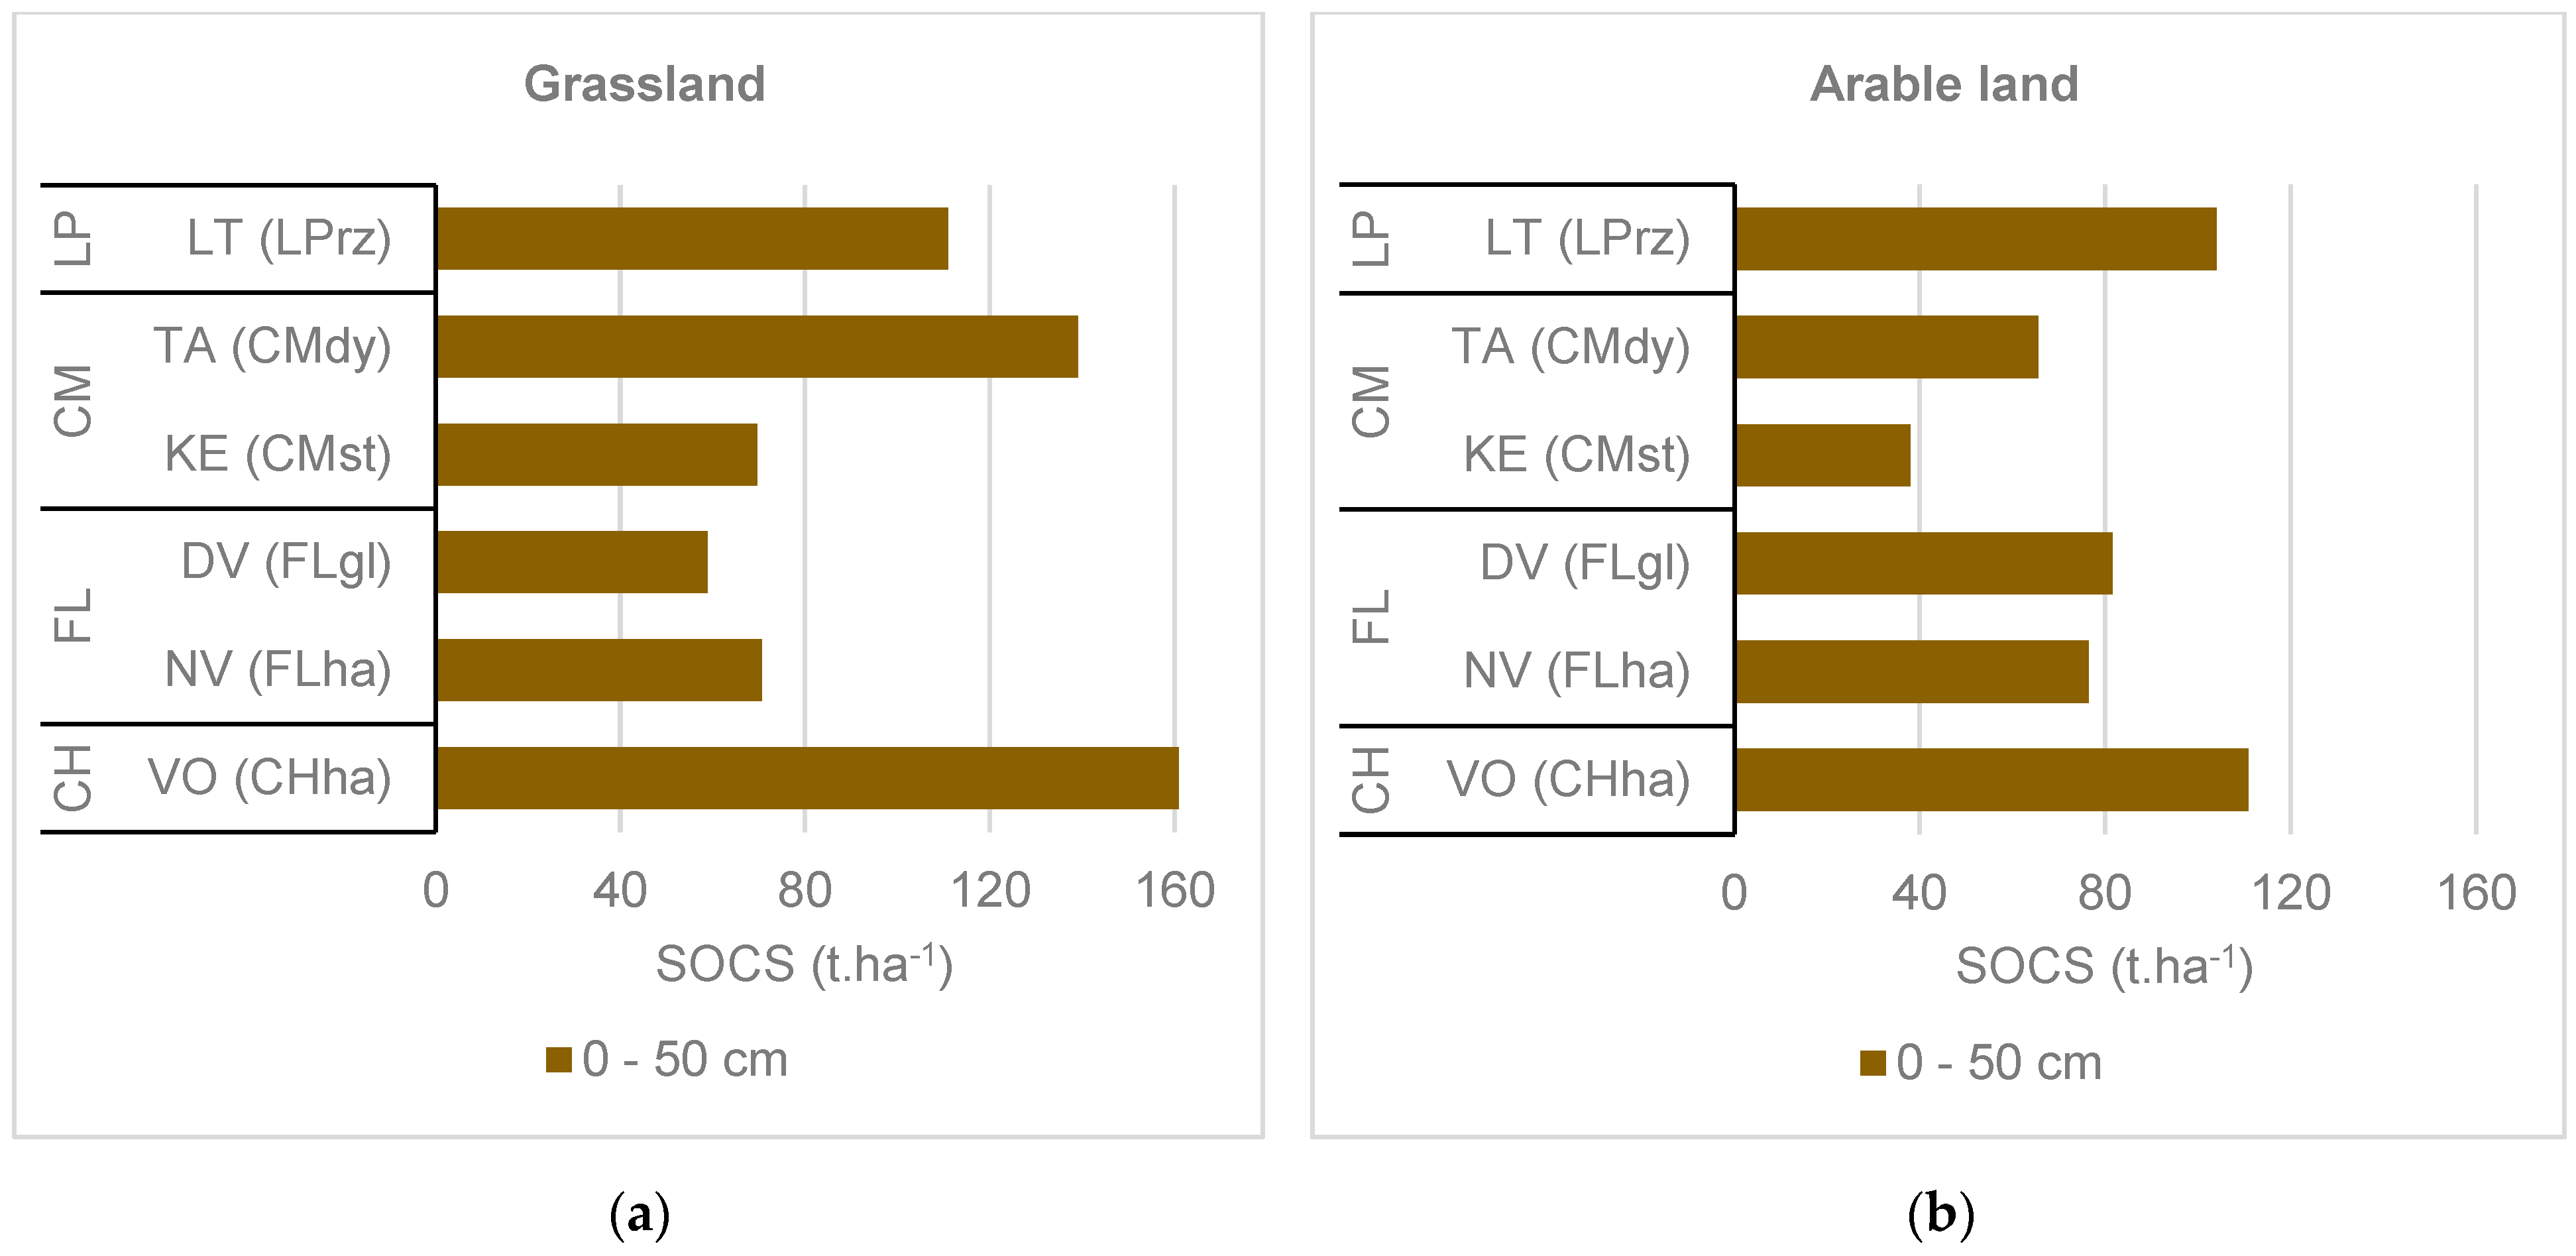
The topsoil layer is the most active in the present ongoing carbon storage processes. Nevertheless, deeper soil horizons play an important role in total carbon storage. The six soil subtypes varied in the total thickness as well as in the thickness of individual horizons. Based on soil profile stratification, we estimated SOCS for a 50 cm deep soil profile (Figure 4). In grasslands, SOCS for a 50 cm deep soil profile ranged from 161 t.ha−1 in VO (CHha) to 59 t.ha−1 in DV (FLgl). Lower values were observed in the case of arable lands compared to grasslands. In arable lands, the highest SOCS for a 50 cm deep soil profile was found in VO (CHha, 111 t.ha−1), followed by LPrz in LT (104 t.ha−1). The lowest SOCS for a 50 cm deep soil profile was found in CMst in KE (38 t.ha−1).
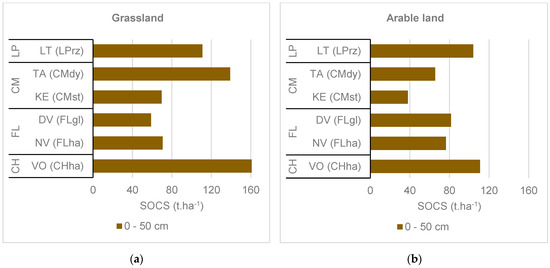
Figure 4.
Soil organic carbon stock for 50 cm deep soil profile; (a) Grassland; (b) Arable land.
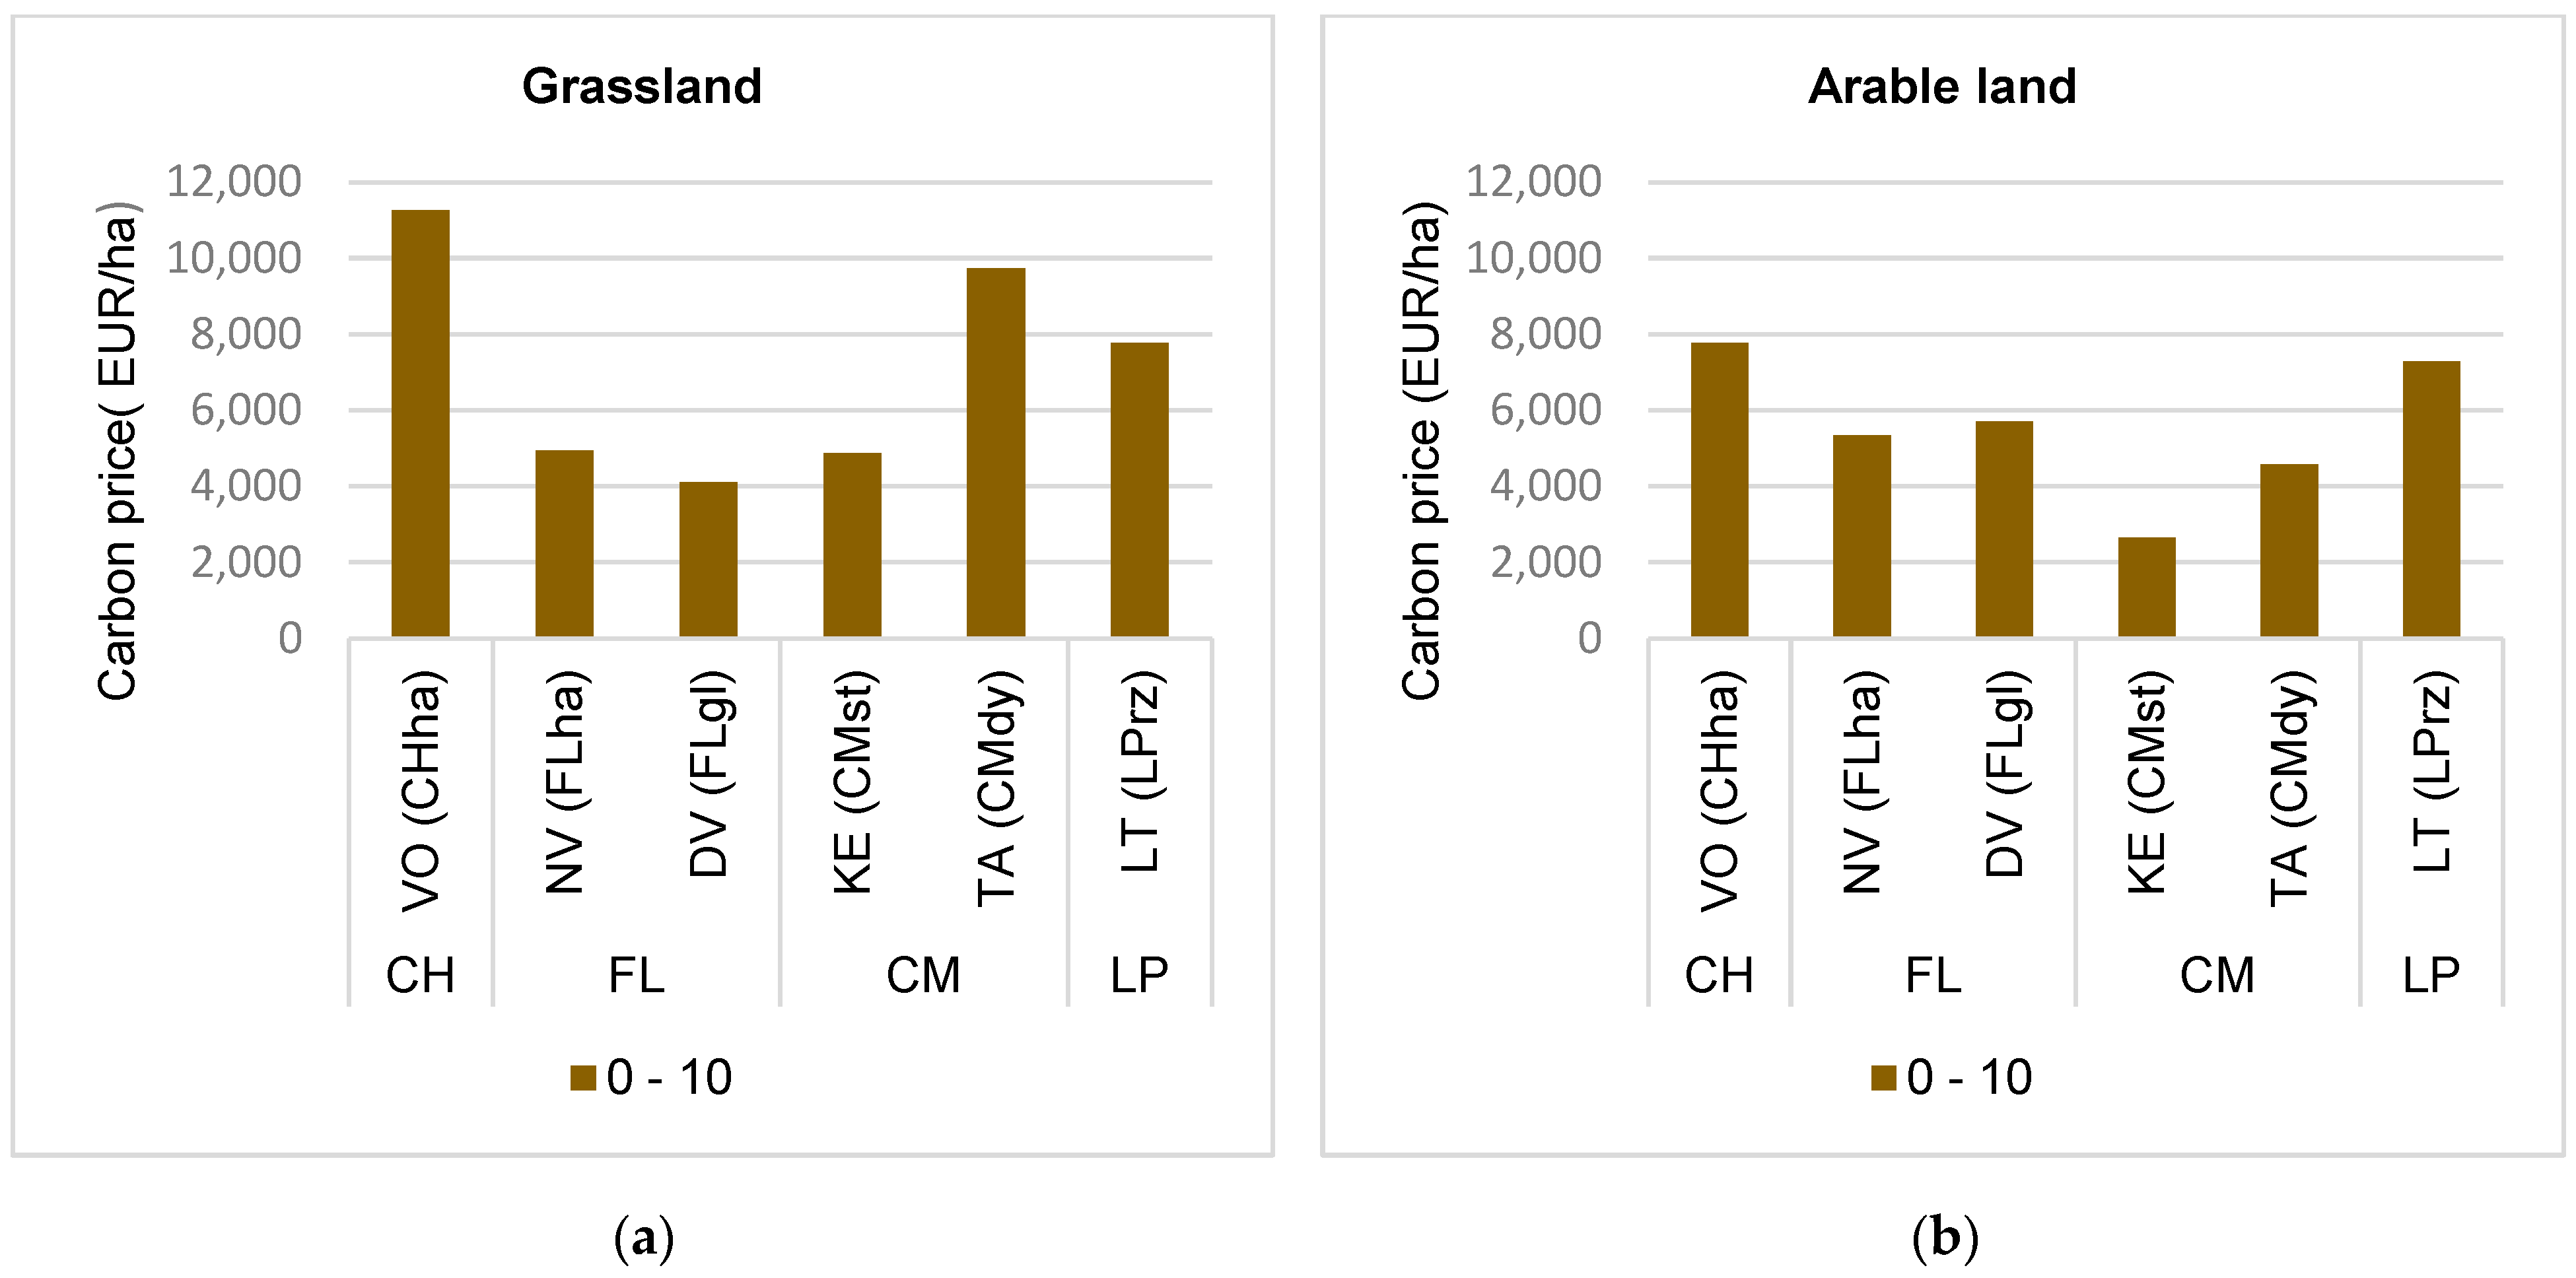
To express the ecosystem function of carbon storage in soil, we used the SOCS for a 50 cm deep soil profile and carbon tax. The economic value of grassland varied from a minimum of EUR 4115/ha for FLgl (DV) to a maximum of EUR 11,257/ha for CHha (VO) (Figure 5). In arable land for CMst in KE and CMdy in TA, the economic value was lower, respectively, by 63% and 57% than in grassland.

Figure 5.
Economic value of soil carbon; (a) Grassland; (b) Arable land.
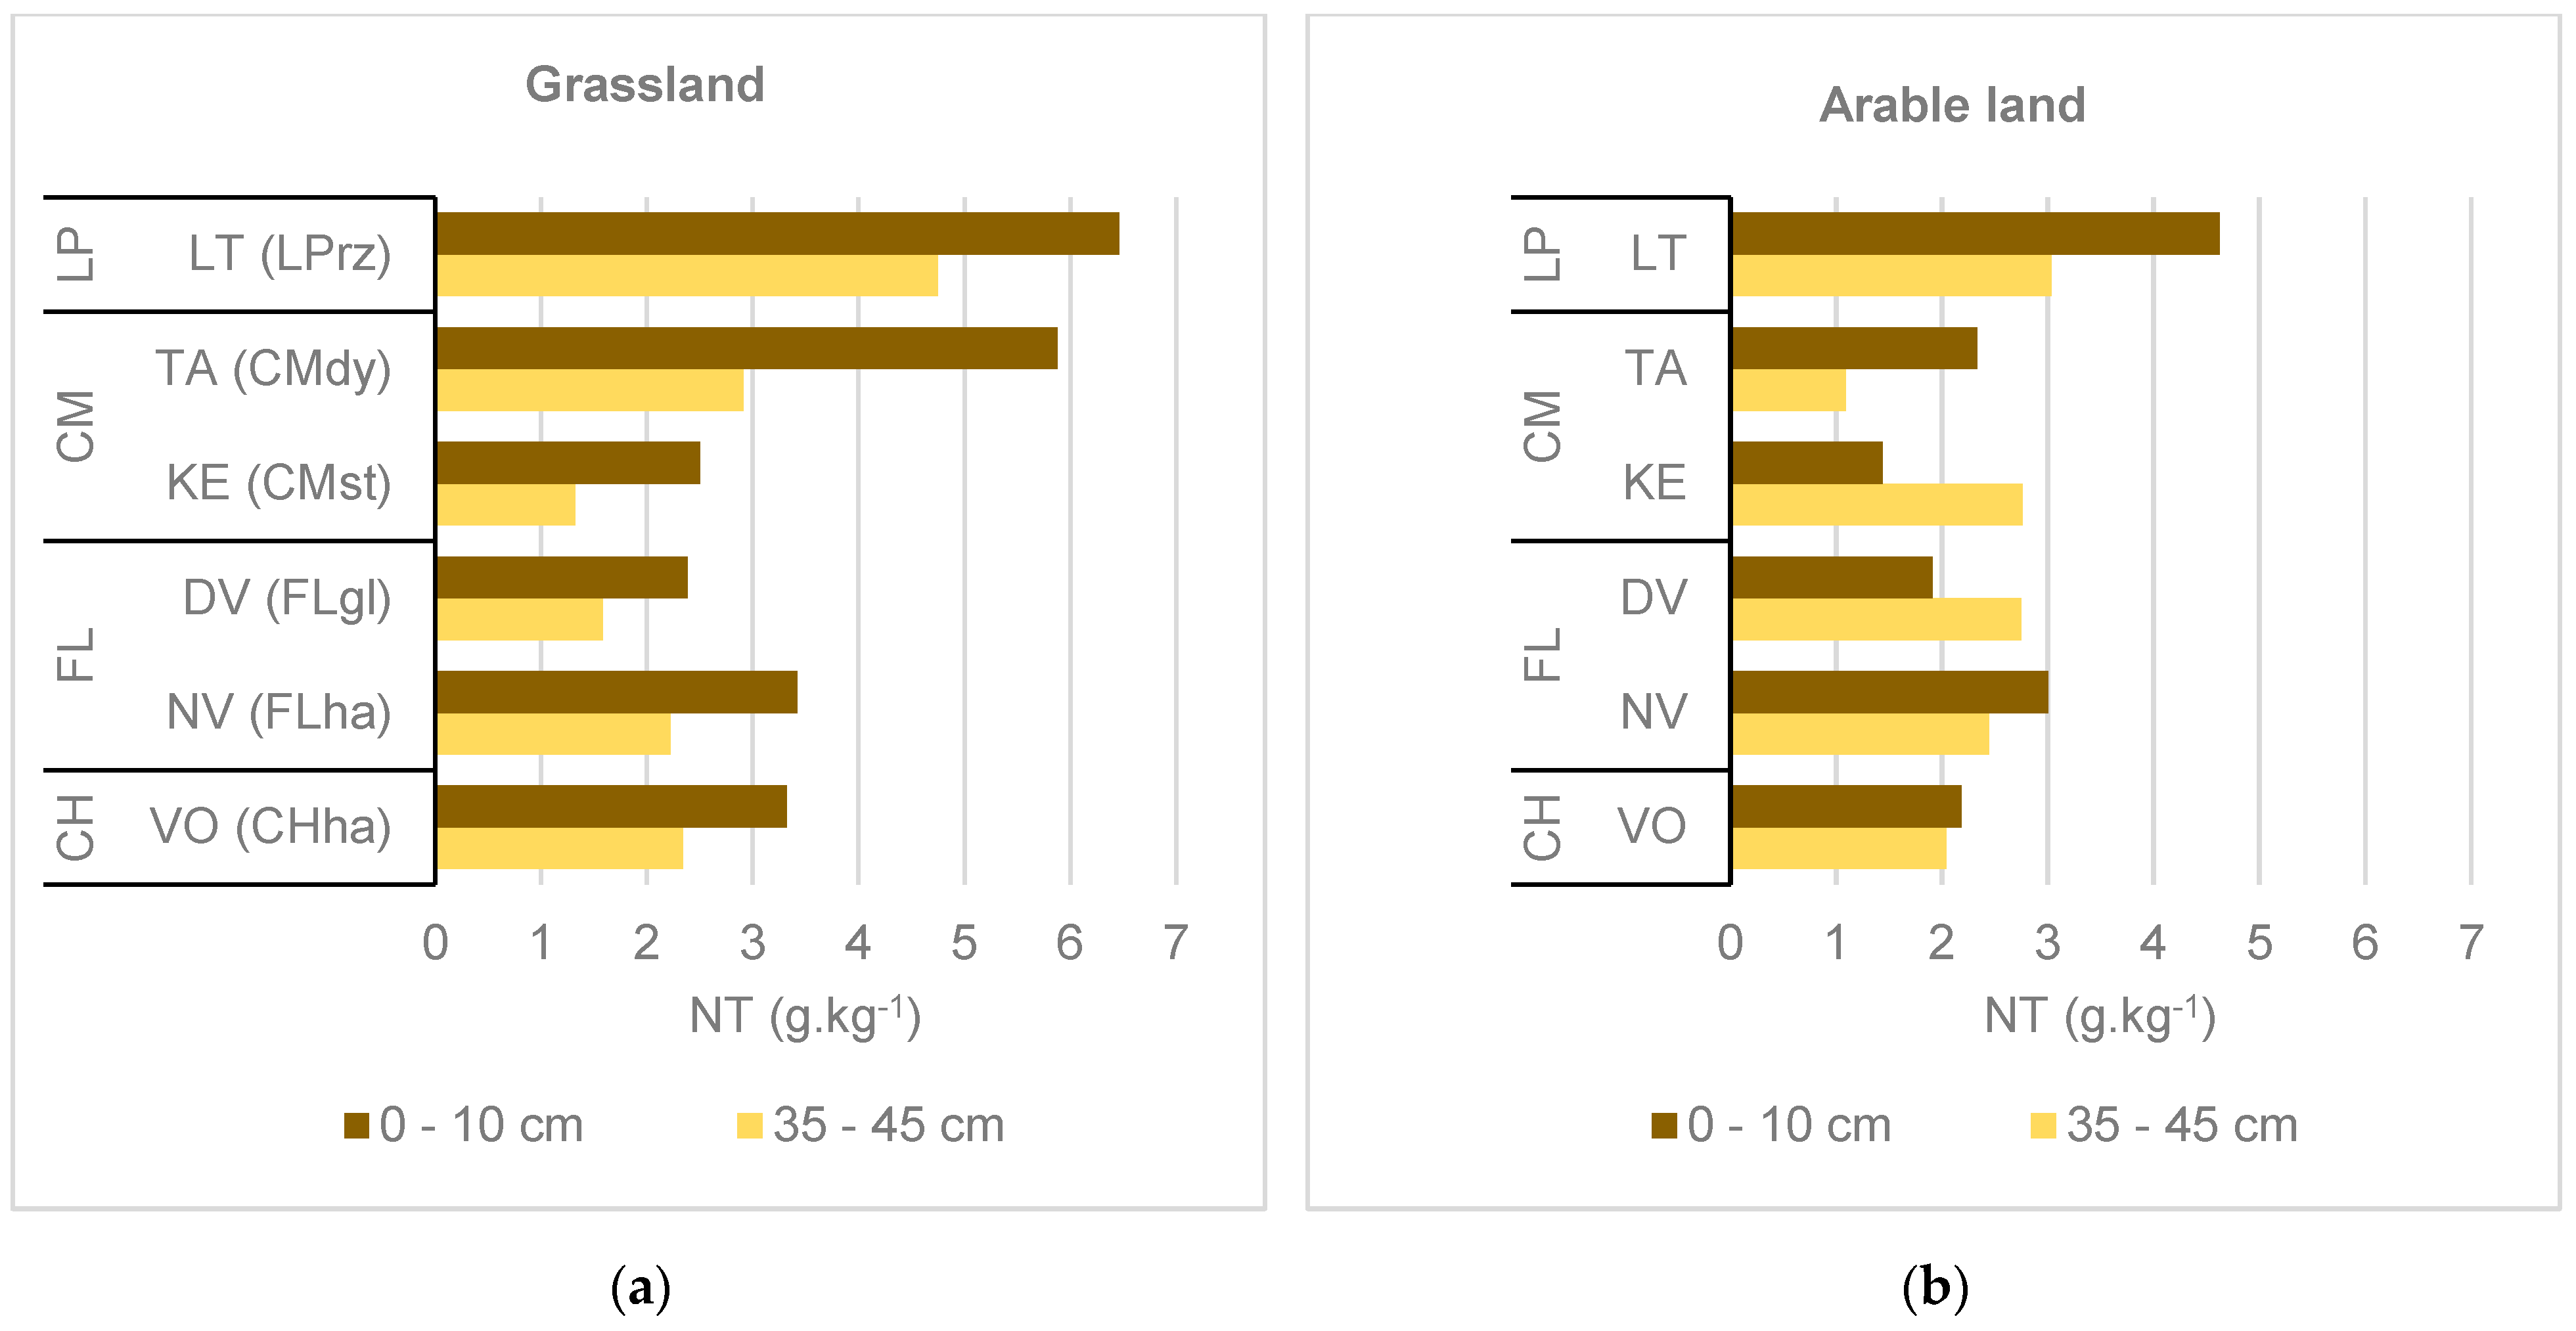
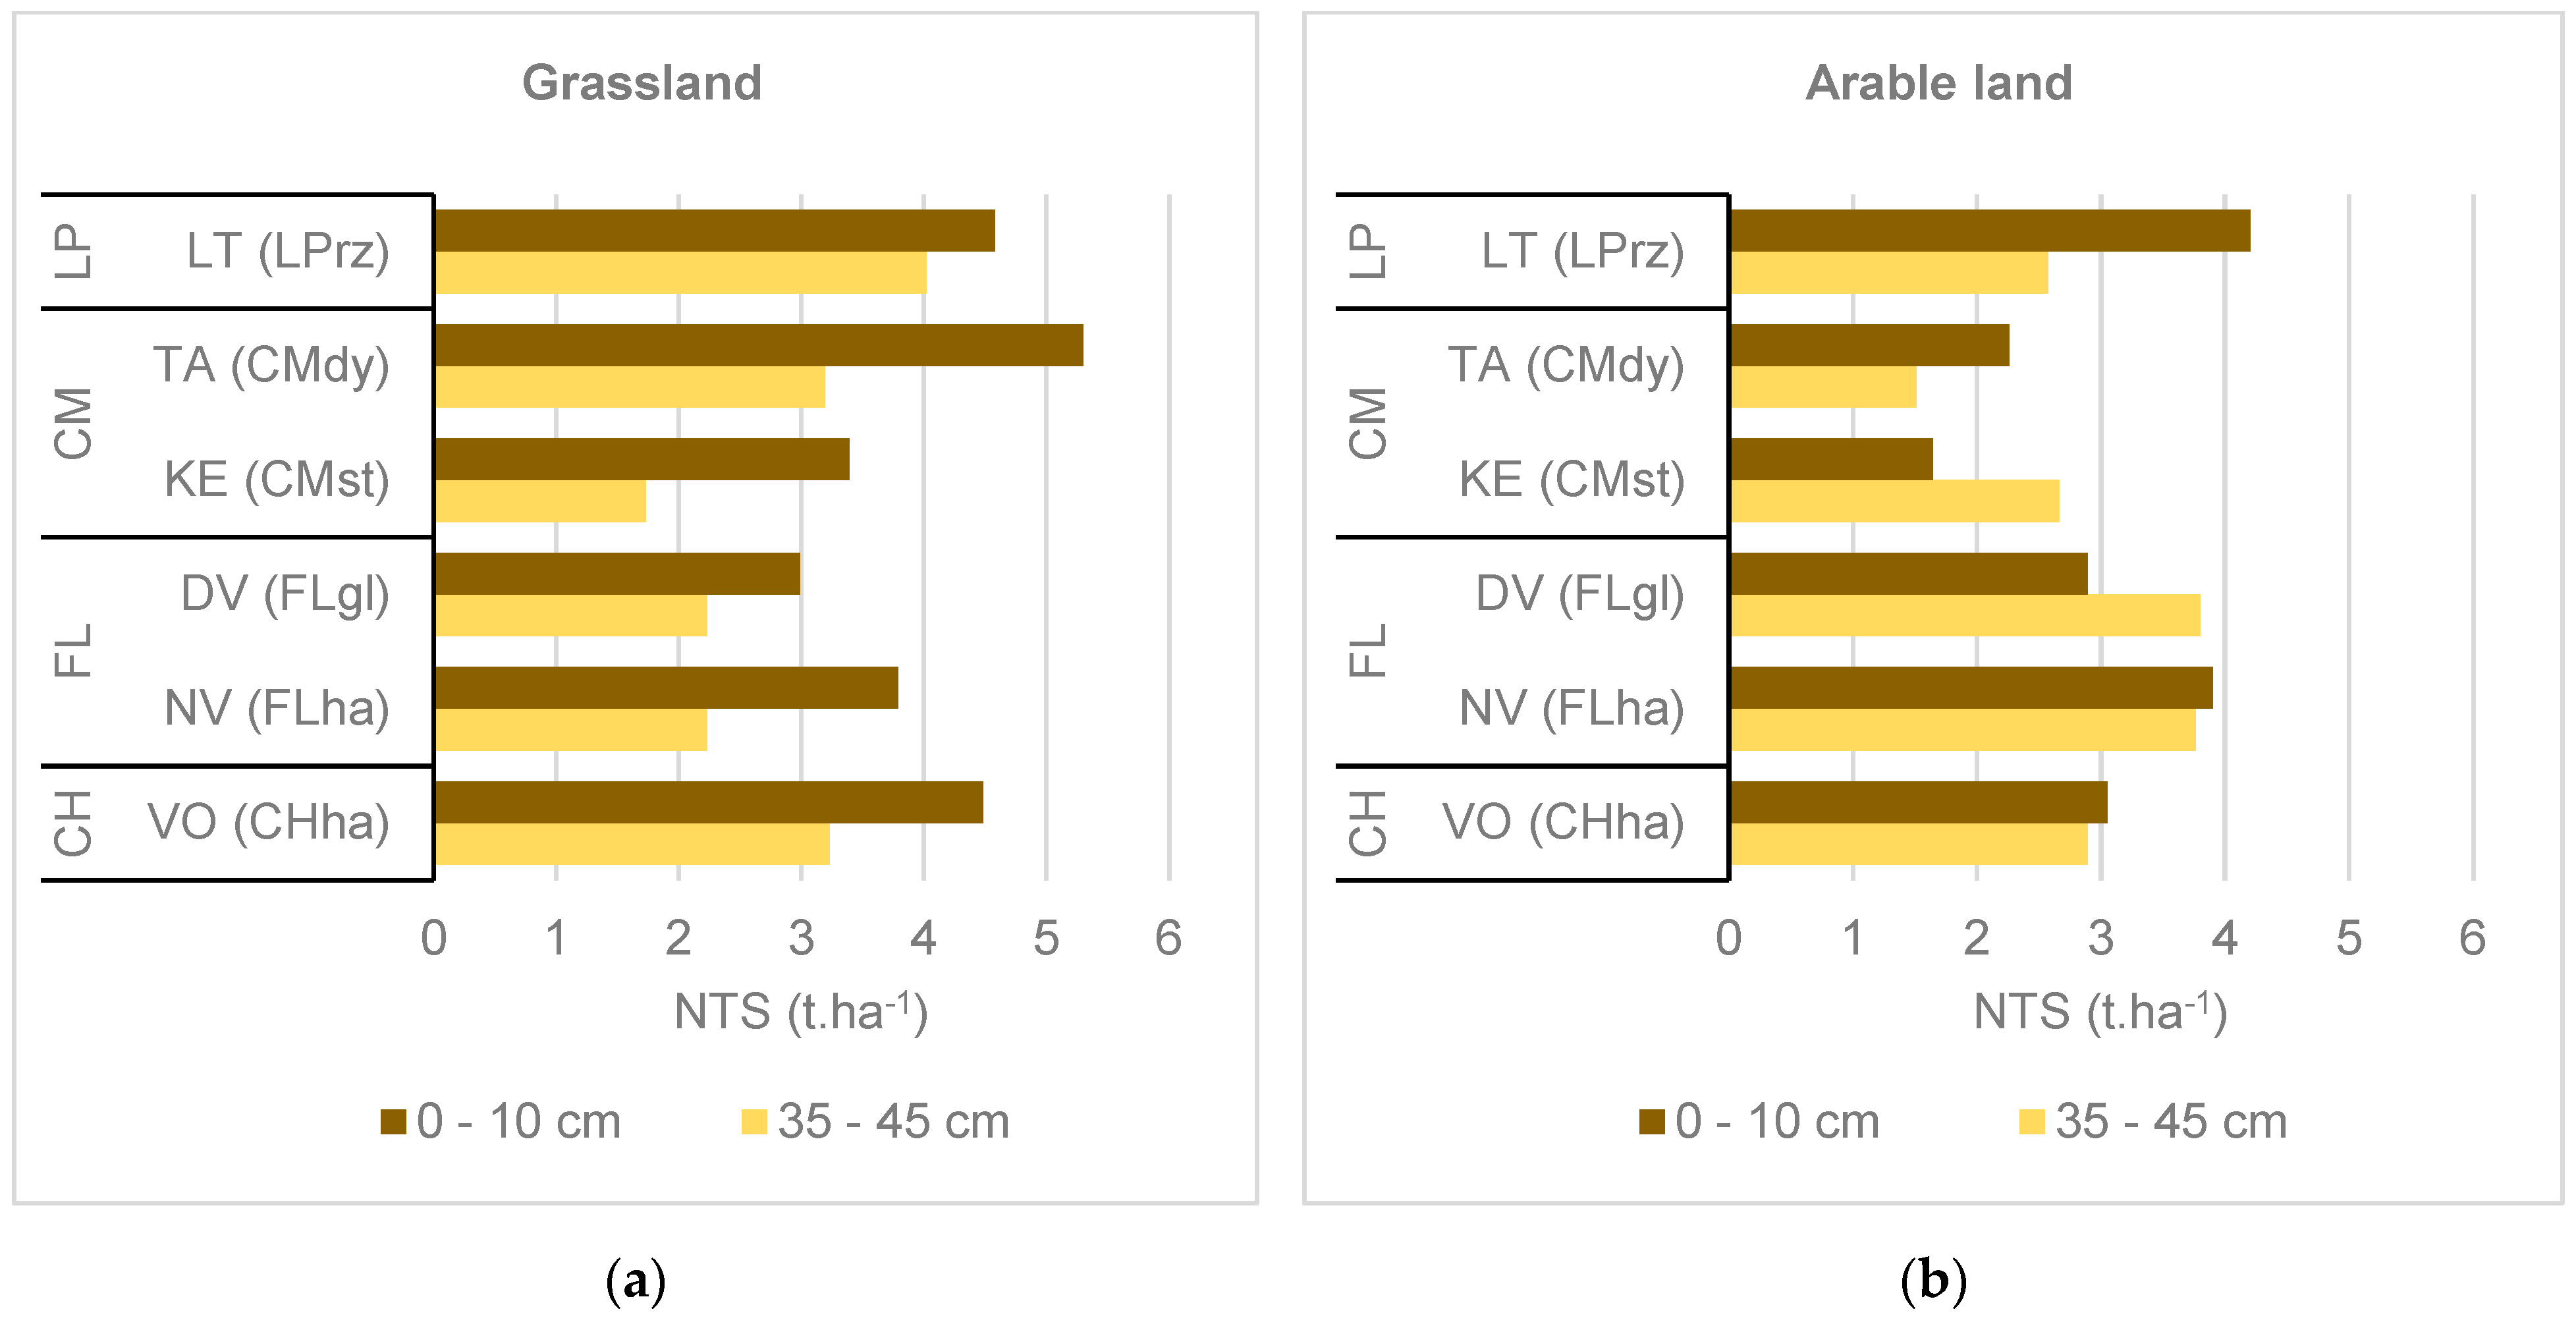
Figure 6 shows the NT content and Figure 7 shows NTS in different soil layers in grassland and arable land. In grassland, the soil NT content at the 0–10 cm depth varied from 2.38 g.kg−1 in DV (FLgl) to 6.46 g.kg−1 in LT (LPrz). At the depth of 35–45 cm, the soil NT content was lower by 26% in LT (LPrz) and by 50% in TA (CMdy). In arable land, the significantly highest NT content was observed in LPrz (4.36 g.kg−1). The soil NT content decreased with the depth in all sites except DV (FLgl) and KE (CMst). The mean soil NT content in arable land and grasslands was 2.21 g.kg−1 and 2.82 g.kg−1, respectively. Regarding the soil types in both soil depths in grasslands, FLs and CMst showed the significantly lowest NTS in comparison to CMdy, LP, and CH. At arable land, CMst showed the significantly lowest NTS and LPrz showed the highest topsoil NTS.
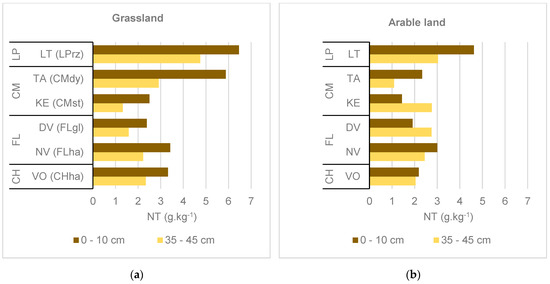
Figure 6.
Total nitrogen; (a) Grassland; (b) Arable land.
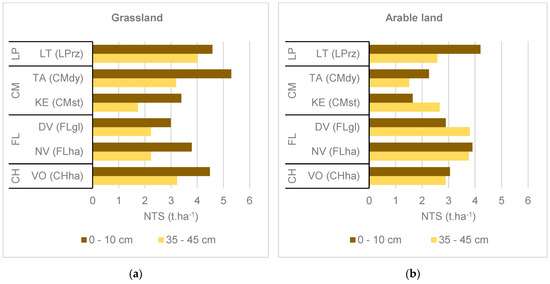
Figure 7.
Total nitrogen stock; (a) Grassland; (b) Arable land.
ANOVA showed highly statistically significant differences between the sites and the NT, and statistically significant differences between soil subtypes, soil depths, and NT. Statistically significant differences were also observed between soil depth and NTS. But NTS did not show any difference between soil subtype, land use, and sites (Table 3).
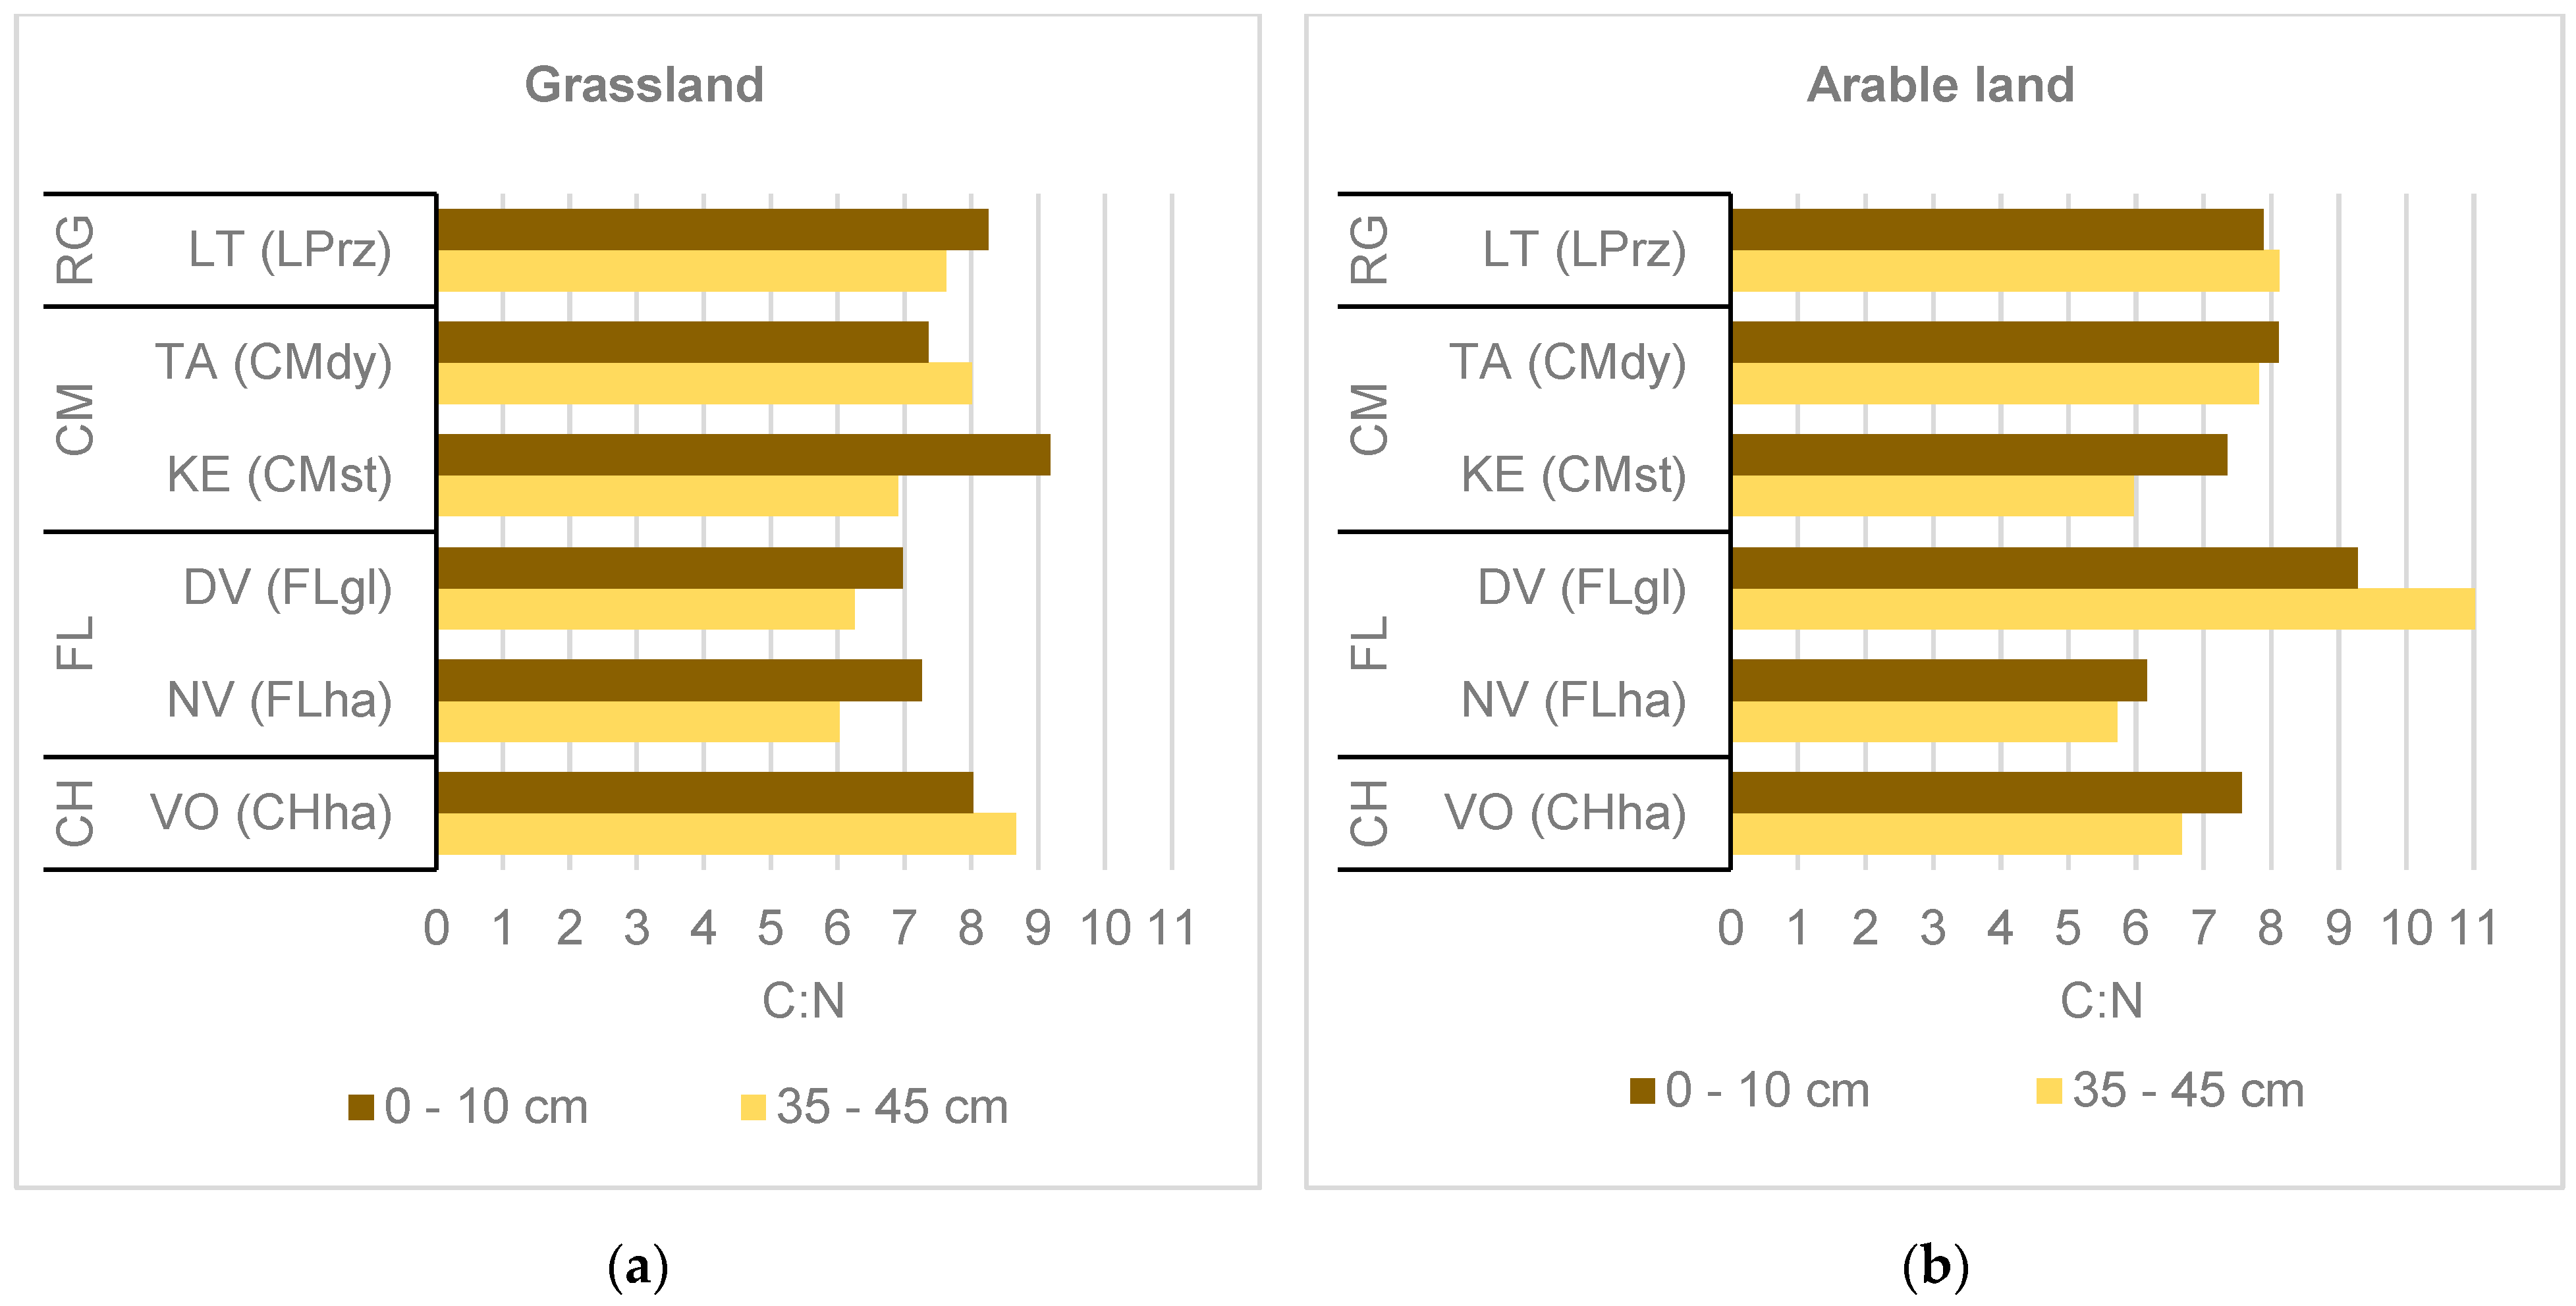
In grasslands, the topsoil C:N ratio ranged from 6.97 in DV (FLgl) to 9.18 in KE (CMst) and the mean soil C:N ratio was higher in grasslands compared to arable land (Figure 8). On average, LPrz and CHha had the highest soil C:N ratio. Concerning soil depth, soil C:N decreased with the soil depth in grasslands and arable land, except for grassland in TA (CMdy) and in VO (CHha), and arable land in DV (FLgl). However, the soil C:N did not exhibit significant change with the depth and did not significantly differ between sites and land use (Table 3).
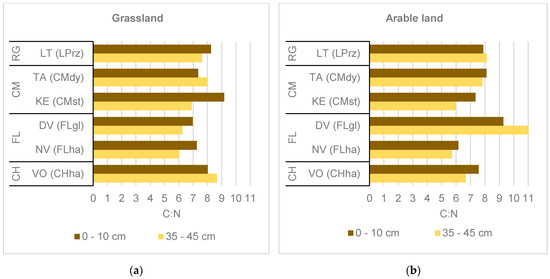
Figure 8.
Soil carbon to nitrogen ratio; (a) Grassland; (b) Arable land.
The correlation coefficient matrix for SOC, SOCS, NT, and NTS with the chemical parameters of the soil is shown in Table 4. The correlation analysis revealed that SOC and SOCS were strongly correlated with NT, NTS, C:N, and pH. SOC had a positive correlation with K, but no correlation was detected between SOC and P. Similarly, a very strong positive correlation was observed between SOCS and K. NT and NTS were strongly correlated with C:N, whereas C:N did not show any correlation with P and K. NT was not correlated with pH, whereas NTS was correlated with pH.
Table 4.
Pearson’s correlation coefficient matrix of SOC, SOCS, NT, NTS, and chemical properties of the soil.
4. Discussion
Our study showed that C and N stocks in Slovak soils are important and highly diverse at the same time. SOC content data are the basis for carbon stock assessment. In this study, an average SOC content at the depth of 0–10 cm in grasslands was roughly 30 g.kg−1, whereas in arable land, the SOC content was lower by 62%. The mean SOCS in arable land and grasslands was 79 t.ha−1 and 102 t.ha−1, respectively. Overall, in Slovak agricultural soils, topsoil SOC stock in the upper 0.3 m mineral soils ranged from 14 to 176 t. ha−1 [44]. The study of 24 grasslands and 30 croplands of the Swiss Soil Monitoring Network stated that the average SOC content at the soil depth of 0–20 cm varied from 30.80 g.kg−1 to 67.00 g.kg−1 [45], whereas the SOC content in cropland was approximately 50% lower and ranged from 11.90 g.kg−1 to 38.20 g.kg−1 [46]. In southeast Germany, grassland soil was stored as SOCS 118 t.ha−1, whereas a considerably lower stock of 90 t.ha−1 was found for cropland [47]. In comparison to arable land, grasslands were less depleted in SOC content [48]. Many other authors (e.g., [49,50]) confirmed that grasslands offer a bigger carbon stock than arable lands or forest lands. Despite grassland importance, its degradation is widespread and accelerating in many parts of the world [51]. Since 2000, its area has decreased by 5% [52].
The decrease in SOC content and SOCS in grasslands by depth showed the higher capacity of topsoil to store carbon. This can be explained by the concentration of a large proportion of grassland root biomass in the topsoil [53], the higher input of litter from permanent grass and forbs vegetation, and the livestock excrements into the soil [54].
The results of a UK study on SOC content in lowland woodland, grassland, and arable land [55] showed that the SOC content in the subsoil in grassland and arable land was similar. This is consistent with our study, where the SOC content in arable land and grassland at the depth of 35–45 cm in lowland sites in NV (FLha), DV (FLgl), and KE (CMst) was similar. The low subsoil SOC content in grassland could be explained by a higher mean annual temperature. Wu et al. [56] reported that subsoil SOC could respond more strongly to higher temperatures. In grasslands of the lowland site VO (CHha) and the mountainous site LT (LPrz), the SOC content at the depth of 35–45 cm was 46% and 43% higher, respectively, than in arable land. Moreover, the SOC content in upland grassland in TA (CMdy) with continuous sheep grazing was more than 2.12 times higher than that in arable land. Subsoil SOC content is considered to be stable, and higher compared to arable land. Grazing animals play an important role in SOC dynamics; in particular, grazing intensity is the major factor affecting subsoil SOC content and dynamics [55]. However, the relationship between the SOC content in depth soil, climate, and land use remains unclear and highly uncertain [57].
SOC stock is affected by many factors other than land use; for example, soil type, soil properties, vegetation, agricultural management, and environmental factors. Some authors [44,58] emphasize the relevance of the pedogenetic SOC approach instead of solely land use-based approaches, to evaluate C sequestration potentials and stock more accurately. We found differences in SOC stocks not only at the level of soil types, as many large-scale studies highlighted, e.g., [59,60], but also at the level of soil subtypes. In our study, in grasslands, the SOCS for a 50 cm deep soil profile ranged from 161 t.ha−1 in CHha to 59 t.ha−1 in FLgl, and from 111 t.ha−1 in CHha to 38 t.ha−1 in CMst in arable lands. Cambisols are the most abundant soil type in Slovakia. They, and in particular the CMdy soil subtype, are the main contributors to the stock of SOCs in grasslands. The soils of Chernozems and Leptosols, belonging to the group of mollic soils, although less abundant, are also good contributors. Among arable lands, Chernozem and Leptosol were found to have a higher carbon stock than Fluvisols and Cambisols. A different situation was observed by De Vos et al. [60] in forest soils where higher SOC stock was reported in Cambisols compared to Leptosols. Vanguelova et al. [61] reported the opposite situation with higher SOCS in Leptosols.
Our achievements revealed that other variables are also important. Climate and altitude are the other factors driving SOC content and SOC stock. A colder and wetter climate in higher altitudes favours SOC storage in grassland [62]. The SOC content in drier and lowland sites VO (CHha), NV (FLha), DV (FLgl), and KE (CMst) ranged from 15.68 g.kg−1 to 26.40 g.kg−1 and on average was 50% lower than the SOC content in cooler sites in the upland site TA (CMdy) and mountainous site LT (LPrz). However, this pattern was not found with arable land, where the SOC content at the depth of 0–10 cm in the cooler site TA with CMdy was similar to drier lowland sites with CMs, CHha, FLha, and FLgl. Significant SOC loss and lower SOC content were reported by several authors in cereal rotations without the inclusion of legume crops or fallow [63,64].
There is evidence that in addition to climate, grassland management can impact SOC content. A study from Ireland [65] reported that higher SOC contents and SOCS were associated with low management intensity with a stocking rate less than 1 LU.ha−1, without any chemical nitrogen input and pasture reseeding, or a very high management intensity stocking rate of 3 LU.ha−1, nitrogen input of 250 kg.ha−1, and pasture reseeding by a grass/legume mixture. In our study, SOC content in a reseeding pasture grazed by dairy cows in NV with FLha showed, at the 0–10 cm depth, higher SOC content and SOCS by 50% in comparison to an extensive meadow grazed by sheep in DV with FLgl.
Similar to SOCS, the highest NTS was found in the upland site TA (CMdy) with continuous sheep grazing showing a strong contribution of nutrients from sheep manure [64]. In grasslands, both NT content and NTS decreased with the soil depth. In arable land, higher NT content and NTS at the depth of 35–45 cm were found in DV (FLgl), and KE (CMst), which could be related to nitrate leaching from the topsoil [66]. A study from the USA reported the variability and uncertainty of NT content and NTS in the soil profile [67]. The TN content is directly influenced by soil organic matter [68]. The study of 3172 permanent monitoring points on Polish arable lands showed that the maximum TN content was found in the soils containing more than 20 g.kg−1 of SOC [69]. Similarly, in our study, the highest NTS was found in the upland site TA (CMdy) with continuous sheep grazing, where a strong contribution of nutrients was provided by sheep manure [65] and the highest SOCS value was registered.
The national monitoring of soils in Slovakia [44] showed that the content of plant-available K was optimal and ranged from 100 mg.kg−1 to 300 mg.kg−1. However, the content of plant-available P was low or suboptimal with a range from 10 mg.kg−1 to 60 mg.kg−1. The main reason for this was the cessation of the application of mineral fertilizers, particularly on grasslands. Our study supports these findings as the content of plant-available P in extensive grasslands was 1.44 mg.kg−1, 1.54 mg.kg−1, 3.90 mg.kg−1, and 4.95 mg.kg−1 in KE (CMst), TA (CMdy), LT (LPrz), and DV (FLgl), respectively. In our study, the content of plant-available K was sufficient [70] and no significant difference was found between arable land and grassland. In grassland, the highest concentration of plant-available K was found in NV (FLha) with oversown grazed pasture. Similar to our results, the study from the Kazova watershed [71] reported significantly higher plant-available K content in grazed pastures compared to arable land, fallow, orchards, and vegetable fields. The higher concentration of plant-available K in pastures in NV can be explained by intensive grazing and potassium returning via excrement to the soil [72]. Some authors [73,74] reported a positive relationship between plant-available K content, mean annual temperature, and clay content. However, in our study, there were not significant differences between lowland sites with higher mean annual temperatures and upland sites with lower mean annual temperatures.
The content of plant-available P was higher in arable land compared to grassland. However, the difference was not significant. Similarly, a study on phosphorus content in Slovak arable and mountain soils reported the higher content of plant-available P in arable land [75]. Regular agricultural management and phosphorus fertilization of arable land resulted in the higher content of plant-available P in the topsoil. The study of 83 datasets from 25 years of lysimeter experiments with different soil types, land use (crop land and grassland), and phosphorus fertilization showed that organic phosphorus fertilization up to 90 kg.ha−1 or mineral fertilization up to 60 kg.ha−1 resulted in a significant phosphorus accumulation on the topsoil [76]. The Central Control and Testing Institute in Agriculture in Slovakia [77] classifies the status of the plant-available P, according to the Mehlich 3 method, into five classes for arable land and grassland. For arable land, the content of the plant-available P of less than 50 mg.kg−1 and the content of 51 mg P. kg−1 to 85 mg P.kg−1 are evaluated as low and sufficient, respectively. For grassland, a low content of plant-available P is considered to be up to 30 mg P.kg−1, while a sufficient content ranges from 31 mg P.kg−1 to 65 mg P.kg−1. In our study, the content of plant-available P in extensive grasslands was low and resulted in values of 1.44 mg.kg−1, 1.54 mg.kg−1, 3.90 mg.kg−1, and 4.95 mg.kg−1 in KE (CMst), TA (CMdy), LT (LPrz), and DV (FLgl), respectively. Our results agree with findings of the soil monitoring of the Slovak Republic [43], which revealed that the content of plant-available P in grasslands was low. The main reason for this result can be attributed to the cessation of the application of mineral fertilizers, particularly on grasslands.
Interactions and mutual relations among soil properties can affect carbon and nitrogen storage as well. In addition, mutual interactions of C and N in the soil ecosystem are still unexplored and many questions remain open. The correlation analysis revealed correlations between SOCS and NTS. SOCS was also correlated with C:N, pH, P, and K. Parameters which influence SOC and NT storage are generally not independent from each other and are often correlated. The correlation analysis in this study revealed positive correlations between SOC, SOCS, and selected chemical properties such as NT, C:N, pH, P, and K. Similar results were found by Arunrat et al. [78,79] with pH, and Dong et al. [80] with NT. On the contrary, Zhou et al. [81] observed a negative correlation rate between SOC, NT, and pH. We observed the correlation between SOCs and NTS, similar to other studies [82,83]. C and N cycles are closely linked in soil through production and decomposition in the material cycle. However, no significant relationship was found by Bai et al. [84] between SOC and NT in the topsoil. They argue that the correlation between SOC and NT depends on many factors, including soil texture, temperature, and moisture. In addition, the content of SOC and TN in the soil is controlled by different groups of microorganisms [85]. In contrast to the topsoil, Bai et al. [83] found a positive correlation between SOC and TN in the subsoil. Plant nutrients like P and K showed also positive correlations with SOC and SOCS. Other authors [86,87] also found strong positive correlations between soil organic matter and available phosphorus or other phosphorus fractions.
Soils can play a role in climate regulation and can act as negative emission technologies, mainly in the sequestration of SOC [88]. Soil and crop management practices are important for creating a positive soil/ecosystem C budget. The emission of all GHG must be considered in addition to soil C to identify practices that are truly net CO2 sinks [89]. The European Green Deal and the Farm to Fork Strategy have established a new Carbon Farming Initiative [90] with the aim to support land managers in applying climate-friendly farming practices, and to maintain and enhance carbon pools in mineral soils. The current study has shown that the economic value of carbon storage (0–50 cm soil depth) in arable land ranges from EUR 2656/ha for Cambisols to EUR 7760/ha for Chernozems. In the case of grasslands, the economic value could reach EUR 11,257/ha depending on soil type, grassland management, and environmental conditions.
Our results point to the enormous importance of monitoring and evaluating C and N stocks not only in the topsoil, but also in the subsoil and, ideally, in the entire soil profile. Their formation is conditioned by their genesis, and, therefore, soil types and subtypes must also be taken into account when evaluating C and N stocks. From the point of view of land use, the importance of grasslands in carbon sequestration or nitrogen retention in the soil should be emphasized. In Slovakia, but also in other countries, grasslands should be included in the most appropriate soil management systems, both from the point of view of C and N sequestration, and because of the variety of ecosystem services they offer. Further research should focus on a more detailed study of the interactions and relationships between C and N as well as with other nutrients and soil characteristics.
5. Conclusions
This study provides further knowledge on carbon and nitrogen stocks in Slovakia’s soil and related management, and environmental factors influencing their accumulation and vertical distribution. SOCS for a 50 cm deep soil profile ranged from 161 t.ha−1 in CHha to 59 t.ha−1 in FLgl in grasslands, and in arable lands from 111 t.ha−1 in CHha to 38 t.ha−1 in CMst. Carbon stocks were affected not only by management intensity and environmental conditions, but also by soil depth, type, and subtype. Concerning soil nitrogen stocks, larger amounts were found in grasslands than in arable land. Higher NT content and nitrogen stock were found at the soil depth of 0–10 cm, but some variability and uncertainty of NTS between soil type, land use, and soil depth were found. The economic value of soil carbon storage for a 50 cm deep soil profile varied widely from EUR 2556/ha in CMst to EUR 7760/ha in CHha for arable land and from EUR 4115/ha in FLgl to EUR 11,257/ha in CHha for grasslands, respectively. This study reveals a need for further research on the impact of soil type, land use, and management intensity on SOC stocks, in particular with regard to the application of payments to Slovak farmers for the amounts of carbon sequestered in their agricultural soils. We have shown that carbon levels rule the form of nitrogen available in the different types of soil in arable lands and grasslands of Slovakia. Carbon and nitrogen are directly involved in a large variety of soil processes that are important for soil ecology needs, such as organic matter decomposition and formation, nitrogen fixation, the maintenance of food webs, and the supply of ecosystem services. This study is significant for the Slovak agriculture and could be innovative for scientists, farmers, and stakeholders operating in our country and possibly for others abroad.
Author Contributions
Conceptualization, M.K. and R.K.; methodology, M.K.; formal analysis, M.K., R.K., Ľ.J., J.Č., and Z.D.; investigation, M.K. and R.K.; data curation, R.K.; writing—original draft preparation, M.K. and R.K.; supervision, M.K.; project administration, R.K.; funding acquisition, R.K. All authors have read and agreed to the published version of the manuscript.
Funding
This research was funded by the Scientific Grant Agency of the Ministry of Education, Science, Research and Sport of the Slovak Republic, grant number VEGA 1/0184/21.
Data Availability Statement
The original contributions presented in the study are included in the article, further inquiries can be directed to the corresponding author.
Conflicts of Interest
The authors declare no conflicts of interest.
References
- Lal, R.; Monger, C.; Nave, L.; Smith, P. The role of soil in regulation of climate. Phil. Trans. R. Soc. B Biol. Sci. 2021, 376, 20210084. [Google Scholar] [CrossRef] [PubMed]
- Patton, N.R.; Lohse, K.A.; Seyfried, M.S.; Godsey, S.E.; Parsons, S.B. Topographic controls of soil organic carbon on soil-mantled landscapes. Sci. Rep. 2019, 9, 6390. [Google Scholar] [CrossRef] [PubMed]
- FAO. Land Use Statistics and Indicators 2000–2021. Global, Regional and Country Trends; FAOSTAT Analytical Briefs Series No. 71; FAO: Rome, Italy, 2023. [Google Scholar] [CrossRef]
- Janssens, I.A.; Freibauer, A.; Ciais, P.; Smith, P.; Nabuurs, G.-J.; Folberth, G.; Schlamadinger, B.; Hutjes, R.W.A.; Ceulemans, R.; Schulze, E.-D.; et al. Europe’s terrestrial biosphere absorbs 7 to 12% of European anthropogenic CO2 emissions. Science 2003, 300, 1538–1542. [Google Scholar] [CrossRef] [PubMed]
- Wiesmeier, M.; Hübner, R.; Barthold, F.; Spörlein, P.; Geuß, U.; Hangen, E.; Reischl, A.; Schilling, B.; von Lützow, M.; Kögel-Knabner, I. Amount, distribution and driving factors of soil organic carbon and nitrogen in cropland and grassland soils of southeast Germany (Bavaria). Agric. Ecosyst. Environ. 2013, 176, 39–52. [Google Scholar] [CrossRef]
- Wiesmeier, M.; Prietzel, J.; Barthold, F.; Spörlein, P.; Geuß, U.; Hangen, E.; Reischl, A.; Schilling, B.; von Lützow, M.; Kögel-Knabner, I. Storage and drivers of organic carbon in forest soils of southeast Germany (Bavaria)—Implications for carbon sequestration. For. Ecol. Manag. 2013, 295, 162–172. [Google Scholar] [CrossRef]
- Bai, Y.; Cotrufo, M.F. Grassland soil carbon sequestration: Current understanding, challenges, and solutions. Science 2022, 377, 603–608. [Google Scholar] [CrossRef]
- Sarkar, D.; Rakshit, A. Amalgamation of farmers’ bio-priming knowledge in integrated nutrient management for sustainable management of red cabbage soil under Middle Gangetic Plains, India. Environ. Manag. 2023, 72, 382–395. [Google Scholar] [CrossRef]
- Belay-Tedla, A.; Zhou, X.; Su, B.; Wan, S.; Luo, Y. Labile, recalcitrant, and microbial carbon and nitrogen pools of a tallgrass prairie soil in the US Great Plains subjected to experimental warming and clipping. Soil Biol. Biochem. 2009, 41, 110–116. [Google Scholar] [CrossRef]
- Banwart, S.A.; Black, H.; Zucong, C.; Gicheru, P.T.; Joosten, H.; Victoria, R.L.; Milne, E.; Noellemeyer, E.; Pascual, U. The global challenge for soil carbon. In Soi Carbon: Science, Management and Policy for Multiple Benefits; CABI: Wallingford, UK, 2014. [Google Scholar] [CrossRef]
- Rombel, A.; Krasucka, P.; Oleszczuk, P. Sustainable biocharbased soil fertilizers and amendments as a new trend in biochar research. Sci. Total Environ. 2022, 816, 151588. [Google Scholar] [CrossRef]
- Vitousek, P.M.; Howarth, R.W. Nitrogen limitation on land and in the sea: How can it occur? Biogeochemistry 1991, 13, 87–115. [Google Scholar] [CrossRef]
- Zeng, J.; Liu, X.; Song, L.; Lin, X.; Zhang, H.; Shen, C.; Chu, H. Nitrogen Fertilization Directly Affects Soil Bacterial Diversity and Indirectly Affects Bacterial Community Composition. Soil Biol. Biochem. 2016, 92, 41–49. [Google Scholar] [CrossRef]
- Chen, B.; Liu, E.; Tian, Q.; Yan, C.; Zhang, Y. Soil nitrogen dynamics and crop residues. A Review. Agron. Sustain. Dev. 2014, 34, 429–442. [Google Scholar] [CrossRef]
- Liu, J.; You, L.; Amini, M.; Obersteiner, M.; Herrero, M.; Zehnder, A.J.; Yang, H. A high-resolution assessment on global nitrogen flows in cropland. Proc. Natl. Acad. Sci. USA 2010, 107, 8035–8040. [Google Scholar] [CrossRef]
- Deng, X.; Ma, W.; Ren, Z.; Zhang, M.; Grieneisen, M.L.; Chen, X.; Fei, X.; Qin, F.; Zhan, Y.; Lv, X. Spatial and temporal trends of soil total nitrogen and C/N ratio for croplands of East China. Geoderma 2020, 361, 114035. [Google Scholar] [CrossRef]
- Corbett, D.; Wall, D.P.; Lynch, M.B.; Tuohy, P. The influence of phosphorus application and varying soil pH on soil and herbage properties across a range of grassland soils with impeded drainage. J. Agric. Sci. 2022, 160, 516–527. [Google Scholar] [CrossRef]
- Kovács, A.B.; Kremper, R.; Kátai, J.; Vágó, I.; Buzetzky, D.; Kovács, E.M.; Kónya, J.; Nagy, N.M. Characterisation of soil phosphorus forms in the soil-plant system using radioisotopic tracer method. Plant Soil Environ. 2021, 67, 367–375. [Google Scholar] [CrossRef]
- Khomenko, O.; Fenton, O.; Leahy, J.J.; Daly, K. Changes in phosphorus turnover when soils under long-term P management are amended with bio-based fertiliser. Geoderma 2023, 430, 116288. [Google Scholar] [CrossRef]
- Kayser, M.; Isselstein, J. Potassium cycling and losses in grassland systems: A review. Grass Forage Sci. 2005, 60, 213–224. [Google Scholar] [CrossRef]
- Dungait, J.A.J.; Hopkins, D.W.; Gregory, A.S.; Whitmore, A.P. Soil organic matter turnover is governed by accessibility not recalcitrance. Glob. Change Biol. 2012, 18, 1781–1796. [Google Scholar] [CrossRef]
- Lal, R. Digging deeper: A holistic perspective of factors affecting soil organic carbon sequestration in agroecosystems. Glob. Change Biol. 2018, 24, 3285–3301. [Google Scholar] [CrossRef]
- Tian, H.; Chen, G.; Zhang, C.; Melillo, J.M.; Hall, C.A.S. Pattern and variation of C:N:P ratios in China’s soils: A synthesis of observational data. Biogeochemistry 2010, 98, 139–151. [Google Scholar] [CrossRef]
- Yuan, Z.Y.; Chen, H.Y.H. Decoupling of nitrogen and phosphorus in terrestrial plants associated with global changes. Nat. Clim. Change 2015, 5, 465–469. [Google Scholar] [CrossRef]
- Tan, Q.; Wang, G.; Liu, X.; Hao, T.; Tan, W. Responses of soil organic carbon turnover to nitrogen deposition are associated with nitrogen input rates: Derived from soil 14C evidences. Environ. Pollut. 2018, 238, 500–507. [Google Scholar] [CrossRef] [PubMed]
- Chen, H.; Li, D.; Gurmesa, G.A.; Yu, G.; Li, L.; Zhang, W.; Fang, H.; Mo, J. Effects of nitrogen deposition on carbon cycle in terrestrial ecosystems of China: A meta-analysis. Environ. Pollut. 2015, 206, 352–360. [Google Scholar] [CrossRef] [PubMed]
- Nie, X.; Xiong, F.; Yang, L.; Li, C.; Zhou, G. Soil nitrogen storage, distribution, and associated controlling factors in the northeast Tibetan plateau shrublands. Forests 2017, 8, 416. [Google Scholar] [CrossRef]
- Guo, Y.; Jiang, M.; Liu, Q.; Xie, Z.; Tang, Z. Climate and vegetation together control the vertical distribution of soil carbon, nitrogen and phosphorus in shrublands in China. Plant Soil 2020, 456, 15–26. [Google Scholar] [CrossRef]
- Bibi, F.; Rahman, A. An Overview of Climate Change Impacts on Agriculture and Their Mitigation Strategies. Agriculture 2023, 13, 1508. [Google Scholar] [CrossRef]
- Dijkstra, F.A.; Pendall, E.; Morgan, J.A.; Blumenthal, D.M.; Carrillo, Y.; LeCain, D.R.; Follet, R.F.; Williams, D.G. Climate change alters stoichiometry of phosphorus and nitrogen in a semiarid grassland. New Phytol. 2012, 196, 807–815. [Google Scholar] [CrossRef]
- Wen, L.; Dong, S.; Li, Y.; Li, X.; Shi, J.; Wang, Y.; Liu, D.; Ma, Y. Effect of degradation intensity on grassland ecosystem services in the alpine region of Qinghai-Tibetan Plateau, China. PLoS ONE 2013, 8, e58432. [Google Scholar] [CrossRef]
- Liu, M.C.; Li, D.Q.; Luan, X.F.; Wen, Y.M. Ecosystem services and its value evaluation of Sanjiangyuan Region. J. Plant Resour. Environ. 2005, 14, 40–43. [Google Scholar]
- Kragt, M.E.; Pannell, D.J.; Robertson, M.J.; Thamo, T. Assessing costs of soil carbon sequestration by crop-livestock farmers in Western Australia. Agric. Syst. 2012, 112, 27–37. [Google Scholar] [CrossRef]
- Tobiášová, E. The effect of organic matter on the structure of soils of different land uses. Soil Tillage Res. 2011, 114, 183–192. [Google Scholar] [CrossRef]
- Tobiašová, E.; Lemanowicz, J.; Dębska, B.; Kunkelová, M.; Sakáč, J. The Effect of Reduced and Conventional Tillage Systems on Soil Aggregates and Organic Carbon Parameters of Different Soil Types. Agriculture 2023, 13, 818. [Google Scholar] [CrossRef]
- Vilček, J.; Koco, Š. Integrated index of agricultural soil quality in Slovakia. J. Maps 2018, 14, 68–76. [Google Scholar] [CrossRef]
- IUSS Working Group WRB. World Reference Base for Soil Resources. In International Soil Classification System for Naming Soils and Creating Legends for Soil Maps, 4th ed.; International Union of Soil Sciences (IUSS): Vienna, Austria, 2022; Available online: https://www.isric.org/sites/default/files/WRB_fourth_edition_2022-12-18.pdf (accessed on 1 December 2023).
- Nikitin, V.; Fishman, V. On the improvement of methods for determination of soil carbon. Chem. Agric. 1969, 3, 76–77. [Google Scholar]
- AOAC. Official Methods of Analysis, 17th ed.; AOAC: Washington, DC, USA, 2000. [Google Scholar]
- Mehlich, A. Mehlich 3 soil test extractant: A modification of Mehlich 2 extractant. Commun. Soil Sci. Plant Anal. 1984, 15, 1409–1416. [Google Scholar] [CrossRef]
- Klika, J.; Novák, A.; Gregor, A. Practical Lessons in Phytocenology, Ecology, Climatology and Soil Science; NCSAV: Praha, Czech Republic, 1954. (In Czech) [Google Scholar]
- Liu, W.; Chen, S.; Qin, X.; Baumann, F.; Scholten, T.; Zhou, Z.; Sun, W.; Zhang, T.; Ren, J.; Qin, D. Storage, patterns, and control of soil organic carbon and nitrogen in the northeastern margin of the Qinghai–Tibetan Plateau. Environ. Res. Lett. 2012, 7, 035401. [Google Scholar] [CrossRef]
- Trading Economics. EU Carbon Permits. Available online: https://tradingeconomics.com/commodity/carbon (accessed on 8 December 2023).
- Kobza, J.; Barančíková, G.; Makovníková, J.; Dodok, R.; Pálka, B.; Styk, J.; Širáň, M. Soil monitoring of the Slovak republic. In Current State and Development of Monitored Soils As a Basis for Their Protection and Future Use. Results of the National Monitoring System of Agricultural Soils for the Period 2013–2017 (5th Cycle); Soils Science and Conservation Research Institute: Bratislava, Slovakia, 2019; 254p. (In Slovak) [Google Scholar]
- Moll-Mielewczik, J.; Keel, S.G.; Gubler, A. Organic carbon contents of mineral grassland soils in Switzerland over the last 30 years. Agric. Ecosyst. Environ. 2023, 342, 108258. [Google Scholar] [CrossRef]
- Gubler, A.; Wächter, D.; Schwab, P.; Müller, M.; Keller, A. Twenty-five years of observations of soil organic carbon in Swiss croplands showing stability overall but with some divergent trends. Environ. Monit. Assess. 2019, 191, 277. [Google Scholar] [CrossRef]
- Wiesmeier, M.; Spörlein, P.; Geuß, U.; Hangen, E.; Haug, S.; Reischl, A.; Schilling, B.; von Lützow, M.; Kögel-Knabner, I. Soil organic carbon stock in southeast Germany (Bavaria) as affected by land use, soil type and sampling depth. Glob. Change Biol. 2012, 18, 2233–2245. [Google Scholar] [CrossRef]
- Tóth, G.; Jones, A.; Montanarella, L. The LUCAS topsoil database and derived information in the regional variability of cropland topsoil properties in the European Union. Environ. Monit. Assess. 2013, 185, 7409–7425. [Google Scholar] [CrossRef] [PubMed]
- Nadal Romero, E.; Rubio, P.; Kremyda, V.; Absalah, S.; Cammeraat, E.; Jansen, B.; Lasanta, T. Effects of agricultural land abandonment on soil organic carbon stocks and composition of soil organic matter in the Central Spanish Pyrenees. Catena 2021, 205, 105441. [Google Scholar] [CrossRef]
- Varnagirytė-Kabašinskienė, I.; Povilas, Ž.; Kęstutis, A.; Vidas, S.; Gintautas, U. Soil Organic Carbon Stocks in Afforested Agricultural Land in Lithuanian Hemiboreal Forest Zone. Forests 2021, 12, 1562. [Google Scholar] [CrossRef]
- White, R.P.; Murray, M.; Rohweder, M. Pilot Analysis of Global Ecosystems: Grassland Ecosystems; World Resources Institute: Washington, DC, USA, 2000. [Google Scholar]
- Bardgett, R.D.; Bullock, J.M.; Lavorel, S.; Manning, P.; Schaffner, U.; Ostle, N.; Chomel, M.; Durigan, G.; Fry, E.L.; Johnson, D.; et al. Combatting global grassland degradation. Nat. Rev. Earth Environ. 2021, 2, 720–735. [Google Scholar] [CrossRef]
- Jobbágy, E.G.; Jackson, R.B. The vertical distribution of soil organic carbon and its relation to climate and vegetation. Ecol. Appl. 2000, 10, 423–436. [Google Scholar] [CrossRef]
- Abdalla, M.; Hastings, A.; Chadwick, D.R.; Jones, D.L.; Evans, C.D.; Jones, M.B.; Rees, R.M.; Smith, P. Critical review of the impacts of grazing intensity on soil organic carbon storage and other soil quality indicators in extensively managed grasslands. Agric. Ecosyst. Environ. 2018, 253, 62–81. [Google Scholar] [CrossRef] [PubMed]
- Antony, D.; Collins, C.D.; Clark, J.M.; Sizmur, T. Soil organic matter storage in temperate lowland arable, grassland and woodland topsoil and subsoil. Soil Use Manag. 2022, 38, 1532–1546. [Google Scholar] [CrossRef]
- Wu, Y.; Guo, Z.; Li, Z.; Liang, M.; Tang, Y.; Zhang, J.; Miao, B.; Wang, L.; Liang, C. The main driver of soil organic carbon differs greatly between topsoil and subsoil in a grazing steppe. Ecol. Evol. 2022, 12, e9182. [Google Scholar] [CrossRef]
- Lorenz, K.; Lal, R. The depth distribution of soil organic carbon in relation to land use and management and the potential of carbon sequestration in subsoil horizons. Adv. Agron. 2005, 88, 35–66. [Google Scholar] [CrossRef]
- Grüneberg, E.; Schöning, I.; Kalko, E.K.V.; Weisser, W.W. Regional organic carbon stock variability: A comparison between depth increments and soil horizons. Geoderma 2010, 155, 426–433. [Google Scholar] [CrossRef]
- Batjes, N.H. Total carbon and nitrogen in the soils of the world. Eur. J. Soil Sci. 2014, 47, 151–163. [Google Scholar] [CrossRef]
- De Vos, B.; Cools, N.; Ilvesniemi, H.; Vesterdal, L.; Vanguelova, E.; Carnicelli, S. Benchmark values for forest soil carbon stocks in Europe: Results from a large scale forest soil survey. Geoderma 2015, 251–252, 33–46. [Google Scholar] [CrossRef]
- Vanguelova, E.I.; Nisbet, T.R.; Moffat, A.J.; Broadmeadow, S.; Sanders, T.G.M.; Morison, J.I.L. A new evaluation of carbon stocks in British forest soils. Soil Use Manag. 2013, 29, 169–181. [Google Scholar] [CrossRef]
- Hewins, D.B.; Lyseng, M.P.; Schoderbek, D.F.; Alexander, M.; Willms, W.D.; Carlyle, C.N.; Chang, S.X.; Bork, E.W. Grazing and climate effects on soil organic carbon concentration and particle-size association in northern grasslands. Sci. Rep. 2018, 8, 1336. [Google Scholar] [CrossRef] [PubMed]
- Carter, M.R.; Kunelius, H.T.; Sanderson, J.B.; Kimpinski, J.; Platt, H.W.; Bolinder, M.A. Productivity parameters and soil health dynamics under long-term 2-year potato rotation in Atlantic Canada. Soil Till. Res. 2003, 72, 153–168. [Google Scholar] [CrossRef]
- Liu, X.; Herbert, S.J.; Hashemi, A.M.; Zhang, X.F.; Ding, G. Effects of agricultural management on soil organic matter and carbon transformation-a review. Plant Soil Environ. 2006, 52, 531–543. [Google Scholar] [CrossRef]
- Cui, J.; Askari, M.S.; Holden, N.M. Grassland soil carbon and nitrogen stocks under temperate livestock grazing. Soil Res. 2015, 53, 485–493. [Google Scholar] [CrossRef]
- Wang, J.; Bai, J.; Zhao, Q.; Lu, Q.; Xia, Z. Five-year changes in soil organic carbon and total nitrogen in coastal wetlands affected by flow-sediment regulation in a Chinese delta. Sci. Rep. 2016, 6, 21137. [Google Scholar] [CrossRef]
- Smith, E.M.; Vargas, R.; Guevara, M.; Tarin, T.; Pouyat, R.V. Spatial variability and uncertainty of soil nitrogen across the conterminous United States at different depths. Ecosphere 2022, 13, e4170. [Google Scholar] [CrossRef]
- Ren, T.; Wang, J.; Chen, Q.; Zhang, F.; Lu, S. The effects of manure and nitrogen fertilizer applications on soil organic carbon and nitrogen in a high-input cropping system. PLoS ONE 2014, 9, e97732. [Google Scholar] [CrossRef]
- Kuśmierz, S.; Skowrońska, M.; Tkaczyk, P.; Lipiński, W.; Mielniczuk, J. Soil organic carbon and mineral nitrogen contents in soils as affected by their pH, texture and fertilization. Agronomy 2023, 13, 267. [Google Scholar] [CrossRef]
- FAO. Micronutrients. In Assessment at the Country Level; Soil Bulletin No. 63; FAO: Roma, Italy, 1990. [Google Scholar]
- Akbas, F.; Gunal, H.; Acir, N. Spatial variability of soil potassium and its relationship to land use and parent material. Soil Water Res. 2017, 12, 202–211. [Google Scholar] [CrossRef]
- Heller, S.; Müller, J.; Kayser, M.; Jensen, S. Status of plant-available potassium after 17 years of wet grassland restoration on a degraded minerotrophic peat Soil. Mires Peat 2021, 27, 1–14. [Google Scholar] [CrossRef]
- Madaras, M.; Koubová, M.; Smatanová, M. Long-term effect of low potassium fertilization on its soil fractions. Plant Soil Environ. 2014, 60, 358–363. [Google Scholar] [CrossRef]
- Pavlů, L.; Pavlů, V.; Gaisler, J.; Hejcman, M. Relationship between soil and biomass chemical properties, herbage yield and sward height in cut and unmanaged mountain hay meadow (Polygono–Trisetion). Flora Morphol. Distrib. Funct. Ecol. Plants 2013, 208, 599–608. [Google Scholar] [CrossRef]
- Barančíková, G.; Liptaj, T.; Prónayová, N. Phosphorus fractions in arable and mountain soils and their humic acids. Soil Water Res. 2007, 2, 141. [Google Scholar] [CrossRef]
- Rupp, H.; Meissner, R.; Leinweber, P. Plant available phosphorus in soil as predictor for the leaching potential: Insights from long-term lysimeter studies. Ambio 2018, 47, 103–113. [Google Scholar] [CrossRef]
- Brázová, I.M. Agronomic Criteria for the Evaluation of Agrochemical Analyses of Soil Bratislava; UKSUP: Bratislava, Slovakia, 2021; 12p, Available online: https://www.uksup.sk/storage/app/uploads/public/623/c53/603/623c536035b22491622155.pdf (accessed on 1 December 2023). (In Slovak)
- Arunrat, N.; Pumijumnong, N.; Hatano, R. Practices sustaining soil organic matter and rice yield in a tropical monsoon region. Soil Sci. Plant Nutr. 2017, 63, 274–287. [Google Scholar] [CrossRef]
- Arunrat, N.; Kongsurakan, P.; Sereenonchai, S.; Hatano, R. Soil organic carbon in sandy paddy fields of northeast Thailand: A review. Agronomy 2020, 10, 1061. [Google Scholar] [CrossRef]
- Dong, Z.; Li, H.; Xiao, J.; Sun, J.; Liu, R.; Zhang, A. Soil multifunctionality of paddy field is explained by soil pH rather than microbial diversity after 8-years of repeated applications of biochar and nitrogen fertilizer. Sci. Total Environ. 2022, 853, 158620. [Google Scholar] [CrossRef]
- Zhou, W.; Han, G.; Liu, M.; Li, X. Effects of soil pH and texture on soil carbon and nitrogen in soil profiles under different land uses in Mun River Basin, Northeast Thailand. PeerJ 2019, 7, e7880. [Google Scholar] [CrossRef]
- Dong, J.; Zhou, K.; Jinag, P.; Wu, J.; Fu, W. Revealing horizontal and vertical variation of soil organic carbon, soil total nitrogen and C:N ratio in subtropical forests of southeastern China. J. Environ. Manag. 2021, 289, 112483. [Google Scholar] [CrossRef] [PubMed]
- Melillo, J.M.; Butler, S.; Johnson, J.; Mohan, J.; Steudler, P.; Lux, H.; Burrows, E.; Bowles, F.; Smith, R.; Scott, L.; et al. Soil warming, carbon-nitrogen interactions, and forest carbon budgets. Proc. Natl. Acad. Sci. USA 2011, 108, 9508–9512. [Google Scholar] [CrossRef] [PubMed]
- Bai, J.; Ouyang, H.; Deng, W.; Zhu, Y.; Zhang, X.; Wang, Q. Spatial distribution characteristics of organic matter and total nitrogen of marsh soils in river marginal wetlands. Geoderma 2005, 124, 181–192. [Google Scholar] [CrossRef]
- Abubaker, J.; Cederlund, H.; Arthurson, V.; Pell, M. Bacterial community structure and microbial activity in different soils amended with biogas residues and cattle slurry. Appl. Soil Ecol. 2015, 72, 171–180. [Google Scholar] [CrossRef]
- Ahmed, W.; Jing, H.; Kaillou, L.; Qaswar, M.; Khan, M.N.; Jin, C.; Geng, S.; Qinghai, H.; Yiren, L.; Guangrong, L.; et al. Changes in phosphorus fractions associated with soil chemical properties under long-term organic and inorganic fertilization in paddy soils of southern China. PLoS ONE 2019, 14, e0216881. [Google Scholar] [CrossRef] [PubMed]
- Wulanningtyas, H.S.; Gong, Y.; Li, P.; Sakagami, N.; Nishiwaki, J.; Komatsuzaki, M. A cover crop and no-tillage system for enhancing soil health by increasing soil organic matter in soybean cultivation. Soil Tillage Res. 2021, 205, 104749. [Google Scholar] [CrossRef]
- Smith, P. Soil carbon sequestration and biochar as negative emission technologies. Glob. Change Biol. 2016, 22, 1315–1324. [Google Scholar] [CrossRef]
- Lal, R. A system approach to conservation agriculture. J. Soil Water Conserv. 2015, 70, 82A–88A. [Google Scholar] [CrossRef]
- European Commission. Technical Guidance Handbook—Setting Up and Implementing Result-Based Carbon Farming Mechanisms in the EU Executive Summary; Publications Office of the European Union: Luxembourg, 2022; 11p, Available online: https://data.europa.eu/doi/10.2834/056153 (accessed on 1 December 2023).
Disclaimer/Publisher’s Note: The statements, opinions and data contained in all publications are solely those of the individual author(s) and contributor(s) and not of MDPI and/or the editor(s). MDPI and/or the editor(s) disclaim responsibility for any injury to people or property resulting from any ideas, methods, instructions or products referred to in the content. |
© 2024 by the authors. Licensee MDPI, Basel, Switzerland. This article is an open access article distributed under the terms and conditions of the Creative Commons Attribution (CC BY) license (https://creativecommons.org/licenses/by/4.0/).