Abstract
Free trade zones represent an important system innovation space to realize economic agglomeration advantages with high-level openings. However, its evaluation of land intensive use has not received enough attention. The goal of this paper is to build a land use performance evaluation index system in line with the development trend of industrial economy and the characteristics of mixed land use in the free trade zones. An evaluation index system is constructed based on the three factors of land use status, land use efficiency and pilot free trade zone influence. Using the Delphi method and the entropy method, an empirical evaluation of the intensive land use level in the Shanghai Pilot Free Trade Zone is conducted. The results show the following: (1) integrating new indicators such as the free trade zone influence, social and ecological benefits into the evaluation index system show a characteristic and innovative land use evaluation; (2) in terms of the level of intensive land use, the Waigaoqiao Free Trade Zone has the highest intensity, followed by the Yangshan Free Trade Port Zone, and the Pudong Airport Comprehensive Free Trade Zone has the lowest intensity; and (3) development time, degree of land use, differences in leading functions, industrial land structures, and the diversification of employment structures are important factors that influence the differences in the levels of intensive land use in the Shanghai Pilot Free Trade Zone. This study also expands the performance evaluation of industrial land to the performance evaluation of construction land and provides references for industrial transformation and urban renewal of the Shanghai Pilot Free Trade Zone.
1. Introduction
The establishment of the Shanghai Pilot Free Trade Zone (SPFTZ) is a major strategic choice for complying with new trends in global economic governance, actively building new rules of international trade and investment, and striving to create new advantages in major international economic competition. It also represents a realistic need for exploring China’s new path of opening up to the outside; fostering new industries, ways of doing business and new modes; building a new platform of cooperation and development with other countries; broadening the space of economic growth. In addition, it also contributes to improving the quality of regional economic development and the level of intensive utilization of land [1,2,3,4,5]. Therefore, it is of great practical significance to carry out an evaluation of the intensive use of land in the SPFTZ.
Intensive land use assessments have achieved insights for the academic community, and the following notable progress has been made:
(1) From the perspective of evaluation scales, this type of assessment generally includes a macro evaluation (comprehensive evaluation of national, regional or urban intensive land use) [6,7,8,9,10,11,12,13,14,15], a medium evaluation (in fact, it is a classified evaluation or thematic evaluation of land use) [16,17,18,19], and a micro evaluation (enterprise and plot evaluation) [20,21,22,23,24]. From the macro perspective, intensive land use assessment focuses on status evaluations, policy discussions and impact factor analyses of industrial land use [8,25,26,27,28]. Among these, the evaluation results of intensive land use in development zones are extremely rich, and such studies are mainly based on the “Evaluation Procedures for Intensive Land Use in Development Zones” [29]. In recent years, the evaluation of the intensive use of industrial land at the micro level has gradually received more attention, it has mainly involved evaluations of potential intensive use of land by different industries and research on the influencing factors of the level of intensive use by industrial enterprises [9,11,13,14,16,17,22,23,24]. For example, Chen used Bayes methods to evaluate land use intensity in 365 typical industrial enterprises across nine manufacturing industries in Hubei, China and estimated the potentiality of enterprises with moderate and low intensive land use [22]. Zhang et al. discussed the influence of enterprise attributes, investment factors, economic and environmental factors and location factors on the level of intensive land use of industrial enterprises in different stages of industrialization [23].
(2) In terms of evaluation types and indicators, in the land intensive use evaluation of China’s development zones, the two types of industrial leading development zones and industry-city integrated development zones are distinguished according to the proportion of industrial land and residential land, and different indicator systems are adopted for evaluation [30]. For example, there are 10 evaluation indicators for the industrial leading development zones, i.e.: land supply rate, land completion rate, industrial land rate, comprehensive plot ratio, building density, comprehensive plot ratio of industrial land, building coefficient of industrial land, investment intensity of fixed assets in industrial land, average tax per unit of industrial land, and land vacancy rate. There are seven evaluation indicators for the industry-city integrated development zones, i.e., land supply rate, land completion rate, comprehensive plot ratio, building density, comprehensive average land tax, population density, and land vacancy rate.
(3) The evaluation method of land intensive use has also developed rapidly from the index system method at the initial stage to the production function method based on economic perspective and finally to data envelopment analysis (DEA), which evaluates land input and output efficiency at the same time [31]. Other commonly used methods include the limit condition method, fuzzy clustering analysis, principal component analysis (PCA), hierarchical analysis, multi-factor comprehensive evaluation, evaluation methods based on the pressure, state and response (PSR) model or the remote sensing images, stochastic frontier analysis, genetic algorithm, and BP neural network, etc. [32,33,34,35,36,37,38,39,40,41,42,43,44,45]. Based on the concept of sustainable intensification and ecological constraints, Qian et al. developed a sustainable intensification variable model to conduct a moderately intensive land use evaluation in Jinan City, China [46].
There are pros and cons of each method, and each has its own applicable object. The reasons of our methodological choice are as follows: (1) due to the small number of sample areas in this paper, methods that require large sample data (such as genetic algorithm and BP neural network) are not suitable for this study. (2) In the evaluation of intensive land use, the determination of ideal value is one of the difficulties. Fuzzy comprehensive evaluation needs to determine the ideal value, so it is not considered. (3) Generally speaking, evaluation methods can be divided into subjective evaluation (such as analytic hierarchy process and the Delphi method) and objective evaluation (such as principal component analysis and entropy evaluation method). The methodology we chose combines subjective evaluation (the Delphi method) with objective evaluation (entropy evaluation method), and this helps overcome the shortcomings of both.
(4) In terms of impacting factors of land intensive use, in addition to natural, economic, social and technological factors, scholars have begun to pay more attention to institutional, behavioural, organizational, ecological and policy factors. For instance, Shi and Huang analysed the relationship between land morphological characteristics and land-use intensity in Shanghai development zones [10]. Malherbe et al. examined the effect of intensive land use activities on loss to ecosystem services in South Africa [42]. Goertzen and Suhling investigated the effect of different landscapes (urban, agricultural or more natural landscapes) or land use intensity on biodiversity in Germany [47]. Basso studied the policy effect of the expansion of wine-growing areas on land use changes in Italy [48].However, the existing land intensive use evaluation index system of development zones is not completely applicable to the FTZ. (1) The existing development zones are dominated by industry, while the free trade zones are dominated by modern service industries. There are significant differences in their functional positioning, leading industrial structure and land use structure. Therefore, special attention should be paid to the characteristics and impact of the FTZ. (2) The selection of some evaluation indices still needs to be optimized. For example, existing indicators rarely take into account social benefits (such as employment density) and ecological benefits (such as energy consumption, water consumption, carbon emissions and pollutant emissions) [7,11,13,30]. (3) In the new era, in addition to land, labour and capital, technology, knowledge and other advanced elements in the free trade zones will become increasingly important and require more attention.
The goal of this paper is to build a land use performance evaluation index system in line with the development trend of industrial economy and the characteristics of mixed land use, and provide references for the future industrial transformation and urban renewal of the free trade zones. Compared with previous studies, the contributions of this paper are as follows: (1) it expands the performance evaluation of industrial land to the performance evaluation of construction land. This paper considers not only the industrial land but also the land for commercial services, public administration and public services; (2) it adds the evaluation indices reflecting social and ecological benefits, e.g., employee density and energy consumption per unit output value; and (3) it adds the evaluation indices reflecting the free trade zone influence, e.g., total trade and employment diversification index.
2. Construction of an Evaluation Index System
2.1. Evaluation Object and Purpose
The SPFTZ was officially established on September 29, 2013. The original SPFTZ covered four special customs supervision areas, including the Waigaoqiao Free Trade Zone (WFTZ), the Waigaoqiao Bonded Logistics Park (WBLP), the Yangshan Free Trade Port Zone (YFTPZ) and the Pudong Airport Comprehensive Free Trade Zone (PACFTZ), with a total area of 28.78 square kilometres. Although the SPFTZ was expanded to 120.72 square kilometres on December 28, 2014, the research scope of this paper will mainly focus on the original 28.78 square kilometres. Due to the small size of the WBLP and its proximity to WFTZ, this paper incorporates it into WFTZ (Table 1, Figure 1). The main features of the SPFTZ are innovations in systems and policies, investment and trade facilitation, mixed land use and the interactivity of regional development (the SPFTZ and the Independent Innovation Demonstration Zone). The purpose of the intensive land use evaluation of the SPFTZ is to construct a land performance evaluation index system that is in line with industrial and economic development trends and the characteristics of mixed land use in the pilot free trade zone and to conduct an empirical evaluation and analysis.

Table 1.
Overview of China (Shanghai) free trade zone (2013).
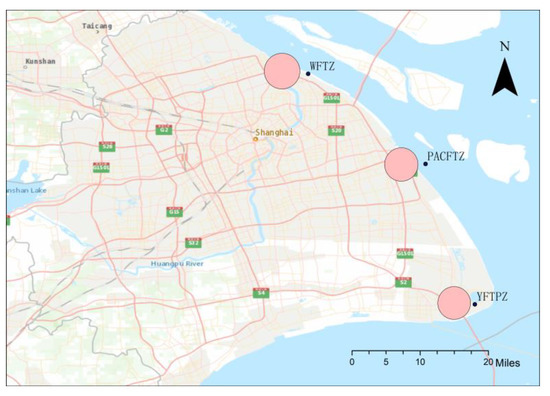
Figure 1.
Location distribution of the China (Shanghai) free trade zone.
2.2. Evaluation Index System
According to the “Evaluation Procedures for Intensive Land Use in Development Zones”, evaluation indices are usually selected based on land use structures, input intensity, output efficiency and management performance. The differences in management performance among the three parks are not significant, so this factor is not considered. In addition, to reflect industrial and economic development trends and the characteristics of mixed land use in the SPFTZ, this paper included the influence of the pilot free trade zone on the evaluation index system, giving consideration to both its expansion power and functional diversification. Therefore, the evaluation index system is mainly constructed based on three factors: land use status, land use efficiency and the influence of the pilot free trade zone (Table 2).
Table 2.
Evaluation index system of intensive land use in the SPFTZ.
3. Methods
3.1. Data Sources and Processing
Based on field investigations and interviews, we collected relevant basic data, as shown in Table 3. The base year of collecting the primary data was 2013.
Table 3.
Intensive land use in the SPFTZ evaluation indices data.
The data were pre-processed by summation standardization to eliminate a dimensional effect. The calculation formula is as follows:
The standardized data are shown in Table 4.
Table 4.
Standardized data.
3.2. Weight Determination
3.2.1. Subjective Weighting
The Delphi method was used to determine the weight of the evaluation indices. The Delphi method was first developed by O. Helm and N. Dalk in the 1940s and further developed by T. J. Gordon and the Rand Corporation (https://www.investopedia.com/terms/d/delphi-method.asp. accessed on 20 November 2018). It is an expert prediction method that overcomes the shortcomings of the expert meeting method. In the forecasting process, the experts do not know each other and do not communicate with each other, overcoming the disadvantage of experts not being able to fully express their opinions and of the opinions of authority figures influencing the opinions of others in the expert meeting method. On the basis of a system programme, the Delphi method uses an approach with anonymous comments that are not discussed among experts; experts can only be in a relationship with investigators; experts answer rounds of survey questionnaire questions; the results of the forecast are reached after consultation, induction, and repeated modification, and; finally when the opinions of the experts are basically identical. This method is representative and reliable. In this paper, 10 experts were invited from Tongji University, Shanghai Institute of Geological Surveys, Shanghai Municipal Planning and the Land and Resources Administration and were scored according to the importance of related targets, criteria and indicators. The calculation formula is as follows:
where is the weight of the ith target, criterion or indicator,is the score of the ith target, criterion or indicator given by expert j, and n is the total number of experts. According to the independent score results of 10 experts, the weight of each indicator was finally determined (Table 5).
Table 5.
Evaluation index weights based on the Delphi method.
3.2.2. Objective Weighting
In information theory, entropy is a measure of uncertainty. More information corresponds to less uncertainty and less entropy. The lower the amount of information is, the greater the uncertainty and the higher the entropy. According to the characteristics of entropy, the randomness and disorder degree of an event can be judged by calculating the entropy value, and the discretization degree of an index can also be judged by the entropy value. The greater the discretization degree of the index is, the greater the influence (weight) of the index on the comprehensive evaluation, and the lower the entropy value. Therefore, the weight of each index can be calculated according to the variation degree of each index by using the tool of information entropy, which provides a basis for the comprehensive evaluation of multiple indices [50,51]. Assuming that m objects are selected in the evaluation and that each object has n elements, the steps of the entropy method can be summarized as follows:
(1) Index standardization.
(2) Calculate the proportion of the ith element in the jth object in this index.
(3) Calculate the entropy of the jth target.
where
(4) Calculate the information entropy redundancy.
(5) Calculate the weight of each index.
The calculation results are shown in Table 6.
Table 6.
Evaluation index weights based on the entropy method.
3.2.3. Determine the Final Weight
The Delphi method of subjective weighting has some limitations in itself. Due to a lack of communication about ideas, there may be some subjective one-sidedness; it is easy to ignore the opinions of a few people, which may lead to the results of the forecast deviating from reality; additionally, there are many problems, such as the subjective influence of the organizers. However, the objective weighting also has some shortcomings: the weight is completely based on the data and lacks the subjective understanding of the real world. Therefore, this paper adopts both the subjective and objective methods to determine the final weight. The comprehensive weight is defined as follows:
where is the subjective weight, is the objective weight, and is the balance coefficient. In this paper, is determined to be 0.5.
The comprehensive weights are shown in Table 7.
Table 7.
Determination of comprehensive weights.
3.2.4. Calculate the Total Scores
The score of each indicator is calculated according to the following formula:
4. Results Analysis
The calculation results are shown in Figure 2. Based on the comprehensive score of land use intensity, WFTZ has the highest land use intensity, at 0.67, followed by WFTZ, at 0.22, and PACFTZ has the lowest intensity, at 0.11.
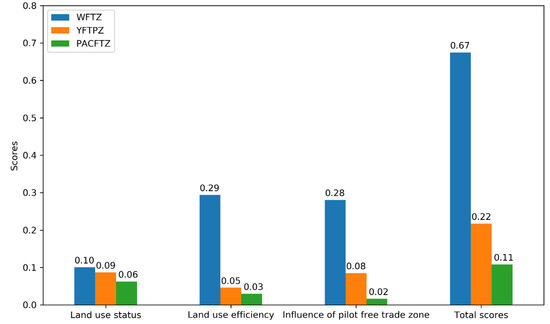
Figure 2.
Evaluation results of intensive land use in the SPFTZ.
From the perspective of land use status, the gap among the three functional areas is relatively small (Figure 2). Specifically, the three functional regions have little difference in the proportion of land used for commercial services, public management and public services (Table 3). There is also little difference in land supply rate and land completion rate between the WFTZ and the YFTPZ. The former were 88.06% and 80.77%, respectively. The latter were 95.10% and 94.84%, respectively (Table 3).
In terms of land use efficiency, the WFTZ is much higher than the YFTPZ and the PACFTZ (Figure 2). The main difference lies in social benefits rather than ecological effect. For example, the employee density in the WFTZ was 232.86 employees/ha, those in the YFTPZ and the PACFTZ were 16.73 employees/ha and 2.5 employees/ha, respectively (Table 3).
From the perspective of influence of pilot free trade zone, the WFTZ is also much higher than the YFTPZ and the PACFTZ (Figure 2). Specifically, the three functional regions have great differences in total trades and employment diversification indices (Table 3).
The main reasons for the above results are as follows:
(1) The development time and degree of land use vary. The WFTZ was established earliest (June 1990), land vacancy rate was lowest, 17.39%. The YFTPZ was established in June 2005, with a land vacancy rate of 24.46%. The PACFTZ was established latest (July 2009), and the land vacancy rate was highest, 64.02% (Figure 3a,b). However, there is no direct relationship between land use intensity and land use scale (Figure 3c).
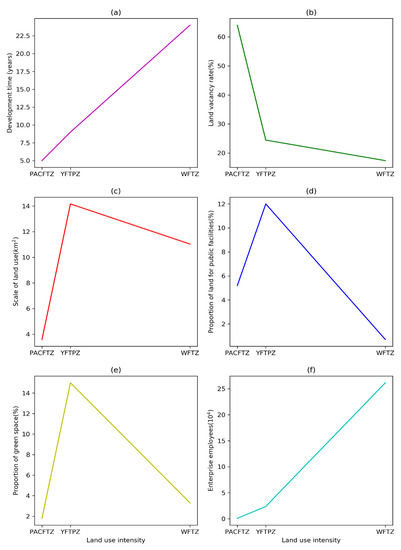
Figure 3.
Relationship between land use intensity and impacting factors in the SPFTZ. Notes: (a) The relationship between land use intensity and development times; (b) The relationship between land use intensity and land vacancy rate; (c) The relationship between land use intensity and scale of land use; (d) The relationship between land use intensity and proportion of land for public facilities; (e) The relationship between land use intensity and proportion of land for green space; (f) The relationship between land use intensity and enterprise employees.
(2) There are differences in the functional orientation and the development direction of the leading industries. The functional orientation of the WFTZ is to focus on the construction of international trade demonstration zones, with international trade, modern logistics and advanced manufacturing as the main development directions. Its employment density and total import and export volume are much higher than those of the other two bonded areas. The functional positioning of the YFTPZ is to build a global shipping service and a modern logistics function agglomeration zone with shipping services, international trade, financial services and professional services as the main development directions. The functional positioning of the PACFTZ is to build the core hub of first-class international airport logistics in the Asia-Pacific region, with the airport service, international trans-shipment trade and aircraft leasing industry as the main development directions. Different functional orientation leads to different layout patterns and output performance (Table 8).
Table 8.
Land use structure and functional layout in the SPFTZ (2013).
(3) Land use structure also has apparent differences. First, the proportion of industrial and warehouse land varies significantly. In the Waigaoqiao Bonded Zone (WBZ), industrial and warehouse land accounts for the highest proportion, at 62.5%; in the YFTPZ, land for common warehouses accounts for the highest proportion, at 25.7%, and industrial land accounts for only 6.6%, both together account for 32.3% of the total land area; in the PACFTZ, mixed land for warehouses and storage yards accounts for the highest proportion, at 46.1%, and mixed land for warehouses and industries accounts for 26.8%, both together account for 72.9% of the total land area (Table 8). Second, there are also obvious differences in the proportion of land for public facilities. The YFTPZ has the highest proportion, at 12%; followed by the PACFTZ, at 5.2%; and the WBZ has the lowest proportion, at 0.7% (Figure 3d). Third, the proportion of green space is also significantly different. The YFTPZ has the highest proportion, at 15%; followed by the WBZ, at 3.3%; and in the PACFTZ, land for railways and green land accounts for 1.8% (Figure 3e).
(4) Enterprise employees are 261,500 persons in the WFTZ, 23700 persons in the YFTPZ, and 900 persons in the PACFTZ. The number of enterprise employees is positively correlated with the level of intensive land use (Figure 3f).
On the whole, the intensity of land use in the SPFTZ has a positive relationship with the development time and number of employees, and a negative relationship with the land vacancy rate, but no obvious relationship with the scale of land use, the proportion of land for public facilities and for green space.
5. Discussion
FTZ is an important system innovation space to realize economic agglomeration advantage with high level opening. Previous studies on FTZ mainly focused on the institutional and policy innovation, financial internationalization, investment facilitation, trade liberalization, industrial transformation and business environment optimization, although insufficient attention was paid to the land intensive use of FTZ [1,2,3,4,5,52,53,54,55,56]. This paper quantitatively evaluates and analyses the intensive use of land in the SPFTZ, aiming to provide references for its industrial transformation and urban renewal.
There is obvious inadaptability in applying the national unified land intensive use evaluation regulations of development zones to SPFTZ. First, this regulation focuses on the evaluation of intensive use of industrial land while ignoring the evaluation of land use for service industry. Second, most of the previous studies considered the indicators of land use structure, land use intensity, land input and land output [7,9,11,13,14,21,22], or land use status, land use efficiency and management performance [30], but some key indicators such as human capital input and ecological efficiency are ignored. Third, the characteristics and influence of the SPFTZ have not been given special attention. Compared with previous studies, first, this paper expands the performance evaluation of industrial land to the performance evaluation of construction land. It considers not only the industrial land but also the land for commercial services, public administration and public services. Second, it adds the evaluation indices reflecting social and ecological benefits, e.g., employee density and energy consumption per unit output value. Third, it adds the evaluation indices reflecting the free trade zone influence, e.g., total trade and employment diversification index.
The land use intensity of the WFTZ is much higher than that of the YFTPZ and the PACFTZ in our study. This estimation result is basically consistent with the evaluation result of land intensive use in national development zones [30] and Shanghai development zones [9,57,58]. Although there are differences in evaluation indices between the two, the ranking of the obtained results is consistent on the whole. In their comprehensive ranking of the land intensive use evaluation results of 349 industry-oriented development zones nationwide, the WFTZ ranked 17th, while the YFTPZ and the PACFTZ ranked 312th and 323rd, respectively [30]. In Peng and Zeng’s evaluation results, the WFTZ ranked second, while the PACFTZ ranked 19th, the YFTPZ ranked 20th [57]. In Shi and Huang’s evaluation results, the WFTZ ranked second, while the YFTPZ ranked 16th, the PACFTZ ranked 20th [9]. In Gu’s evaluation results, the WFTZ ranked first, while the YFTPZ ranked 21st, the PACFTZ ranked 26th [58].
In general, the land output efficiency of the SPFTZ is relatively low. On the one hand, restricted by industrial function positioning and business costs and dominated by traditional logistics and processing industries, the WFTZ is experiencing slow economic growth, a continuous decline in its industrial output value and a significant trend of manufacturing industry transfer. Before the SPFTZ was established, the total industrial output value of WFTZ at the end of 2012 was 72.778 billion yuan RMB. After the listing, by the end of 2013, the total industrial output value was reduced to 64.56 billion yuan RMB, which is down 11.29% compared with the previous year. Indeed, with the decline in the total industrial output value of WFTZ year by year, the status of the tertiary industry tends to improve, which is also one of the changes brought on by the land policy. On the other hand, the average industrial output value of WFTZ in 2013 was only 5.749 billion yuan RMB/km2, which was lower than the average output of the Shanghai development zone’, namely, 6.776 billion yuan RMB/km2 in that year. According to our calculations, the land area in the WFTZ with a plot ratio lower than 1.17 is 496.93 hectares, accounting for 53.57% of the completed urban area in the WFTZ. The building area that can be expanded by improving the plot ratio is 2.62449 million square metres. The land area of YFTPZ with a building density of less than 9.23% is 27.896 hectares, accounting for 2.61% of the completed urban area in the YFTPZ. The building base area that can be expanded by increasing building density is 14,000 square metres. Thus, the potential of land development and intensive utilization is still great in the SPFTZ.
In addition, compared with the free trade zones in developed countries such as Singapore, the land use efficiency of SPFTZ is also lower. Take Changyi FTZ of Singapore and PACFTZ of Shanghai as examples. In 2013, the former had a land area of only 0.73 square kilometres, with a total revenue of 2.84 billion dollars, an average land revenue of 3.89 billion dollars/square kilometres, and an average employee density of 27,397 people/square kilometres. The latter had a land area of 3.59 square kilometres, with a total operating income of only 437 million dollars, a land average operating income of only 122 million dollars/square kilometres, and a land average employed population of 251 people/square kilometres. The gap and potential of land use efficiency are great in the PACFTZ.
Both the development models of Singapore FTZ and SPFTZ are the interactive development models of FTZ and international financial and shipping centres. The successful experience of Singapore is worth learning from Shanghai. First, the superior geographical location and high-quality human resources provide a strong guarantee for the industrial transformation and upgrading of the FTZ. Second, proper functional positioning and reasonable industrial policies consolidate the leading edge of the FTZ. Third, a quality business environment has promoted the linkage between the FTZ and international financial and shipping centres. Therefore, accelerating the introduction of high-quality talents, improving the industrial policy and land use policy, and further optimizing the business environment are key measures for the sustainable development of SPFTZ.
6. Conclusions and Policy Implications
In this paper, an evaluation index system of land intensive utilization is constructed based on three factors: land use status (including input degree), land use efficiency, and pilot free trade area influence. The land intensive utilization of the three major functional areas (WFTZ, YFTPZ, and PACFTZ) was evaluated by means of quantitative evaluation index. This evaluation index system had the following characteristics: (1) in addition to industrial land, land for commercial services, public administration and public services were also considered; (2) the evaluation index system gives consideration to the comprehensive benefits such as economic benefit, social benefit and ecological benefit; and (3) evaluation indices reflecting the influence of the pilot free trade zones were added.
The evaluation results show that: (1) the level of intensive land use in the WFTZ is relatively high, while the level of intensive land use in the YFTPZ and PACFTZ is relatively low, and; (2) development time, land use intensity, differences in leading functions, industrial land structure, and diversification of the employment structure are important factors that lead to differences in the level of intensive land use. Overall, the three functional areas (WFTZ, YFTPZ, and PACFTZ) show clear unbalanced development in terms of their development degree, development level and output performance.
Land for industry and warehouses accounts for most of the SPFTZ, especially in the WFTZ and YFTPZ; industrial and warehouse land accounts for 74.28% and 49.83%, respectively, of the construction land that has been developed. Although this finding is in line with the initial functional positioning requirements (mainly international logistics and processing) of the free trade zone, it leads to the disadvantages of focusing on industrial functions and insufficient urban functions. These adverse effects occur because industrial parks built far from old cities and communities lead to practical difficulties such as “living space development lags behind the production space development, city construction lags behind the industrial development, the development of social undertakings lags behind economic growth”. Therefore, it is an urgent practical task to adjust and optimize the structure of land use; to rationally organize the layout of industrial parks, business districts and residential areas; and to build a comprehensive and innovative community that integrates multiple urban functions such as work, residence, business, entertainment, culture and rest and that alleviates the commuter pressure caused by the separation of employment and residence.
The land resources urgently needed for industrial development in the SPFTZ cannot be obtained only by relying on land development increments. Instead, the existing land stock resources of the SPFTZ should be fully considered, and inefficient industries should be eliminated by land performance assessments in time to make room for the development of new and more efficient industries. Especially in the Waigaoqiao Bonded Area, the land stock supply was 14.07 hectares by the end of 2013. Promoting the transformation of the existing industrial land into a composite utilization of “industry + R&D + business office + exhibition” has the potential not only to expand the function of land use and optimize the regional social spatial structure but also to help improve the intensity and efficiency of land development.
Because a single park was developed first, and the integration and listing of the land in the SPFTZ came after, this outcome inevitably brought about the separation of spatial layouts: it was easier to create a pattern of separate development that was not conducive to the interactive development of industries, elements, and functions of each block within the pilot free trade zone, as well as the integrated development of space, which has affected the interactive development of the “three ports” (the seaport, the airport and the information port) and the interactive integrated development of Shanghai’s international trade, financial, economic and shipping centres. Therefore, it is necessary to promote the industrial integration, functional coupling and spatial integration development of the SPFTZ with a broader mindset and at a higher level to further improve the quality and efficiency of its development.
It is a new trend for the future development of SPFTZ to transform from a traditional manufacturing-oriented park to a modern service-oriented park and from extensive use to intensive use and mixed use of land. Therefore, future studies should focus on the following aspects: (1) assessment of the potential of land intensive use in the SPFTZ. Land supply potential, expansion potential, structural potential, strength potential and economic potential are estimated from the micro scale (i.e., plot level or industrial block level). (2) Research on mixed land use patterns and transformation paths. (3) Research on the relationship between land policy innovation and land intensive use. It should be pointed out that, due to the differences in industry characteristics and dominant functions of the three study regions, therefore, in further perfecting the evaluation index system, the following issues need attention: (1) in the measurement of the intensity of land use, “comprehensive plot ratio” can be chosen as an evaluation index in the WFTZ, but in the YFTPZ and PACFTZ, “building density” should be selected as an evaluation index. (2) In the measurement of land input, “land area per capita for service industry” can be chosen as an evaluation index in the WFTZ, but in the YFTPZ and PACFTZ, “land area per capita for shipping and logistics” should be selected as an evaluation index. (3) The "supply of stock land" can also be included in the evaluation index system, which can be used to assess the efficiency of land recycling and indirectly measure the potential of urban renewal.
Author Contributions
All authors contributed to the work in this paper. Conceptualization, Y.S.; methodology, L.Z.; software, X.C.; investigation, L.Z. and Y.S.; data curation, X.C.; writing—original draft preparation, Y.S., L.Z. and X.C.; writing—review and editing, Y.S.; visualization, X.C.; supervision, Y.S.; project administration, L.Z.; funding acquisition, Y.S.
Funding
This paper was funded by the one of key projects of the state key research and development program (2017YFA0603102) and the one of tender research projects from Shanghai Institute of Geological Surveys (2014(D)-177(F)-03).
Acknowledgments
The authors are grateful to the project funding body, the editor and three anonymous reviewers for their valuable comments and suggestions.
Conflicts of Interest
The authors declare no conflicts of interest.
References
- Zhao, X.L. Shanghai Urban Economic and Management Development Report in 2014; Shanghai University of Finance and Economics Press: Shanghai, China, 2014. (In Chinese) [Google Scholar]
- Wang, B. Employment in China (Shanghai) Pilot Free Trade Zone. Chin. Econ. 2017, 50, 266–273. [Google Scholar] [CrossRef]
- Meng, G.W.; Wang, Y.H.; Du, M.M. The development course and enlightenment of Shanghai free economic zone. Econ. Geogr. 2018, 38, 1–10. (In Chinese) [Google Scholar]
- Huang, D.; Neequaye, E.N.; Banahene, J.; Van, V.T.; Fynn, S. A comparative analysis of effective free trade zone policies in Ghana: A model from Shanghai Free Trade Zone. Open J. Bus. Manag. 2018, 6, 900–922. [Google Scholar] [CrossRef]
- Shahnoori, P.; Jenkins, G.P. The value of online banking to small and medium-sized enterprises: Evidence from firms operating in the uae free trade zones. Appl. Econ. 2019, 51, 4046–4055. [Google Scholar] [CrossRef]
- Salvador, D.S.S.; Leandro, G.M. Public provision versus private provision of industrial land: A hedonic approach. Land Use Policy 2004, 22, 215–223. [Google Scholar]
- Chen, Y.; Huang, X.J.; Chen, Z.G.; Wu, X.J.; Guo, Y.H. Study on intensive land use of development zone in urbanization: A case of Suzhou national Hi-tech development zone. China Land Sci. 2008, 22, 11–16. (In Chinese) [Google Scholar]
- Yuan, M.; Zhang, F.R.; An, P.L.; Dong, M.L.; Wang, Z.Y.; Zhao, T. Industrial land-use efficiency and planning in Shunyi, Beijing. Landsc. Urban Plan. 2008, 85, 40–48. [Google Scholar]
- Shi, Y.S.; Huang, Y.C. Research on intensive land use in development zones: A case study of Shanghai development zone. Mod. Urban Stud. 2011, 26, 13–19. (In Chinese) [Google Scholar]
- Shi, Y.S.; Huang, Y.C. Relationship between morphological characteristics and land-use intensity: Empirical analysis of Shanghai development zones. J. Urban Plan. Dev. 2013, 139, 49–61. [Google Scholar] [CrossRef]
- Jiang, L.W. Dynamic Evaluation and Potential Prediction of Intensive Land Use in Development Zones. Ph.D. Dissertation, Nanjing Agricultural University, Nanjing, China, 2011. (In Chinese). [Google Scholar]
- Oseghale, G.E.; Ikpo, I.J. An evaluation of industrial facilities defects in selected industrial estates in Lagos state, Nigeria. Civ. Eng. Dimens. 2014, 16, 104–111. [Google Scholar]
- Meng, P.; Hao, J.M.; Zhou, N.; Shuang, W.Y.; Hong, S.M. Research on evaluation of industrial land intensive use in the context of new urbanization: A case study in Yizhuang new town. China Land Sci. 2014, 28, 83–89. (In Chinese) [Google Scholar]
- Zhang, X.T.; Ding, J.Q.; Lei, X. Evaluation research on intensive use of development zone land under background of “New Normal”. J. Northwest A&F Univ. 2016, 16, 35–42. (In Chinese) [Google Scholar]
- Yin, G.Y.; Lin, Z.L.; Jiang, X.L.; Yan, H.W.; Wang, X.M. Spatiotemporal differentiations of arable land use intensity: A comparative study of two typical grain producing regions in northern and southern China. J. Clean. Prod. 2019, 208, 1159–1170. [Google Scholar] [CrossRef]
- Shi, H.S.; Niu, D.L.; Gu, D.H. Study on meso—Evaluation of intensive use of industrial land. J. Southwest Agric. Univ. 2010, 8, 1–4. (In Chinese) [Google Scholar]
- Song, C.S.; Zhai, W.X.; Liu, C.W. Intensive utilization evaluation of industrial land in Xining City from medium—Scale perspective. Chin. Agric. Sci. Bull. 2011, 27, 235–240. (In Chinese) [Google Scholar]
- Singha, C.; Swain, K.C. Land suitability evaluation criteria for agricultural crop selection: A review. Agric. Rev. 2016, 37, 125–132. [Google Scholar] [CrossRef]
- Murphy, B. Testing the Links between Soil Security, Sustainable Land Management Practices and Land Evaluation. In Global Soil Security. Progress in Soil Science; Field, D.J., Morgan, C.L.S., McBratney, A.B., Eds.; Springer: Cham, Switzerland, 2017; pp. 87–97. [Google Scholar]
- Albino, V.; Kühtz, S. Enterprise input–output model for local sustainable development: The case of a tiles manufacturer in Italy. Resour. Conserv. Recycl. 2004, 41, 165–176. [Google Scholar] [CrossRef]
- Gu, X.; Wang, T.C.; Qu, F.T. Study on industrial land use intensity & restructuring: A Case Study of Jiangsu Province. China Land Sci. 2006, 20, 3–8. (In Chinese) [Google Scholar]
- Chen, Y. A comprehensive evaluation of industrial land intensive use in Hubei Province based on typical industrial enterprises. J. Resour. Ecol. 2015, 6, 186–191. [Google Scholar]
- Zhang, L.; Liu, B.J.; Guo, Y.N. Research on the influencing factors of intensive land use in industrialization: Based on regional comparative study. J. Dalian Univ. Technol. 2016, 37, 34–40. (In Chinese) [Google Scholar]
- Liu, L.; Bi, R.T.; Meng, R. Land use efficiency and influencing factors of small and medium-sized industrial enterprises in 11 cities of Shanxi Province. J. Shanxi Agric. Univ. 2016, 36, 288–294. (In Chinese) [Google Scholar]
- Bishop, P.; Gripaios, P. Explaining spatial patterns of industrial diversity: An analysis of sub-regions in Great Britain. Urban Stud. 2007, 44, 1739–1757. [Google Scholar] [CrossRef]
- Lin, S.W.; Ben, T.M. Impact of government and industrial agglomeration on industrial land prices: A Taiwanese case study. Habitat Int. 2009, 33, 412–418. [Google Scholar] [CrossRef]
- Vandermeer, M.C.; Halleux, J.M. Evaluation of the spatial and economic effectiveness of industrial land policies in northwest Europe. Eur. Plan. Stud. 2017, 25, 1454–1475. [Google Scholar] [CrossRef]
- Wang, Z.; Chen, J.C.; Zheng, W.T.; Deng, X.Z. Dynamics of land use efficiency with ecological intercorrelation in regional development. Landsc. Urban Plan. 2018, 177, 303–316. [Google Scholar] [CrossRef]
- Ministry of Land and Resources of People’s Republic of China. Evaluation Procedures for Intensive Land Use in Development Zones (Trial Run in 2014). 2014. Available online: https://wenku.baidu.com/view/4dde52ed65ce050877321304.html?re=view (accessed on 1 October 2016).
- Ministry of Land and Resources of People’s Republic of China. Report on Evaluation of Land Intensive Use in National Development Zones (2014). 2017. Available online: http://g.mlr.gov.cn/201701/t20170123_1430213.html (accessed on 24 May 2019).
- Zhang, L.; Wang, Y.H. Study on the influencing factors of the output efficiency of industrial land from the perspective of micro-enterprises: An empirical analysis based on a sample of 2088 industrial enterprises. East China Econ. Manag. 2014, 28, 43–48. (In Chinese) [Google Scholar]
- Lau, S.S.Y.; Giridharan, R.; Ganesan, S. Multiple and intensive land use: Case studies in Hong Kong. Habitat Int. 2005, 29, 527–546. [Google Scholar] [CrossRef]
- Yang, J.Y.; Yang, Y.; Tang, W. Development of evaluation model for intensive land use in urban centers. Front. Arch. Res. 2012, 1, 405–410. [Google Scholar] [CrossRef]
- Seto, K.C.; Reenberg, A.; Boone, C.G.; Fragkias, M.; Haase, D.; Langanke, T.; Marcotullio, P.; Munroe, D.K.; Olah, B.; Simon, D. Urban land teleconnections and sustainability. Proc. Natl. Acad. Sci. USA 2012, 109, 7687–7692. [Google Scholar] [CrossRef]
- Carlei, V.; Nuccio, M. Mapping industrial patterns in spatial agglomeration: A SOM approach to Italian industrial districts. Pattern Recognit. Lett. 2014, 40, 1–10. [Google Scholar] [CrossRef]
- Liu, Z.; Geng, Y.; Zhang, P.; Dong, H.; Liu, Z. Energy-based comparative analysis on industrial clusters: Economic and technological development zone of Shenyang area, china. Environ. Sci. Pollut. Res. Int. 2014, 21, 10243–10253. [Google Scholar] [CrossRef]
- Dorn, H.; Törnros, T.; Zipf, A. Quality evaluation of VGI using authoritative data: A comparison with land use data in Southern Germany. ISPRS Int. J. Geo-Inf. 2015, 4, 1657–1671. [Google Scholar] [CrossRef]
- Ma, L.; Fu, T.Y.; Blaschke, T.; Li, M.C.; Tiede, D.; Zhou, Z.J.; Ma, X.X.; Chen, D.L. Evaluation of feature selection methods for object-based land cover mapping of unmanned aerial vehicle imagery using random forest and support vector machine classifiers. ISPRS Int. J. Geo-Inf. 2017, 6, 51. [Google Scholar] [CrossRef]
- Dou, Y.Y.; Liu, Z.F.; He, C.Y.; Yue, H.B. Urban land extraction using VIIRS nighttime light data: An evaluation of three popular methods. Remote Sens. 2017, 9, 175. [Google Scholar] [CrossRef]
- Boy, J.; Strey, S.; Schönenberg, R.; Strey, R.; Weber-Santos, O.; Nendel, C.; Klingler, M.; Schumann, C.; Hartberger, K.; Guggenberger, G. Seeing the forest not for the carbon: Why concentrating on land-use-induced carbon stock changes of soils in Brazil can be climate-unfriendly. Reg. Environ. Chang. 2018, 18, 63–75. [Google Scholar] [CrossRef]
- AbdelRahman, M.A.E.; Shalaby, A.; Essa, E.F. Quantitative land evaluation based on fuzzy-multi-criteria spatial model for sustainable land-use planning. Model. Earth Syst. Environ. 2018, 4, 1341–1353. [Google Scholar] [CrossRef]
- Malherbe, H.; Pauleit, S.; Lorz, C. Mapping the loss of ecosystem services in a region under intensive land use along the southern coast of South Africa. Land 2019, 8, 51. [Google Scholar] [CrossRef]
- Chen, X.; Shao, H.; Li, Y.; Shen, C.; Liang, P.P. Urban land intensive use evaluation study based on nighttime light: A case study of the Yangtze River economic belt. Sustainability 2019, 11, 675. [Google Scholar] [CrossRef]
- D’Amato, D.; Korhonen, J.; Toppinen, A. Circular, green, and bio economy: How do companies in land-use Intensive sectors align with sustainability concepts? Ecol. Econ. 2019, 158, 116–133. [Google Scholar] [CrossRef]
- Visockienea, J.S.; Tumelieneab, E.; Malienebc, V. Analysis and identification of abandoned agricultural land using remote sensing methodology. Land Use Policy 2019, 82, 709–715. [Google Scholar] [CrossRef]
- Qian, Q.; Liu, H.Y.; Zheng, X.Q. A regional sustainable intensive land use evaluation based on ecological constraints: A case study in Jinan City. Sustainability 2019, 11, 1434. [Google Scholar] [CrossRef]
- Goertzen, D.; Suhling, F. Urbanization versus other land use: Diverging effects on dragonfly communities in Germany. Divers. Distrib. 2019, 25, 38–47. [Google Scholar] [CrossRef]
- Basso, M. Land-use changes triggered by the expansion of wine-growing areas: A study on the Municipalities in the Prosecco’s production zone (Italy). Land Use Policy 2019, 83, 390–402. [Google Scholar] [CrossRef]
- Wei, H.K. Modern Regional Economics; Revised Version; Economic Management Press: Beijing, China, 2011. (In Chinese) [Google Scholar]
- Chan, J.C.C.; Eisenstat, E. Marginal likelihood estimation with the Cross-Entropy method. Econom. Rev. 2015, 34, 256–285. [Google Scholar] [CrossRef]
- Shi, Y.S.; Li, J.Q.; Xie, M.Q. Evaluation of the ecological sensitivity and security of tidal flats in Shanghai. Ecol. Indic. 2018, 85, 729–741. [Google Scholar] [CrossRef]
- Bond, E.W.; Riezman, R.G.; Syropoulos, C. A strategic and welfare theoretic analysis of free trade areas. J. Int. Econ. 2004, 64, 1–27. [Google Scholar] [CrossRef]
- Chong, S.Y.; Hur, J. Small hubs, large spokes and overlapping free trade agreements. World Econ. 2008, 31, 1625–1665. [Google Scholar] [CrossRef]
- Keshavarzian, A. Geopolitics and the genealogy of free trade zones in the Persian Gulf. Geopolitics 2010, 15, 263–289. [Google Scholar] [CrossRef]
- Wang, Z.X.; Zhu, H.T. Testing the trade relationships between China, Singapore, Malaysia and Thailand using grey Lotka-Volterra competition model. Kybernetes 2016, 45, 931–945. [Google Scholar] [CrossRef]
- Zhang, L.; Cui, L.; Li, S.L.; Lu, J.Y. Who rides the tide of regionalization: Examining the effect of the China-ASEAN Free Trade Area on the exports of Chinese firms. Int. Bus. Rev. 2018, 27, 501–513. [Google Scholar] [CrossRef]
- Peng, H.; Zeng, G. Evaluation of intensive land use of development zones in Shanghai. Econ. Geogr. 2009, 29, 1177–1181. (In Chinese) [Google Scholar]
- Gu, X. Intensity assessment of land use in development zones in Shanghai. Hubei Agric. Sci. 2012, 51, 1323–1326. (In Chinese) [Google Scholar]
© 2019 by the authors. Licensee MDPI, Basel, Switzerland. This article is an open access article distributed under the terms and conditions of the Creative Commons Attribution (CC BY) license (http://creativecommons.org/licenses/by/4.0/).