Abstract
Monitoring heritage landscapes is essential for evaluating long-term ecological integrity, mitigating environmental risks, and supporting sustainable heritage management. This study investigates land cover transformation and ecological environment quality in the Jingmai Mountain Cultural Landscape Heritage Area, a UNESCO World Heritage Site, using high-resolution satellite imagery from 2013 and 2023 and geospatial analysis tools (ENVI 5.3 and ArcGIS 10.8). Supervised classification using the maximum likelihood algorithm was employed to detect land use and land cover changes, and a quantitative ecological environment quality index based on land use areas and ecological coefficients was used to assess regional ecological quality. Land cover dynamics, heritage element shifts, and ecological quality variations before and after the site’s inscription were analyzed. The results indicate that core landscape structures remained relatively stable in both the construction control area and the core application zone. In the construction control area, land cover changes totaled 32.28 km2, with the most significant transformations occurring in forested areas (36%), followed by cultivated lands (19%). In the application zone, total land cover change reached 10.99 km2, primarily involving cultivated lands (33%) and built-up areas (27%). Ecological environment quality indices exhibited a slight positive trend, increasing from 0.4476 to 0.4512 in the construction control area and from 0.2449 to 0.2521 in the application zone between 2013 and 2023. This study provides a decade-long spatial assessment of land use transitions in a UNESCO cultural landscape and proposes a transferable framework for integrating ecological quality evaluation into heritage landscape monitoring. The findings offer evidence-based insights into heritage conservation and rural development planning and support the implementation of sustainable landscape management strategies aligned with national policies and the Sustainable Development Goals.
1. Introduction
Rapid urbanization, accelerating urban sprawl, and the steady depletion of rural populations—combined with dynamic shifts in global socio-economic patterns—have increasingly placed cultural landscape heritage under serious threat [1,2]. As the interaction between human development and heritage conservation becomes more intense, scholars across disciplines have paid growing attention to monitoring and preserving these vulnerable landscapes. A notable example is the study by Tang, Chen [3], which utilized high-resolution remote sensing imagery to detect and analyze changes in cultural heritage landscapes, highlighting the growing relevance of geospatial technologies in heritage research.
Jingmai Mountain, situated in Pu’er City, represents a compelling case of cultural landscape heritage that integrates ecological diversity with deep historical and cultural value. This mountainous landscape embodies the co-evolution of nature, society, and culture, and serves as a living testimony to long-standing traditional practices harmonized with ecological processes. Despite its inscription on China’s Tentative List for World Heritage in 2012 and formal recognition as a UNESCO World Heritage Site at the 45th World Heritage Committee session in 2023 [4,5], there remains a lack of in-depth research into the environmental dynamics that have unfolded across this decade-long inscription process. While targeted conservation policies have been implemented, such as the Regulations on the Protection of the Cultural Landscape of the Ancient Tea Forest in Jingmai Mountain, Puer Daily [6], which prohibits deforestation in the Core Area and regulates tourism infrastructure development, their actual effects on the natural and social environments of Jingmai Mountain have not been systematically examined or quantitatively evaluated.
Conventional monitoring approaches in the field of cultural landscape research have often relied on field surveys and sampling techniques. These methods, while valuable, are limited in scale, frequency, and spatial comprehensiveness. In contrast, remote sensing technologies have emerged as an essential tool for ecological and landscape monitoring, offering advantages such as high efficiency, repeatable temporal observations, and broad geographic coverage [7]. With the proliferation of satellite data over the past two decades, cultural heritage monitoring has increasingly drawn upon geospatial datasets. However, a significant number of these studies have depended on medium-resolution imagery—such as the 30 m Landsat data available through the Geospatial Data Cloud, as used in the study by Niu [8], or 15 m imagery derived from Google Earth platforms, as applied by Tang, Chen [3]. While these datasets offer some insight, their spatial resolution is often insufficient for detecting fine-scale transformations in heterogeneous heritage landscapes, particularly those with complex topographies and intricate land-use patterns.
There is currently a lack of detailed, quantitative research focused on spatiotemporal land cover changes and ecological quality variations within the Jingmai Mountain Cultural Landscape, particularly over the critical period from 2013 to 2023—when the site underwent significant transformation driven by heritage application procedures [4,9], conservation interventions [6], tourism development [10], and urban–rural interactions [11]. These driving factors were quantified in this study by correlating land cover change types (e.g., built-up area expansion for tourism infrastructure) and magnitudes with the implementation timeline of relevant policies and socio-economic statistical data. Existing studies on Land-Use/Land-Cover (LULC) change have widely employed high-resolution satellite remote sensing data to analyze land cover dynamics [3,12]. However, research specifically focusing on the Jingmai Mountain Cultural Landscape remains limited [5,13], and previous studies have not utilized very high-resolution imagery (≤1 m) to capture fine-scale land cover changes in this area. Moreover, only a few studies have examined the effects of conservation planning in Jingmai Mountain [4,13], and none have quantitatively assessed the sustainability of development processes by integrating land cover dynamics with ecological environment quality indices in this fragile heritage landscape.
Given this context, the present study aims to integrate high-resolution remote sensing and geographic information systems to monitor landscape-level changes in the Jingmai Mountain Cultural Landscape Heritage Area. The specific objectives are to: (1) quantitatively analyze spatiotemporal variations in land cover and spatial patterns using very high-resolution satellite imagery; (2) assess changes in ecological environment quality using quantitative ecological quality indices; and (3) analyze landscape environmental outcomes over the decade of heritage application and inscription through land cover transition and ecological quality assessments.
This study conducts a longitudinal (2013–2023) spatial analysis of land cover dynamics in the core and buffer zones of the Jingmai Mountain Cultural Landscape and evaluates environmental changes associated with heritage conservation policies. By comparing these dynamics with other major Chinese cultural landscapes, the study contributes to discussions on heritage governance, landscape resilience, and sustainable development while providing a transferable framework for heritage monitoring using remote sensing and GIS.
2. Literature Review
2.1. World Heritage Sites and Cultural Landscape Conservation
The concept of “heritage,” initially rooted in legal traditions as inheritable personal property, gradually expanded during the late 19th and early 20th centuries to encompass cultural and natural legacies deemed significant to society [4]. With the adoption of the World Heritage Convention in 1972, heritage was officially categorized into cultural and natural heritage [14]. Within this framework, the notion of cultural landscape heritage emerged, integrating both human and environmental elements and drawing increasing international attention. Since then, cultural landscapes have become essential components of global conservation efforts, offering a comprehensive view of the dynamic relationship between people and nature [15].
Institutions such as the U.S. National Park Service define a heritage area as a region where communities, businesses, and governmental entities collaborate to conserve and promote natural and cultural resources for the benefit of current and future generations [16]. This definition underlines a core idea: cultural landscape heritage not only embodies historical and ecological values but also contributes to socio-economic development through integrated planning and sustainable use.
In response to international priorities, cultural heritage conservation has been aligned with broader global agendas, including the United Nations Sustainable Development Goals (SDGs). Notably, SDG 11.4 calls for the strengthening of efforts to protect and preserve the world’s cultural and natural heritage [3], which requires the quantitative monitoring of land cover stability and ecological integrity of heritage sites as the core evaluation index. China’s heritage conservation policies reflect this vision. Since joining the World Heritage Convention in 1985, China has inscribed 56 sites on the World Heritage List, including 38 cultural heritage sites. Among these, the Jingmai Mountain Cultural Landscape Heritage Area holds a prominent place. Listed on China’s Tentative List in 2012 and designated as a National Key Cultural Relics Protection Unit in 2013, the area has been subject to significant policy-driven protection efforts. By 2022, it became a formal nominee for UNESCO World Heritage status, highlighting its cultural importance and the long-term national commitment to its conservation [4].
Given the increasing recognition and policy backing, the monitoring of such heritage landscapes has become an essential task. Effective monitoring provides critical insight into baseline environmental conditions, helps identify and mitigate risks, and tracks ecological and land cover changes over time. The use of remote sensing technologies has transformed heritage monitoring by offering high-resolution, multi-temporal, and non-intrusive tools for large-scale environmental assessments. These technologies support ongoing observation of changes in vegetation, land use, and human activity, while enabling early warning mechanisms for environmental degradation [17]. Moreover, tools such as satellite imagery and GIS-based analysis allow for detailed tracking of anthropogenic and natural transformations in heritage zones, strengthening resilience strategies and adaptive management plans [18].
2.2. Environmental and Human Pressures on Heritage Landscapes
Cultural landscape heritage sites are increasingly exposed to anthropogenic pressures that directly influence land cover dynamics and ecological conditions. Rapid urbanization, agricultural intensification, and infrastructure development have been identified as major drivers of land cover transformation, leading to habitat fragmentation and ecosystem degradation [19].
Previous studies have demonstrated that urban expansion and land use conversion can compromise the ecological integrity and cultural authenticity of heritage sites. For instance, Agapiou [20] highlighted the impacts of urban sprawl on archaeological landscapes. Similarly, Primi et al. [21] reported significant shifts in land cover composition and landscape structure, indicating reduced ecological heterogeneity and resilience.
In addition to urbanization, tourism development and agricultural expansion are key anthropogenic drivers of land cover change in cultural landscapes [3,20]. For mountainous heritage areas such as Jingmai Mountain, forest-to-cultivated land conversion, built-up expansion, and road-induced fragmentation represent the dominant land cover change trajectories [4,20], which are the primary variables analyzed in this study.
Recent research emphasizes the importance of integrating land cover monitoring with ecological quality assessment in heritage management [22]. Remote sensing-based land cover analysis combined with ecological indices has been recommended as an effective framework for evaluating landscape conditions and guiding adaptive management strategies [17]. This study follows this approach by quantitatively analyzing land cover transitions and ecological environment quality trends in the Jingmai Mountain Cultural Landscape Heritage Area.
2.3. GIS and Remote Sensing Technologies in Heritage Landscape Monitoring
Over the past few decades, GIS and remote sensing have been widely employed to monitor spatial and temporal changes in heritage landscapes, enabling researchers to detect threats arising from urbanization and environmental degradation. In China, for example, national scholars have utilized GIS platforms and big data technologies to systematically document changes in heritage attributes, site boundaries, and Buffer Areas. These tools support the identification of land cover dynamics that may indirectly reflect anthropogenic pressures such as infrastructure development, tourism expansion, and agricultural encroachment. However, the direct quantification of human and natural pressures is beyond the scope of this study [12,23,24].
Notably, 0.5 m spatial resolution Pleiades satellite imagery and 1 m spatial resolution Gaofen-2 satellite imagery (the high-resolution satellite data used in this study) play a pivotal role in accurately capturing land cover dynamics and environmental traits transformations around heritage sites [3,12].
The monitoring of environmental traits of heritage landscapes, closely tied to landscape resilience and based on land cover classification, has also benefited from advancements in remote sensing technologies. Since the launch of Landsat 1 in 1972, the United States and other countries have increasingly used satellite data to monitor key environmental indicators such as vegetation cover, soil conditions, water resources, and atmospheric parameters. The development of multispectral and hyperspectral sensors has enabled three-dimensional and multi-temporal analysis of ecosystem health and land degradation trends. Furthermore, the introduction of 3S technologies—remote sensing (RS), GIS, and global positioning systems (GPS)—has significantly expanded the spatial scale of environmental monitoring and has facilitated a transition from descriptive to quantitative analysis [8,13].
Traditional ecological assessment methods, such as field surveys and sampling, are time-consuming and limited in large-scale spatial coverage (but have high precision for point-scale verification) [8,12]. Remote sensing overcomes these limitations by offering near-real-time, large-scale, and cost-effective tools for regional environmental trait evaluation; modern techniques, such as hyperspectral remote sensing and AI-driven classification, can detect even subtle changes in terrain, land use, or vegetation, thereby offering early warnings for degradation risks. For instance, Wang and Xu [25] integrated high-resolution satellite imagery with machine learning algorithms to monitor vegetation cover changes in the Honghe Hani Rice Terraces, achieving a classification accuracy of 92.3% and identifying early signs of soil erosion. These approaches are increasingly being integrated with machine learning and AI-driven classification techniques (e.g., random forest and convolutional neural networks), further enhancing monitoring accuracy and predictive capacity [26].
In summary, the integration of GIS and remote sensing technologies has transformed heritage landscape monitoring, offering robust methodologies for capturing and analyzing environmental and anthropogenic impacts. These technologies provide essential support for conservation planning, policy development, and risk mitigation strategies aimed at safeguarding cultural and natural heritage assets in the face of accelerating global change.
3. Materials and Methods
This study employs an integrated remote sensing and GIS-based spatial analysis approach to investigate the spatiotemporal dynamics of land use and ecological quality within the Jingmai Mountain Cultural Landscape Heritage Area. The methodological framework includes the acquisition and preprocessing of high-resolution satellite imagery, land use classification based on national standards, detection of land cover changes using supervised classification, and quantitative assessment of ecological environment quality through established indices. Accuracy evaluation is performed using field observations and map verification. The following subsections describe the study area and the specific procedures undertaken during the research process.
The year 2013 was selected as the baseline for this study due to its historical and administrative significance in the heritage conservation trajectory of Jingmai Mountain. In that year, Jingmai Mountain was officially listed as a national heritage conservation relic in China, initiating formal efforts toward international recognition. Most notably, on 29 January 2013, the site was included on UNESCO’s Tentative List under the title “Ancient Tea Plantations of Jingmai Mountain in Pu’er.” This inclusion marked the beginning of a decade-long process of heritage planning, protection, and institutional intervention, which culminated in its successful inscription on the UNESCO World Heritage List at the 45th World Heritage Committee Session in 2023. Accordingly, the period from 2013 to 2023 provides a meaningful temporal window for analyzing land cover change, ecological evolution, and landscape transformation within the heritage area, corresponding to both pre- and post-nomination stages of heritage management. However, this study utilizes Pleiades satellite imagery from 2013 (0.5 m spatial resolution) and Gaofen-2 satellite imagery from 2023 (1.0 m spatial resolution) to assess spatiotemporal variations in the landscape. The integration of such datasets enhances the precision of land cover classification and supports the interpretation of landscape pattern changes, particularly in relation to human activities and ecological processes.
3.1. Study Area
Jingmai Mountain, officially named “Jingmai Mountain: Cultural Landscape of Ancient Tea Plantations” by UNESCO [9], is located in Huimin Town, Lancang County, Pu’er City, Yunnan Province, in the southwest border of China, bordering Myanmar. Geographically, it spans from approximately 99°54′E to 100°4′E longitude and 22°6′ N to 22°16′ N latitude, like Figure 1), according to data derived from the official heritage protection plan Puer Daily [6] and verified by Zhang and Zou [4]. Situated at an elevation of about 1500 m, the area features predominantly mountainous and semi-mountainous terrain. It experiences a subtropical rainforest climate, with an average annual temperature of 18.9 °C and average annual precipitation of approximately 1643 mm, forming a distinctive vertical climatic structure [11]. The nominated heritage area covers approximately 71.67 km2, while the Construction Control Area extends over 105.92 km2, and the Buffer Area covers about 119.27 km2 [9]. The Construction Control Area encompasses two administrative villages, Jingmai and Mangjing, which jointly include 14 traditional ethnic minority villages. Jingmai Village is primarily inhabited by the Dai ethnic group, while Mangjing Village is predominantly home to the Blang ethnic group. The two ethnic groups have formed traditional land use practices closely linked to the land cover pattern of Jingmai Mountain for a long time: the Blang ethnic group has maintained the traditional practice of interplanting ancient tea trees with woodland, which preserves the woodland-cultivated land interlaced land cover structure; the Dai ethnic group has developed traditional agricultural cultivation based on water systems, which maintains the stability of water body and cultivated land cover types [4,13].
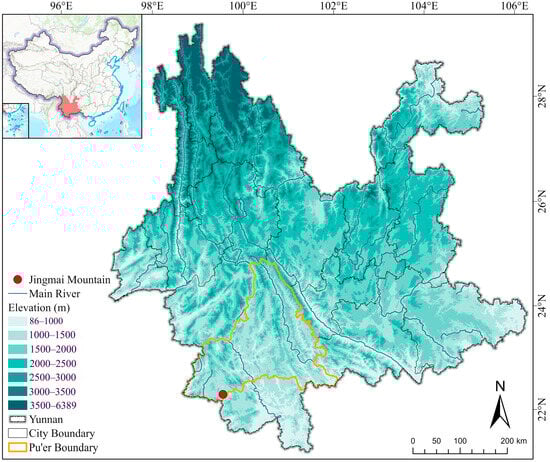
Figure 1.
Location Map of Jingmai Mountain.
The overall landscape consists of natural features such as woodlands, tea plantations, cultivated land, and water bodies, alongside cultural and social elements including the tea economy, tea culture, traditional architecture, and ethnic customs. As defined by UNESCO and heritage management practices, the Core Area is subject to strict conservation guidelines that limit human intervention. The Buffer Area allows for regulated activities that support heritage protection and community development. As illustrated in Figure 2, this study focuses specifically on the construction control area due to its critical role in heritage conservation and dynamic land use changes. The Construction Control Area is a key functional zone defined in the Regulations on the Protection of the Cultural Landscape of the Ancient Tea Forest in Jingmai Mountain [6]. Located between the Core Area and the Buffer Area, it serves as a transitional zone that balances heritage conservation and regional development. This area is characterized by multiple human activities, including traditional tea cultivation, ethnic village residential life, small-scale tourism service infrastructure development, and agricultural practices [4,11]. Functionally, the Construction Control Area acts as a critical protective barrier for maintaining the land cover integrity of the Core Area, and land cover changes within this zone can directly influence the ecological and cultural continuity of the heritage landscape. Moreover, it represents the primary interface between heritage conservation and rural development, and its dynamic land cover changes provide an important indicator of the effectiveness of heritage conservation policies and management interventions [6,27].
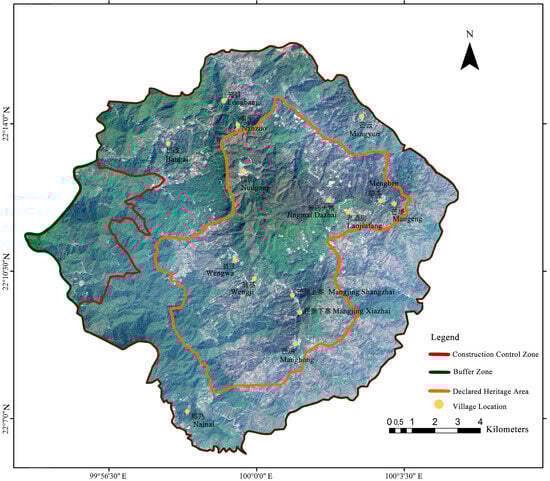
Figure 2.
Spatial Zoning Map of the Jingmai Mountain Cultural Landscape Heritage Area.
3.2. Data Sources and Research Methods
The application of GIS and remote sensing technologies has become increasingly vital in the monitoring and management of heritage landscapes. Since Tomlinson [28] coined the term “GIS” in 1963 and developed the Canada Geographic Information System (CGIS) for natural resource management, these technologies have evolved to integrate computing, spatial algorithms, statistics, and geography, becoming vital tools for mapping, analyzing, and visualizing spatial data [29].
3.2.1. Image Preprocessing
High-resolution satellite imagery from two points was utilized for this study: Pleiades imagery from 10 February 2013 (0.5 m spatial resolution) and Gaofen-2 imagery from 10 February 2023 (1 m spatial resolution). The imagery was preprocessed using ENVI 5.3 and ArcGIS 10.8. The preprocessing steps included geometric correction with unified projection (WGS84), ensuring spatial deviations remained below 1.5 pixels. Additional steps such as image fusion, enhancement, mosaicking, and boundary-based cropping were performed to generate high-resolution digital orthophoto maps (DOMs). These enhanced images provided the necessary visual quality for land cover interpretation and change detection, as shown in Figure 3. The upper panels show the Construction Control Area, while the lower panels show the Heritage Area. The left panels correspond to 2013, and the right panels correspond to 2023.
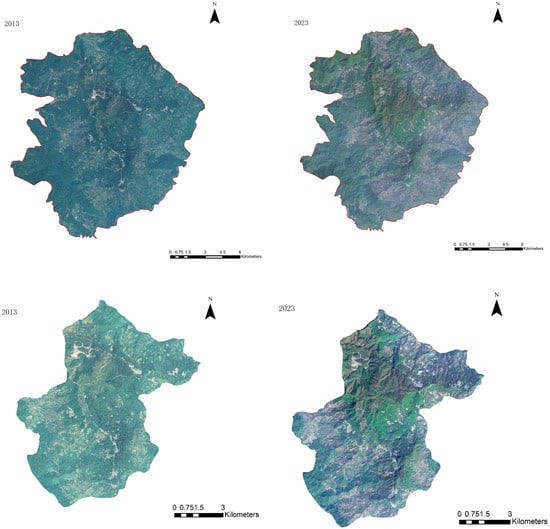
Figure 3.
Satellite imagery of the study area in 2013 and 2023. (top) Construction Control Area; (bottom) Heritage Area.
3.2.2. Land Classification
Land classification was conducted within the heritage area in accordance with the Chinese national standard entitled “Standard for Classification of Land Use Status Quo (GB/T 21010–2017)” [30]. To evaluate the ecological environment quality, land use types were categorized and assigned ecological quality indices based on findings by Wang and Qin [31]. The indices for each land use class were weighted by area to calculate a comprehensive ecological index for the region. Table 1 presents the classification system and the corresponding ecological indices.

Table 1.
Land use classification and ecological environment quality index.
3.2.3. Change Detection
Supervised classification with the maximum likelihood algorithm (a classic algorithm for land cover classification with high accuracy for mountainous areas [5,20]) was employed to detect land cover changes between 2013 and 2023, and the specific implementation steps in ENVI 5.3 are as follows: (1) Image preprocessing (radiometric calibration, atmospheric correction, geometric correction, image fusion and cropping); (2) Training sample selection: 80–100 training samples were selected for each land cover type (woodland, cultivated land, etc.) based on field surveys and high-resolution image visual interpretation, with the sample purity > 95%; (3) Classification model construction: the maximum likelihood classification module in the ENVI 5.3 Classification Toolbox was used to construct the classification model; (4) Post-classification processing: majority analysis and cluster analysis were performed to eliminate classification noise; (5) Accuracy assessment: the overall classification accuracy and Kappa coefficient were calculated based on the validation sample set. Area statistics and spatial analysis were computed in ArcGIS 10.8 using the Spatial Analyst Tools (for area calculation) and Conversion Tools (for vector-raster conversion); the specific plugins used include Zonal Statistics as Table (for land cover area statistics) and Tabulate Area (for transfer matrix generation). All steps are replicable with the above software and tools under the same data preprocessing conditions. The total area for each land cover type was calculated by the Zonal Statistics as Table tool in ArcGIS 10.8, and a land cover transfer matrix was generated to quantify the magnitude and direction of changes across the ten-year period. The specific generation method is as follows: (1) Convert the 2013 and 2023 land cover classification raster maps to vector format using ArcGIS 10.8 Conversion Tools; (2) Use the Tabulate Area tool in the Spatial Analyst Tools to overlay the two vector maps, and the output attribute table records the area of each land cover type converted from one type to another; (3) Organize the attribute table data into a matrix form with 2013 land cover types as rows and 2023 land cover types as columns and calculate the proportion of each conversion type to the total change area [8,12].
3.2.4. Accuracy Assessment
To ensure the validity of classification results, the study conducted accuracy assessment using both field surveys and visual interpretation. The classified land cover images were verified through site visits and cross-checked with existing topographic maps and the land cover classification maps independently produced in this study. The field verification points were distributed systematically across different land use types. The combination of satellite image analysis and ground truthing improved the reliability of the results (Figure 4). Although the Kappa coefficient and overall accuracy metrics are not reported in this section, they will be included in Section 4 for completeness.
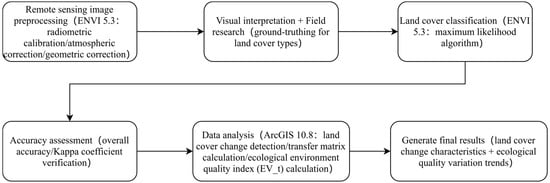
Figure 4.
Research design and data processing for land cover change detection and ecological index calculation.
3.2.5. Ecological Quality Index Calculation
The ecological quality index (EVt) was calculated to evaluate the overall condition of the regional ecosystem. This index integrates land-use area data with ecological weighting coefficients, as expressed in Equation (1):
where
EVt: Ecological quality index at time t;
Bti: Area of land use type i at time t;
Ri: Ecological quality coefficient for land use type i (Table 1);
TBt: Total area of the study region at time t;
n: Total number of land use types.
This index provides a quantitative measure of ecological status over time, allowing for evaluation of environmental impacts related to land use transitions within the heritage area.
4. Results and Analyses
4.1. Detected Actual Land Use (2013–2023)
To ensure the reliability of remote sensing data from 2023, field surveys were conducted within the Jingmai Mountain construction control area.
Ground-truthing and selective interpretation of satellite image elements were carried out for the main land use types (woodland, cultivated land, building plot, etc.), which verified the accuracy of satellite-derived land use classifications and provided a solid foundation for the subsequent land cover change detection and ecological quality evaluation.
4.2. Spatiotemporal Changes in Heritage Elements in Different Functional Zones
The Jingmai Mountain Cultural Landscape Heritage Area is divided into the construction control area and the cultural heritage core area (application zone), with significant differences in conservation control intensity, land use base and development orientation. Separate study on the two zones is intended to accurately identify the characteristics of heritage element changes in different functional zones and to provide a scientific basis for formulating differentiated heritage protection and land use management policies.
4.2.1. Construction Control Area
Based on satellite imagery (Figure 5), field investigations, and visual interpretation, a total of 149 land use changes were identified between 2013 and 2023 within the construction control area (Table 2). These changes encompass a variety of transformations, notably: Mangjingxiazhai (agricultural land converted into residential areas), Wengwua and Bancai (forest developed into housing), Bancai and Nanza (miscellaneous land replaced with buildings), Jingmai Dazhai (forested land repurposed for agriculture), and Nuogang (water bodies transformed into other land types) as shown in Figure 6. The dominant trend involves the conversion of forest, cultivated, and miscellaneous lands into residential and transport infrastructure.
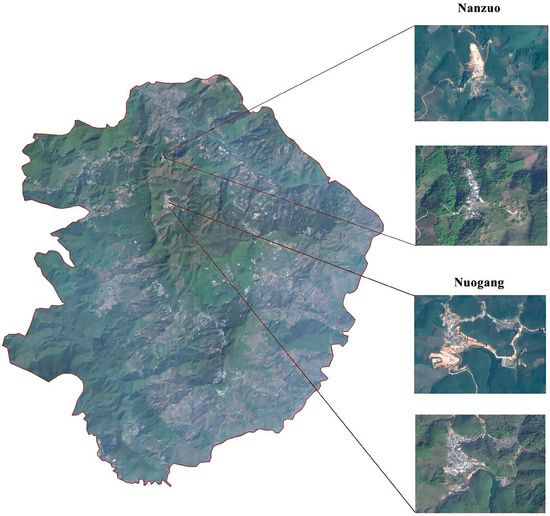
Figure 5.
Jingmai Mountain Construction Control Area factor information change map.
Table 2.
Comparison of factor information changes in Jingmai Mountain construction control area.
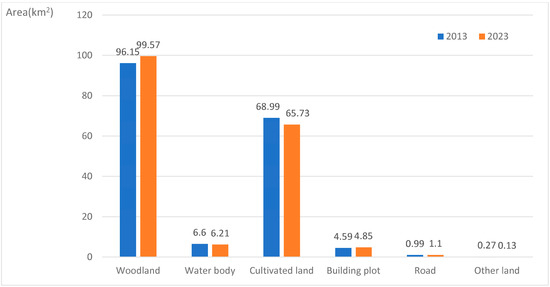
Figure 6.
Area changes in land use types (2013–2023).
Land use transitions have affected approximately 5.60 km2 of water bodies and built-up areas—representing about 17% of the total changed area. Changes in roads and other land types remain below 6%. Specifically, forest was converted to agriculture (3.85 km2) and buildings (4.16 km2); agriculture was converted to buildings (1.50 km2); and water was converted to forest (3.13 km2). Total land converted to forest, buildings and agriculture reached 5.76 km2, 9.03 km2 and 10.73 km2, respectively. The land cover transfer matrix (Table 3) classifies land cover changes by the direction and magnitude of land use type conversion: rows represent the original land use type (2013), columns represent the converted land use type (2023), and the cell values represent the conversion area (km2). The ranking is based on the total conversion area of each original land use type (sum of row values), reflecting the contribution of each land type to the overall land cover change.
Table 3.
Land cover transfer matrix of the construction control area (2013–2023, Unit: km2).
4.2.2. Cultural Heritage Core Area
The inscription area (core cultural heritage area) refers to the core application zone of the Jingmai Mountain Cultural Landscape for UNESCO World Heritage listing, with a total area of 71.67 km2 as defined in the 2022 Regulations on the Protection of the Cultural Landscape of the Ancient Tea Forest in Jingmai Mountain. It is the key area for the protection of ancient tea forests and ethnic cultural heritage, with the strictest conservation control measures in the study area.
In the core inscription area, 96 significant land use changes were detected from 2013 to 2023 as illustrated by Figure 7 Most of these were concentrated around villages such as Mengben, Wengji, and Wengwa, where forest and cultivated land were converted into residential uses (e.g., Mangjing Lower Walled City, cultivated land transformed into housing).
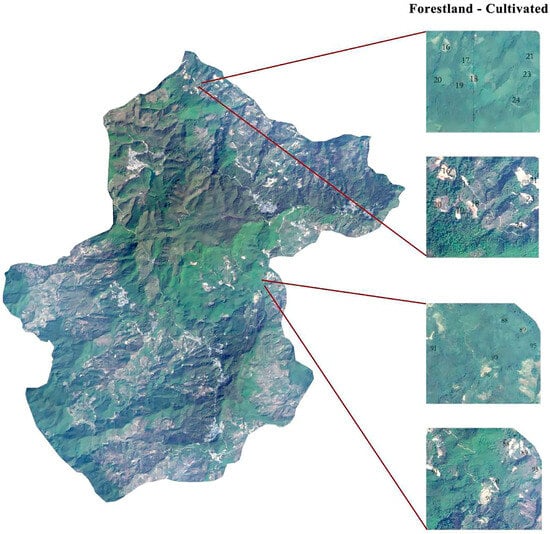
Figure 7.
Spatial distribution of land use changes in the cultural core area.
An analysis of the elemental changes shows that arable land experienced the most significant transformation within the bidding area, with a change of approximately 3.61 km2—representing about 33% of the total change area, followed by building land (3.00 km2, 27%). Water bodies (1.79 km2, 16%) and roads (1.04 km2, 9%) were the next, while changes in forested land and other land types were relatively minor (each <8%). The majority of arable land was converted into building land (1.04 km2), while a significant portion of building land was reverted back to cultivated land (0.79 km2). Across the entire inscription area, the total land use change over the ten-year period amounts to 10.99 km2, with the following transformation order: cultivated land > building land > water bodies > roads > forest land > other land.
4.2.3. Comparison of Heritage Element Changes in Two Functional Zones
The heritage element changes in the two functional zones show homogeneity in the overall trend and heterogeneity in the change intensity and dominant type: (1) Homogeneity: Both zones are dominated by the conversion of natural/agricultural land to construction land, driven by rural residential construction and tourism infrastructure development. (2) Heterogeneity: The Construction Control Area has a larger total change area (32.28 km2 vs. 10.99 km2) and takes forest land change as the core (36% of total change), while the core area has a smaller change scale and takes cultivated land change as the main type (33% of total change), which is due to the stricter conservation control of forest land and ancient tea forest in the core area.
Overall, land use transitions have affected approximately 5.60 km2 of water bodies and built-up areas—about 17% of the total changed area. Changes in roads and other land types remain below 6%. Specifically, conversions from forest to agriculture and to built-up land covered 3.85 km2 and 4.16 km2, respectively. A further 1.50 km2 of agricultural land was transformed into built-up areas. Notably, 3.13 km2 of water bodies were converted into forest. In aggregate terms, 5.76 km2 of land was converted to forest, 9.03 km2 to built-up areas, and 10.73 km2 to agricultural use.
The change matrix (Table 3) ranks land use transitions as follows:
Forest > Cultivated Land > Water Body > Building Land > Miscellaneous > Roads
Table 3 indicates the transfer matrix of factor information changes in the Construction Control Area of Jingmaishan cultural landscape heritage area in Pu ‘er City from 2013 to 2023.
4.3. Spatiotemporal Dynamics of Land Use Changes Temporal Perspective
From 2013 to 2023, forested areas increased by 3.42 km2 (from 96.15 to 99.57 km2). In contrast, arable land decreased by 3.26 km2. Built-up areas and roads grew by 0.39 km2 and 0.11 km2, respectively, while water bodies and miscellaneous land declined marginally.
From the spatial scale perspective, forests dominate the central and western zones, while arable land clusters in the southeast and northeast. Residential and other developed lands appear sporadically across the area. The Nanyuan River, a linear feature, demarcates part of the heritage boundary.
Despite ongoing changes, Figure 8 illustrates on how the dominant land use patterns—forested and agricultural—have remained largely consistent over the decade.
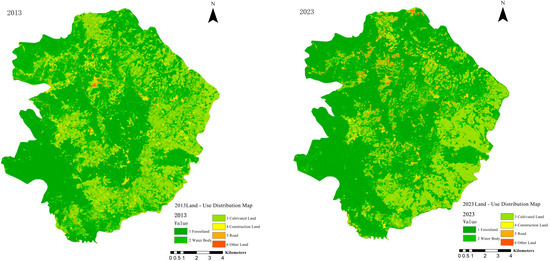
Figure 8.
Land cover change map, Jingmai Mountain Construction Control Area.
4.4. Elemental Changes Within the Cultural Heritage Core Area (Inscription Area)
The core cultural heritage area of Jingmai Mountain is the key zone for UNESCO World Heritage nomination, where land use is strictly regulated by Grade I protection standards. From 2013 to 2023, a total of 96 significant land use change points were identified in this area (Figure 7), with the spatial distribution of changes showing obvious village agglomeration characteristics. The surrounding areas of villages such as Mengben, Wengji and Wengwa are the core change zones, mainly characterized by the conversion of woodland and cultivated land to residential land, and the conversion of cultivated land to building land also exists in Mangjing Lower Walled City.
Table 4 compares the changes in land use elements of typical villages in the core area between 2013 and 2023, which intuitively reflects the specific transformation characteristics of land cover around the villages. By quantifying the area and direction of land use changes in the core area, the land cover transfer matrix from 2013 to 2023 was constructed (Table 5). The data show that the total land cover change area in the inscription area is 10.99 km2, among which the change area of cultivated land is the largest (3.61 km2), accounting for 33% of the total change area, followed by building land (3.00 km2, 27%), and the change proportions of woodland and other land are all lower than 8%. Cultivated land is mainly converted to building land (1.04 km2), while building land is also converted back to cultivated land (0.79 km2), and water bodies are mainly converted to cultivated land (0.54 km2) and building land (0.46 km2).
Table 4.
Land use changes in comparison in Jingmai cultural core area.
Table 5.
Transition matrix of land use elements in the Jingmai inscription area.
To more intuitively display the transformation direction and area proportion characteristics of each land use type in the inscription area from 2013 to 2023, a Sankey diagram was drawn based on the land cover transfer matrix data (Figure 9), which clearly presents the transformation flow and correlation between different land types. Overall, the intensity of land cover transformation in the inscription area is significantly lower than that in the construction control area, and the main transformation type is the mutual conversion between cultivated land and building land, which is closely related to the strict heritage protection and control policies in the core area.
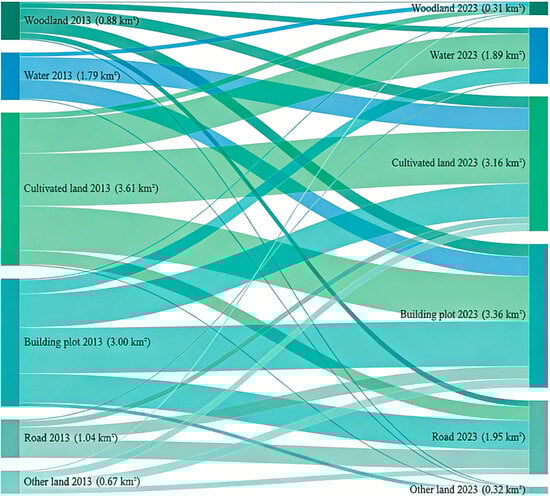
Figure 9.
Sankey diagram of land cover transfer matrix in the inscription area (2013–2023).
4.5. Spatial Changes in the Jingmai Mountain Cultural Landscape Bidding Area
From the Time Scale Perspective, after 2013, within the application area of the Jingmai Mountain Heritage Area, cultivated land underwent the most significant change. Over ten years, it decreased by 0.59 km2, dropping from 22.49 km2 to 21.90 km2. Next, in terms of change magnitude, was building land, which increased by 2.03 km2, rising from 16.46 km2 to 18.49 km2. During this period, forested land increased by 1.3 km2. In contrast, roads, other land, and water bodies decreased by 0.57 km2, 0.61 km2, and 1.53 km2, respectively. It is worth noting that, except for forest land and building land, which showed a positive growth trend, the remaining land categories exhibited a negative trend, as shown in Figure 10.
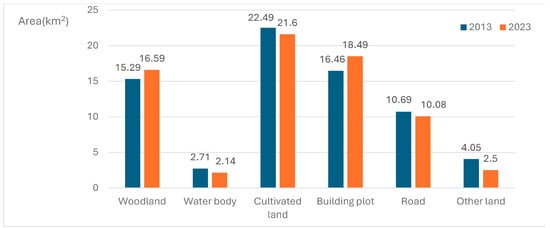
Figure 10.
Changes in the area of various types of Jingmaishan cultural landscape application areas.
From the Spatial Scale Perspective, the entire Jingmai Mountain Heritage Area is primarily dominated by cultivated land and building land, accounting for more than 40% and 30% of the area, respectively. As Illustrated in Figure 11, these two land types are distributed in a fragmented manner, mainly concentrated in the northern and south-central parts of the area, while forested land is situated between them. Consequently, it can be observed that over the ten-year period, the main landscape pattern of the cultural landscape heritage elements has not undergone drastic changes (see Figure 11).
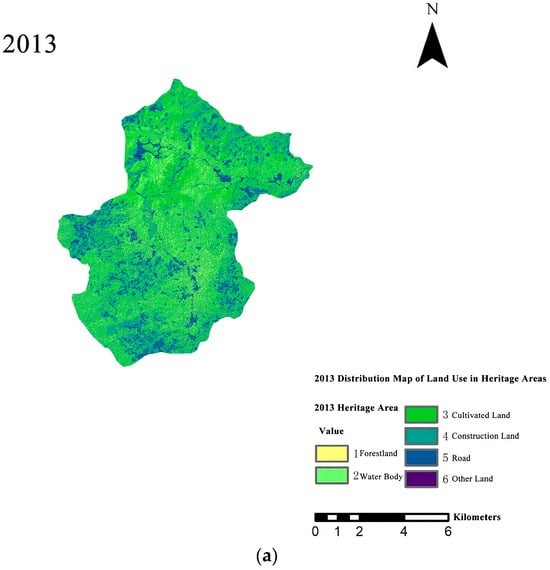
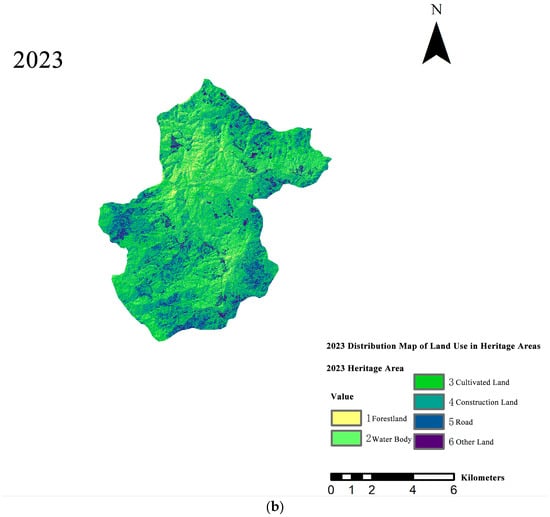
Figure 11.
Land cover change map of Jingmaishan cultural landscape application area in (a) 2013 and (b) 2023.
4.6. Evaluation of Ecological Environment Quality in the Jingmai Mountain Cultural Landscape Heritage Area
The eco-environmental quality index (EVt) is a quantitative index for evaluating the regional ecological environment quality, calculated by the method described in Section 3.2.5 (EVt = ∑Bti × Ri/TBt), where Bti is the area of land use type i at time t, Ri is the ecological quality coefficient for land use type i (Table 1), and TBt is the total area of the study region. The index value ranges from 0 to 1, with a higher value indicating better ecological environment quality.
Using the ecological environment quality index formula, this study calculated the index values based on the land type areas for the two reference years (2013 and 2023), the total area of the study region, and the corresponding ecological quality coefficients (as shown in Table 1).
The results presented in Table 6 indicate that the ecological environment quality index for the Construction Control Area within the Jingmai Mountain Cultural Landscape was 0.4476 in 2013 and increased slightly to 0.4512 in 2023. Similarly, Table 7 illustrates that the heritage core area recorded index values of 0.2450 in 2013 and 0.2522 in 2023.
Table 6.
Eco-environmental quality index of Jingmai Mountain construction control area.
Table 7.
Eco-environmental quality index of Jingmai Mountain cultural heritage core area.
These findings indicate that the ecological environment quality across both the Construction Control Area and the core heritage area has remained relatively stable, with a slight but consistent improvement over the past decade. This upward trend suggests that the region’s ecological integrity has been effectively preserved and gradually enhanced, reflecting the positive outcomes of conservation and sustainable management efforts within the heritage landscape.
To more intuitively present the temporal variation trend of ecological environment quality in the two functional zones, this study drew the temporal variation map of eco-environmental quality index from 2013 to 2023 (Figure 12) based on the calculation results of Table 6 and Table 7. It clearly shows the slight upward trend of ecological quality in the construction control area and the heritage core area, which is consistent with the quantitative analysis results in the previous text.
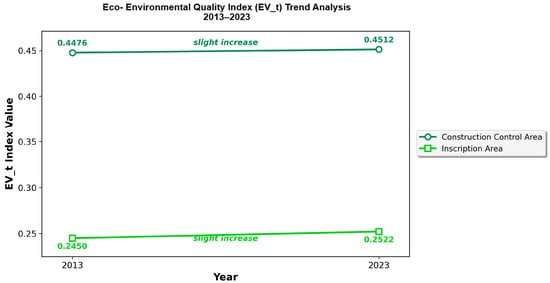
Figure 12.
Temporal variation in eco-environmental quality index (2013–2023).
5. Discussion
5.1. Key Findings and Contributions
This study provides a decadal spatial analysis (2013–2023) of land use and ecological changes in the Jingmai Mountain Cultural Landscape, officially named “Jingmai Mountain: Cultural Landscape of Ancient Tea Plantations” by UNESCO [27]. Results demonstrate relative landscape stability, especially within forest and arable lands, and a slight but consistent improvement in ecological quality across both the core and Buffer Areas. The observed land use changes exhibit clear directional consistency and quantitative concentration, for instance, 36% of changes in the Construction Control Area involve forests, and 33% in the application zone relate to cultivated lands indicating the transitions are not random but driven by policy interventions and socio-economic development (e.g., tourism growth and tea industry expansion). The findings suggest that heritage designation and related conservation policies have played a stabilizing role in both land use patterns and environmental outcomes. Compared with other large-scale Chinese cultural landscapes such as the Hani Rice Terraces [12] and the Manas River Basin [32], Jingmai Mountain exhibits similar trends in spatial resilience, but with site-specific characteristics driven by tea industry development and ethnic community protection, yet it reflects site-specific pressures and responses shaped by socio-economic demands. Socio-economic demands are supported by empirical data: after Jingmai Mountain’s inscription as a UNESCO World Heritage Site in September 2023, tourism development is one of the socio-economic drivers of land cover change in the study area, which has led to the expansion of built-up areas (2.03 km2 in the inscription area) for the construction of tourism service facilities. However, due to the lack of long-term tourist volume data at the plot scale, the quantitative correlation between tourist numbers and land cover change has not been analyzed in this study, which is a limitation to be addressed in future research.
Compared with ordinary areas, the land use changes in the Jingmai Mountain Cultural Landscape Heritage Area show distinct characteristics driven by heritage conservation policies and dual ecological-cultural value demands, with the core differences reflected in four aspects: (1) Change intensity: The total land cover change in the Construction Control Area (32.28 km2) and application zone (10.99 km2) accounts for only 30.48% and 15.33% of their respective total areas, which is significantly lower than the average land use change intensity of ordinary mountainous rural areas in Yunnan Province (about 45% in the same period). (2) Control mechanisms: The heritage area has a multi-level zoning control system (Core Area + Construction Control Area + Buffer Area), and land use conversion (e.g., forest to construction land) is subject to strict approval procedures, while ordinary areas lack hierarchical land use control. (3) Ecological orientation: Land use changes in the heritage area take ecological quality improvement as the basic premise (e.g., the increase of 3.42 km2 of woodland and the slight rise in EVt index), while ordinary areas often sacrifice ecological environment for short-term economic benefits.
5.2. Theoretical and Practical Implications
Theoretically, this study contributes to the evolving discourse in cultural landscapes by demonstrating how living heritage sites respond to policy interventions over time. The integration of ecological indicators and spatial land use analysis enhances our methodological understanding of heritage monitoring. Practically, the findings underline the importance of multi-scale zoning, local governance, and tourism regulation in balancing development and conservation. Furthermore, this research aligns with SDG 11.4, which explicitly calls for strengthening efforts to protect and preserve cultural and natural heritage [9]. EVt and land use stability analysis directly map to this target: the incremental improvement in EVt (Construction Control Area: 0.4476 → 0.4512; Core Area: 0.2449 → 0.2521) indicates enhanced ecological integrity of the cultural landscape, while controlled land use changes (e.g., 36% forest transition, 27% built-up area growth) reflect balanced conservation and development—core objectives of SDG 11.
5.3. Limitations and Future Work
This study has several limitations. First, the classification of land use types lacks finer granularity, especially regarding minor land cover classes such as grasslands, which were excluded due to their minimal area. While field verification and ENVI-based analyses provided acceptable accuracy, limitations in data resolution and the adopted methodology may have caused minor misclassifications.
Second, the ecological environment quality assessment did not adopt comprehensive indices like the Remote Sensing Ecological Index (RSEI). Instead, it relied on land use dynamics to infer ecological trends. Although sufficient for capturing general patterns, this method limits deeper analysis of the mechanisms linking land transformation with ecological change.
Field validation was also constrained by the large spatial extent of the heritage site and limited resources, reducing the ability to perform detailed point-based accuracy assessments. Due to resource constraints, we were unable to test specialized remote sensing equipment such as hyperspectral imagers (e.g., Gaofen-5 hyperspectral sensor) and ground-based LiDAR systems (e.g., RIEGL VZ-4000) [20].
For future work, integrating high-resolution satellite imagery with AI-based classification techniques—such as machine learning—could enhance accuracy and enable more detailed land use categorization. Moreover, combining ecological indicators with cultural factors would support a more holistic understanding of sustainable heritage governance. This is especially important for dual-listed heritage sites like Jingmai Mountain, where ecological preservation and cultural continuity must be addressed together.
5.4. Driving Mechanisms of Land Use Changes in the Jingmai Mountain Heritage Area
The land use changes in the Jingmai Mountain Cultural Landscape Heritage Area from 2013 to 2023 are the result of the synergistic action of policy, socio-economic, ecological protection and ethnic community development drivers, with policy drivers as the leading factor and socio-economic drivers as the fundamental motivation, and ecological protection drivers forming a strong constraint on land use evolution. The specific mechanisms are as follows:
Policy driving (leading factor): The listing of Jingmai Mountain on China’s Tentative List for World Heritage in 2012 and the implementation of the Regulations on the Protection of the Cultural Landscape of the Ancient Tea Forest in Jingmai Mountain in 2022 have established a multi-level zoning control system, which strictly restricts the conversion of forest land and ancient tea forest in the core area and guides the rational layout of construction land in the Construction Control Area. This is the core reason for the moderate and controlled land use change in the heritage area (the total change area is far lower than that of ordinary areas).
Socio-economic driving (fundamental motivation): On the one hand, the development of the tea industry (the core industry of the heritage area) has led to the slight adjustment of cultivated land and tea plantation land, and the decrease of 3.26 km2 of arable land is partially due to the conversion of low-yield farmland to tea plantations; on the other hand, the rapid development of tourism after the World Heritage inscription (tourist arrivals increased by 33.52% year-on-year) has driven the expansion of built-up areas (the Construction Control Area increased by 0.39 km2, the core area increased by 2.03 km2) for the construction of tourist service facilities and rural homestays.
Ethnic community development driving (microscopic driver): The Jingmai and Mangjing villages (inhabited by Dai and Blang ethnic groups) have the demand for improving residential conditions, which has led to the conversion of a small amount of agricultural land and forest land to residential land in the village scope. At the same time, the traditional land use concept of “harmony between man and nature” of ethnic minorities has restrained the excessive transformation of land use, forming a microscopic constraint on land use changes.
6. Conclusions
This study provides high-resolution remote sensing-based quantitative analysis evidence of landscape resilience in the Jingmai Mountain Heritage Area over the past decade, despite growing socio-economic pressures. Key quantitative findings include the following: (1) Forest land change: The construction control area had the most significant forest land change (36% of total change), with a net increase of 3.42 km2 in woodland area, which was the main driver of the slight improvement of the ecological environment. (2) Cultivated land change: Cultivated land was the main change type in the inscription area (33% of total change), with a net decrease of 0.59 km2, mainly converted to built-up areas driven by tourism and rural residential construction. (3) Built-up area change: Built-up areas expanded by 0.39 km2 (construction control area) and 2.03 km2 (inscription area), accounting for 17% and 27% of the total change in each area, respectively, which was the main human-driven land cover change type. (4) In total, there was 32.28 km2 of land cover change in the Construction Control Area (36% from forests, 19% from cultivated lands). (5) There was 10.99 km2 of change in the application zone (33% from cultivated lands, 27% from built-up areas). (6) There was a slight increase in ecological quality indices (Construction Control Area: 0.4476 → 0.4512; Core Area: 0.2449 → 0.2521). Land use changes remain moderate and controlled, and the ecological environment has shown incremental improvements, particularly within the core and Buffer Areas. These findings suggest that heritage management frameworks and conservation policies have been instrumental in maintaining ecological and spatial stability.
Overall, this study advances our understanding of how living cultural landscapes evolve in the context of heritage designation and conservation policy. The innovation of this study lies in its decadal (2013–2023) high-resolution spatial analysis of Jingmai Mountain’s post-nomination dynamics, integration of statistical validation for land use changes, and alignment with SDG 11 through a replicable monitoring methodology. By providing high-resolution remote sensing-based quantitative analysis evidence of land use stabilization, ecological improvement, and the complex trade-offs between authenticity and development, the research highlights the practical implications of integrating spatial and ecological analysis in cultural heritage management. Furthermore, the comparative perspective and alignment with national strategies and global sustainability agendas underscore the relevance of this approach for informing adaptive and resilient policy frameworks for heritage sites in similar socio-ecological contexts.
By analyzing land use dynamics and ecological quality changes, this study contributes to a growing body of literature on sustainable heritage governance. It underscores the role of regulatory mechanisms in curbing unsustainable land practices while also revealing the potential of cultural landscapes to absorb development pressures without compromising their core ecological or cultural values.
Author Contributions
Conceptualization, C.Z., M.J.M.T. and K.A.-Z.; Methodology, C.Z., M.J.M.T. and K.A.-Z.; Software, C.Z.; Formal analysis, C.Z. and M.J.M.T.; Investigation, M.J.M.T. and K.A.-Z.; Resources, C.Z. and M.J.M.T.; Data curation, C.Z.; Writing—original draft, C.Z., M.J.M.T. and K.A.-Z.; writing—review and editing, C.Z., M.J.M.T. and K.A.-Z.; Visualization, C.Z.; Supervision, M.J.M.T.; Funding acquisition, M.J.M.T. All authors have read and agreed to the published version of the manuscript.
Funding
This research was funded by Universiti Sains Malaysia (USM) through the Skim Insentif Pengantarabangsaan (R502-KR-ARP004-00AUPRM003-K134).
Data Availability Statement
The data that support the findings of this study are available upon request from the corresponding authors.
Conflicts of Interest
The authors declare no conflicts of interest.
References
- Luo, Y.; Wang, Z.; Zhou, X.; Hu, C.; Li, J. Spatial-temporal driving factors of urban landscape changes in the Karst mountainous regions of Southwest China: A case study in central urban area of Guiyang City. Sustainability 2022, 14, 8274. [Google Scholar] [CrossRef]
- Rashed, A. The Impacts of Unsustainable Urbanization on the Cultural Heritage; IntechOpen: London, UK, 2026. [Google Scholar]
- Tang, Y.; Chen, F.; Yang, W.; Ding, Y.; Wan, H.; Sun, Z.; Jing, L. Elaborate monitoring of land-cover changes in cultural landscapes at heritage sites using very high-resolution remote-sensing images. Sustainability 2022, 14, 1319. [Google Scholar] [CrossRef]
- Zhang, Y.; Zou, Y.; Liu, X. Conservation and Management Practice of Heritages in Jingmai Mountain. J. Nat. Cult. Herit. Res. 2020, 5, 45–55. [Google Scholar] [CrossRef]
- Loren-Méndez, M.; Alonso-Jiménez, R.F.; Pinzón-Ayala, D. Modern Heritage in the Context of UNESCO. Recognition, Geographical Representation and Criteria of European Cultural Heritage in the World Heritage List: France, Germany, Italy and Spain. In Sustainable Heritage Management-Design: Notions, Methods and Techniques; Springer: Berlin/Heidelberg, Germany, 2025; pp. 31–45. [Google Scholar]
- Puer Daily. Regulations on the Protection of the Cultural Landscape of the Ancient Tea Forest in Jingmai Mountain; Puer Daily: Puer City, China, 2022. [Google Scholar]
- Lechner, A.M.; Foody, G.M.; Boyd, D.S. Applications in remote sensing to forest ecology and management. One Earth 2020, 2, 405–412. [Google Scholar] [CrossRef]
- Kou, L.; Wang, X.; Wang, H.; Wang, X.; Hou, Y. Spatiotemporal analysis of ecological benefits coupling remote sensing ecological index and ecosystem services index. Ecol. Indic. 2024, 166, 112420. [Google Scholar] [CrossRef]
- Unesco World Heritage Centre (United Nations Educational, Scientific and Cultural Organization). Decision 45.COM 10.B.10: Jingmai Mountain: Cultural Landscape of Ancient Tea Plantations (China); United Nations Educational, Scientific and Cultural Organization: Paris, France, 2023. [Google Scholar]
- Department of Culture and Tourism of Yunnan Province. Statistical Communique on the Development of Culture and Tourism Industry in Yunnan Province 2023; Department of Culture and Tourism of Yunnan Province: Kunming City, China, 2023. [Google Scholar]
- Statistics Bureau of Lancang Lahu Autonomous County. Lancang Lahu Autonomous County statistical yearbook 2023; China Statistics Press: Beijing, China, 2023. [Google Scholar]
- Wang, C.; Xu, D.; Lin, W. Remote sensing monitoring and land cover changes of the Honghe Hani Rice Terraces World Cultural Landscape Heritage. J. Ecol. Environ. Sci. 2021, 30, 233–241. [Google Scholar] [CrossRef]
- Xu, Y. The evolution of Puer Tea cultural landscape and its conservation in Jingmai Mountain, Yunnan, China. Ph.D. Thesis, University of Tokyo, Tokyo, Japan, 2017. [Google Scholar] [CrossRef]
- Zhang, S. Research on Regional Protection Models for Cultural Heritage. Master’s Thesis, Chinese National Academy of Arts, Beijing, China, 2012. [Google Scholar]
- Zhu, Q.; Li, W. Heritage Area: A New Method for the Protection of Large-scale Cultural Landscapes. China Popul. Resour. Environ. 2007, 1, 50–55. [Google Scholar] [CrossRef]
- Zhang, X. Research on the Conservation and Utilisation of Revolutionary Cultural Relics from the Perspective of Heritage Regions: A Case Study of Xiangxi Prefecture. Master’s Thesis, Jilin University, Changchun, China, 2022. Available online: https://d.wanfangdata.com.cn/thesis/D02646257 (accessed on 21 February 2026).
- Cigna, F.; Balz, T.; Tapete, D.; Caspari, G.; Fu, B.; Abballe, M.; Jiang, H. Exploiting satellite SAR for archaeological prospection and heritage site protection. Geo-Spat. Inf. Sci. 2024, 27, 526–551. [Google Scholar] [CrossRef]
- Virelli, M.; Coletta, A.; Tapete, D.; Cigna, F. COSMO-SkyMed: A satellite tool for monitoring cultural heritage. Int. Arch. Photogramm. Remote Sens. Spat. Inf. Sci. 2023, 48, 1621–1627. [Google Scholar] [CrossRef]
- Seto, K.C.; Güneralp, B.; Hutyra, L.R. Global forecasts of urban expansion to 2030 and direct impacts on biodiversity and carbon pools. Proc. Natl. Acad. Sci. USA 2012, 109, 16083–16088. [Google Scholar] [CrossRef] [PubMed]
- Agapiou, A. Unequal Horizons: Global North–South Disparities in Archaeological Earth Observation (2000–2025). Remote Sens. 2025, 17, 3371. [Google Scholar] [CrossRef]
- Primi, R.; Viola, P.; Rossi, C.M.; Ripert, S.; Ripa, M.N.; Spina, R.; Ronchi, B. Impacts of changing livestock farming practices on the biocultural heritage and landscape configuration of Italian anti-Apennine. Land 2024, 13, 243. [Google Scholar] [CrossRef]
- Megarry, W.; Venkatachalam, T.; Day, J.; Jain, S.; Heron, S. Land use and land cover analysis of cultural World Heritage to inform assessment of climate vulnerability. J. Cult. Herit. 2026, 77, 243–253. [Google Scholar] [CrossRef]
- Deng, M.; Xiong, K.; Shu, T.; Zhang, Y.; Liu, S. Research progress and prospects on tourism benefit evaluation based on multi-source remote sensing monitoring. J. Guizhou 2021, 39, 109–118. [Google Scholar] [CrossRef]
- Zhang, R.; Kuang, D.; Peng, C.; Li, X. China’s cultural and natural heritage under climate change. World Archit. Bull. 2023, 38, 47–49. [Google Scholar] [CrossRef]
- Wang, C.; Xu, D. The Construction of a Heritage Monitoring Data Platform in China. Herit. Conserv. Stud. 2021, 8, 456–470. [Google Scholar]
- Pham, T.T.; Dang, K.B.; Giang, T.L.; Hoang, T.H.N.; Le, V.H.; Ha, H.N. Deep learning models for monitoring landscape changes in a UNESCO Global Geopark. J. Environ. Manag. 2024, 354, 120497. [Google Scholar] [CrossRef] [PubMed]
- UNESCO World Heritage Committee. Decision 45 COM 8B.9: Cultural Landscape of Old Tea Forests of the Jingmai Mountain in Pu’er (China); UNESCO: Paris, France, 2023. [Google Scholar]
- Tomlinson, R.F. Geographical Information Systems, Spatial Data Analysis and Decision Making in Government. Ph.D. Thesis, University of London, London, UK, 1974. [Google Scholar]
- Ai, Q. Study on Ecological Sensitivity Analysis and Evaluation of Scenic Areas Based on GIS. Master’s Thesis, Southwest University, Chongqing, China, 2007. [Google Scholar]
- GB/T 21010–2017; National Standard of the People’s Republic of China, Standard for Classification of Land Use Status Quo. China Standards Press: Beijing, China, 2017.
- Wang, X.L.; Qin, F.C. Land use transition and its eco-environmental effects in the Anning River Basin. J. China West Norm. Univ. Nat. Sci. Ed. 2023, 44, 605–611. [Google Scholar] [CrossRef]
- Tang, X.-y.; Tang, X.-l. Monitoring of Land Use/Land Cover Transformations in Inland River Basin of the Arid Area in the Recent 30 Years:Taking Manasi River Basin in Xinjiang as an Example. Agric. Econ. 2016, 55, 5500–5506. [Google Scholar] [CrossRef]


Disclaimer/Publisher’s Note: The statements, opinions and data contained in all publications are solely those of the individual author(s) and contributor(s) and not of MDPI and/or the editor(s). MDPI and/or the editor(s) disclaim responsibility for any injury to people or property resulting from any ideas, methods, instructions or products referred to in the content. |
© 2026 by the authors. Licensee MDPI, Basel, Switzerland. This article is an open access article distributed under the terms and conditions of the Creative Commons Attribution (CC BY) license.