Abstract
As former chemical sites, especially retired pesticide plants, the redevelopment of “brownfield” land imposes urgent demands for detailed environmental investigation and remediation. Addressing the current limitations in pollution characterization, which often remain confined to two-dimensional representations and lack research on the vertical migration mechanisms of heavy metals and their integration with three-dimensional remediation and management strategies, this study focuses on a typical retired pesticide plant site in Southeastern Zhejiang, China. Through systematic analysis of 916 soil borehole samples collected from 92 sampling points, the study integrates three-dimensional visualization technology and three-dimensional ordinary kriging interpolation to establish a high-precision three-dimensional characterization system covering stratigraphy, pollution plumes, and composite risks. The findings reveal that the As and Ni pollution plumes have volumes of 5.35 × 10⁴ m3 and 2.78 × 10⁵ m3, respectively. Furthermore, As and Ni exhibit significant vertical migration capabilities within sandy and silty soil layers, while elements such as Hg, Cd, and Pb are primarily concentrated in the surface fill layer. By combining three-dimensional risk modeling based on the single-factor pollution index, Nemerow comprehensive index, and potential ecological risk index, the study precisely classifies the site into four graded zones: safe use zone, basically safe use zone, low-risk control zone, and high-risk control zone. This approach enables the visualization and quantification of pollution levels. The research constructs a comprehensive methodological framework that extends from three-dimensional pollution characterization to zonal management decision-making, providing scientific evidence and technical support for the precise remediation and sustainable redevelopment of similar retired industrial sites.
1. Introduction
Soil heavy metal contamination is one of the core issues in current environmental science research [1,2]. Among various pollution sources, the chemical industry is regarded as one of the most significant contributors to soil heavy metal pollution, after mining and smelting activities [3,4]. As a vital component of the basic chemical industry, pesticide and fertilizer production involves coal combustion in boilers and the use of various metal catalysts, making pesticide factories highly representative sites of soil heavy metal contamination [5,6]. With the acceleration of urban renewal, a large number of industrial “brownfields” are being repurposed for residential and public land-use, imposing stringent requirements for environmental site investigation, risk management, and precise remediation [7].
Currently, a relatively mature framework for assessing soil heavy metal pollution has been established both domestically and internationally [8]. Evaluation methods such as the single-factor pollution index, the Nemerow comprehensive pollution index, and the potential ecological risk index are widely applied [9]. In terms of spatial analysis, geostatistical methods, such as Kriging interpolation, combined with Geographic Information Systems (GIS), have enabled spatial visualization of pollution to some extent [10]. However, most studies remain confined to two-dimensional or quasi-three-dimensional levels, inadequately characterizing the distribution patterns of pollutants in the vertical direction [11]. There is a particular lack of systematic representation of the three-dimensional morphology of pollution plumes, the migration mechanisms constrained by geological strata, and the spatial differentiation of multi-indicator comprehensive risks [12]. Moreover, existing research predominantly focuses on pollution assessment and spatial interpolation, with weak linkages between three-dimensional models and practical remediation management [13]. There is insufficient research on zoning management and remediation optimization based on three-dimensional pollution characterization. In recent years, the widespread adoption of specialized three-dimensional environmental simulation software such as EVS and GMS, along with the introduction of methods like machine learning, has continuously improved the accuracy of three-dimensional characterization and prediction of soil pollution, offering new possibilities for the refined management of contaminated sites [13,14].
However, compared to the well-established pollution risk assessment methods and two-dimensional spatial differentiation research with abundant findings, the three-dimensional characterization of soil heavy metal pollution based on emerging 3D spatial interpolation techniques and 3D modeling software still has room for improvement [15,16]. First, most existing studies focus on spatial interpolation of measured heavy metal content in soil [17]. To effectively align interpolation results with management levels, three-dimensional characterization or even spatial overlay of pollution risk assessment outcomes, such as those from the Nemerow comprehensive pollution index, potential ecological risk index, and human health risk assessment models, could be attempted. Second, the role of three-dimensional visualization technology in integrating multi-source information has not been fully realized in current research [18]. Beyond soil heavy metal content, information on soil physicochemical properties and hydrogeological data obtained during sampling should also be incorporated into three-dimensional characterization [19]. For instance, geological models could be constructed using soil lithology data to facilitate the selection of appropriate remediation methods based on soil properties [20]. Finally, as a purely data-driven approach, spatial interpolation may not always align with the geochemical mechanisms underlying the spatial differentiation of heavy metals [21]. In addition to three-dimensional characterization, analyzing correlations between different heavy metal contents, as well as between heavy metal content and soil depth, would enhance understanding of surface pollution sources and vertical migration patterns of heavy metals in soil [22,23].
As a major base for pesticide production in China, Zhejiang Province has historically hosted numerous pesticide manufacturing enterprises, making soil contamination at their retired sites particularly typical. This study selects a retired pesticide factory site in Southeastern Zhejiang, China, as the research object. By systematically collecting soil samples from various depths and measuring the contents of eight typical heavy metals—Hg, As, Ni, Cu, Zn, Pb, Cd, and Cr—combined with three-dimensional characterization techniques and pollution risk assessment, the study aims to achieve the following objectives: (1) Construct pollution plume and risk assessment models to identify pollution hotspots and high-risk areas; (2) Reveal the distribution characteristics and migration patterns of heavy metals in three-dimensional space; (3) Propose targeted zoning management and remediation recommendations to provide references for the treatment and management of similar contaminated sites.
2. Materials and Methods
2.1. Study Site and Soil Sampling
This study was conducted at a retired pesticide plant site located in Southeastern Zhejiang, China. The selection of this site was primarily based on the following considerations: First, the chemical industry is one of the most significant sources of soil heavy metal pollution, after mining and smelting activities. As an important category within the basic chemical industry, pesticide and fertilizer production involves both coal combustion in boilers and the use of various metal catalysts. Therefore, pesticide plants are highly representative of heavy metal-contaminated sites. Second, Zhejiang Province has historically been a major center for pesticide production, and the Zhejiang Provincial List of Construction Land Soil Pollution Risk Management and Remediation updated between 2019 and 2024 consistently included pesticide plants. Consequently, conducting research on pesticide plants in Zhejiang Province has direct application value for promoting soil pollution risk management on construction land in this province.
The original pesticide plant was constructed and commenced operations in 1971, ceased all production in 2008, and completed demolition of buildings and structures in 2016. As of the time of this study, the retired site remained bare land, with future land-use planning designating it as Category I land-use (residential and public land). Therefore, this site represents a typical brownfield; namely, idle land with soil contamination risks. The geographical location and boundaries of the study area are shown in Figure 1, with a total area of around 40,000 m2. The southern side of the site is a fluvial terrace of the Xin’an River valley, while the northern side borders erosional hilly gentle slopes. The overall terrain exhibits a northward-high and southward-low topography.
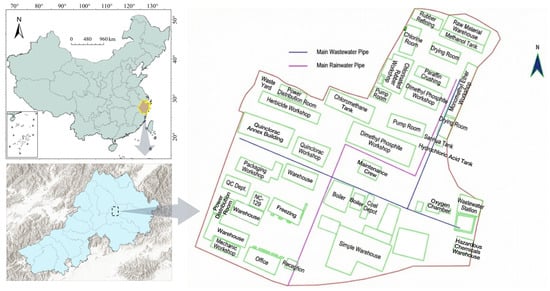
Figure 1.
Geographical location map and production zone diagram of the pesticide plant.
The data from the 92 soil sampling points (Figure 2) used in this study were obtained from two sampling phases: the preliminary and detailed environmental investigations. During the preliminary investigation phase, based on national and provincial technical guidelines, and with a thorough understanding of the site’s pollution discharge processes, the sampling method was determined through a combination of systematic placement and professional judgment. This approach considered the site’s topography, hydrogeological characteristics, pipeline layout, and pollutant migration patterns, while also incorporating the historical layout of the production area, historical satellite imagery, and experience from similar industrial sites. The grid scale was determined by balancing sampling costs and spatial representativeness. On the one hand, soil sampling and heavy metal analysis involve substantial costs, with smaller grid spacing leading to more sampling points and higher expenses. On the other hand, the Technical Guidelines for Environmental Site Investigation (HJ 25.1-2014) [24] stipulated that for areas requiring delineation of contamination boundaries, the sampling unit area should not exceed 1600 m2 (equivalent to a 40 m × 40 m grid) to ensure adequate representativeness. Considering both factors, a 40 m × 40 m grid was adopted for the preliminary investigation phase, which is also a commonly used grid scale for site soil contamination investigations of similar areas. The site was divided into monitoring zones using this grid. Within each grid, specific sampling locations were selected through professional judgment, deliberately targeting areas potentially affected by historical production activities to accurately delineate contamination boundaries and identify polluted zones. A total of 28 sampling points were established (marked with “S” in Figure 2a). During the detailed investigation phase, sampling points were densely deployed in areas identified as contaminated during the preliminary investigation. To further refine the contamination boundaries, a denser 20 m × 20 m grid was employed around the initially identified exceedance points, resulting in a total of 64 sampling points (marked with “XS” in Figure 2a).
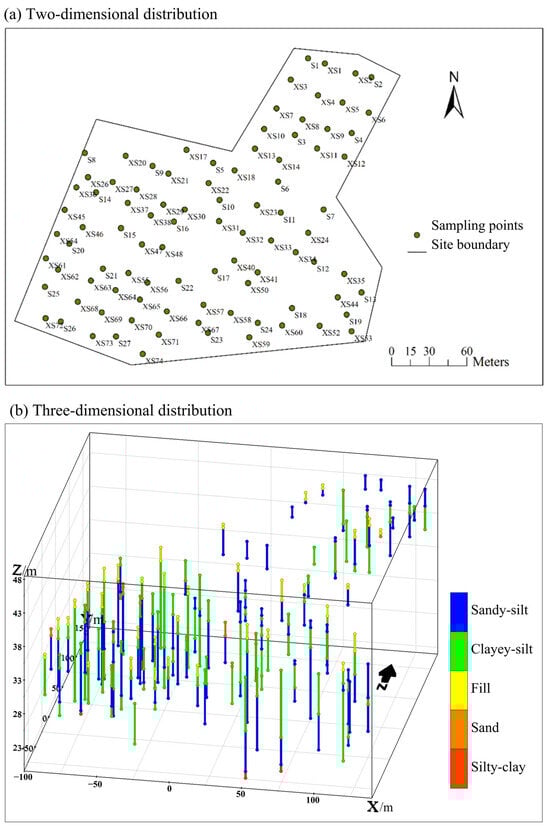
Figure 2.
Distribution of soil borings.
Regarding sampling depth settings, soil layer thickness varied across the site. In accordance with the Technical Guidelines for Environmental Site Monitoring (HJ 25.2-2014) [25], the sampling interval within the 0–3 m depth range was 0.5 m (specifically: 0–0.5 m, 0.5–1.0 m, 1.0–1.5 m, 1.5–2.0 m, 2.0–2.5 m, and 2.5–3.0 m), while the interval for the 3–6 m depth range was 1 m (specifically: 3.0–4.0 m, 4.0–5.0 m, and 5.0–6.0 m). Below 6 m to the groundwater level, the sampling interval was 2 m, with the maximum sampling depth extending to uncontaminated soil layers. Consequently, drilling equipment was used at the 92 soil sampling points to collect soil samples at various depths, yielding a total of 916 borehole soil samples (Figure 2b). Laboratory analyses were conducted using atomic fluorescence spectrometry, flame atomic absorption spectrophotometry, and graphite furnace atomic absorption spectrophotometry. Then, the concentrations of eight typical heavy metal elements—Hg, As, Ni, Cu, Zn, Pb, Cd, and Cr—as well as soil properties including texture and pH were determined for each sample.
2.2. Methods
2.2.1. Three-Dimensional Characterization Techniques
Three-dimensional visualization software and three-dimensional spatial interpolation form the foundation of three-dimensional characterization techniques. In this study, EVS (Environmental Visualization System) software version 2019.7.1 was used to perform three-dimensional interpolation and visualization of borehole data, constructing stratigraphic models, pollution plume models, and pollution risk models.
Regarding the selection of interpolation methods, based on previous studies comparing the accuracy of three-dimensional Kriging (3D-OK), IDW, and NN interpolation methods, this study adopted the 3D-OK interpolation method due to its higher accuracy [26,27]. This method first constructs semi-variograms in both horizontal and vertical directions using sampling point data, and then combines them to build a three-dimensional semi-variance model to determine the weights of neighboring sampling points. Finally, predictions for estimation points are made through weighted averaging of sampling points. Since the heavy metal concentration data from sampling points did not follow a normal distribution, logarithmic transformation was applied before interpolation. Additionally, to unify the study extent, the area_cut module in EVS was used to filter the three-dimensional interpolation results, retaining only regions within and beneath the site boundary.
When constructing the stratigraphic model, stratigraphic division of boring samples must first be performed. Traditional approaches typically perform stratigraphic division based on vertical cross-sections. Therefore, most geological modeling software requires generating cross-sections from borehole information before determining stratigraphy, which limits efficiency. Moreover, this two-dimensional division approach may not fully adapt to three-dimensional space, potentially necessitating further stratigraphic adjustments during subsequent three-dimensional model construction, thereby increasing operational complexity. Unlike traditional two-dimensional approaches, the make_geo_hierarchy module in EVS software innovatively employs a three-dimensional interactive approach, allowing users to visually create layer surfaces for each stratum using borehole PGF files, thus completing stratigraphic division.
In contrast to stratigraphic model construction, the development of heavy metal concentration prediction models (three-dimensional pollution plume models) requires particular attention to the horizontal-to-vertical anisotropy ratio due to the pronounced anisotropic spatial characteristics of pollutant distribution in soil. Specifically, horizontal migration of pollutants in soil is typically accompanied by downward movement through geological strata, and pollutant concentration changes in the vertical direction often exceed those in the horizontal direction. Correspondingly, during interpolation calculations, points in the vertical direction within the sampling point neighborhood should have higher influence weights on prediction points than those in the horizontal direction. This biased weighting was implemented in EVS software by setting the horizontal-to-vertical anisotropy ratio. The default value of this coefficient is 10 (used for constructing the stratigraphic model), indicating that sampling points at 10 horizontal length units have the same influence weight as those at 1 vertical length unit. Following the parameter optimization approach described by Liu et al. [28], the horizontal-to-vertical anisotropy ratio was tested at values of 5, 10, 15, and 20 to evaluate the prediction accuracy of the resulting heavy metal concentration models. The results indicated that when the ratio was set to 5, the models achieved the highest Significance Mean and the lowest Uncertainty Mean. Therefore, this coefficient was set to 5 to establish the three-dimensional concentration models for each metal element.
2.2.2. Pollution Risk Assessment Methods
Based on a comparison of the advantages and limitations of existing soil heavy metal pollution assessment methods, this study selected the single-factor pollution index method, Nemerow comprehensive pollution index method, and potential ecological risk index method to evaluate soil heavy metal pollution risk [29,30,31]. This selection was primarily based on two considerations: Firstly, existing assessment methods differ in evaluation targets, evaluation criteria, and operational difficulty. A single assessment method has inherent limitations in providing a comprehensive picture. Therefore, consistent with most soil pollution assessment studies, this study employed multiple commonly used methods, each with its own focus, to characterize soil pollution risk. Secondly, this study aimed to spatially overlay assessment results with different emphases to obtain comprehensive three-dimensional assessment results for guiding management zoning. All three methods can generate assessment results for individual sampling points rather than a single result for the entire site, enabling subsequent three-dimensional interpolation of assessment results.
Specifically, among the three selected methods, the single-factor pollution index method and Nemerow comprehensive pollution index method are stipulated in Chinese national soil environmental quality standards, national soil pollution status assessment technical specifications, and other official documents or technical procedures. The former is easy to implement but only reflects the pollution level of a single heavy metal, while the latter reflects the comprehensive pollution level of multiple heavy metals in soil. Both typically use risk screening values as evaluation criteria, maintaining closer alignment with regulatory management standards. The potential ecological risk index method additionally incorporates heavy metal toxicity response coefficients, taking into account the varying degrees of environmental hazard posed by different metals. Calculations typically use regional soil geochemical background values as evaluation criteria, emphasizing the degree of pollution resulting from human activities in a specific area.
The calculation formulas for the three methods are presented in Equations (1)–(3):
where represents the single-factor pollution index at sampling point i; represents the measured heavy metal concentration at sampling point i; and represents the soil environmental quality standard value for the heavy metal, which was primarily set according to the Soil Environmental Quality Risk Control Standard for Contaminated Sites of Development Land (Trial Implementation), as detailed in Table 1.
where represents the Nemerow comprehensive pollution index at sampling point i; represents the mean of single-factor pollution indices for all heavy metal elements at sampling point i; and represents the maximum value among single-factor pollution indices for all heavy metal elements at sampling point i.
where represents the comprehensive potential ecological risk index at sampling point i; represents the potential ecological risk index for heavy metal element r at sampling point i; represents the measured concentration of heavy metal r at sampling point i; represents the toxicity coefficient of heavy metal r, reflecting its toxicity level and the sensitivity of organisms to heavy metal pollution, with values assigned as Hg = 40, As = 10, Ni = 5, Cu = 5, Zn = 1, Pb = 5, Cd = 30, Cr = 2; and represents the reference value, for which this study adopted regional soil geochemical baseline values [32] as detailed in Table 1.

Table 1.
Descriptive statistics of soil heavy metal concentrations and related evaluation criteria.
2.2.3. Correlation Analysis
Two-dimensional spatial autocorrelation analysis of variables was conducted to statistically determine whether and to what extent spatial correlation exists [33]. This study employed hotspot analysis (Getis-Ord Gi*) to explore local spatial associations of heavy metal concentrations in surface soil, implemented using ArcMAP software (version 10.8). Additionally, to investigate the relationships between heavy metal concentrations and soil depth, soil pH, as well as inter-elemental relationships, and considering that heavy metal concentration data did not follow a normal distribution, Spearman correlation coefficients were calculated using Origin software (version 2014).
3. Results
3.1. Descriptive Statistics of Soil Heavy Metal Concentrations
Based on the future land-use planning category of the study site (Category I construction land/residential and public land), relevant evaluation criteria were determined using national standard values and regional background values. National standard values were selected as the most stringent risk screening values for the corresponding land-use category from the Soil Environmental Quality Risk Control Standard for Soil Contamination of Development Land (Trial Implementation) (GB36600-2018) [34] and the Zhejiang provincial local standard— Guideline for Risk Assessment of Contaminated Sites (DB33/T 892-2013) [35]. Regional background values adopted the Hangjiahu Plain soil environmental background values analyzed and calculated by the Zhejiang Provincial Geological Survey Institute.
Descriptive statistics of heavy metal concentration sampling data at the study site were conducted according to the above criteria (Table 1). The results indicated that the maximum values of Hg, As, and Ni concentrations all exceeded risk screening values. Notably, the maximum values of As and Ni reached 4.9 and 2.8 times their respective screening values, indicating substantial exceedance and the presence of high-concentration pollution zones for these elements in the site soil. The mean concentrations of As and Ni approached their risk screening values, further indicating that both elements were present throughout the site at relatively high concentrations. While the average Hg concentration was significantly below the risk screening value, its maximum value exceeded this threshold. This suggests that although overall Hg levels in the site soil are low, isolated high-value areas exist. The maximum values of the remaining five heavy metal elements did not exceed screening values, but four elements excluding Cd showed varying degrees of exceedance relative to regional background values. Specifically, Cu, Zn, and Pb exceeded background values by 4.4, 4.5, and 5.1 times, respectively. Cd concentrations at all sampling points were significantly below both national standards and regional background values, indicating essentially no Cd contamination at the site. The above analysis preliminarily revealed that the site soil exhibited contamination (and even high-concentration contamination) dominated by As and Ni, with coexisting pollution from Hg, Cu, Zn, Pb, and Cr.
Kurtosis and skewness are statistical measures reflecting data distribution shape, representing the peakedness and symmetry of distributions, respectively. The high kurtosis value (49.175) for Zn element concentration in the study area indicated relatively concentrated data distribution. Positive skewness values for all eight heavy metal concentrations indicated the presence of numerous extreme values to the right of the mean. The coefficient of variation, calculated as the ratio of standard deviation to mean, can measure the spatial variability of element concentrations. Generally, coefficients of variation less than 0.1 indicate weak variability, between 0.1 and 1 indicate moderate variability, and greater than 1 indicate strong variability. Accordingly, Hg, Pb, and Cd exhibited highly uneven distribution within the site, while other heavy metal elements also demonstrated considerable variability, suggesting that heavy metal pollution in the study area was substantially influenced by anthropogenic activities.
3.2. Exploratory Spatial Data Analysis of Soil Heavy Metals
Prior to three-dimensional characterization, exploratory spatial data analysis was conducted on soil heavy metal concentrations in both vertical and horizontal directions to preliminarily understand the spatial differentiation patterns of heavy metals in site soil. Simultaneously, integrating the information on soil pH, soil lithology, and historical production activities at the site would facilitate understanding of heavy metal accumulation and migration patterns under the combined influence of soil physicochemical properties, hydrogeological conditions, and anthropogenic factors.
3.2.1. Correlation Analysis Between Heavy Metal Concentrations and Key Soil Physicochemical Properties
Heavy metal migration capacity is influenced by multiple factors related to soil and inherent physicochemical properties. Spearman correlation coefficients were calculated in this study to explore the effects of soil depth and pH, which are two key soil attributes, on heavy metal spatial differentiation characteristics. As shown in Figure 3, Cu, Zn, Pb, and Cd concentrations in the site were negatively correlated with soil depth, while As and Ni concentrations were positively correlated with soil depth. Subsequent sections will further analyze these phenomena through three-dimensional modeling combined with the migration capacity of each element in different strata. Regarding pH, the soil pH values of borehole samples at the site exhibited a wide range of variation (2.98–11.3), with pH showing a significant decreasing trend with increasing soil depth. Hg and Cd concentrations showed highly significant (p < 0.001) positive correlations with pH, indicating that these two elements were more likely to accumulate in alkaline soil environments.
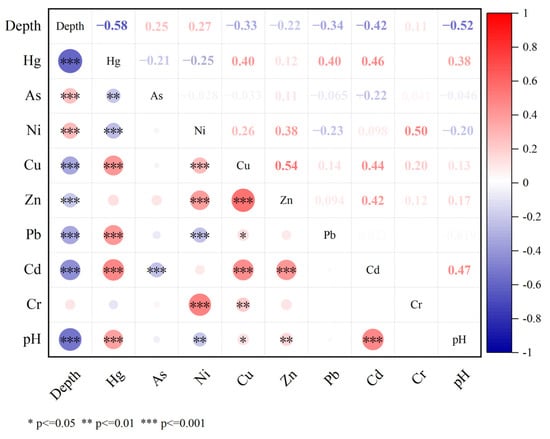
Figure 3.
Heatmap of Spearman correlation coefficients between heavy metal concentrations and soil depth and soil pH.
Figure 3 also presents the correlations among different heavy metal elements. Hg-Cu, Hg-Pb, Hg-Cd, Ni-Cu, Ni-Zn, Ni-Cr, Cu-Zn, Cu-Cd, and Zn-Cd all exhibited significant positive correlations. These correlations suggest two important implications for site pollution characterization and remediation. Firstly, regarding common sources, the significant correlations among Hg-Cu-Pb-Cd may indicate their co-release from similar production activities at the pesticide plant, such as coal combustion in boilers (a known source of Hg and Pb) or the use of metal catalysts in chemical synthesis processes. Similarly, the correlations among Ni-Cu-Zn-Cr could reflect their joint emission from metallurgical activities or wastewater discharge during pesticide manufacturing. Secondly, concerning compound relationships, the co-occurrence of these heavy metals means that contaminated zones often contain multiple elements simultaneously rather than single-element pollution. For instance, areas with high Cu concentrations are likely to also exhibit elevated Zn and Cd levels. This compound relationship has practical implications for remediation planning: treatment technologies must be effective against multiple heavy metals simultaneously, and remediation schemes should consider potential antagonistic or synergistic effects among different elements when selecting chemical reagents or biological methods. Therefore, when formulating site pollution remediation plans, it is essential to account for these inter-element relationships to design comprehensive treatment strategies that address co-contamination patterns rather than treating each metal independently.
3.2.2. Hotspot Analysis of Heavy Metal Distribution in Surface Soil
In the horizontal direction, surface soil data were extracted for spatial autocorrelation analysis to explore associations between pollution hotspots and original site production activities. According to the Guidelines for Environmental Investigation, Assessment, and Remediation of Industrial Enterprise Sites (Trial) issued by the former Ministry of Environmental Protection, in the context of construction land, surface soil typically refers to soil within a depth of 0.5 m. Borehole samples were filtered and processed according to this depth range, ultimately yielding 72 sampling point data points belonging to surface soil. Hotspot analysis results based on these data (Figure 4) indicated relatively significant local spatial associations of heavy metal concentrations within the site’s surface soil. All eight elements exhibited hotspots with confidence levels greater than 95%, representing clustering phenomena of high heavy metal concentration values. In conjunction with the original pesticide plant production zone layout, the warehouse in the northeastern corner of the site, the temporary warehouse in the southern portion, and the wastewater treatment station and hazardous materials warehouse in the southeastern area represented locations where multiple heavy metals exhibited high-value clustering.
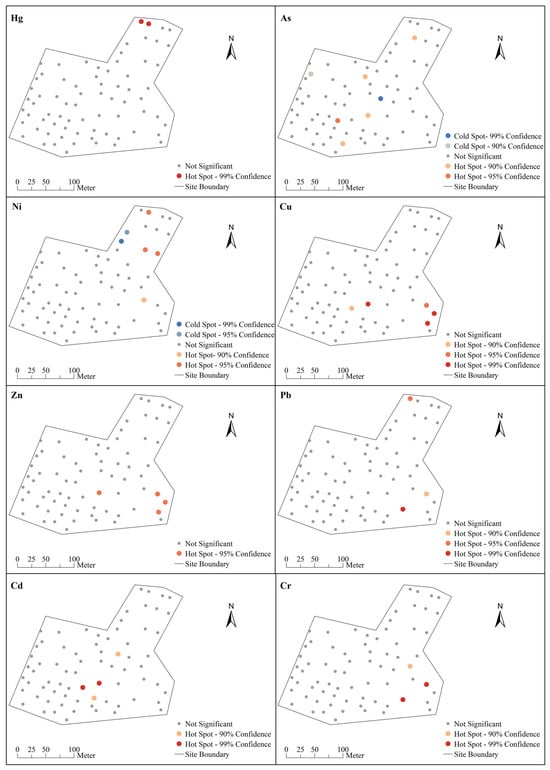
Figure 4.
Hotspot analysis of heavy metal concentrations in surface soil.
By integrating the pesticide production processes within the functional production zones, the sources of core pollutants As and Ni can be roughly identified. The historical products of this pesticide plant included isoprothiolane, glyphosate, omethoate, dimethyl formamide, chloroacetic acid methyl ester, and other pesticides. The production areas comprised multiple workshops, including the boiler room, coal storage facility, chloromethane building, rubber processing room, dimethyl phosphite workshop, methyl ether workshop, and oxygen station, along with associated stormwater and sewage pipeline systems. Based on the hotspot analysis results, As hotspots were primarily distributed near the boiler room, coal storage facility, chloromethane building, and stormwater pipelines, with a 90% confidence level As element hotspot at the location of the former boiler and coal storage facility. Given that coal combustion is a well-documented source of As emissions, the As contamination at this site likely originated from long-term coal combustion in boilers and subsequent atmospheric deposition, as well as surface runoff carrying arsenic-containing coal dust into stormwater drainage systems. The Ni hotspots were mainly concentrated near the rubber processing room, dimethyl phosphite workshop, methyl ether workshop, oxygen station, and sewage pipelines. These areas were associated with production processes involving metal-containing catalysts and additives, and the proximity to sewage pipelines suggests that wastewater discharge during production operations was a significant pathway for Ni contamination.
Overall, the distribution of pollution hotspots at the site typically showed certain associations with pollution sources, pollution accumulation, or release conditions. This site experienced strong industrial production disturbance in its early period, and supplementary investigations should be conducted in areas exhibiting high-concentration heavy metal clustering to match targeted remediation measures.
3.3. Three-Dimensional Contamination and Migration of Soil Heavy Metals
3.3.1. Stratigraphic Model
In site soil contamination investigations, relying solely on two-dimensional hydrogeological cross-sections or hydrogeological columnar diagrams cannot fully capture the stratigraphic distribution of the site. However, borehole sampling data obtained from field surveys typically includes soil lithological characteristics. By fully utilizing this data for three-dimensional modeling, the stratigraphic distribution across the entire site can be effectively simulated. The Kriging interpolation method was employed to construct a three-dimensional stratigraphic model of the study site, with results shown in Figure 5a. Figure 5b provides a clearer representation of the stratigraphic model’s composition, which consists of the following layers from top to bottom: fill layer, sand layer, silt layer, sand layer, and silty-clay layer. Combined with soil texture information from borehole samples, the following characteristics were identified: The first fill layer primarily contained plain fill and miscellaneous fill, with moist soil mainly appearing in gray-brown, red-brown, and yellow-brown colors and most areas containing abundant gravel. The second and fourth layers were both sandy soil layers, where particles with diameters in the 0.075–2 mm range exceeded 50% of total soil mass and moist soil predominantly appeared gray-brown. The third layer was a silty soil layer composed of sandy silt and clayey silt, with an average thickness of approximately 10 m, constituting the main body of the model. The fifth layer was a silty clay layer, with soil plasticity indices ranging from 10 to 17, and essentially no foreign matter within this layer.
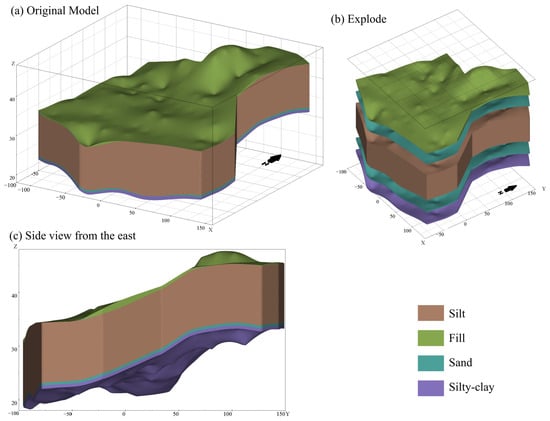
Figure 5.
Stratigraphic model of the study area.
3.3.2. Three-Dimensional Pollution Plumes
The contaminated area formed by pollutant migration and diffusion with groundwater through environmental media is typically referred to as a pollution plume. Identification of pollution plumes facilitates detailed understanding of pollution conditions at contaminated sites and provides possibilities for determining pollution sources. To simulate the distribution of pollution plumes for various heavy metal elements in the study area’s soil, Kriging interpolation was first used to predict heavy metal concentration distributions throughout the entire study area based on limited borehole sample data (Figure 6a,b). Table 2 presents the prediction accuracy of each model. For seven heavy metal concentration models excluding Cd, the mean significance of all nodes exceeded 0.95, and mean uncertainty was below 0.01, indicating satisfactory interpolation results.
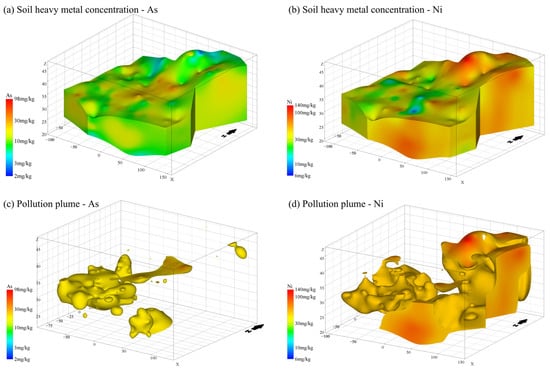
Figure 6.
Concentration models and pollution plume models for As and Ni.
Table 2.
Prediction accuracy of three-dimensional heavy metal concentration models.
Based on the above concentration models, pollution plume boundaries were delineated according to the risk screening values in Table 1, and the site’s soil heavy metal pollution plume models shown in Figure 6c,d were obtained using the plume module in EVS, with volume calculations performed using the volumetrics module. No regions with concentrations exceeding risk screening values existed in the interpolation results for elements other than As and Ni, indicating no pollution plumes. Therefore, no pollution plume model was presented for these elements. It should be noted that although the maximum sample value for Hg in Table 1 exceeded the screening value, analysis of the original borehole data revealed that only this single sample exceeded the standard for Hg, presumed to be incidental contamination, and the Kriging interpolation results ultimately did not show contaminated regions.
Analysis of the modeling results for As and Ni, where contamination plumes exist, indicates that the As pollution plume volume was 53,502.13 m3, which accounted for 8.72% of the total concentration model volume and was mainly distributed in the 22–36 m elevation range of soil on the western side of the site, the 25–30 m and 35–40 m elevation ranges in the central soil, and the surface soil in the northeastern corner of the site. The As contamination area essentially appeared yellow. Using the software’s interactive function, this color was found to correspond to concentrations of approximately 20 mg/kg, just exceeding the risk screening value for this element. The Ni pollution plume volume was 278,159.99 m3, accounting for 45.33% of the total concentration model volume and representing a substantial extent. From the top view, the Ni pollution plume covered nearly the entire site footprint. Specifically, the contaminated regions on the western and southern halves of the site were concentrated in the 25–35 m soil elevation segment, while the contaminated region in the northeastern corner involved a larger soil elevation range (23–47 m). Meanwhile, based on the legend colors, high-value Ni contamination areas existed (red regions in Figure 6b), such as the surface soil in the northeastern corner (concentrations exceeding 120 mg/kg) and the outer faces of the pollution plume model in all four cardinal directions (concentrations exceeding 80 mg/kg). Additionally, an investigation of the pesticide factory’s production zones revealed deep soil contamination with As and Ni in the boiler room area. This contamination likely resulted from the long-term open-air storage of coal—used as boiler fuel in the site’s early years—on exposed ground. Following rainfall, heavy metals from the coal were carried by surface runoff, migrating downward into deep subsurface layers and subsequently contaminating the deep soil.
Furthermore, heavy metal concentrations (Figure 7) and pollution plume volumes (Table 3) in different strata were statistically analyzed to compare the longitudinal migration capacity of various heavy metal elements in different lithological soils. The statistical results were consistent with the conclusions from the Spearman correlation analysis above (i.e., As and Ni concentrations positively correlated with soil depth while Hg, Cu, Zn, Pb, and Cd concentrations negatively correlated with soil depth). Hg, Cu, Zn, Pb, and Cd concentrations generally exhibited decreasing trends from top to bottom through the strata, with similar concentrations in the fill layer and sand layer and an abrupt decrease from the sand layer to silt layer. On one hand, these five heavy metals exhibited strong downward migration capabilities within the fill layer which has a relatively high permeability coefficient, easily penetrating the base of the fill layer to reach the sandy soil layer. On the other hand, certain clay minerals within the fill and sand layers exerted adsorption and interception effects on heavy metals, leading to significant accumulation of these five elements within approximately the top 2 m of soil and hindering their further diffusion into deeper strata. Conversely, As and Ni concentrations exhibited increasing trends with depth through the strata, indicating to some extent that these two heavy metals did not accumulate in the uppermost two strata but rather diffused predominantly to deeper strata. The pollution plume volumes by stratum (Table 3) further corroborated this inference. The pollution plume volumes for As and Ni in the lower three strata significantly exceeded those in the upper two strata, indicating that both As and Ni exhibit strong vertical migration capabilities within the sand and silt layers, enabling them to penetrate strata and reach deeper soil layers. Furthermore, considering the ratio of pollution plume volume to stratum volume, As exhibited the largest contamination extent in the second stratum (sand layer), occupying 11.14% of that stratum’s area. Ni demonstrated the most extensive contamination in the fourth stratum (sand layer), reaching 65.96% of that stratum’s volume. This suggests that within the sand layer, both As and Ni also possessed significant horizontal diffusion capabilities.
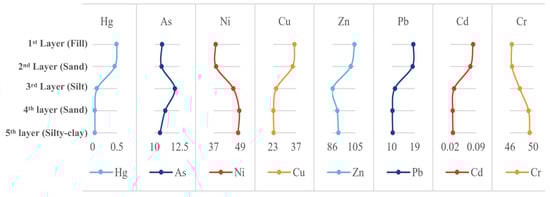
Figure 7.
Mean soil heavy metal concentrations by stratum (unit: mg/kg).
Table 3.
Soil heavy metal pollution plume volumes by stratum.
3.3.3. Three-Dimensional Pollution Risk
The above three-dimensional pollution plume characterization was conducted solely around measured soil heavy metal concentration values. To achieve more effective alignment between three-dimensional characterization results and site management decisions, this study employed the single-factor pollution index method, Nemerow comprehensive pollution index method, and potential ecological risk index method to evaluate soil heavy metal pollution conditions. Spatial interpolation of assessment results from limited sampling points was then performed to construct site-wide three-dimensional pollution risk models. Prior to interpolation, logarithmic transformation was applied as with heavy metal concentration data, and the horizontal-to-vertical anisotropy ratio was set to 10 after testing. The prediction accuracy of each model is shown in Table 4. Color scales were set according to the pollution grade classification criteria summarized in Table 5, enabling intuitive visualization of varying pollution risk levels across different soil areas.
Table 4.
Prediction accuracy of pollution risk models.
Table 5.
Pollution grading criteria.
Based on the single-factor pollution assessment results, only Hg, As, and Ni exhibited contamination within the site. The Hg-contaminated area was merely 0.09 m3, essentially negligible. Furthermore, the interpolation model of the evaluation results (Figure 8a–d) indicated that 10.8% of the study area’s soil was classified as slightly polluted with As, covering a volume of 64,288.88 m3. This distribution closely aligned with the previously constructed As pollution plume model. Additionally, 523.19 m3 and 65.18 m3 of soil exhibited mild and moderate As pollution, respectively, as illustrated in Figure 8c,d. Statistical analysis of the model in Figure 8e revealed that 266,247.07 m3 of soil in the study area was slightly contaminated with Ni, accounting for 43.4% of the total model volume. Its spatial distribution (Figure 8f) exhibited similarities to the Ni pollution plume. Additionally, 3291.52 m3 of soil showed mild Ni contamination, with specific locations shown in Figure 8g.
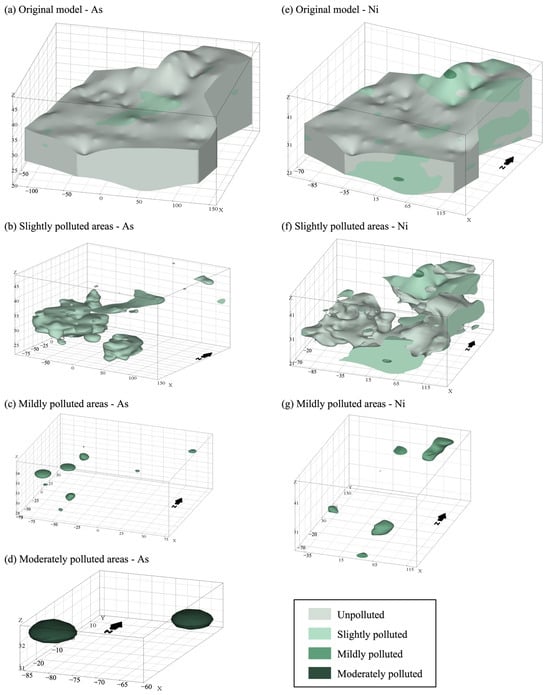
Figure 8.
Single-factor pollution risk models.
The Nemerow comprehensive pollution risk model characterized soil pollution risk under the combined effects of eight heavy metals. In Figure 9a, areas shaded in medium-intensity colors represented relatively clean but potentially hazardous soil zones, totaling 267,424.55 m3 in volume. These areas constituted 43.6% of the model’s total volume and were widely distributed across all regions except the deep soil layers in the central-eastern part of the site. Figure 9b presents the mildly polluted areas identified by the screening module, with a volume of 82,928.54 m3 (13.5% of the total model volume). These areas primarily formed an L-shaped distribution within the soil at elevations 23–31 m in the southwest corner of the site, with a smaller portion also present at elevations 31–45 m in the northeast corner. The Nemerow comprehensive index calculates comprehensive pollution levels for multiple heavy metals through a method that considers both mean and maximum values, while the potential ecological risk comprehensive index applies weighting through the introduction of toxicity coefficients, thereby yielding different comprehensive pollution assessment results for multiple heavy metals. Figure 10a displays areas classified as low-risk in the potential ecological risk evaluation, with a volume of 557,023.97 m3 (90.8% of the total model volume). Figure 10b depicts the medium-risk area, with a volume of 56,479.51 m3 and accounting for 9.2% of the total volume, which was primarily distributed in the L-shaped region in the southwest part of the site and located within the 22–33 m elevation range.
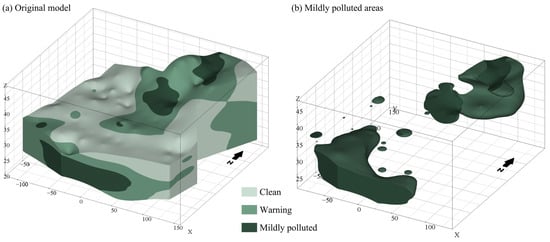
Figure 9.
Nemerow comprehensive pollution risk model.
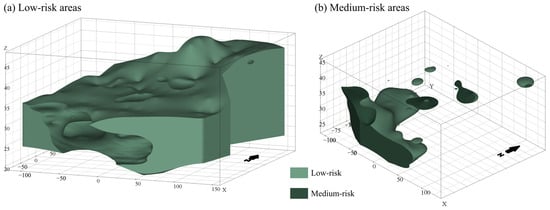
Figure 10.
Potential ecological risk model.
4. Discussion
4.1. Delineation of Management Zoning by Risk Levels
Based on the three-dimensional pollution risk model, the site soil can be divided into different zones according to management levels. Since the pollution risk models derived from the three evaluation methods differed, this study employed statistical principles to summarize the permutations and combinations of 3 × 3 × 2 = 18 scenarios based on the calculated results of the three indices (Table 6). This approach enabled the classification of the study site’s soil into safe utilization zones, basically safe utilization zones, low-risk control zones, and high-risk control zones, with visualization achieved in EVS (Figure 11). The volumes of the four zones were 261,872.33 m3, 254,282.21 m3, 44,852.21 m3, and 42,790.23 m3, respectively.
Table 6.
Site pollution management zoning scheme.
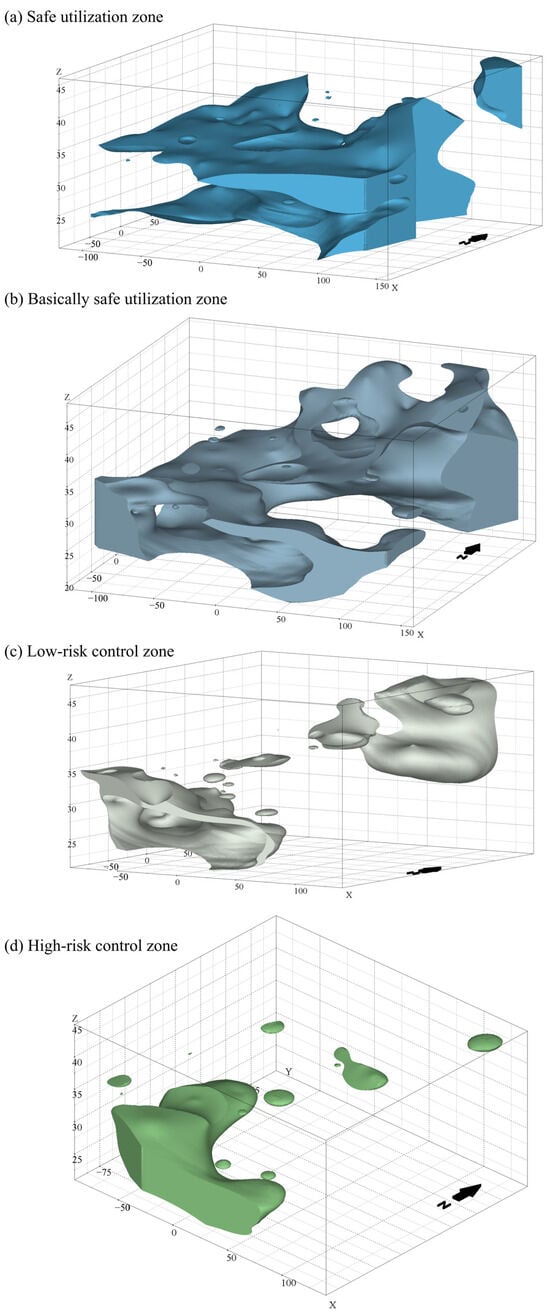
Figure 11.
Schematic diagram of site pollution management zoning.
Within the safe utilization zone, no soil samples exceeded national or Zhejiang Province soil environmental risk screening values for heavy metals. According to the Zhejiang Province Construction Land Soil Pollution Risk Control and Remediation Supervision and Management Measures, this area does not require risk control or remediation. The basically safe utilization zone contained individual heavy metal elements slightly exceeding screening values but not constituting significant ecological hazard, where safe utilization can proceed under conditions preventing new pollution inputs. Both the low-risk control zone and high-risk control zone exhibited heavy metal pollution levels that threatened human health, so corresponding soil remediation and treatment must be conducted before the site can be reused. The former zone requires remediation that balances economic feasibility with ongoing dynamic monitoring, while the latter necessitates targeted remediation alongside early warning and prevention measures. The above zoning results can assist management personnel in understanding heavy metal contamination levels across different soil areas, thereby guiding the establishment of pollution remediation priorities. Notably, practical implementation must also consider the impact of soil layers at varying depths on future planned land-use for production and living activities to determine the appropriate remediation depth.
4.2. Targeted Remediation Plan
The selection of remediation strategies and the deployment of targeted technologies for contaminated sites rely on comprehensive data mining of site information [38]. Remediation plans should be developed for contaminated areas based on the types of heavy metals, the extent of contamination, migration pathways, and the site’s future land-use planning [39].
First, the selection of remediation methods should focus on priority pollutants identified based on risk assessment results [40]. At the site of this study, As and Ni were identified as the key heavy metals requiring focused remediation based on the three-dimensional pollution characterization results. However, it should be noted that at other contaminated sites, other metals may emerge as the primary concerns depending on site history and contamination characteristics. The choice of remediation methods should be determined primarily based on the contamination extent and severity of the identified priority pollutants. The three-dimensional pollution plume model has already delineated the boundaries of pollution diffusion and calculated the contaminated volumes. Considering factors such as remediation costs, duration, and the risk of secondary pollution, appropriate physical, chemical, or biological remediation methods—such as soil replacement, reagent addition, or phytoremediation—should be selected for different soil zones. This process should also involve estimating the volume of soil to be treated and the corresponding costs [41]. As for the study site, specific remediation technology recommendations for the low-risk and high-risk control zones are as follows:
The low-risk control zone is distributed in both shallow soil layers (approximately 0–15 m depth in the northeastern corner) and deep soil layers (approximately 10–25 m depth in the southwestern corner), spanning all stratigraphic layers of the study area, with the silt layer occupying the dominant proportion. For the shallow portion of this zone, excavation and soil replacement is recommended for severely contaminated areas within 0–3 m depth, as this approach offers rapid and thorough removal of contaminants [42]. For deeper contaminated soils (3–15 m), in situ chemical stabilization using iron-based amendments (such as zero-valent iron or ferrous sulfate) is recommended for As immobilization, as these materials effectively convert soluble arsenate into stable iron-arsite precipitates [43,44]. For Ni contamination, alkaline stabilization agents (such as limestone or calcium hydroxide) are recommended to raise soil pH and promote the formation of insoluble nickel hydroxide precipitates [45]. Given that the low-risk control zone requires balancing economic feasibility with remediation effectiveness, the combination of shallow excavation and deep in situ stabilization represents a cost-effective strategy.
The high-risk control zone is primarily distributed in deep soil layers (approximately 15–25 m depth in the southwestern corner), with the silt layer constituting the main stratigraphic unit. Due to the substantial depth and the dominance of silt layers with moderate permeability, conventional excavation and replacement would incur prohibitive costs and engineering difficulties. Therefore, in situ solidification/stabilization technology is recommended as the primary remediation approach [46]. For As contamination, cement-based solidification combined with iron-based amendments can effectively encapsulate arsenic and reduce its leachability [47]. For Ni contamination, cement-ite orite-ite-based solidification with alkaline additives is recommended to immobilize nickel ions within the solidified matrix [48]. Long-term groundwater monitoring should also be implemented to verify remediation effectiveness.
Second, preventive measures should be formulated based on the distribution and migration patterns of heavy metals at the site [49,50]. Relevant studies indicate that iron and steel smelting and coal combustion are major sources of As contamination in industrial areas. Combined with the site’s production history and hotspot analysis of heavy metal distribution in surface soil, it is evident that As in the soil primarily originates from coal stockpiles left exposed in open areas and arsenic-containing emissions from coal-fired boilers during the pesticide plant’s operational phase. Therefore, to prevent new As contamination, it is necessary to inspect and clean up residual coal on-site and implement preventive measures against coal combustion emissions in surrounding areas. Additionally, comprehensive analysis of the three-dimensional pollution plume model and stratigraphic model reveals that As and Ni exhibit strong vertical migration capabilities in both sandy and silty soil layers, as well as significant horizontal diffusion within sandy layers. To curb further migration and diffusion of As and Ni in the soil, impermeable measures such as laying impermeable membranes or installing subsurface collection systems should be implemented in severely contaminated areas [51]. Furthermore, although other heavy metals were present at relatively low concentrations and were primarily concentrated in the surface fill layer, their potential environmental risks cannot be entirely disregarded. Surface soils are susceptible to water and wind erosion, potentially allowing these metals to migrate to adjacent areas via runoff or airborne particulates, thereby causing secondary pollution to the surrounding environment. Therefore, even for metals not exceeding screening values, appropriate surface stabilization measures or vegetation cover should be considered to minimize migration and dispersion triggered by erosion.
Third, to ensure effective coordination between site remediation and redevelopment activities, remediation plans must also account for the site’s future land-use planning [38]. The study site is designated for Category I land-use, which includes residential and public purposes. Therefore, remediation targets for As and Ni should be established based on the risk screening values specified in national and Zhejiang Provincial local standards for this land-use category. Furthermore, potential overlaps between excavation activities during redevelopment and soil replacement or backfilling during remediation may lead to redundant efforts and increased costs. Where feasible, the three-dimensional pollution plume model should be compared with the site’s future development plan to adjust soil backfilling strategies during the remediation phase, thereby avoiding redundant construction and reducing development costs [52].
4.3. Research Limitations and Future Directions
Although this study constructed a three-dimensional model based on 916 borehole soil samples from 92 sampling points, the limited sampling density poses challenges in capturing small-scale pollution heterogeneity within the site’s complex multi-layered geological structure [53]. In the three-dimensional interpolation process, the setting of the horizontal-to-vertical anisotropy ratio, despite repeated optimization, may still introduce local simulation biases when reflecting specific complex hydrogeological profiles [54]. Furthermore, as a typical retired pesticide plant site, the soil often exhibits combined contamination from organic intermediates and heavy metals. This study primarily focused on the distribution of eight typical heavy metals, including Hg, As, and Ni, and did not incorporate potential organic pollutants into a unified three-dimensional characterization framework. Although correlation analysis revealed significant associations between pH and heavy metal content, this study did not delve deeply into the micro-scale mechanisms through which soil organic matter, redox potential, and the chemical speciation distribution of heavy metals influence their three-dimensional spatial migration capabilities [55]. Future research could incorporate high-resolution geophysical detection methods to densify stratigraphic and pollution information, explore multi-source data fusion algorithms for collaborative interpolation to reduce model uncertainty, and combine chemical speciation analysis to deeply elucidate the occurrence states and bioavailability of heavy metals in different lithological strata at the micro-scale [56].
5. Conclusions
This study established an innovative methodological framework integrating three-dimensional visualization, geostatistical interpolation, and multi-criteria risk assessment for contaminated site characterization and management. The core contributions lie in three aspects: First, the framework transcends traditional two-dimensional pollution assessment by constructing a comprehensive 3D characterization system that couples stratigraphic models, pollution plume delineation, and risk zoning, enabling precise quantification of contamination volumes and spatial heterogeneity. Second, the study advances understanding of heavy metal migration mechanisms by revealing stratigraphic control effects—specifically, the strong anisotropic vertical mobility of As and Ni in permeable silt and sand layers versus the shallow retention of Hg and Pb due to clay adsorption—thereby bridging geochemical processes with 3D spatial patterns. Third, the multi-criteria coupling model that overlays single-factor indices, Nemerow comprehensive indices, and potential ecological risk indices achieves scientifically grounded four-level risk zonation, directly supporting remediation prioritization and treatment volume estimation. This methodological framework not only effectively overcomes the bottlenecks of traditional site investigations in vertical characterization accuracy and spatial heterogeneity capture but also demonstrates significant guiding significance in coordinating brownfield remediation projects with sustainable urban land redevelopment planning, providing a reliable technical paradigm and decision-making reference for the precision remediation and dynamic environmental risk management of similar high-risk retired chemical industrial sites in China.
Author Contributions
X.W.: Conceptualization, Methodology, Software, Formal analysis, Investigation, Writing—Original Draft, Visualization. F.L.: Software, Validation, Investigation, Data Curation, Writing—Review and Editing. S.W.: Formal analysis, Investigation, Resources, Data Curation, Writing—Review and Editing. Z.Z.: Validation, Resources, Writing—Review and Editing. Y.L.: Conceptualization, Resources, Writing—Review and Editing, Supervision, Project administration, Funding acquisition. All authors have read and agreed to the published version of the manuscript.
Funding
This research was funded by the Jing-Jin-Ji Regional Integrated Environmental Improvement National Science and Technology Major Project (2025ZD1205801) and the Major Program of Natural Science Foundation of Zhejiang Province (LD26D010001).
Data Availability Statement
The data that support the findings of this study are available upon request from the corresponding author.
Conflicts of Interest
The authors declare no conflict of interests.
References
- Hou, D.; Jia, X.; Wang, L.; McGrath, S.P.; Zhu, Y.-G.; Hu, Q.; Zhao, F.-J.; Bank, M.S.; O’Connor, D.; Nriagu, J. Global Soil Pollution by Toxic Metals Threatens Agriculture and Human Health. Science 2025, 388, 316–321. [Google Scholar] [CrossRef]
- Qi, C.; Hu, T.; Zheng, Y.; Wu, M.; Tang, F.H.M.; Liu, M.; Zhang, B.; Derrible, S.; Chen, Q.; Hu, G.; et al. Global and Regional Patterns of Soil Metal(Loid) Mobility and Associated Risks. Nat. Commun. 2025, 16, 2947. [Google Scholar] [CrossRef]
- Jiang, Y.; Chao, S.; Liu, J.; Yang, Y.; Chen, Y.; Zhang, A.; Cao, H. Source Apportionment and Health Risk Assessment of Heavy Metals in Soil for a Township in Jiangsu Province, China. Chemosphere 2017, 168, 1658–1668. [Google Scholar] [CrossRef] [PubMed]
- Hu, Y.; Cheng, H. Application of Stochastic Models in Identification and Apportionment of Heavy Metal Pollution Sources in the Surface Soils of a Large-Scale Region. Environ. Sci. Technol. 2013, 47, 3752–3760. [Google Scholar] [CrossRef] [PubMed]
- Harclerode, M.A.; Macbeth, T.W.; Miller, M.E.; Gurr, C.J.; Myers, T.S. Early Decision Framework for Integrating Sustainable Risk Management for Complex Remediation Sites: Drivers, Barriers, and Performance Metrics. J. Environ. Manag. 2016, 184, 57–66. [Google Scholar] [CrossRef] [PubMed]
- Sui, S.; Wang, M.; Ma, W.; Wang, M.; Wang, J.; Liu, K.; Jiang, F.; Guo, X.; Xing, M.; Han, Q.; et al. Machine Learning Reveals Heavy Metal Migration Pathways in Asia’s Largest Pb-Zn Smelting Region: Soil Pollution Simulation in Jiyuan. Process Saf. Environ. Prot. 2025, 203, 107904. [Google Scholar] [CrossRef]
- Hou, D.; Al-Tabbaa, A.; O’Connor, D.; Hu, Q.; Zhu, Y.-G.; Wang, L.; Kirkwood, N.; Ok, Y.S.; Tsang, D.C.W.; Bolan, N.S.; et al. Sustainable Remediation and Redevelopment of Brownfield Sites. Nat. Rev. Earth Environ. 2023, 4, 271–286. [Google Scholar] [CrossRef]
- Lemming, G.; Hauschild, M.Z.; Bjerg, P.L. Life Cycle Assessment of Soil and Groundwater Remediation Technologies: Literature Review. Int. J. Life Cycle Assess. 2009, 15, 115–127. [Google Scholar] [CrossRef]
- Huang, Y.; Chen, Q.; Deng, M.; Japenga, J.; Li, T.; Yang, X.; He, Z. Heavy Metal Pollution and Health Risk Assessment of Agricultural Soils in a Typical Peri-Urban Area in Southeast China. J. Environ. Manag. 2018, 207, 159–168. [Google Scholar] [CrossRef]
- Li, F.; Fan, Z.; Xiao, P.; Oh, K.; Ma, X.; Hou, W. Contamination, Chemical Speciation and Vertical Distribution of Heavy Metals in Soils of an Old and Large Industrial Zone in Northeast China. Environ. Geol. 2008, 57, 1815–1823. [Google Scholar] [CrossRef]
- Tao, H.; Liao, X.; Cao, H.; Zhao, D.; Hou, Y. Three-Dimensional Delineation of Soil Pollutants at Contaminated Sites: Progress and Prospects. J. Geogr. Sci. 2022, 32, 1615–1634. [Google Scholar] [CrossRef]
- Liu, B.; Liu, Y.; Zhang, Z. Prediction of Heavy Metal Pollution in Soil Based on SSA-XGBoost Model and 3D Geological Model. Soil Sediment Contam. Int. J. 2024, 33, 1421–1439. [Google Scholar] [CrossRef]
- Shen, F.; Xu, C.; Wang, J.; Hu, M.; Guo, G.; Fang, T.; Zhu, X.; Cao, H.; Tao, H.; Hou, Y. A New Method for Spatial Three-Dimensional Prediction of Soil Heavy Metals Contamination. CATENA 2024, 235, 107658. [Google Scholar] [CrossRef]
- Liu, C.; Chen, L.; Ni, G.; Yuan, X.; He, S.; Miao, S. Prediction of Heavy Metal Spatial Distribution in Soils of Typical Industrial Zones Utilizing 3D Convolutional Neural Networks. Sci. Rep. 2025, 15, 396. [Google Scholar] [CrossRef] [PubMed]
- Liang, C.; Zhang, Z.; Wang, Y.; Yao, Q.; Han, R.; Wu, T.; Liu, Y.; Zhang, Q. Prediction of 3D Spatial Distribution, Driving Factors, and Risk for Heavy Metal(Loid)s in Sediment of Dongdagou River Based on Ensemble Learning. J. Hazard. Mater. 2025, 496, 139500. [Google Scholar] [CrossRef]
- Wang, J.; Gao, B.; Stein, A. The Spatial Statistic Trinity: A Generic Framework for Spatial Sampling and Inference. Environ. Model. Softw. 2020, 134, 104835. [Google Scholar] [CrossRef]
- Li, Z.; Ma, Z.; van der Kuijp, T.J.; Yuan, Z.; Huang, L. A Review of Soil Heavy Metal Pollution from Mines in China: Pollution and Health Risk Assessment. Sci. Total Environ. 2014, 468–469, 843–853. [Google Scholar] [CrossRef]
- Hou, D.; O’Connor, D.; Nathanail, P.; Tian, L.; Ma, Y. Integrated GIS and Multivariate Statistical Analysis for Regional Scale Assessment of Heavy Metal Soil Contamination: A Critical Review. Environ. Pollut. 2017, 231, 1188–1200. [Google Scholar] [CrossRef]
- Yang, Y.; Jia, M. 3D Spatial Interpolation of Soil Heavy Metals by Combining Kriging with Depth Function Trend Model. J. Hazard. Mater. 2024, 461, 132571. [Google Scholar] [CrossRef] [PubMed]
- Zhang, Y.; He, L.-L.; Jiao, Y.-Y.; Peng, H.-F.; Liu, S.-C.; Zhang, Q.-B. Multiscale Progressive 3D Geological Modeling Based on Isochronous Stratigraphy Identification in Urban Underground Space. Bull. Eng. Geol. Environ. 2025, 84, 171. [Google Scholar] [CrossRef]
- Wei, B.; Yang, L. A Review of Heavy Metal Contaminations in Urban Soils, Urban Road Dusts and Agricultural Soils from China. Microchem. J. 2010, 94, 99–107. [Google Scholar] [CrossRef]
- Goovaerts, P. Introduction. In Geostatistics for Natural Resources Evaluation; Goovaerts, P., Ed.; Oxford University Press: Oxford, UK, 1997. [Google Scholar]
- Bao, J.; Chang, Y.; Cheng, N.; Li, Y.; Chang, X.; Feng, J.; Nan, X.; Ren, H. Vertical Distribution and Migration of Heavy Metals in Soil of Green Stormwater Infrastructure Receiving Roof Runoff. Sci. Total Environ. 2024, 954, 176511. [Google Scholar] [CrossRef] [PubMed]
- HJ 25.1-2014; Technical Guidelines for Environmental Site Investigation. China Environmental Science Press: Beijing, China, 2014.
- HJ 25.2-2014; Technical Guidelines for Environmental Site Monitoring. China Environmental Science Press: Beijing, China, 2014.
- Li, J.; Heap, A.D. A Review of Comparative Studies of Spatial Interpolation Methods in Environmental Sciences: Performance and Impact Factors. Ecol. Inform. 2011, 6, 228–241. [Google Scholar] [CrossRef]
- Gundogdu, K.S.; Guney, I. Spatial Analyses of Groundwater Levels Using Universal Kriging. J. Earth Syst. Sci. 2007, 116, 49–55. [Google Scholar] [CrossRef]
- Liu, G.; Wang, S.; Niu, J.; Zhang, C.; Zhao, X.; Guo, G. The Influence of Different Three Dimensional Models on Pb Distributing Prediction in Lead-acid Battery Contaminated Sites. China Environ. Sci. 2014, 34, 3157–3163. [Google Scholar]
- Hakanson, L. An Ecological Risk Index for Aquatic Pollution Control.a Sedimentological Approach. Water Res. 1980, 14, 975–1001. [Google Scholar] [CrossRef]
- Nemerow, N.L. Scientific Stream Pollution Analysis; Scripta Book Company: New York, NY, USA, 1974. [Google Scholar]
- Muller, G. Index of Geoaccumulation in Sediments of the Rhine River. GeoJournal 1969, 2, 108–118. [Google Scholar]
- Wang, Q.; Dong, Y.; Zhou, G.; Zheng, W. Soil Geochemical Baseline and Environmental Background Values of Agricultural Regions in Zhejiang Province. J. Ecol. Rural. Environ. 2007, 23, 81–88. [Google Scholar]
- Moran, P.A.P. Notes on Continuous Stochastic Phenomena. Biometrika 1950, 37, 17–23. [Google Scholar] [CrossRef]
- GB36600-2018; Soil Environmental Quality Risk Control Standard for Soil Contamination of Development Land (Trial Implementation). China Environmental Science Press: Beijing, China, 2018.
- DB33/T 892-2013; Guideline for Risk Assessment of Contaminated Sites. Zhejiang Bureau of Quality and Technical Supervision: Hangzhou, China, 2013.
- HJ/T166-2004; Technical Specifications for Soil Environmental Monitoring. China Environmental Science Press: Beijing, China, 2005.
- Chen, H.; Chen, Z.; Chen, Z.; Ou, X.; Chen, J. Calculation of Toxicity Coefficient of Potential Ecological Risk Assessment of Rare Earth Elements. Bull. Environ. Contam. Toxicol. 2020, 104, 582–587. [Google Scholar] [CrossRef]
- Hou, D.; Al-Tabbaa, A. Sustainability: A New Imperative in Contaminated Land Remediation. Environ. Sci. Policy 2014, 39, 25–34. [Google Scholar] [CrossRef]
- Abdel-Shafy, H.I.; Mansour, M.S.M. A Review on Polycyclic Aromatic Hydrocarbons: Source, Environmental Impact, Effect on Human Health and Remediation. Egypt. J. Pet. 2016, 25, 107–123. [Google Scholar] [CrossRef]
- Chen, H.; Teng, Y.; Lu, S.; Wang, Y.; Wang, J. Contamination Features and Health Risk of Soil Heavy Metals in China. Sci. Total Environ. 2015, 512–513, 143–153. [Google Scholar] [CrossRef]
- Kuppusamy, S.; Thavamani, P.; Venkateswarlu, K.; Lee, Y.B.; Naidu, R.; Megharaj, M. Remediation Approaches for Polycyclic Aromatic Hydrocarbons (PAHs) Contaminated Soils: Technological Constraints, Emerging Trends and Future Directions. Chemosphere 2017, 168, 944–968. [Google Scholar] [CrossRef] [PubMed]
- Liu, L.; Li, W.; Song, W.; Guo, M. Remediation Techniques for Heavy Metal-Contaminated Soils: Principles and Applicability. Sci. Total Environ. 2018, 633, 206–219. [Google Scholar] [CrossRef] [PubMed]
- Kanel, S.R.; Manning, B.; Charlet, L.; Choi, H. Removal of Arsenic(III) from Groundwater by Nanoscale Zero-Valent Iron. Environ. Sci. Technol. 2005, 39, 1291–1298. [Google Scholar] [CrossRef]
- Sun, H.; Wang, L.; Zhang, R.; Sui, J.; Xu, G. Treatment of Groundwater Polluted by Arsenic Compounds by Zero Valent Iron. J. Hazard. Mater. 2006, 129, 297–303. [Google Scholar] [CrossRef] [PubMed]
- Guo, G.; Zhou, Q.; Ma, L.Q. Availability and Assessment of Fixing Additives for the in Situ Remediation of Heavy Metal Contaminated Soils: A Review. Environ. Monit. Assess. 2006, 116, 513–528. [Google Scholar] [CrossRef]
- Malviya, R.; Chaudhary, R. Factors Affecting Hazardous Waste Solidification/Stabilization: A Review. J. Hazard. Mater. 2006, 137, 267–276. [Google Scholar] [CrossRef]
- Wang, F.; Wang, H.; Jin, F.; Al-Tabbaa, A. The Performance of Blended Conventional and Novel Binders in the In-Situ Stabilisation/Solidification of a Contaminated Site Soil. J. Hazard. Mater. 2015, 285, 46–52. [Google Scholar] [CrossRef]
- Chen, Q.Y.; Tyrer, M.; Hills, C.D.; Yang, X.M.; Carey, P. Immobilisation of Heavy Metal in Cement-Based Solidification/Stabilisation: A Review. Waste Manag. 2009, 29, 390–403. [Google Scholar] [CrossRef] [PubMed]
- Wang, Y.; Li, Y.; Yang, S.; Liu, J.; Zheng, W.; Xu, J.; Cai, H.; Liu, X. Source Apportionment of Soil Heavy Metals: A New Quantitative Framework Coupling Receptor Model and Stable Isotopic Ratios. Environ. Pollut. 2022, 314, 120291. [Google Scholar] [CrossRef] [PubMed]
- Rabbani, A.; Bag, R.; Samui, P.; Kumari, S.; Akash. Remediation of Heavy Metals from Contaminated Soil: State of the Art Review of Sources, Risk, Policies and Available Remediation Techniques. Trans. Indian Natl. Acad. Eng. 2025, 10, 19–31. [Google Scholar] [CrossRef]
- Feng, Y.-X.; Yu, X.-Z.; Zhang, H. A Modelling Study of a Buffer Zone in Abating Heavy Metal Contamination from a Gold Mine of Hainan Province in Nearby Agricultural Area. J. Environ. Manag. 2021, 287, 112299. [Google Scholar] [CrossRef]
- Abaglo, A.J.; Bonalda, C.; Pertusa, E. Environmental Digital Model: Integration of BIM into Environmental Building Simulations. Energy Procedia 2017, 122, 1063–1068. [Google Scholar] [CrossRef]
- Long, J.; Liu, Y.; Xing, S.; Qiu, L.; Huang, Q.; Zhou, B.; Shen, J.; Zhang, L.-M. Effects of Sampling Density on Interpolation Accuracy for Farmland Soil Organic Matter Concentration in a Large Region of Complex Topography. Ecol. Indic. 2018, 93, 562–571. [Google Scholar] [CrossRef]
- Peng, Y.; Zhao, Y.; Chen, J.; Xie, E.; Yan, G.; Zou, T.; Xu, X. Simultaneously Mapping the 3D Distributions of Multiple Heavy Metals in an Industrial Site Using Deep Learning and Multisource Auxiliary Data. J. Hazard. Mater. 2024, 480, 136000. [Google Scholar] [CrossRef]
- He, T.; Li, Y.; Huang, Y.; He, E.; Li, Y.; Qu, L.; Ding, F.; Jin, R.; Han, M.; Yuan, L.; et al. Simulation and Risk Assessment of Arsenic by Hydrus-3D and CalTOX in a Typical Brownfield Site. J. Hazard. Mater. 2023, 448, 130892. [Google Scholar] [CrossRef]
- Zhao, Y.; Wu, Y.; Qi, Y.; Li, J.; Huang, X.; Hou, Y.; Hao, H.; Zhu, S. Characteristics, Sources, and Risk Assessment of Polycyclic Aromatic Hydrocarbons in Soils and Sediments in the Yellow River Delta, China. Land 2025, 14, 1608. [Google Scholar] [CrossRef]


Disclaimer/Publisher’s Note: The statements, opinions and data contained in all publications are solely those of the individual author(s) and contributor(s) and not of MDPI and/or the editor(s). MDPI and/or the editor(s) disclaim responsibility for any injury to people or property resulting from any ideas, methods, instructions or products referred to in the content. |
© 2026 by the authors. Licensee MDPI, Basel, Switzerland. This article is an open access article distributed under the terms and conditions of the Creative Commons Attribution (CC BY) license.