Article

Spatiotemporal Evolution and Scenario-Based Simulation of Habitat Quality in a Coastal Mountainous City: A Case Study of Busan, South Korea

Department of Landscape Architecture and Garden Design, Dongguk University, 30, Pildong-ro 1-gil, Jung-gu, Seoul 04620, Republic of Korea
*
Author to whom correspondence should be addressed.
Land 2025, 14(9), 1805; https://doi.org/10.3390/land14091805
Submission received: 2 July 2025 / Revised: 29 August 2025 / Accepted: 1 September 2025 / Published: 4 September 2025
(This article belongs to the Special Issue Coupled Man-Land Relationship for Regional Sustainability)

Abstract

Urban economic development together with the concentration of population acts as a major stimulus for changes in land-use configurations, thereby reshaping local ecosystems and influencing habitat quality. Conducting a rigorous evaluation of the temporal–spatial dynamics and the mechanisms underlying these changes is crucial for refining spatial management strategies, improving urban livability, and steering cities toward sustainable pathways. In this research, we established a comprehensive analytical framework that integrates the PLUS model, the InVEST model, and the GeoDetector model to examine shifts in land-use patterns and habitat quality in Busan Metropolitan City during 1988–2019 to pinpoint the principal influencing factors and to project possible trajectories for 2029–2049 under multiple climate change scenarios. The key findings can be summarized as follows: (1) during the last thirty years, the city’s land-use structure underwent substantial transformation, with forested areas and built-up zones becoming the primary categories, indicating continuous urban encroachment and the reduction in ecological land; (2) the average habitat quality dropped by 18.23%, displaying a distinct spatial gradient from low values in plains and coastal areas to higher values in mountainous and inland zones; (3) results from the GeoDetector revealed that variations in land-use type and NDVI exerted the greatest influence on habitat quality differences, reflecting the combined impacts of environmental conditions and socio-economic pressures; (4) scenario projections show that the SSP1-2.6 pathway supports ecological land growth and leads to a notable improvement in habitat quality, while SSP5-8.5 causes ongoing deterioration driven by the expansion of construction land. The SSP2-4.5 pathway demonstrates a relatively moderate pattern, balancing urban development needs with ecological preservation and thus is more consistent with the long-term sustainability objectives of Busan. This study provides a robust scientific basis for understanding historical and projected changes in land cover and habitat quality in Busan and offers theoretical guidance for optimizing land-use structures, strengthening ecological protection, and fostering sustainable development in Busan and other coastal mountainous cities.

1. Introduction

Over the past few decades, the combined effects of accelerated economic expansion and dense population distribution have greatly intensified pressure on land resources, resulting in significant transformations in land-use and land-cover patterns [1,2]. The continuous spread of built-up areas has replaced large portions of natural ecological land, resulting in notable reductions and transformations in forests, grasslands, and wetlands [3,4,5,6]. Such land conversions have been closely linked to a range of environmental concerns, including global climate change, declining water quality, and the overuse of agrochemicals, all of which undermine ecosystem functions and threaten biodiversity [7,8,9,10,11]. To address this, the United Nations introduced its 2030 Agenda for Sustainable Development [12], which sets forth 17 Sustainable Development Goals (SDGs). Among these, Goal 11 advocates building cities that are safe, resilient, and sustainable, while Goal 15 highlights the “sustainable management of terrestrial ecosystems, halting of land degradation, and prevention of biodiversity loss.” Balancing economic progress with ecological conservation has thus emerged as a key measure of urban sustainability and a pressing objective for urban governance [13,14]. Habitat quality, as a crucial metric for evaluating ecosystem integrity [15,16] and biodiversity richness [17,18], plays an essential role in sustaining regional development [19,20,21]. Intensified urbanization has sharply increased the demand for land, driving substantial changes in local land-use configurations. These shifts can disrupt pre-existing ecological patterns, weaken urban green space connectivity, heighten landscape fragmentation [22,23,24], and, ultimately, diminish habitat quality. Therefore, assessing habitat quality at the urban scale not only helps clarify the condition of urban ecosystems but also examines the rationality of urban planning, providing a theoretical foundation and policy support for ecological protection, urban development, and long-term sustainability.
Advances in geospatial technologies have continually refined methods for assessing habitat quality. Currently, several models are widely adopted for such assessments, including the Habitat Suitability Index [25], the SOLVES model [26], and the InVEST model [27,28]. Among these tools, InVEST is notable for its strong integration of functions, wide range of applications, capacity for clear spatial visualization, and effectiveness in long-term temporal analysis. Its applications span multiple environmental contexts, such as coastal ecosystems [29], river basins [30], grassland systems [31], metropolitan areas [32], and regions with varying spatial scales. The model estimates habitat quality primarily using land-cover datasets, and by incorporating projected land-cover changes, it can assess potential future habitat quality under alternative scenarios. Consequently, integrating InVEST with land-use simulation models offers a robust means to anticipate and compare habitat quality trajectories in the context of different development or conservation strategies.
Land-use simulation is a critical research focus within the broader field of land-use and land-cover change. Incorporating multi-scenario simulations enhances its applicability to urban planning, ecological environment research, and analyses across multiple spatial scales. In the context of intensifying global climate change and the growing occurrence of extreme weather events, the combined framework of future socio-economic development pathways and greenhouse gas concentration trajectories, as outlined in the IPCC framework, has become an important basis for projecting land use under alternative futures. This framework has been extensively applied in land simulation research at various scales to tackle issues arising from global climate change [33,34]. At present, an increasing number of models are applied to land-use simulation and are being integrated with the InVEST model. For example, Y. Luan combined the CA–Markov model with the InVEST model to project the habitat quality index of Hohhot for the year 2030 [35]. W. Jiang integrated the CLUE-S model with the InVEST model to examine the impact of land-use change on carbon storage [36]. Y. He applied the FLUS model to project land-use dynamics and carbon storage in Guilin for 2035 [37]. Although these models have been successfully applied in land-use simulations, they show limitations in identifying the drivers of land-type transitions and in modeling alterations at the patch level. As a newer generation of land-use prediction tools, the PLUS framework combines the LEAS module with the multi-type CARS mechanism, helping to address the shortcomings of earlier models. It has been widely applied in land management, urban heat island studies, and ecosystem service assessments [38,39,40,41]. Therefore, this study integrates the PLUS and InVEST models to more accurately simulate future land-use patterns under complex socio-economic and environmental conditions from a long-term time series perspective. This approach enhances the spatial analysis and prediction of habitat quality under different scenarios and provides forward looking data support for land management and ecological conservation policymaking.
In East Asia, coastal cities often act as engines of national or regional development. Their unique geographical advantages and policy orientations have created a pronounced population siphoning effect, driving the continuous expansion of urban scale and economic output. However, certain coastal mountainous cities, such as Yeosu and Gunsan in South Korea and several coastal cities in Zhejiang and Fujian, China, are characterized by rugged terrain and limited land resources. These cities generally possess excellent port resources and high external accessibility, with strong economic growth momentum; however, they face constraints such as a scarcity of developable land, irrational land use, and fragile ecosystems [42,43]. Under the dual pressures of urban expansion and limited land resources, harmonizing economic growth with ecological conservation has become a critical challenge for the sustainable development of coastal mountainous cities.
Busan Metropolitan City is the second-largest city in South Korea and ranks 12th in the Global Smart City Evaluation Index. Benefiting from its advantageous geographical location, Busan serves as both a key logistics hub in Northeast Asia and a critical global port city. Over recent decades, rapid urban expansion has placed substantial pressure on land resources and ecosystems. The city’s distinctive coastal–mountainous terrain, scarcity of flat land, and high level of urbanization make it a representative case for reconciling economic progress with ecosystem preservation. The challenges faced by Busan are shared by many rapidly developing coastal cities worldwide, including declining habitat quality, imbalanced land-use structures, and increasing difficulty in sustaining ecological equilibrium amid high population density and intensive economic activity. In response, some scholars have employed habitat quality indices to identify ecologically significant areas in Busan that should be prioritized for protection [44], while others have examined the ecological impacts of various development plans for the city’s new urban districts [45]. However, existing research in South Korea has predominantly focused on Jeju Island or national-level nature reserves [46,47,48,49], with relatively limited emphasis on systematic analyses at the urban scale. In particular, studies addressing the long-term, scenario-based coupling between land use and ecosystem dynamics remain scarce. Therefore, this study selects Busan Metropolitan City as the research area. As a representative coastal mountainous city, examining Busan contributes to enriching research on the sustainable development of similar cities.
To address the issues mentioned above, this study aims to investigate the impact of land-use changes on the evolution of habitat quality in Busan under different development scenarios, to clarify the spatial transformation patterns, and to identify the dominant factors influencing spatial differentiation in habitat quality. The specific objectives are as follows:
(1)
To simulate land-use patterns in Busan from 2029 to 2049 under various SSP scenarios using the PLUS model combined with projected climate and socio-economic data;
(2)
To assess the temporal and spatial evolution of habitat quality in both historical and future periods based on land-use patterns using the InVEST model;
(3)
To determine and measure the key drivers of habitat quality’s spatial heterogeneity through the GeoDetector model;
(4)
To apply multiple significance testing methods to assess the reliability of the results and enhance the robustness of the models;
(5)
To provide theoretical and data-based support for ecological conservation, land-use planning, and sustainable development in Busan and other coastal mountainous cities facing land resource constraints.

2. Materials and Methods

2.1. Study Area

Busan Metropolitan City (BMC) lies at the southeastern tip of South Korea (35°06′–35°23′ N, 128°49′–129°04′ E), bordered by the Sea of Japan (East Sea) to the east, the Korea Strait to the south, South Gyeongsang Province to the west, and Ulsan City to the north. Covering approximately 770.04 km2 (Figure 1), the city comprises 15 administrative districts. As the core city of South Korea’s southern economic belt, Busan is the country’s second-largest city and its largest port, serving as a pivotal hub for the national marine economy and the global logistics network. As of 2024, the city has a permanent population of about 3.269 million and a gross regional domestic product (GRDP) of USD 80.79 billion (2022). It has a marine subtropical monsoon climate, averaging 14 °C in temperature and 1466.2 mm in annual rainfall. The terrain is predominantly mountainous and hilly with extensive forest cover, while the remaining ridges of the Taebaek Mountains form a significant ecological barrier. The Nakdong River flows through the city’s western area, creating a large estuarine delta and sandbar wetlands at its mouth, whereas the Suyeong and Dongcheon Rivers in the east sustain coastal wetlands and riparian ecosystems. Among them, the Nakdong River Estuary Wetland, designated as nationally important, serves as a crucial stopover and habitat for migratory birds.

2.2. Data Source and Processing

2.2.1. Land-Use Data

This study employed a land-cover dataset released by the Korean Ministry of Environment, which has been updated approximately every ten years since 1988, with four editions available in 1988, 1997, 2009, and 2019. The dataset has a spatial resolution of 30 m × 30 m, and the projection coordinate system is defined as Korea_2000_Transverse_Mercator. These four periods were selected as the basis for analysis because they capture the land-use evolution of Busan over roughly three decades from the 1980s to the late 2010s and also represent distinct stages of urbanization: 1988 reflects the initial stage of urbanization, 1997 and 2009 correspond to two major phases of development, and 2019 represents the most recent stage. Compared with medium and fine classification datasets, the large classification data are more suitable for metropolitan-scale and long-term analyses. Although medium and fine classification datasets provide higher accuracy, they involve substantially larger data volumes, which can increase the computational burden of models and reduce efficiency. In contrast, the large classification system divides land into seven categories, which aligns closely with the input requirements of the PLUS and InVEST models and helps to avoid the fragmentation and reduced robustness that can result from over-classification. Therefore, this study selected the large classification land-cover dataset published by the Korean Ministry of Environment as the core input for the subsequent PLUS, InVEST, and GeoDetector models.

2.2.2. Driving Factors

Drawing on previous studies and considering the characteristics of the study area, this research identified 14 representative driving factors, covering both natural environmental and socio-economic aspects, for use in simulating future land use [50,51,52] (Table S1). The natural environmental factors comprise annual average temperature, annual average precipitation, soil type, DEM, and slope, whereas the socio-economic factors consist of the Night-Time Light Index (NTL), population, railway, highway, primary road, secondary road, trunk road, distance to government centers, and distance to rivers. The slope was derived from the DEM, and railway, road, and distance variables were calculated using the Euclidean Distance tool. On this basis, the NDVI and NPP were incorporated as additional driving factors in the GeoDetector model. Furthermore, to analyze changes in Busan’s land-use structure under different future scenarios, precipitation, temperature, population, and GDP were selected as the core driving variables, in line with the SSP–RCP scenario framework outlined in the IPCC Sixth Assessment Report. Climate data were obtained from WorldClim, whereas population and GDP data were derived from SSP-based projections by Gao, J. and Wang, T. [53,54].

2.3. Methodology

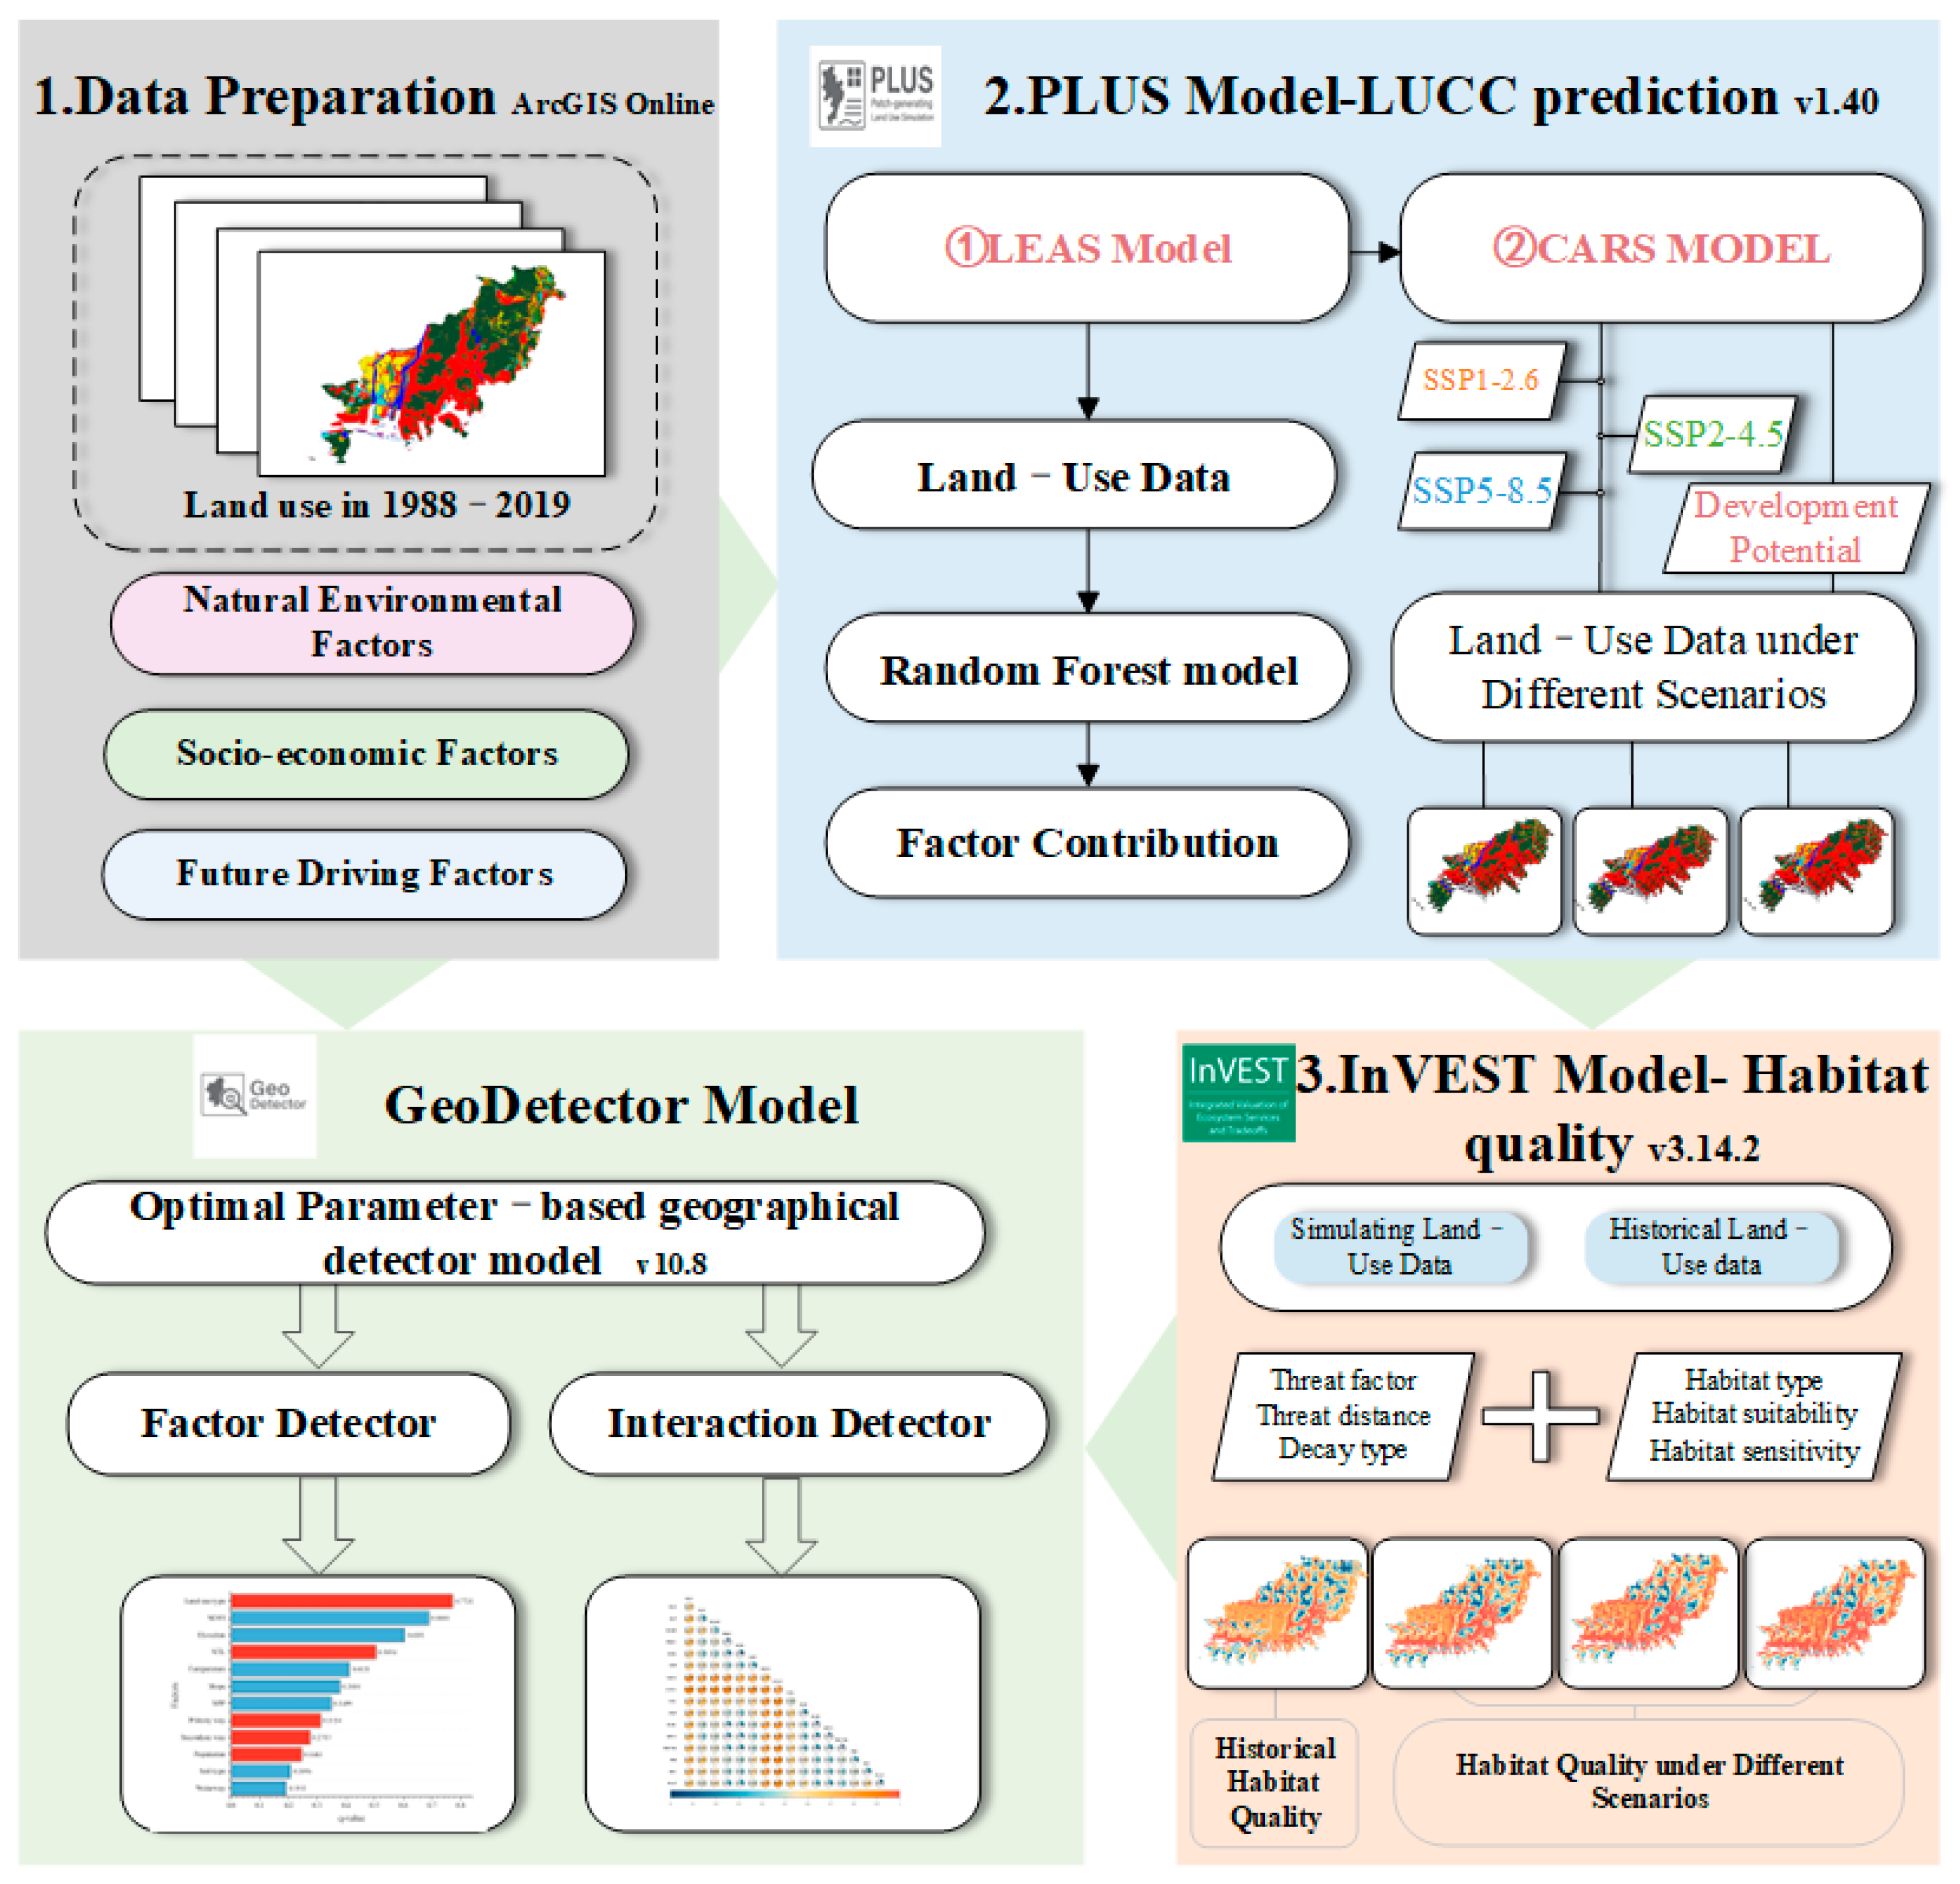
This study establishes a comprehensive analytical framework integrating the PLUS, InVEST, and GeoDetector models. All spatial datasets were resampled to a uniform resolution of 30 m to ensure consistency across models. Future land-cover projections generated by the PLUS model were used as inputs to the InVEST model to assess habitat quality. The generated habitat quality dataset was then applied as the dependent variable in the GeoDetector analysis (Figure 2).

2.3.1. PLUS Model

The PLUS model integrates the LEAS and CARS modules to efficiently simulate land use and land-use change. The LEAS module overlays and analyzes land-use change across two time periods and combines it with driving factors. A random forest algorithm is then applied to estimate the expansion probability of each land-use type, thereby generating a land development potential map. The parameter settings for this module are as follows: the number of regression trees was set to 5, the sampling rate was set to 0.01, the mTry value was set to 5, and the number of threads was set to 5. The CARS module adopts a multi-type random seed mechanism to generate complex land-use patches [38]. Its specific parameters were set as follows: the neighborhood size was set to 3, the number of threads was set to 5, the patch generation threshold was set to 0.2, the expansion coefficient was set to 0.1, and the percentage of seeds was set to 0.001. In addition, the PLUS model includes a demand prediction function based on Markov chains, which uses historical land-use and land-use change data to forecast the future quantity of each land type. This ensures that total land demand remains balanced during the CARS module simulation. Model accuracy is generally validated using the Kappa coefficient. In this study, the model’s applicability to the research area was tested by simulating land-use patterns in 2019 based on land-use data from 1997 and 2009. The results showed a Kappa coefficient of 0.79308 (Figure S1), which falls within the high-accuracy range of 0.6 to 0.8 [50,55,56], indicating that the PLUS model is suitable for simulating and predicting future land use in the study area. Furthermore, the PLUS model can incorporate projected climate, precipitation, population, and GDP data to simulate land-use trajectories under different climate scenarios.

2.3.2. InVEST Model

The InVEST model is a comprehensive and highly integrated tool for evaluating ecosystem services. Its robust visualization capabilities facilitate the intuitive presentation of analytical results to decision-makers, thereby providing a sound scientific basis for land resource allocation and ecological conservation [47,57]. The habitat quality module evaluates habitat distribution using land-cover data along with threat and sensitivity parameters [58]. Habitat quality is quantified according to the following mathematical formulation:
Q x j = H j 1 D x j z D x j z + k z
In the formula, Q x j represents the habitat quality index for habitat j , H j is the habitat suitability index, D x j denotes the habitat degradation index for habitat j , and k is the half-saturation constant, which is typically set to 0.5.
An elevated degradation index reflects a more severe decline in habitat quality. The degradation index is calculated using the following equation:
D x j = r = 1 R y = 1 Y ω r r = 1 R ω r × r y × r r x y × β x × S j r
In the formula, D x j denotes the habitat degradation index of habitat j located in grid cell x ; R is the number of grid cells x where threat sources are present; Y represents the total number of threat sources r ; ω r is the weight assigned to threat source r ; r y indicates the impact intensity of threat source r on grid cell y ; β x denotes the habitat suitability of grid cell x ; and S j r is the sensitivity of habitat j to threat factor r .
In addition, the habitat quality model computes the habitat quality index according to the distance between threat sources and habitat areas. The influence of each threat source decreases with increasing distance from the habitat. This distance-decay effect can be characterized as either linear or exponential. The relationship is expressed mathematically as follows:
Linear   Decay :   i r x y = 1 d x y d r m a x
Exponential   Decay :   i r x y = e x p 2.99 d r m a x d x y
Among them, d r m a x represents the maximum impact distance of the threat factor, and d x y denotes the straight-line distance between raster cells x and y .
Following the InVEST user manual and relevant literature [20,29,47,48,59], this study specified the threat parameters for each habitat type, including source category, distance, weight, maximum influence range, and sensitivity (Table 1 and Table 2). The habitat quality index was classified into five levels using the equal-interval method [31].

2.3.3. Scenario Setting

This study categorizes future development scenarios into three types: 1. Ecological Protection Scenario—prioritizes ecological preservation and promotes a green, sustainable development path based on environmental safeguards; 2. Inertial Development Scenario—maintains the current development trajectory without major policy adjustments, reflecting a trend of continuous expansion; 3. Economic Priority Scenario—emphasizes rapid economic growth driven by extensive fossil fuel consumption and unregulated urban sprawl [30,33]. The definitions of the Shared Socio-economic Pathways (SSPs) provided by the Korea Ministry of Environment are consistent with these scenarios: SSP1-2.6 represents an environmentally friendly path with minimal fossil fuel use and rapid deployment of renewable energy; SSP2-4.5 reflects a moderate approach in both climate mitigation and socio-economic development; SSP5-8.5 describes an aggressive economic expansion pathway with high fossil fuel dependence and extensive urbanization. Accordingly, the Ecological Protection Scenario corresponds to SSP1-2.6, the Inertial Development Scenario to SSP2-4.5, and the Economic Priority Scenario to SSP5-8.5.
During the simulation process, this study referenced the 2040 Busan Urban Master Plan and the 5th National Territorial Plan, both of which provide strategic guidance on the future development and spatial positioning of Busan. Under the SSP1-2.6 pathway, aligned with the 2050 carbon neutrality objective and coastal ecological restoration targets in these plans, the likelihood of converting construction and barren lands to other land categories was raised by 30%, whereas reverse conversions were limited. The SSP2-4.5 scenario maintains the status quo, using the original land demand projected by the Markov chain model without any adjustments. In the SSP5-8.5 scenario, following policy suggestions regarding industrial cluster expansion and the positioning of Busan as an international logistics hub, land transitions from construction land to other categories were prohibited, while the probability of conversion from all remaining land types to construction and barren land was increased by 20%. Based on the scenario settings and relevant literature [33,51], land-use transition cost matrices and transfer probabilities were developed for the three scenarios (Tables S2–S5).
To further enhance the realism of the simulation, this study incorporated projected climate and economic variables associated with each SSP pathway as driving factors within the PLUS model. For the period 2029–2049, future temperature, precipitation, population, and GDP data corresponding to each SSP scenario were input into the LEAS module to simulate the temporal and spatial dynamics of land-use patterns. The resulting land-expansion maps for each year and scenario were then processed through the CARS module, generating future land-use simulations that align both with global development trajectories and local policy contexts.

2.3.4. GeoDetector

The geographic detector is a statistical method used to identify driving forces by detecting spatial stratified heterogeneity between dependent and independent variables. It quantifies the degree of heterogeneity by calculating the variance within each data layer and employs the q-value to indicate each factor’s explanatory strength for spatial variation [60]. This approach has been extensively employed in both ecological protection and urban development planning [61,62,63]. A single-factor detector was applied to assess the explanatory power of various factors on habitat quality. The calculation is given by the following formula:
q = 1 h = 1 L N h σ h 2 N σ 2
where q represents the explanatory power of a single factor, ranging from 0 to 1. A higher q-value reflects greater explanatory power. L refers to the number of influence factors; h denotes the number of strata influencing habitat quality; N h and N refer to the sample sizes within stratum h and the entire region, respectively; and σ h 2 and σ 2 represent the variance within stratum h and the total variance, respectively.
In order to further clarify the degree of interaction between different factors affecting habitat quality, this study employed the interaction detector module to identify the interaction relationships among variables and reveal the complex mechanisms driving the spatial heterogeneity of habitat quality [64], with the interaction types determined according to the referenced literature.

3. Results

3.1. Land-Use Change Analysis

3.1.1. Land-Use Dynamics Between 1988 and 2019

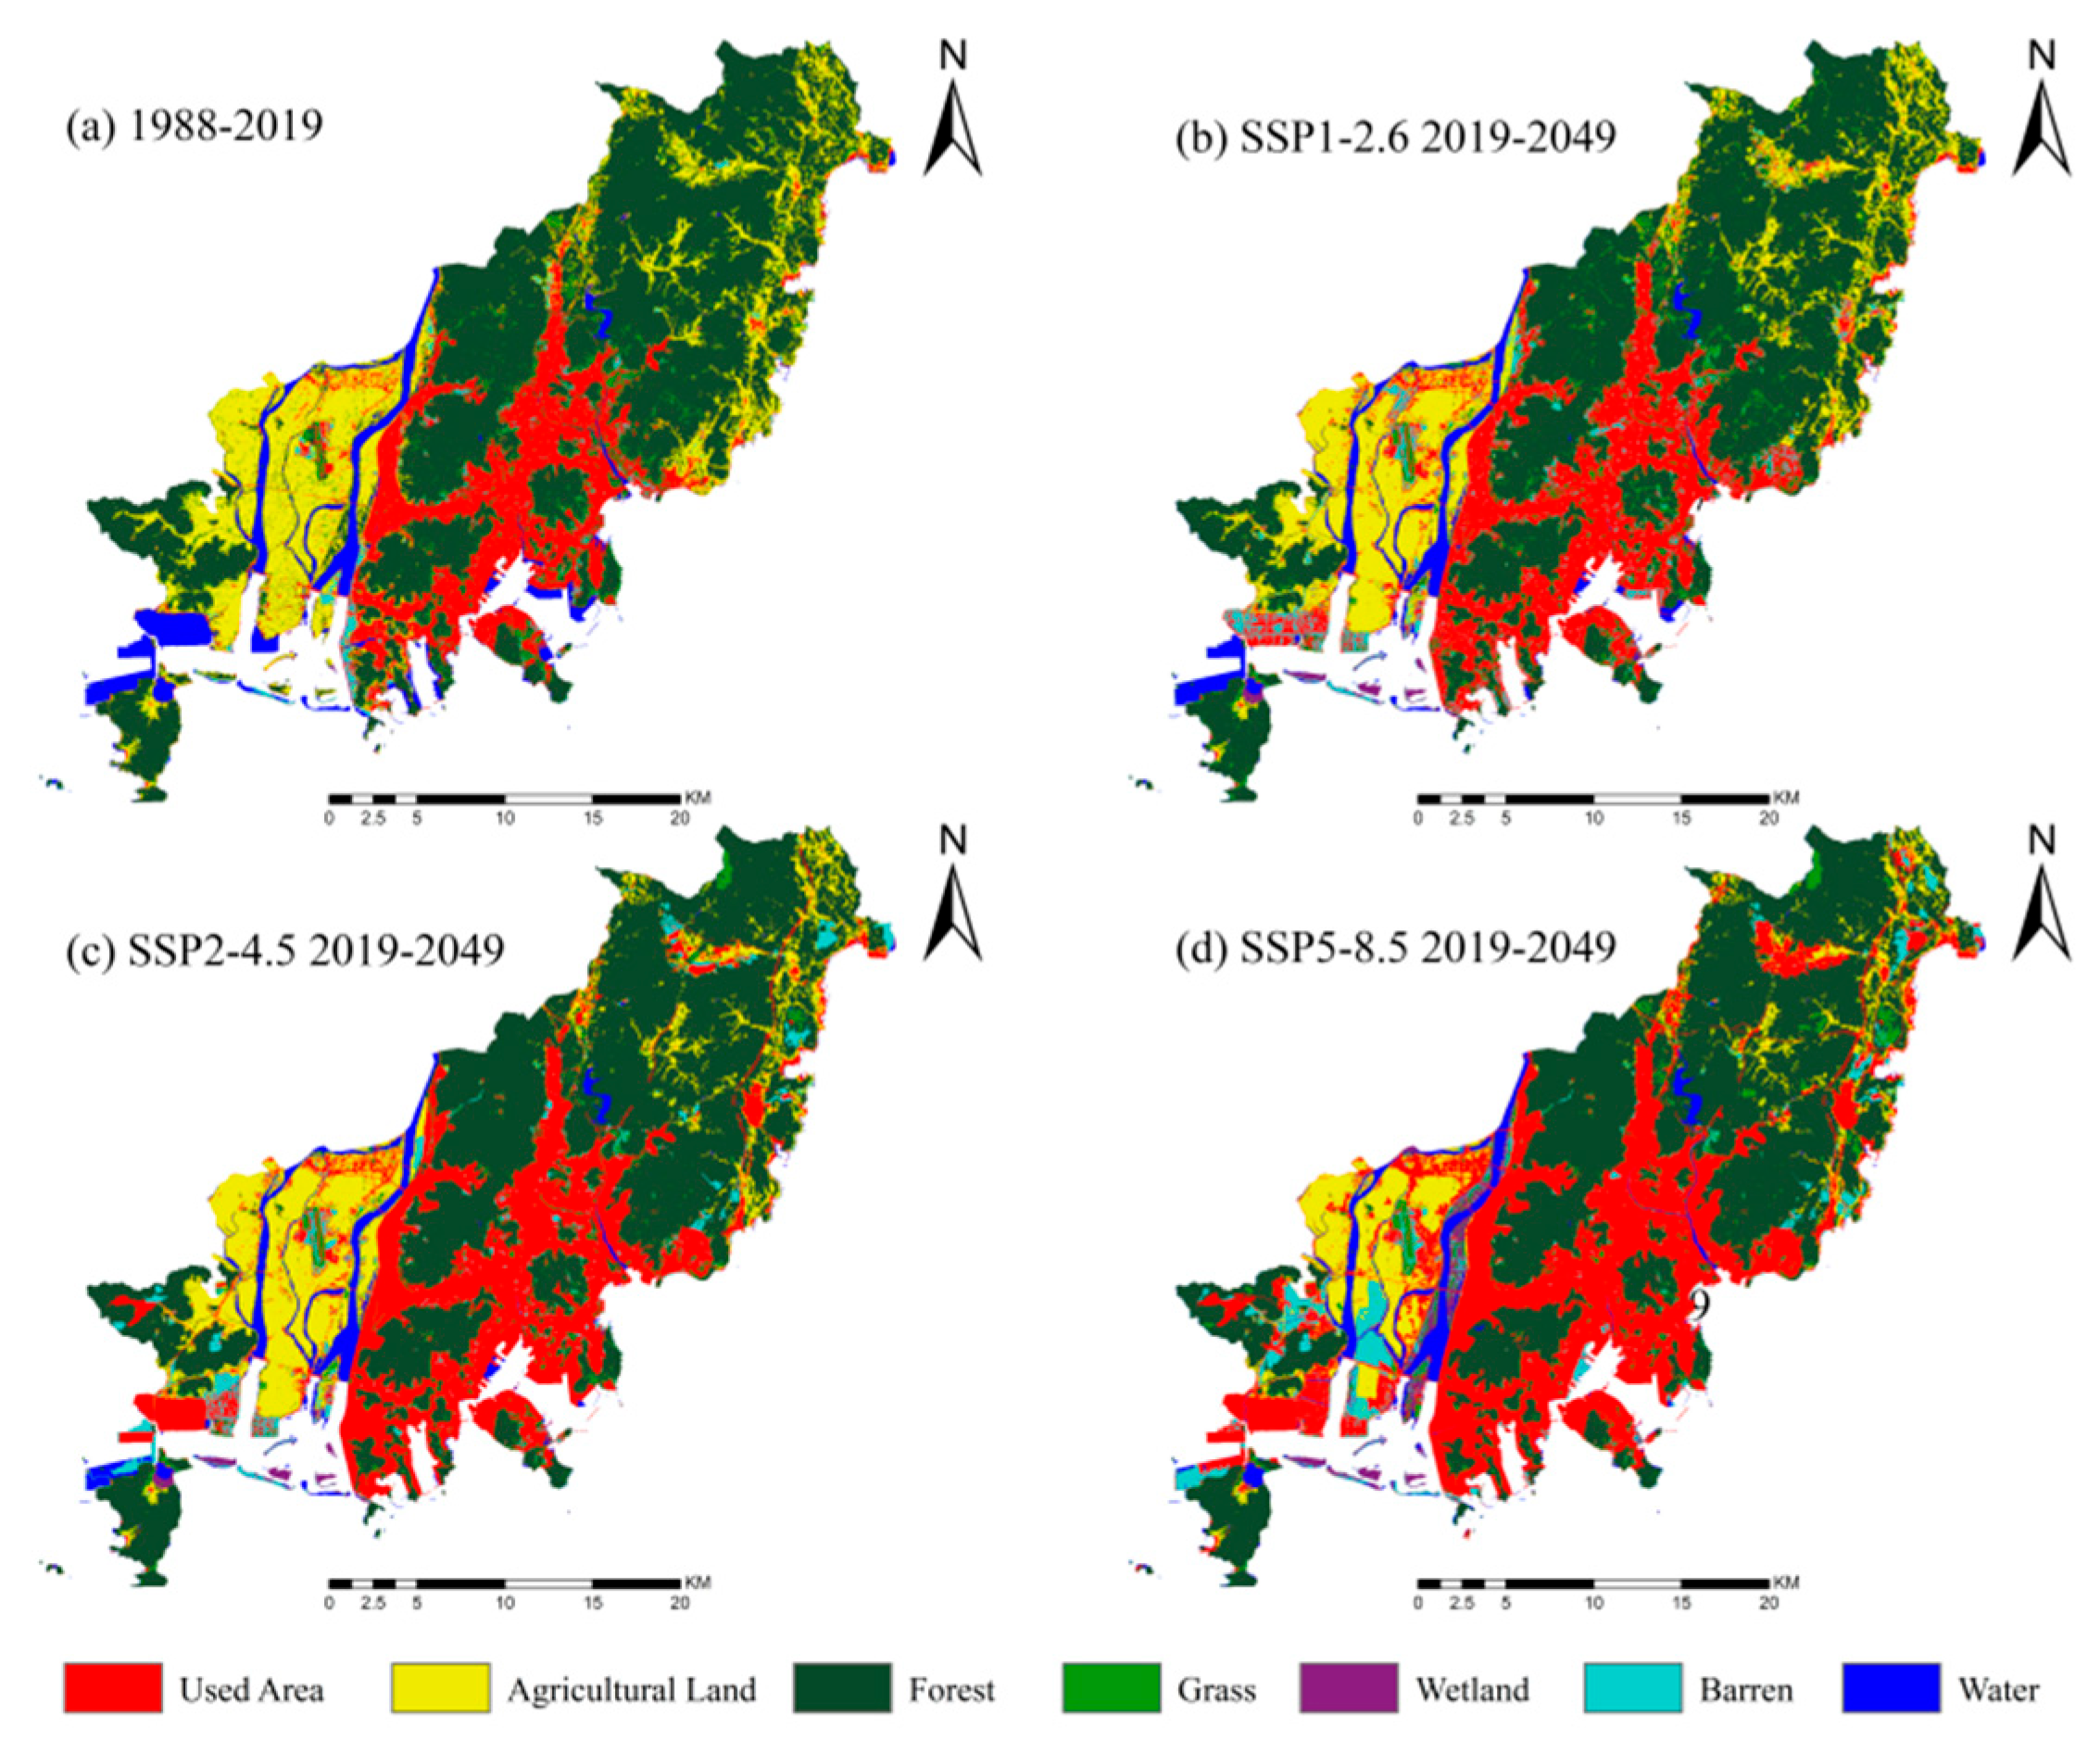
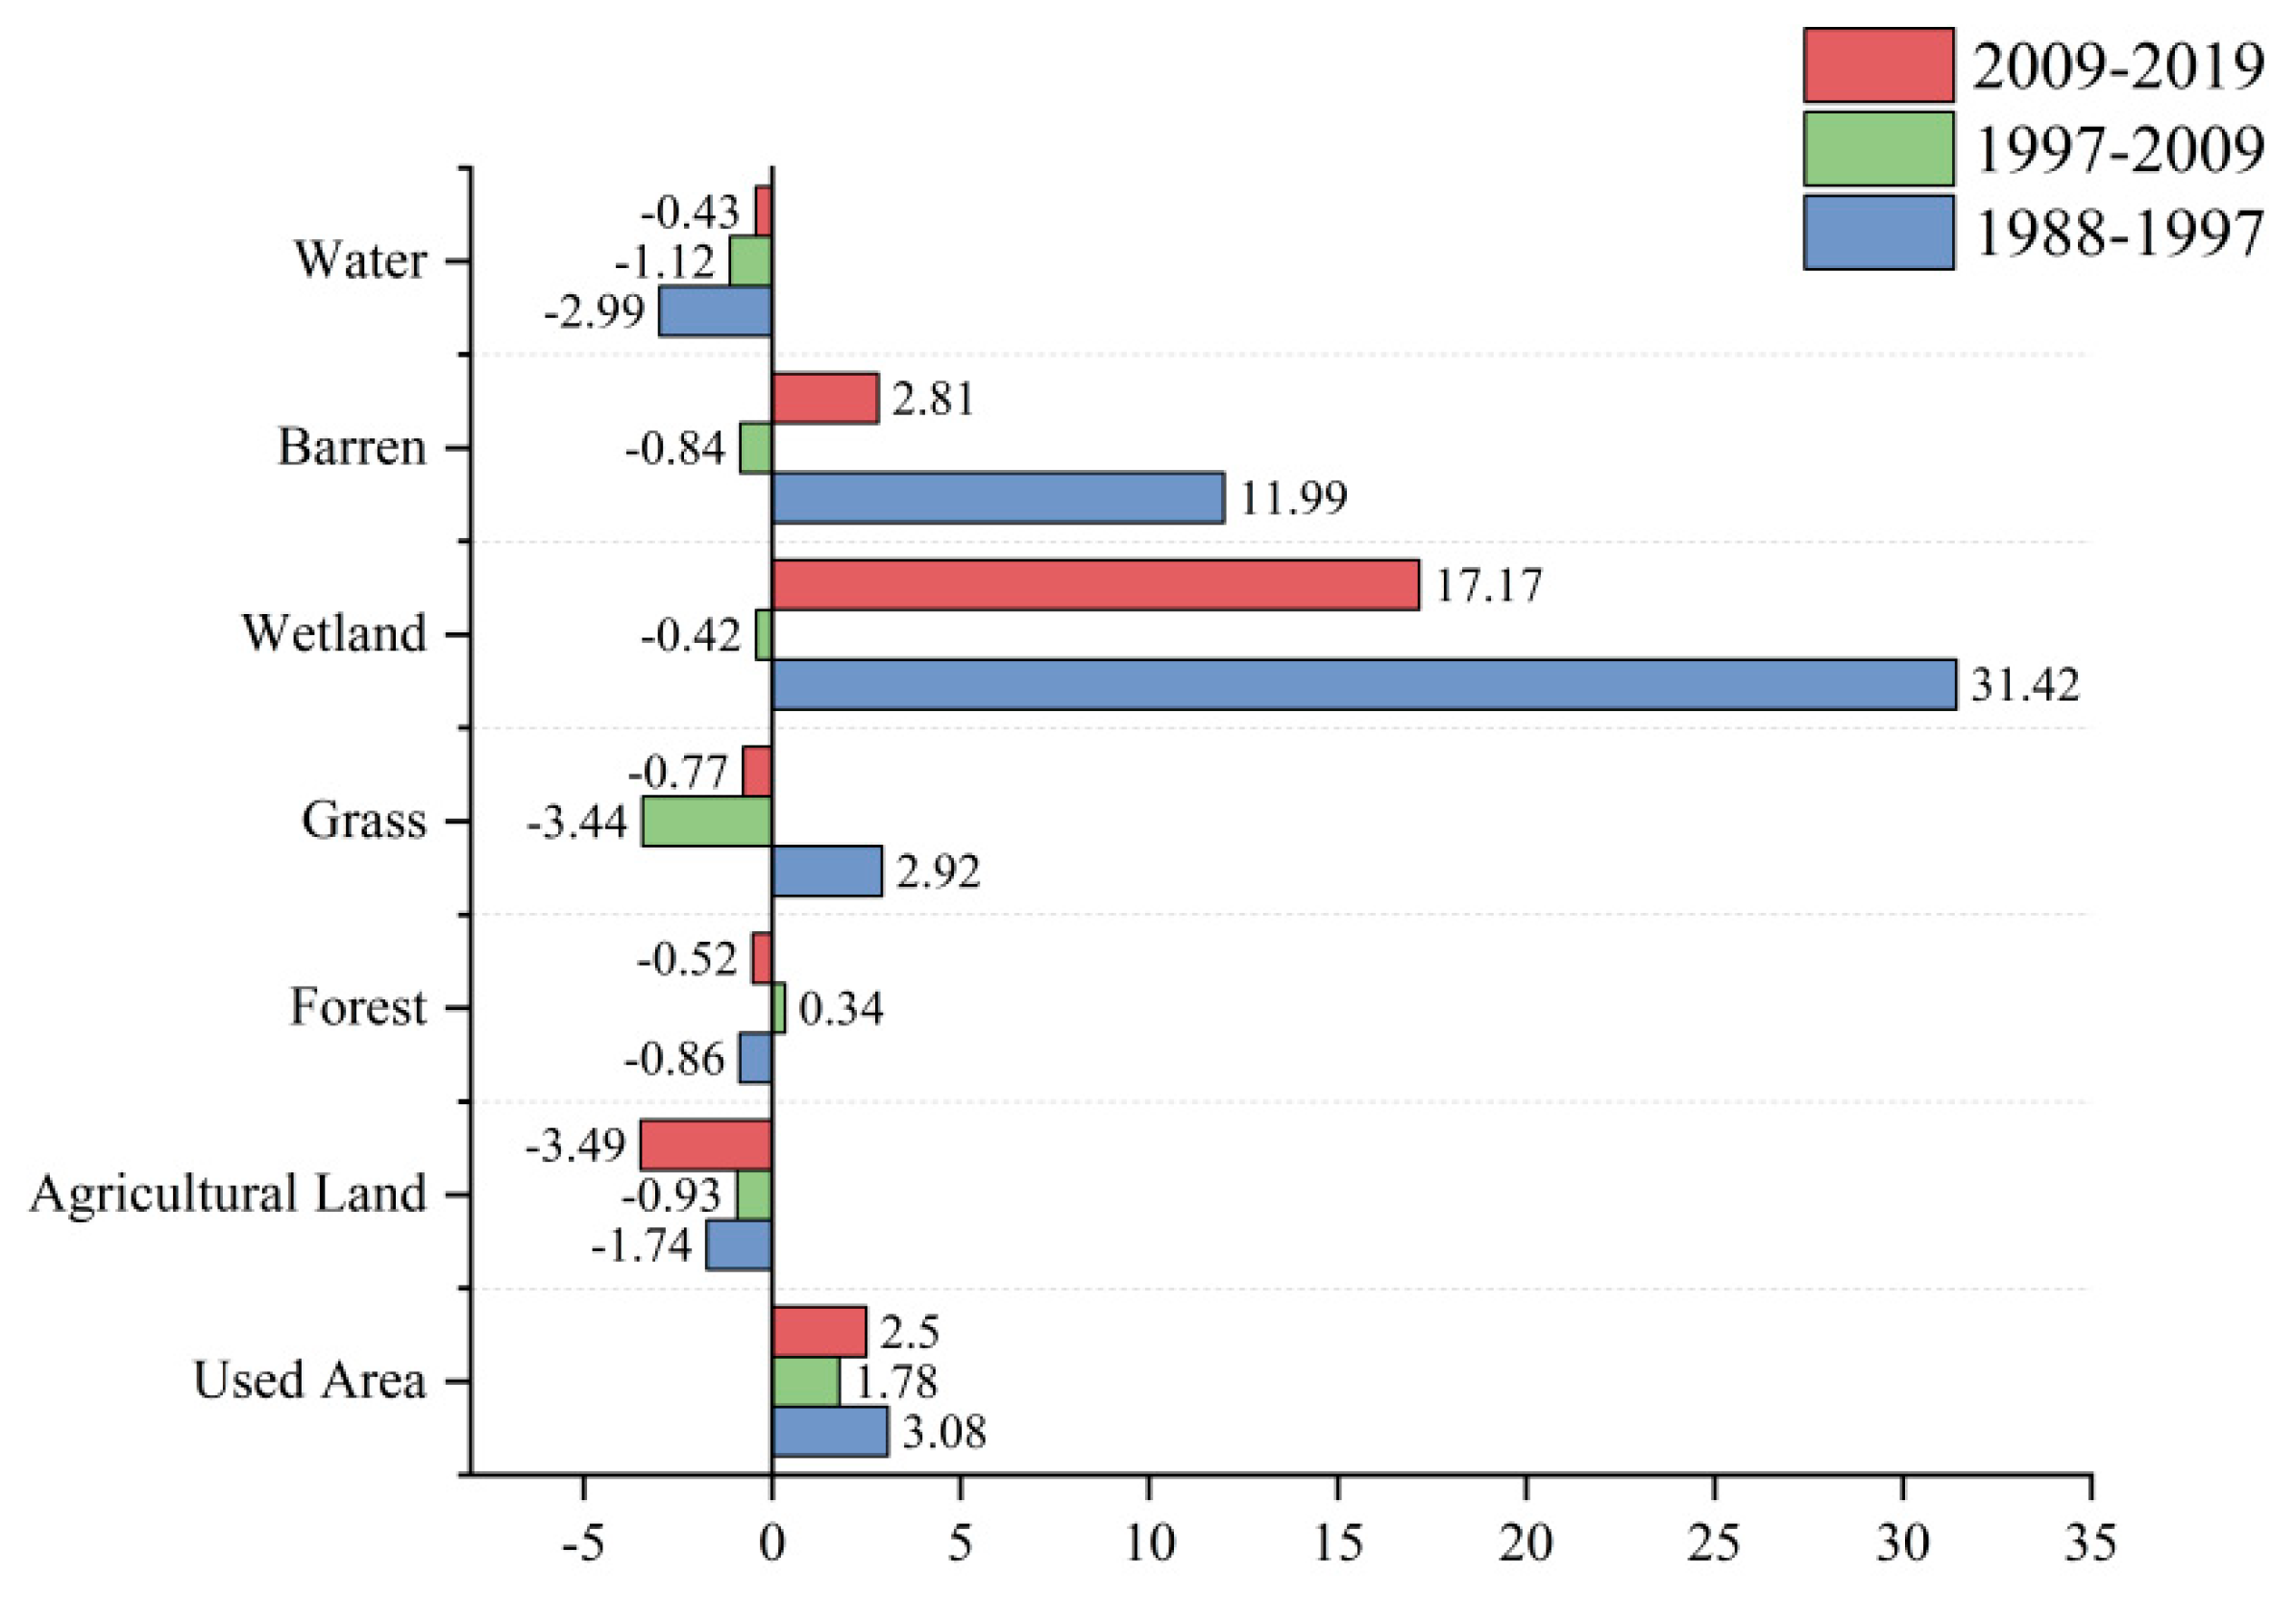
This study analyzes the spatial distribution characteristics of land-cover types, area changes, and the Single Land Use Dynamic Degree in Busan Metropolitan City from 1988 to 2019 (Figure 3 and Figure 4, and Table 3). Over the study period, the land-use structure shifted from being dominated by forest and agricultural land to a structure dominated by forest and used area. The used area exhibited a continuous upward trend, with a cumulative increase of 11,281.59 ha, characterized by a multi-core expansion pattern. The urban core in the central region expanded toward the north and west, while agricultural land in the northeast was rapidly converted into urban land due to urbanization pressure. In addition, scattered development emerged along the coastal zone. Agricultural land declined significantly by 7810.65 ha, with losses concentrated in the Nakdong River Delta in Gangseo-gu and along the coastal areas of Gijang-gun. Forest and grassland exhibited a fluctuating downward trend, with cumulative decreases of 3513.51 ha and 1529.91 ha, respectively. Wetlands and water bodies underwent substantial changes, with wetland area increasing by 1202.85 ha and water body area decreasing by 1846.44 ha. The area of barren land fluctuated significantly, rising from 1589.58 ha in 1988 to 3805.20 ha in 2018.
In terms of the rate of change, the used area exhibited the highest value between 1988 and 1997, reaching 3.08%; although it declined slightly thereafter, it remained at a high level. The change rate of barren land exhibited a trend comparable to that of used land, exhibiting a sequence of increase, decrease, and subsequent increase. Meanwhile, the rates of change for agricultural land, forest, grassland, and water bodies all exhibited a downward trend. However, the rate of wetland change fluctuated more markedly, which is closely related to the wetland restoration and protection efforts undertaken by Busan Metropolitan City in recent years.
To further elucidate the changes in land-use types, a land transfer matrix was constructed based on land-use data from three periods (Table 4). Between 1988 and 1997, used area and barren land expanded by 3340.89 ha and 1714.95 ha, respectively, primarily converted from agricultural land, forest, and grassland. Meanwhile, agricultural land decreased by 2385.03 ha, forest decreased by 3065.76 ha, and water bodies decreased by 1259.46 ha, making them the primary transfer-out categories. Urban expansion was still in its early stage, during which the used area surpassed agricultural land for the first time to become the second-largest land category. From 1997 to 2009, the expansion of used area continued, with an additional 3281.58 ha. Forest area also increased slightly by 1504.89 ha, primarily through conversions from barren land, grassland, and agricultural land, with barren land alone contributing 1531.17 ha. Although barren land was largely transferred out, its total area decreased only slightly (by 334.17 ha) due to reverse transfers from other land categories. During 2009–2019, urbanization accelerated. Used area expanded by 4659.12 ha, mainly from agricultural land (1573.38 ha) and barren land (1231.83 ha). Wetland and barren land also increased by 845.82 ha and 835.29 ha, respectively. Meanwhile, agricultural land decreased by 3985.65 ha, forest decreased by 1952.64 ha, and the total inflow into agricultural land was only 10.98 ha, which was negligible.

3.1.2. Simulated Land-Use Change from 2029 to 2049 Under Multiple Scenarios

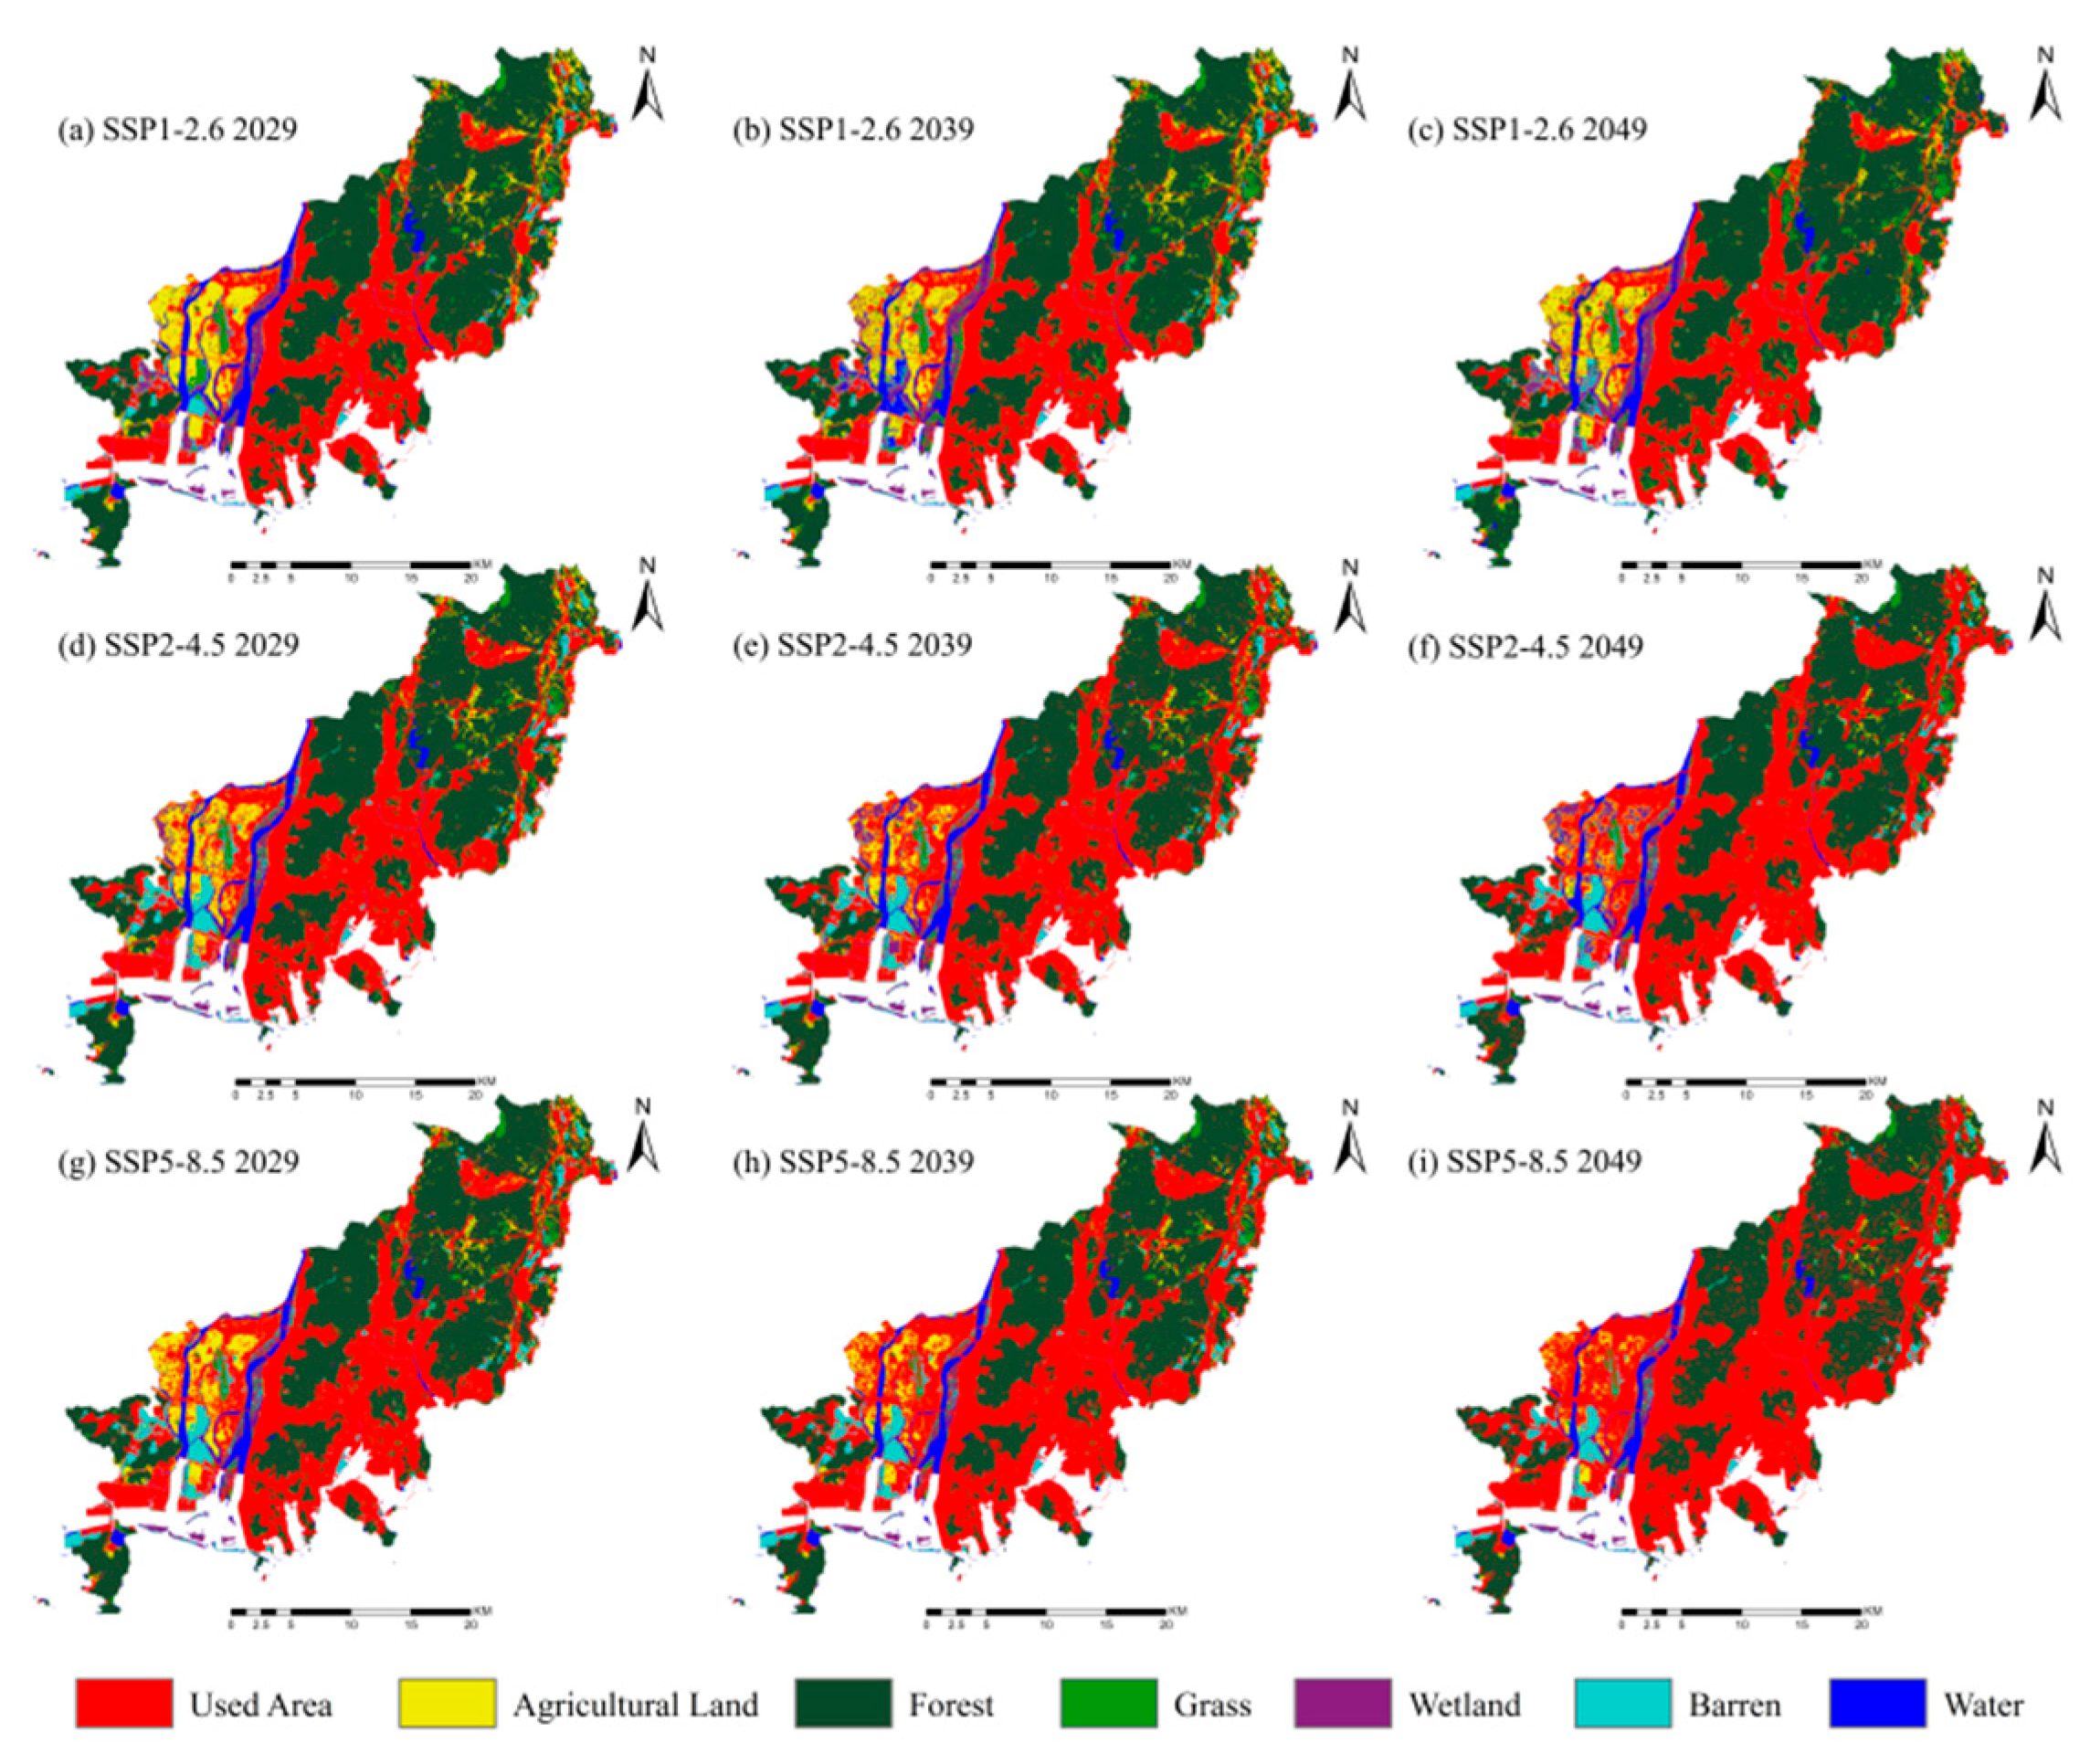
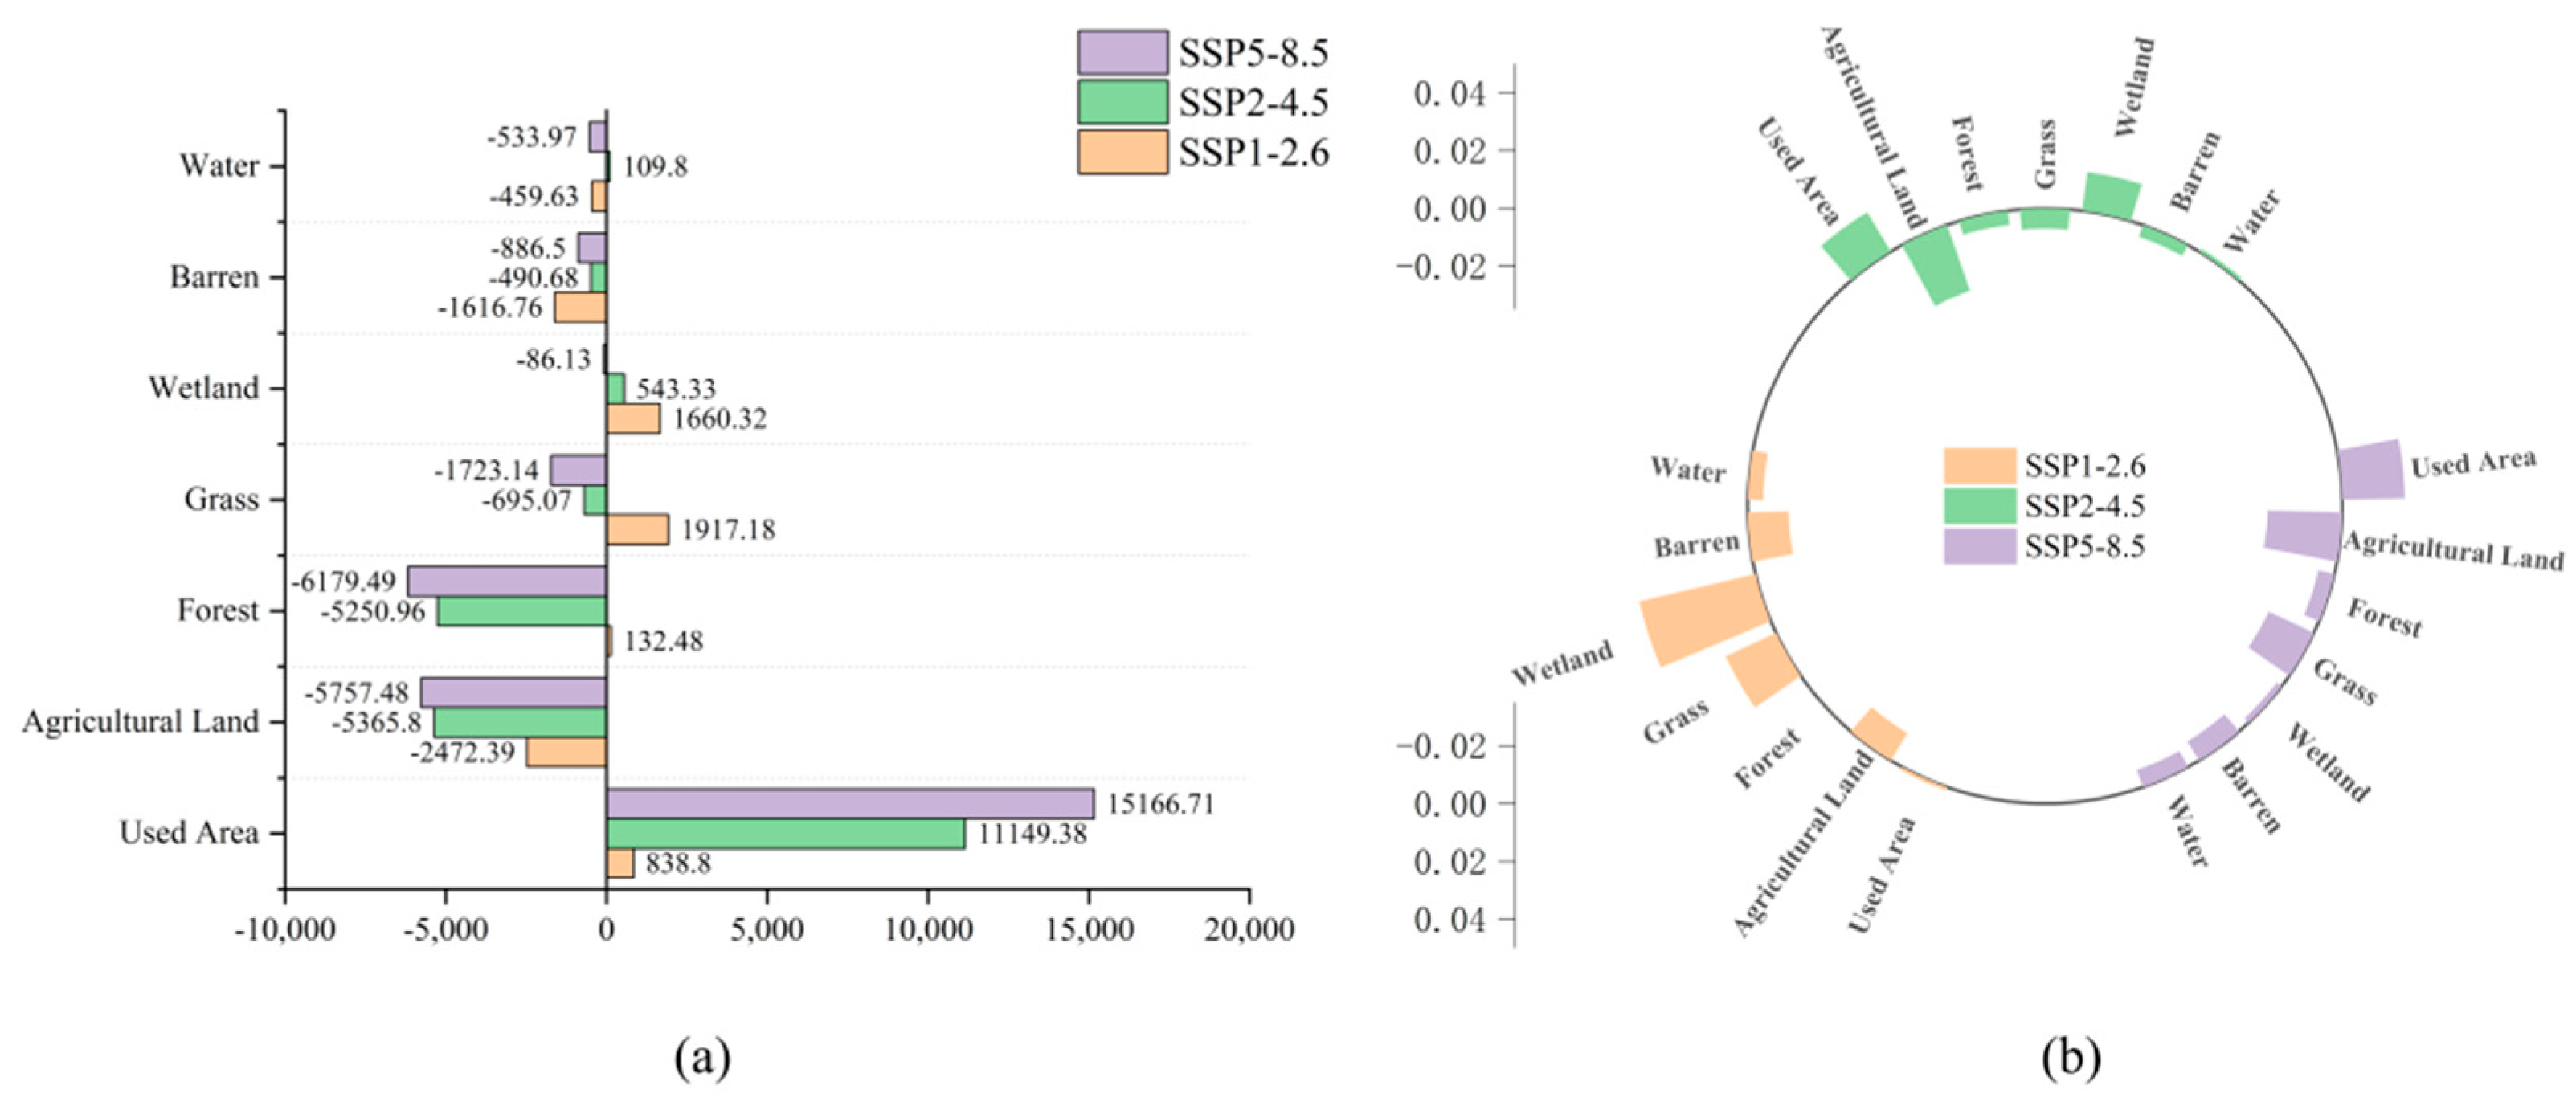
Figure 5 and Figure 6 illustrate the spatial distribution, area changes, and dynamic rates of each land-use type in Busan Metropolitan City from 2029 to 2049 under different development scenarios. In the SSP1-2.6 scenario, the expansion of used area is effectively constrained. Between 2019 and 2049, the used area is projected to expand by 838.8 ha, corresponding to an average annual rate of only 0.12%. In contrast, agricultural land, barren land, and water bodies are expected to continue decreasing, with mean annual rates of decline of 1.11%, 1.42%, and 0.54%, respectively. Conversely, ecological land types, including forest, grassland, and wetlands, are projected to gradually expand, with wetlands exhibiting the most rapid growth at an average annual increase of approximately 4.14%. Under the SSP2-4.5 scenario, the used area, wetlands, and water bodies are projected to increase, with the used area showing the greatest expansion of approximately 11,149.38 ha. Wetlands and water bodies are anticipated to increase by 543.33 ha and 109.8 ha, respectively. Meanwhile, agricultural land and forest are projected to decline substantially by 5365.8 ha and 5250.96 ha, with corresponding mean annual decreases of approximately 2.41% and 0.49%. Grassland and barren land are also expected to experience slight declines.
In the SSP5-8.5 scenario, the used area is the only land type projected to expand, increasing by approximately 15,166.71 ha at an average annual rate of 2.17%. All other land categories are expected to decline in area. Forest and agricultural land are projected to undergo the most substantial reductions, decreasing by 6179.49 ha and 5757.48 ha, corresponding to average annual decreases of approximately 0.57% and 2.59%, respectively. Compared with the other two scenarios, SSP5-8.5 exhibits the largest expansion of used area and the most pronounced loss of forest. Overall, the SSP1-2.6 scenario shows the most restrained expansion of used areas, while SSP5-8.5 presents the highest losses of ecological land.

3.2. Habitat Quality Change Analysis

3.2.1. Habitat Quality Change Between 1988 and 2019

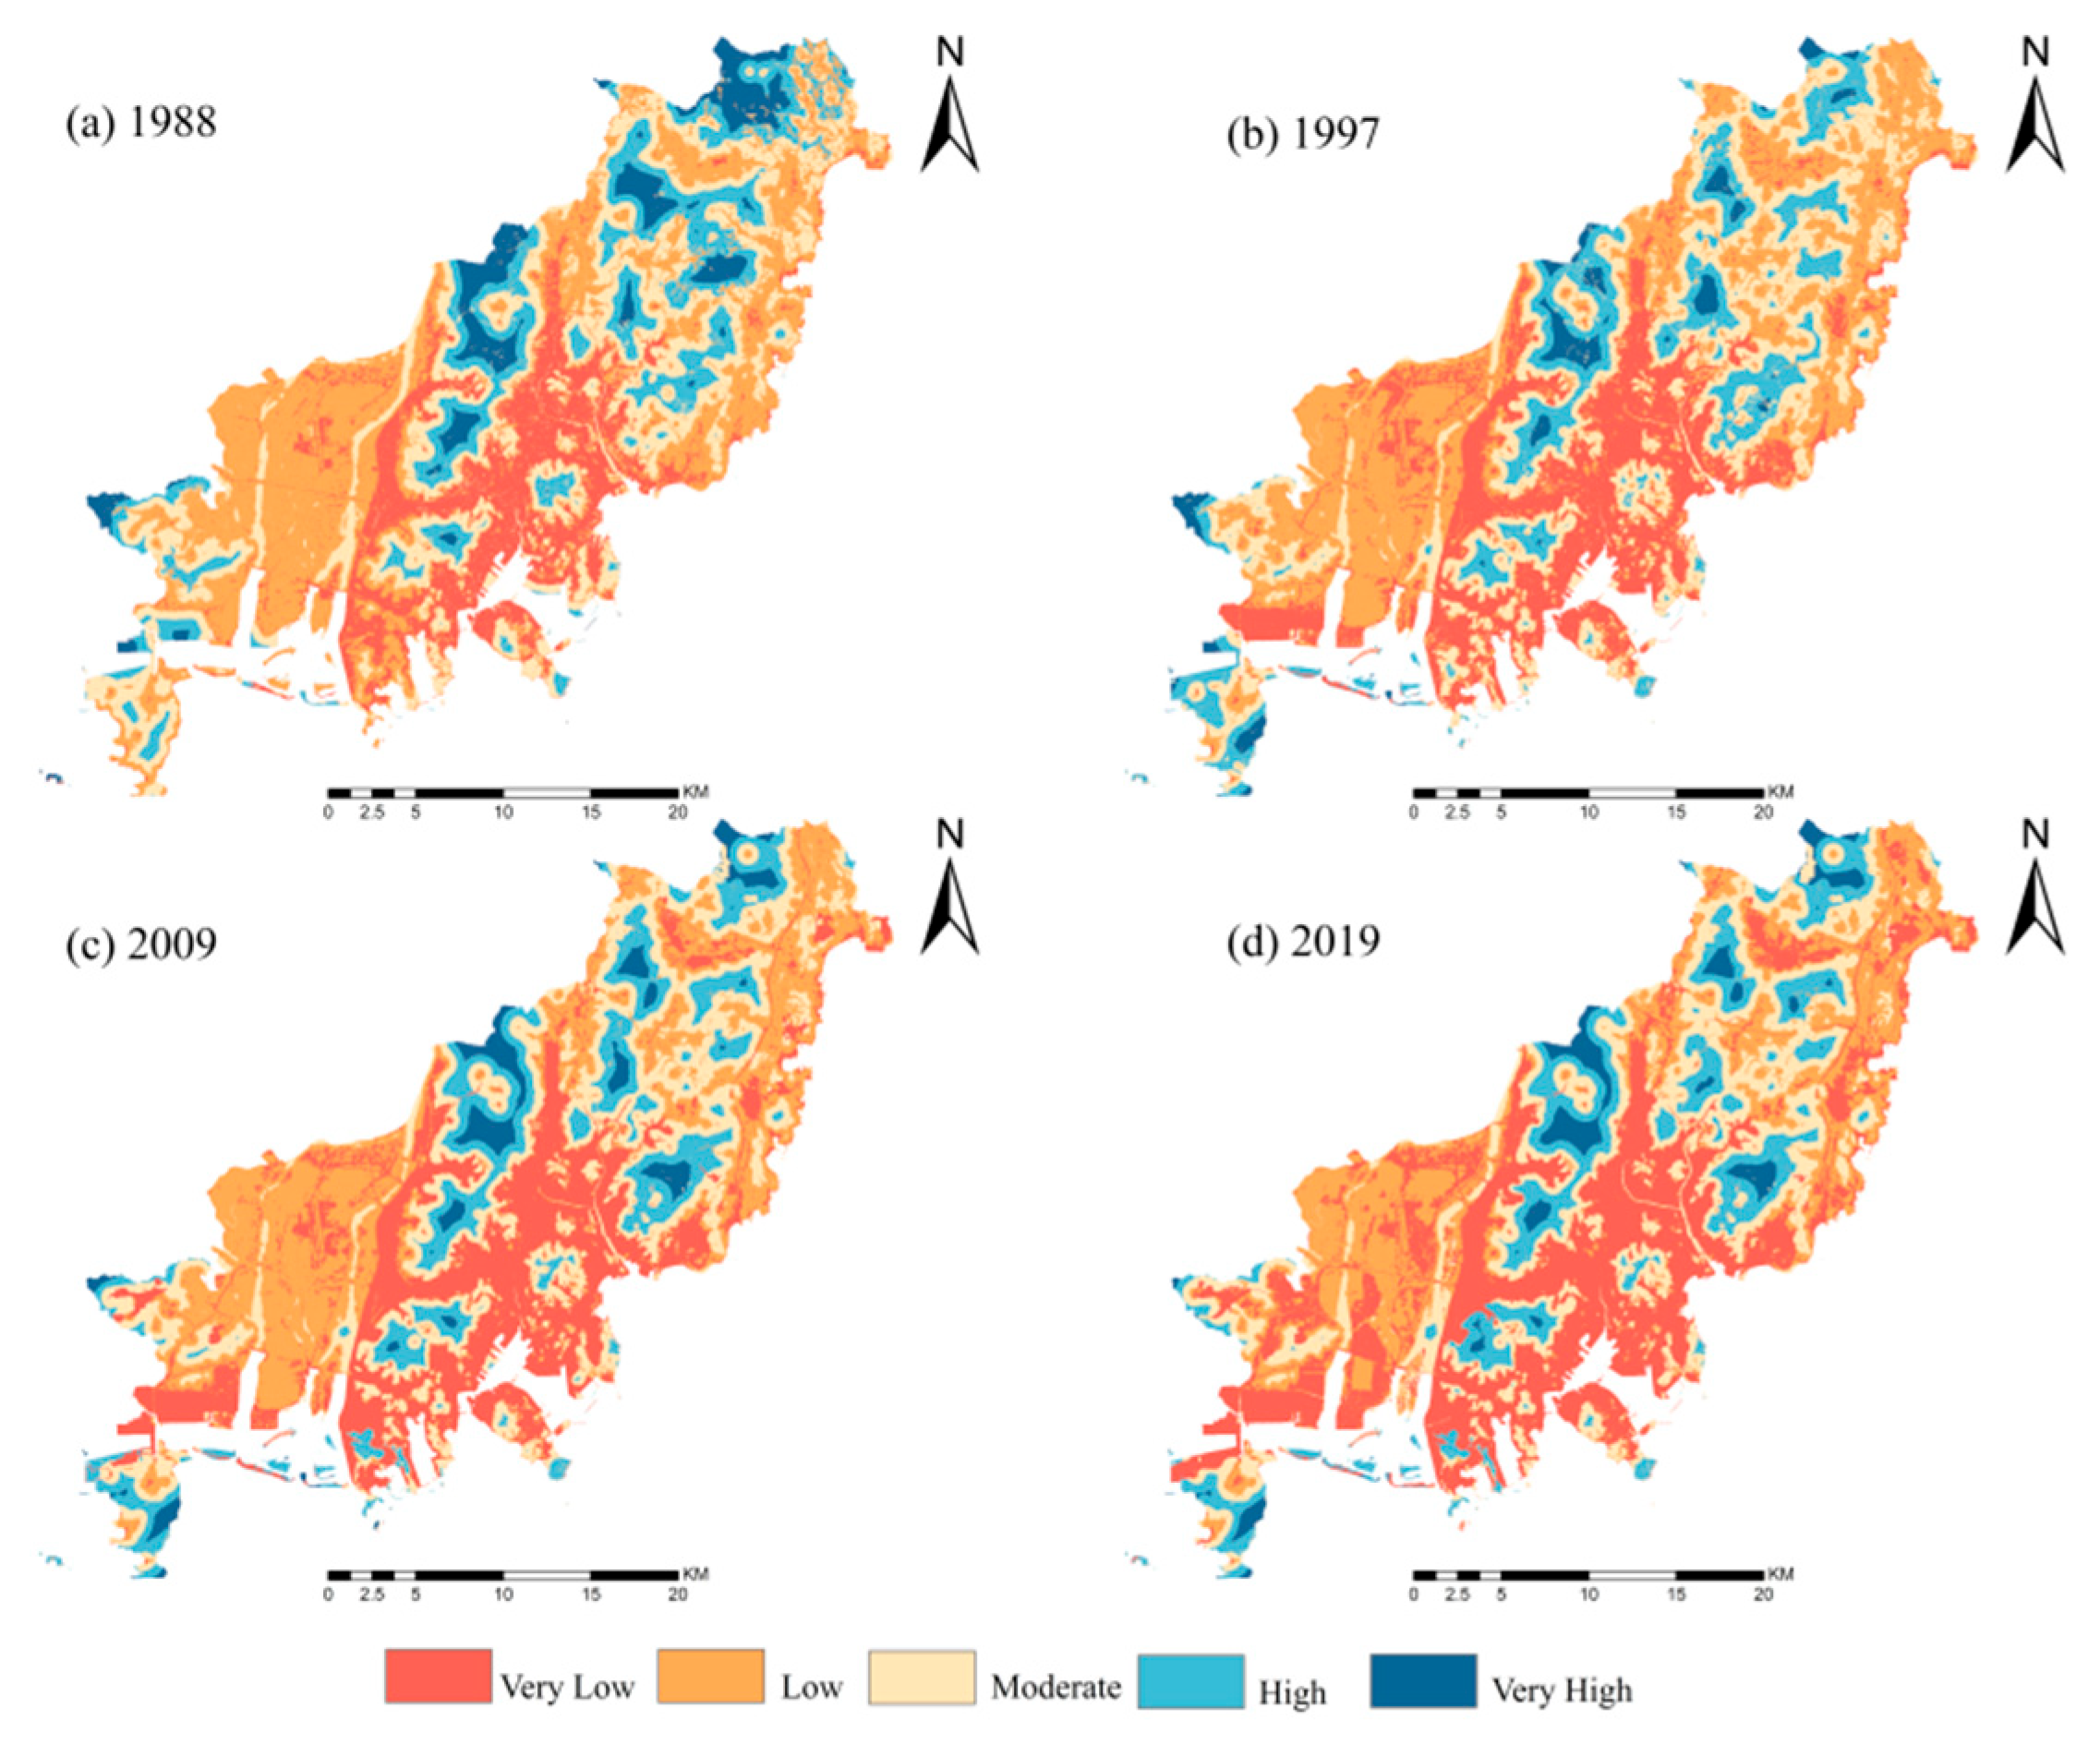
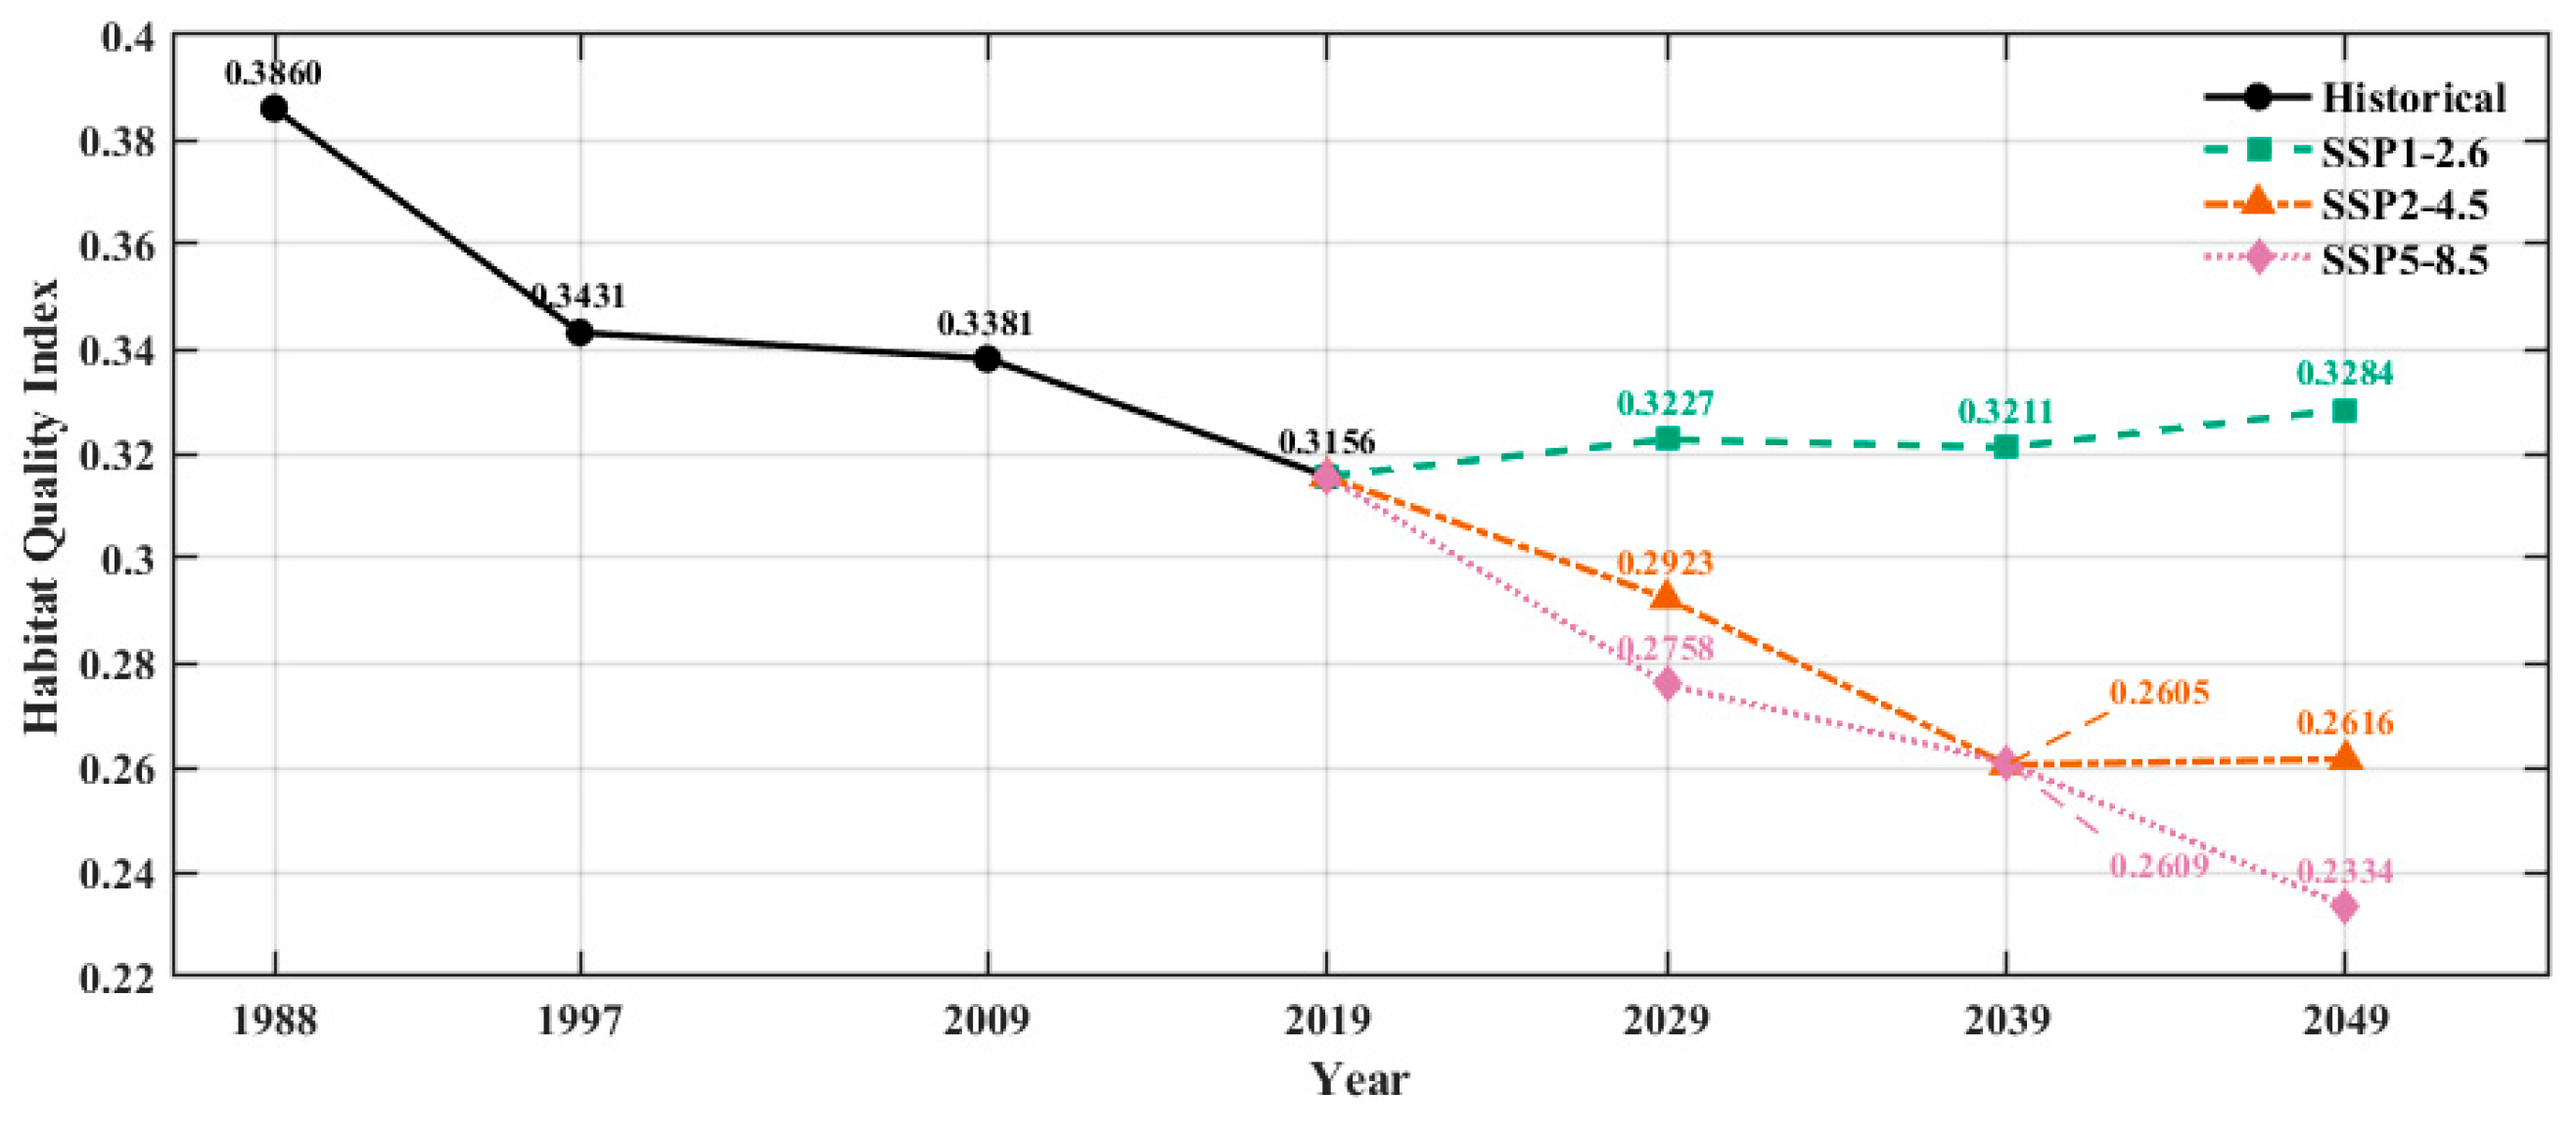
The spatial distribution and mean habitat quality of Busan Metropolitan City between 1988 and 2019 were assessed using the InVEST model (Figure 7 and Figure 8). The analysis revealed a sustained decline in the habitat quality index throughout the study period. The decline was most pronounced in the early years, moderated in the middle period, and intensified again toward the end, resulting in a cumulative reduction of approximately 18.23%. Spatially, habitat quality exhibited marked heterogeneity, with a distinct gradient from plains to mountainous areas and from coastal to inland zones. Areas with very low and low habitat quality were concentrated in the central urban core, gradually expanding toward the west, north, northeast, and coastal regions, particularly in central Gijang-gun. These regions are characterized by flat terrain, high development pressure, and fragile ecosystems. Regions of high and very high habitat quality were mainly concentrated in the northern, eastern, and southwestern island regions, which are mountainous with higher elevations and dense forest cover. These areas maintain complex ecological structures, high biodiversity, and strong resistance to ecological disturbances.
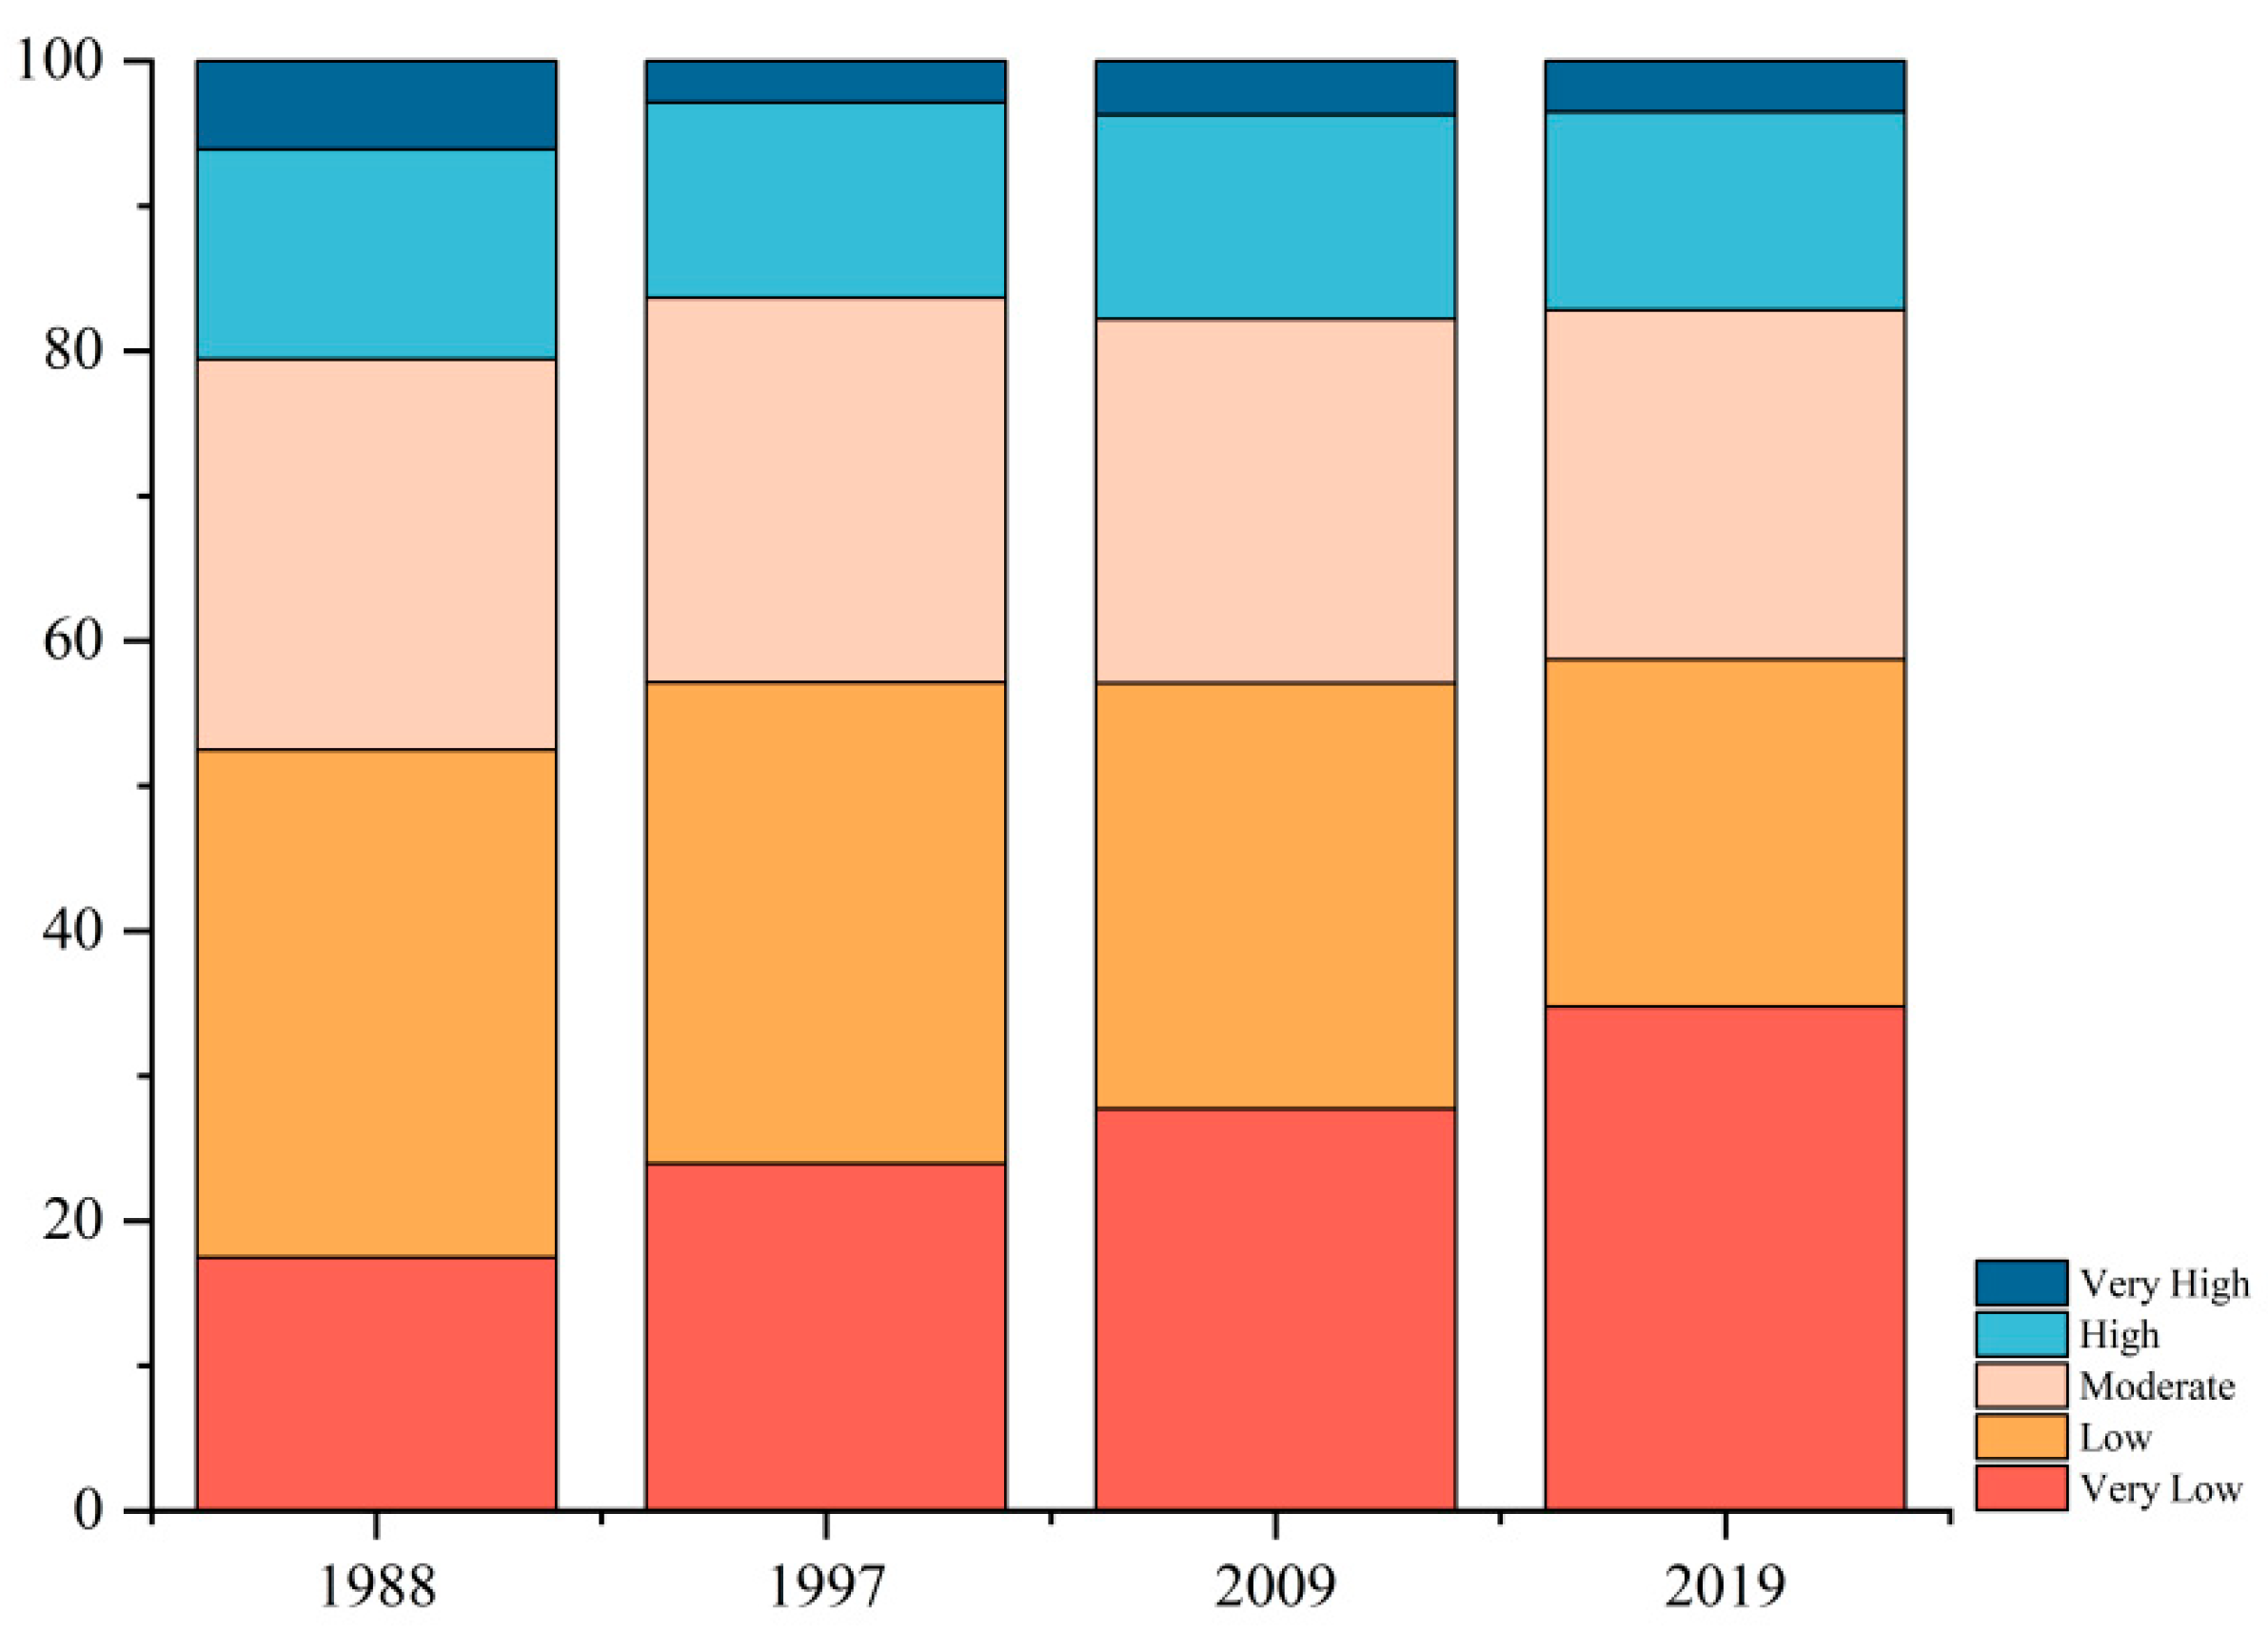
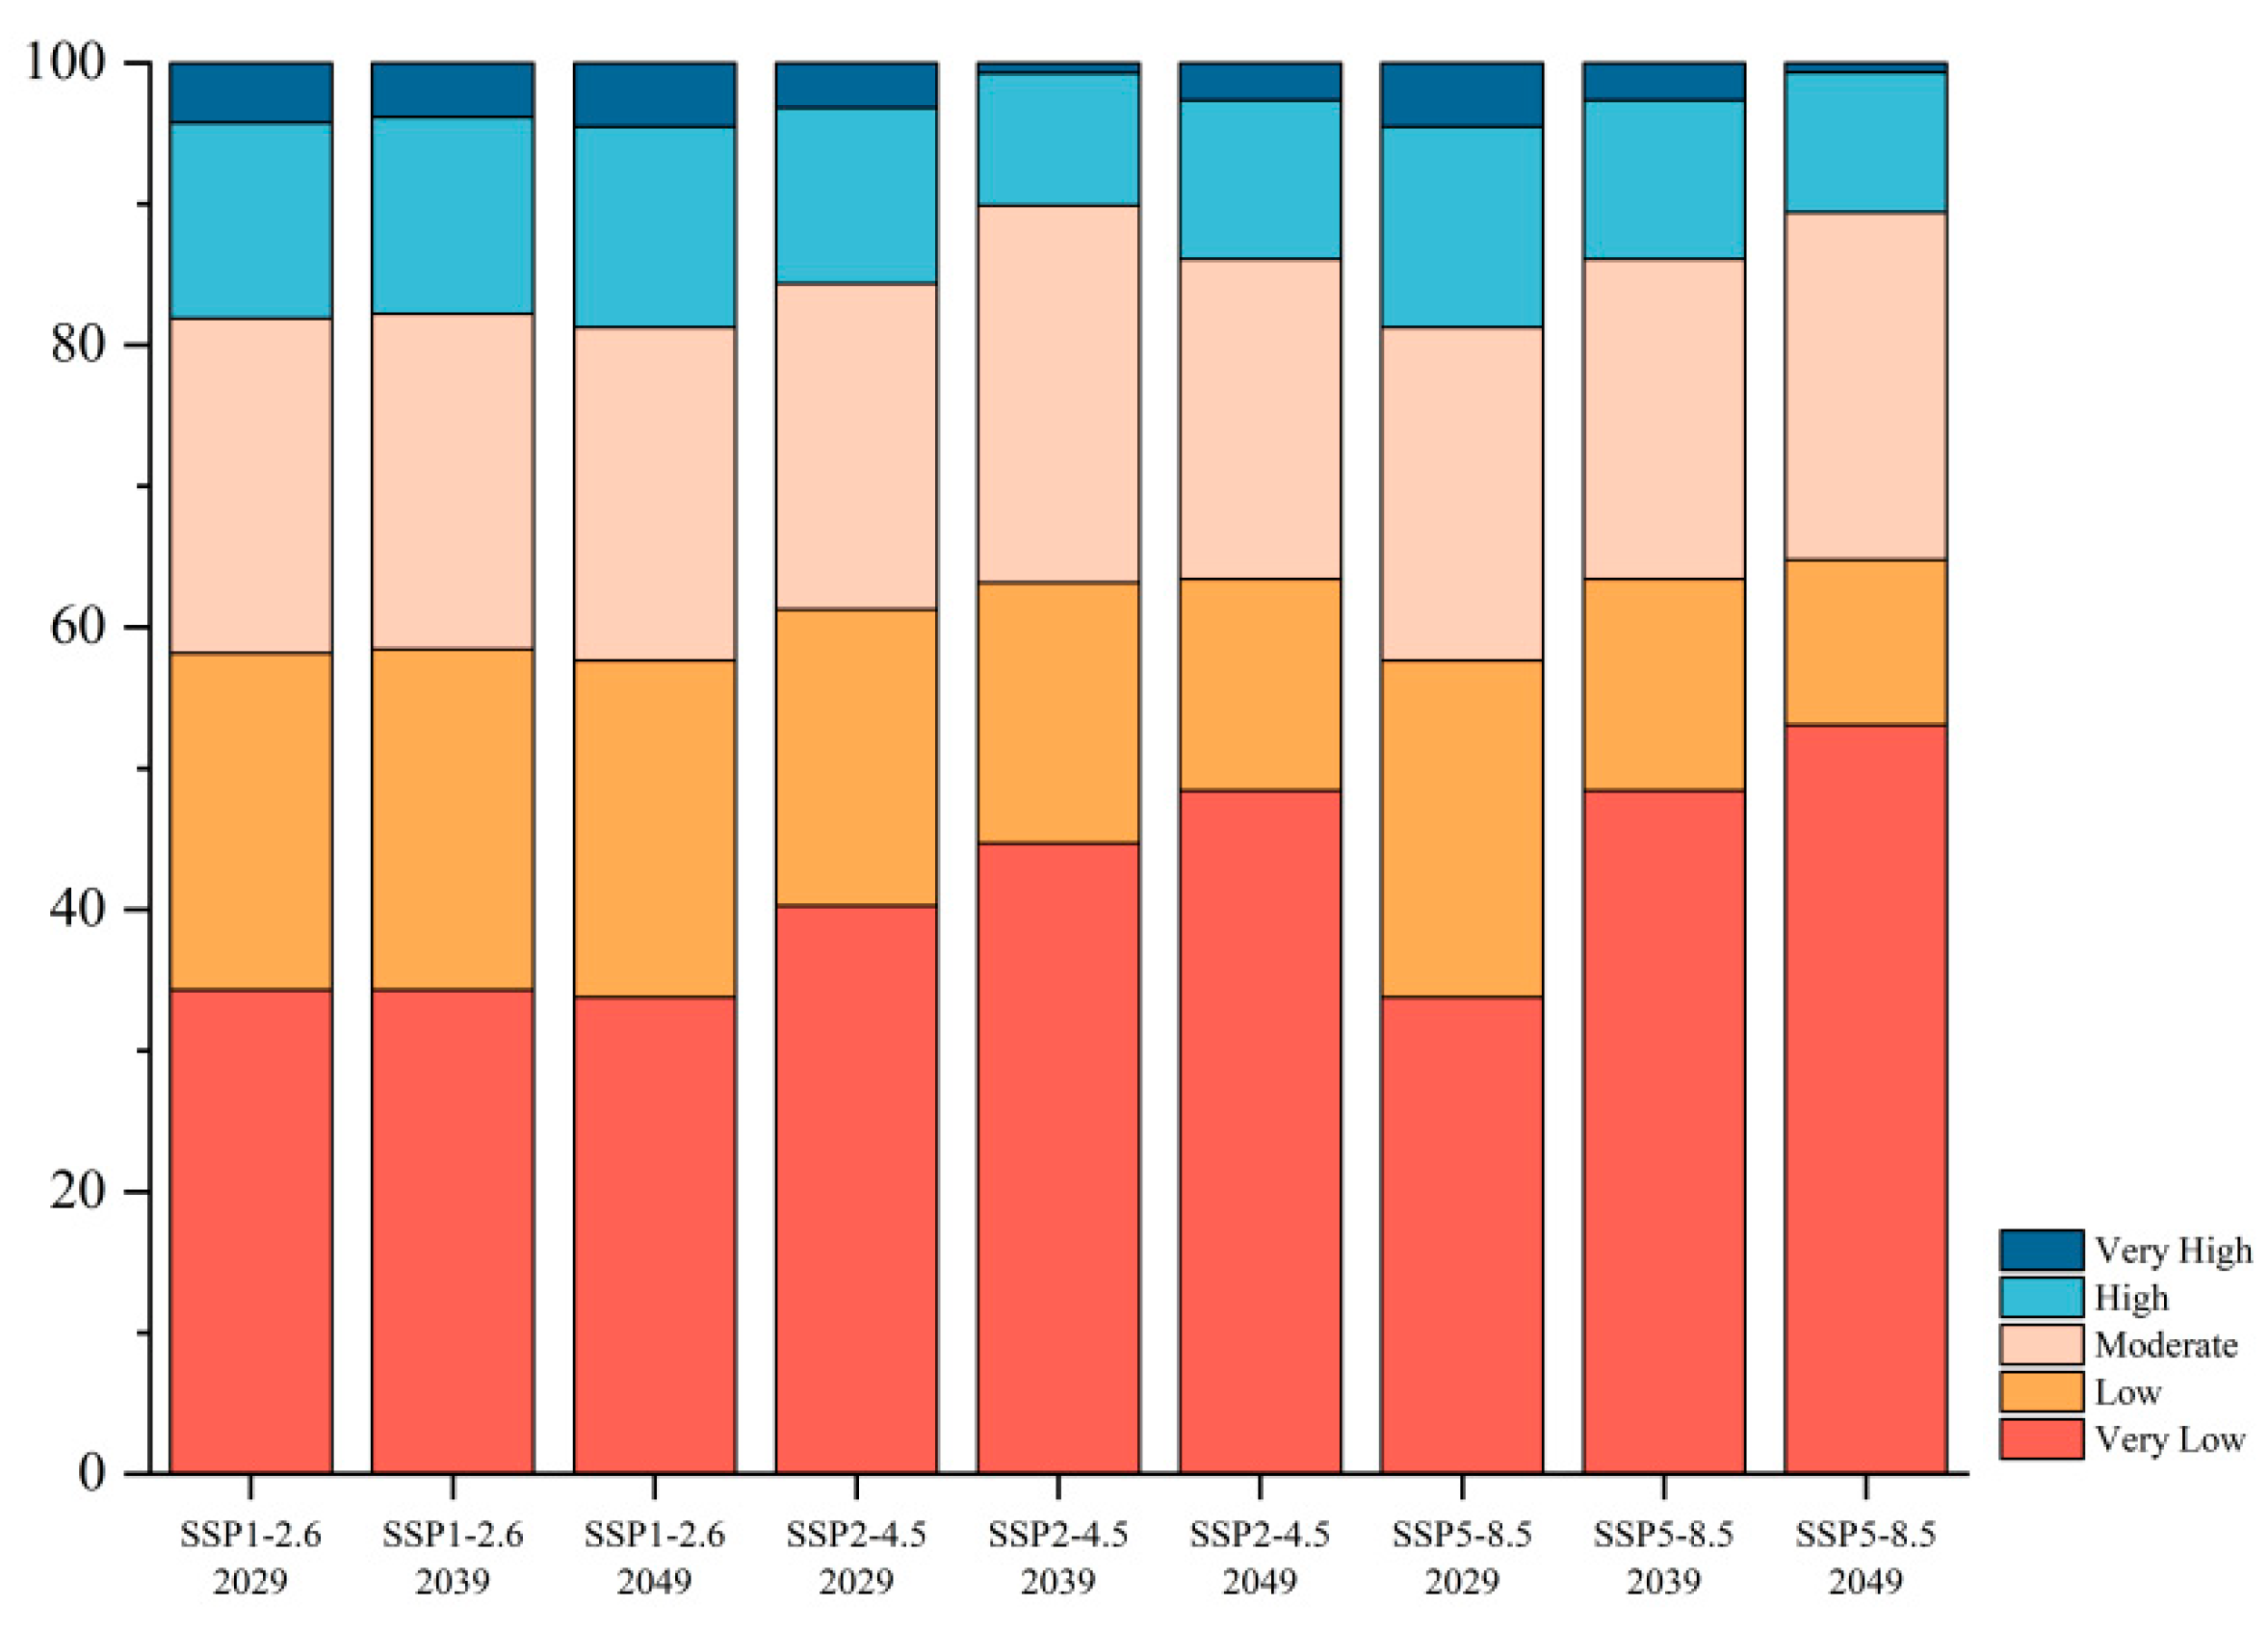
Regarding the classification pattern, zones with very low habitat quality showed continuous expansion, whereas those in higher quality categories contracted annually, indicating a steady decline in the overall land-use structure of Busan (Figure 9).

3.2.2. Simulated Habitat Quality Change Between 2029 and 2049

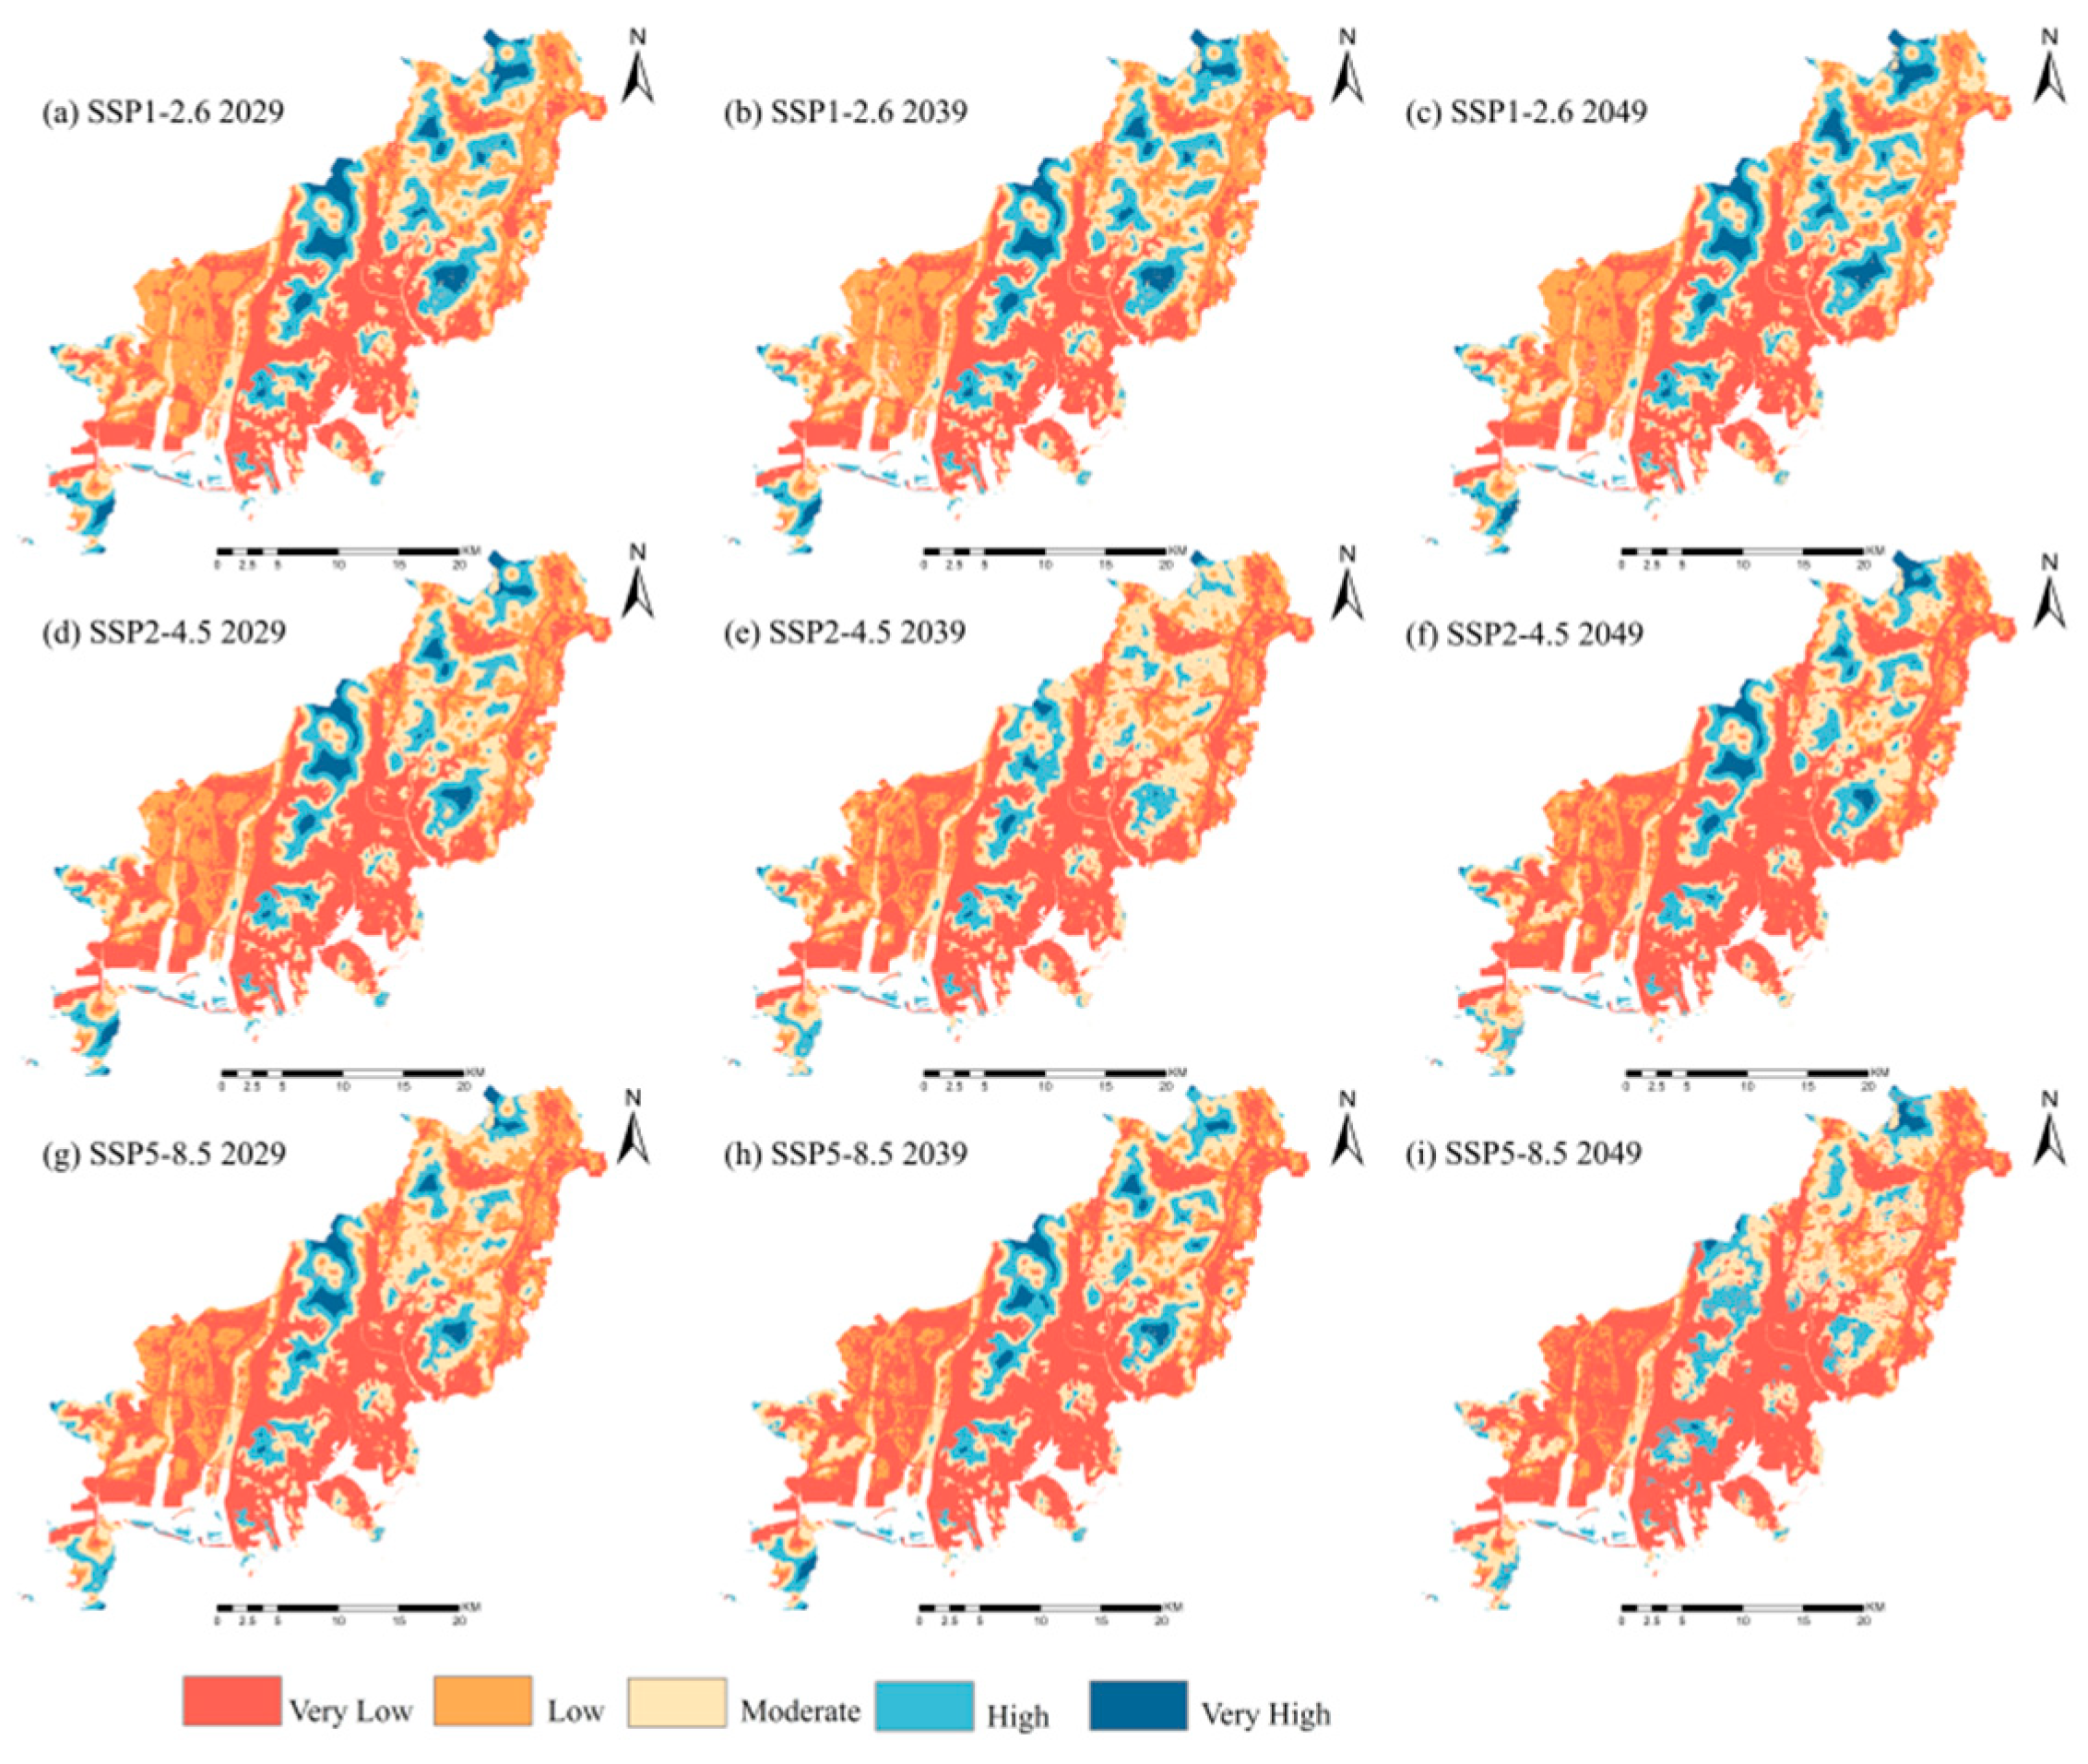
Figure 10 illustrates the spatial distribution of habitat quality under different scenarios. When examined together with Figure 8 and Figure 11, it is evident that the trends in both the mean habitat quality index and the proportional distribution of habitat quality grades differ markedly among scenarios. Under the SSP1-2.6 scenario, habitat quality improves significantly, with the mean index projected to reach 0.32841 by 2049—an increase of approximately 7.22% compared to 2019. This outcome indicates that Busan Metropolitan City retains considerable potential for ecological restoration, and adherence to this pathway would be beneficial for environmental sustainability. Under SSP2-4.5, the habitat quality index is anticipated to drop to 0.26158 by 2049. However, the slight increase from 0.26050 in 2039 suggests that, once urban development reaches a certain threshold, the ecological environment may experience modest recovery. In stark contrast, the SSP5-8.5 scenario is characterized by continuous deterioration, with the index falling to 0.23336 by 2049—a cumulative decline of approximately 26.06%, far exceeding the loss recorded over the past three decades. This trajectory would, therefore, pose a severe threat to the ecological and environmental security of Busan Metropolitan City.
In SSP2-4.5 and SSP5-8.5, areas classified as very low or low habitat quality are expected to expand further, while high- and very-high-quality areas show fluctuations, with an overall declining tendency. Notably, in the SSP5-8.5 scenario, the share of very high habitat quality areas is projected to drop to just 0.68% by 2049. Conversely, in the SSP1-2.6 scenario, although the overall habitat quality structure remains relatively stable, the improvements occur primarily in areas with high and very high habitat quality.

3.2.3. Spatial Analysis of Habitat Quality Change Areas

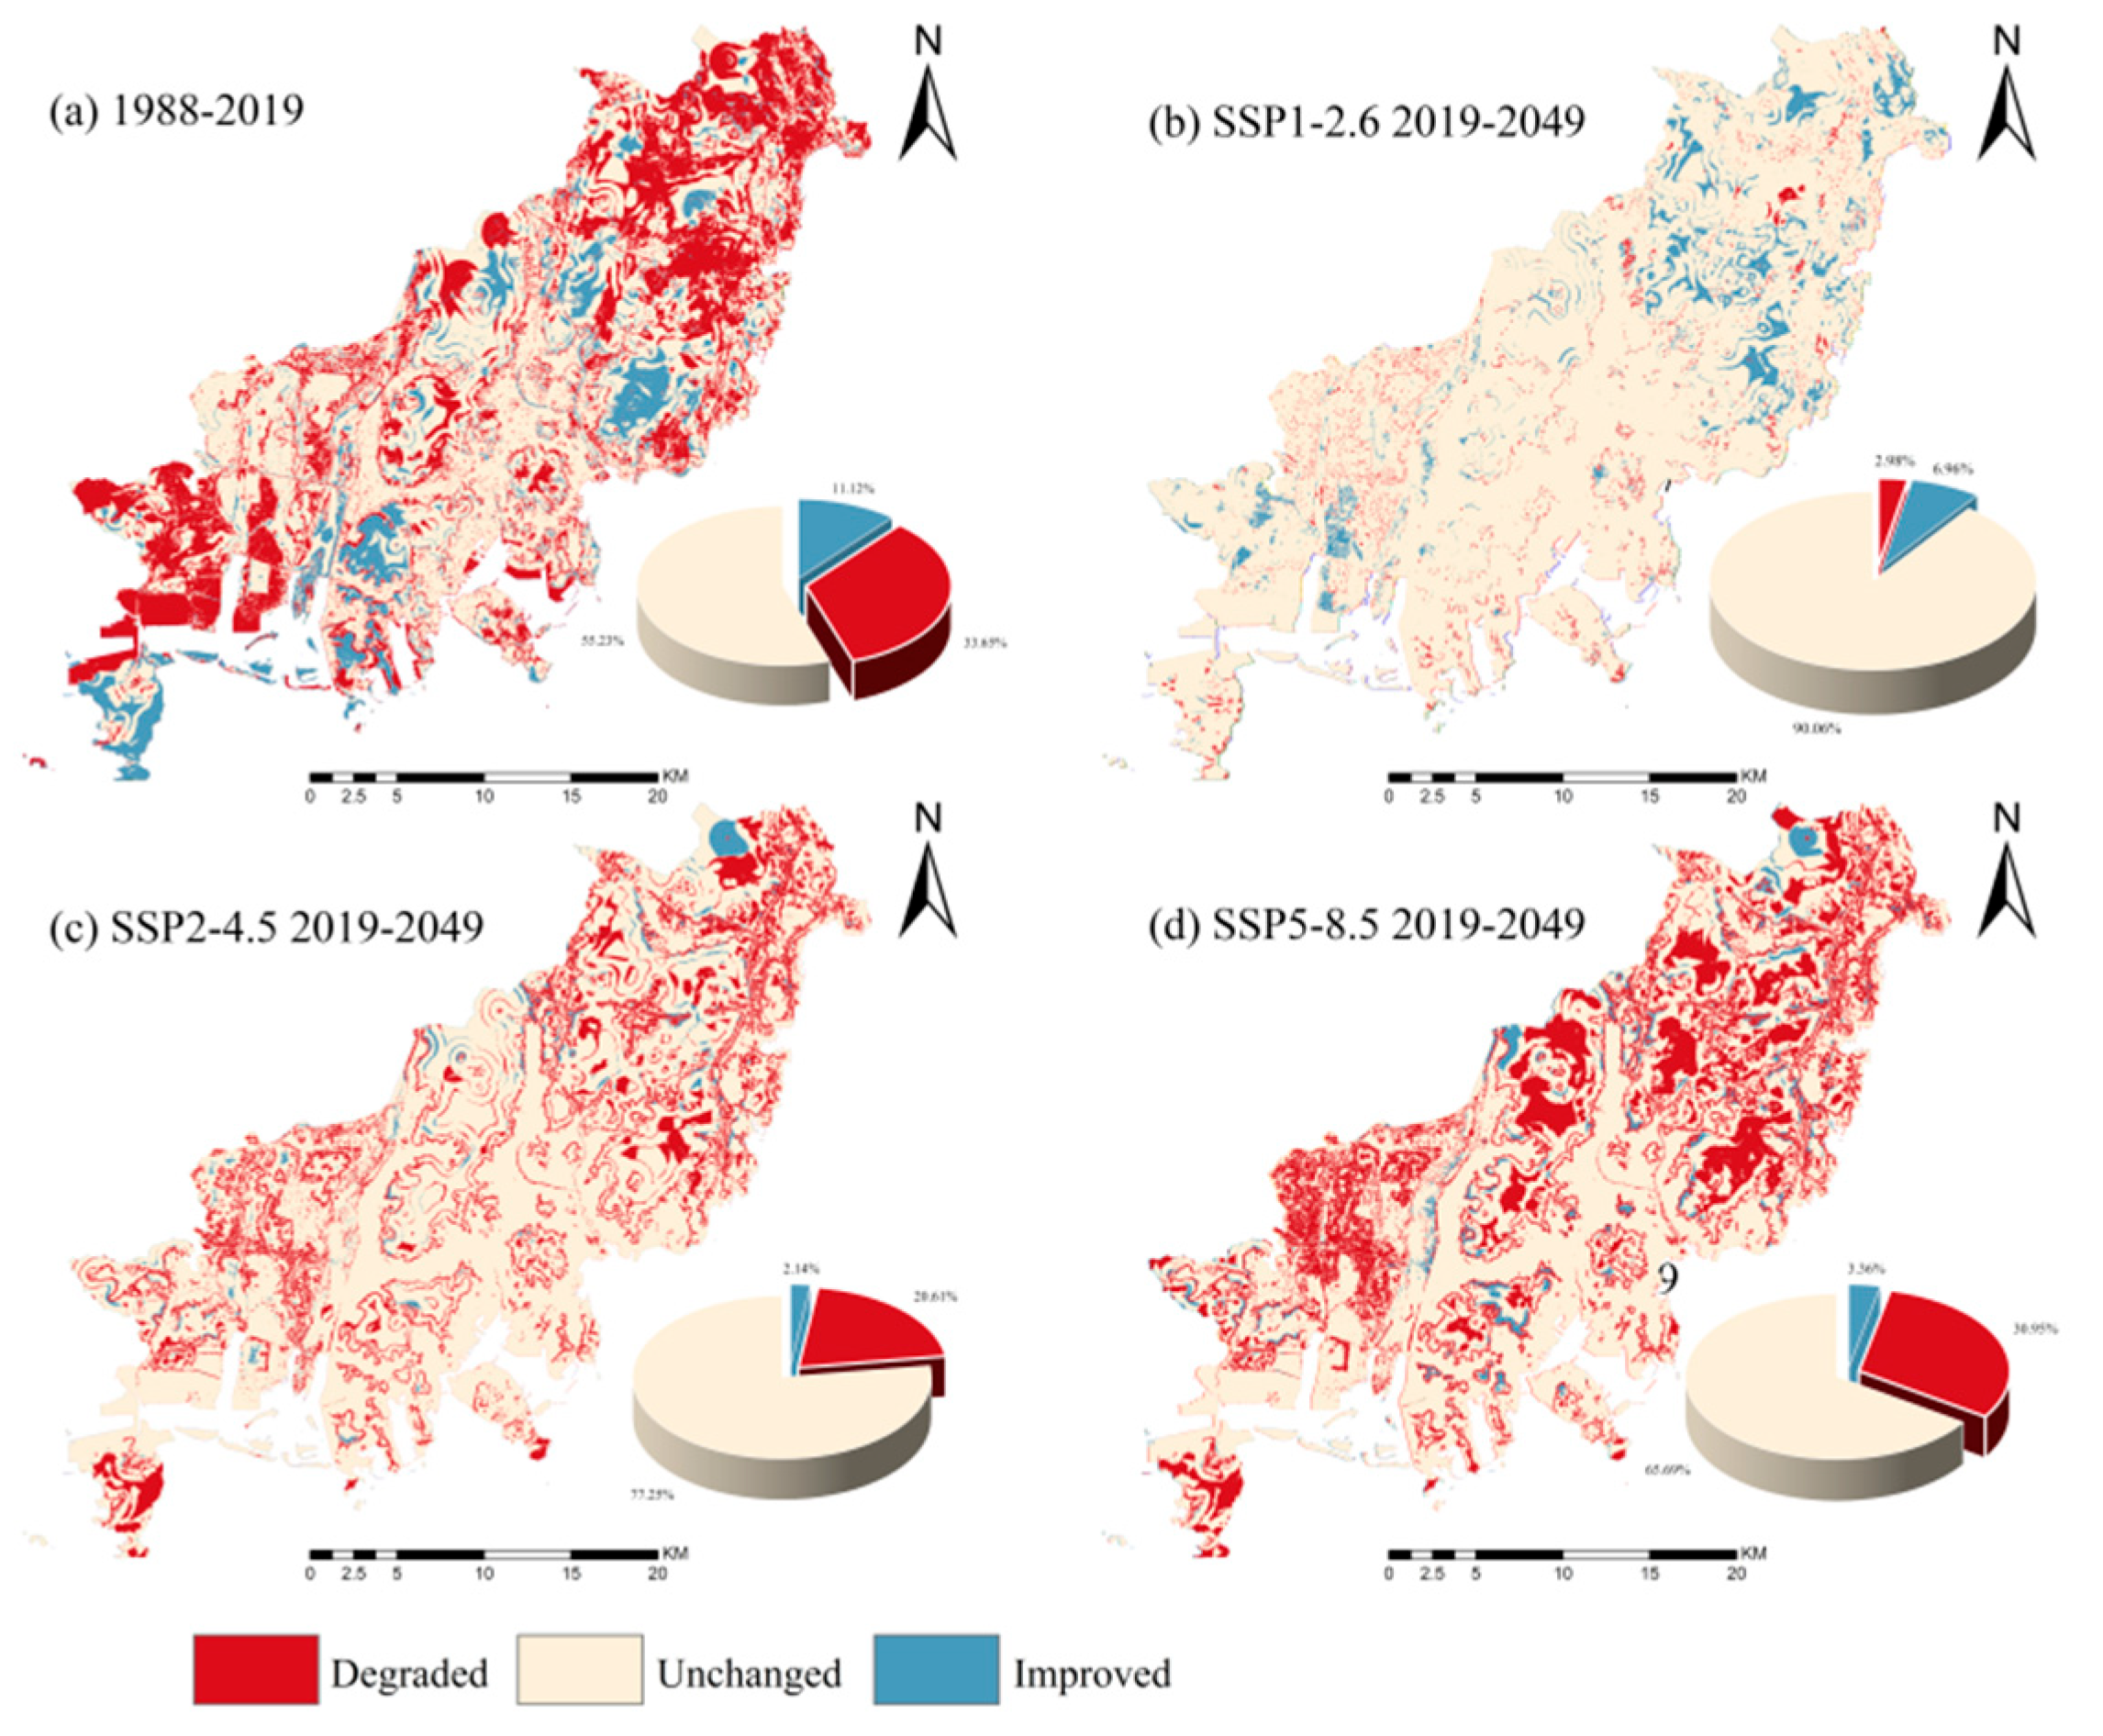
To further elucidate the spatial distribution of changes in the habitat quality index, a difference map was generated for both the historical period and the three future scenario settings (Figure 12). Between 1988 and 2019, notable improvements in habitat quality were concentrated in the southwestern islands, the Nakdong River Delta, and mountainous regions. Reductions were mainly concentrated in Busan’s western and northeastern areas. Land reclamation and urban expansion sharply reduced ecological land in these regions, leading to pronounced ecological degradation. Under the SSP1-2.6 scenario, most changes in habitat quality were positive, with declines primarily concentrated in central Gijang-gun. For SSP2-4.5, habitat degradation was concentrated along the city’s fringes, while notable improvements appeared in the mountainous areas north of Gijang-gun. In contrast, the SSP5-8.5 pathway showed a more severe degradation pattern, with large declines in the western, northern, and northeastern sectors of the region, in addition to the urban periphery. Positive changes were limited to outer edge zones and highland areas in northern Gijang-gun.

3.3. Analysis of Driving Factors of Spatial Heterogeneity in Habitat Quality

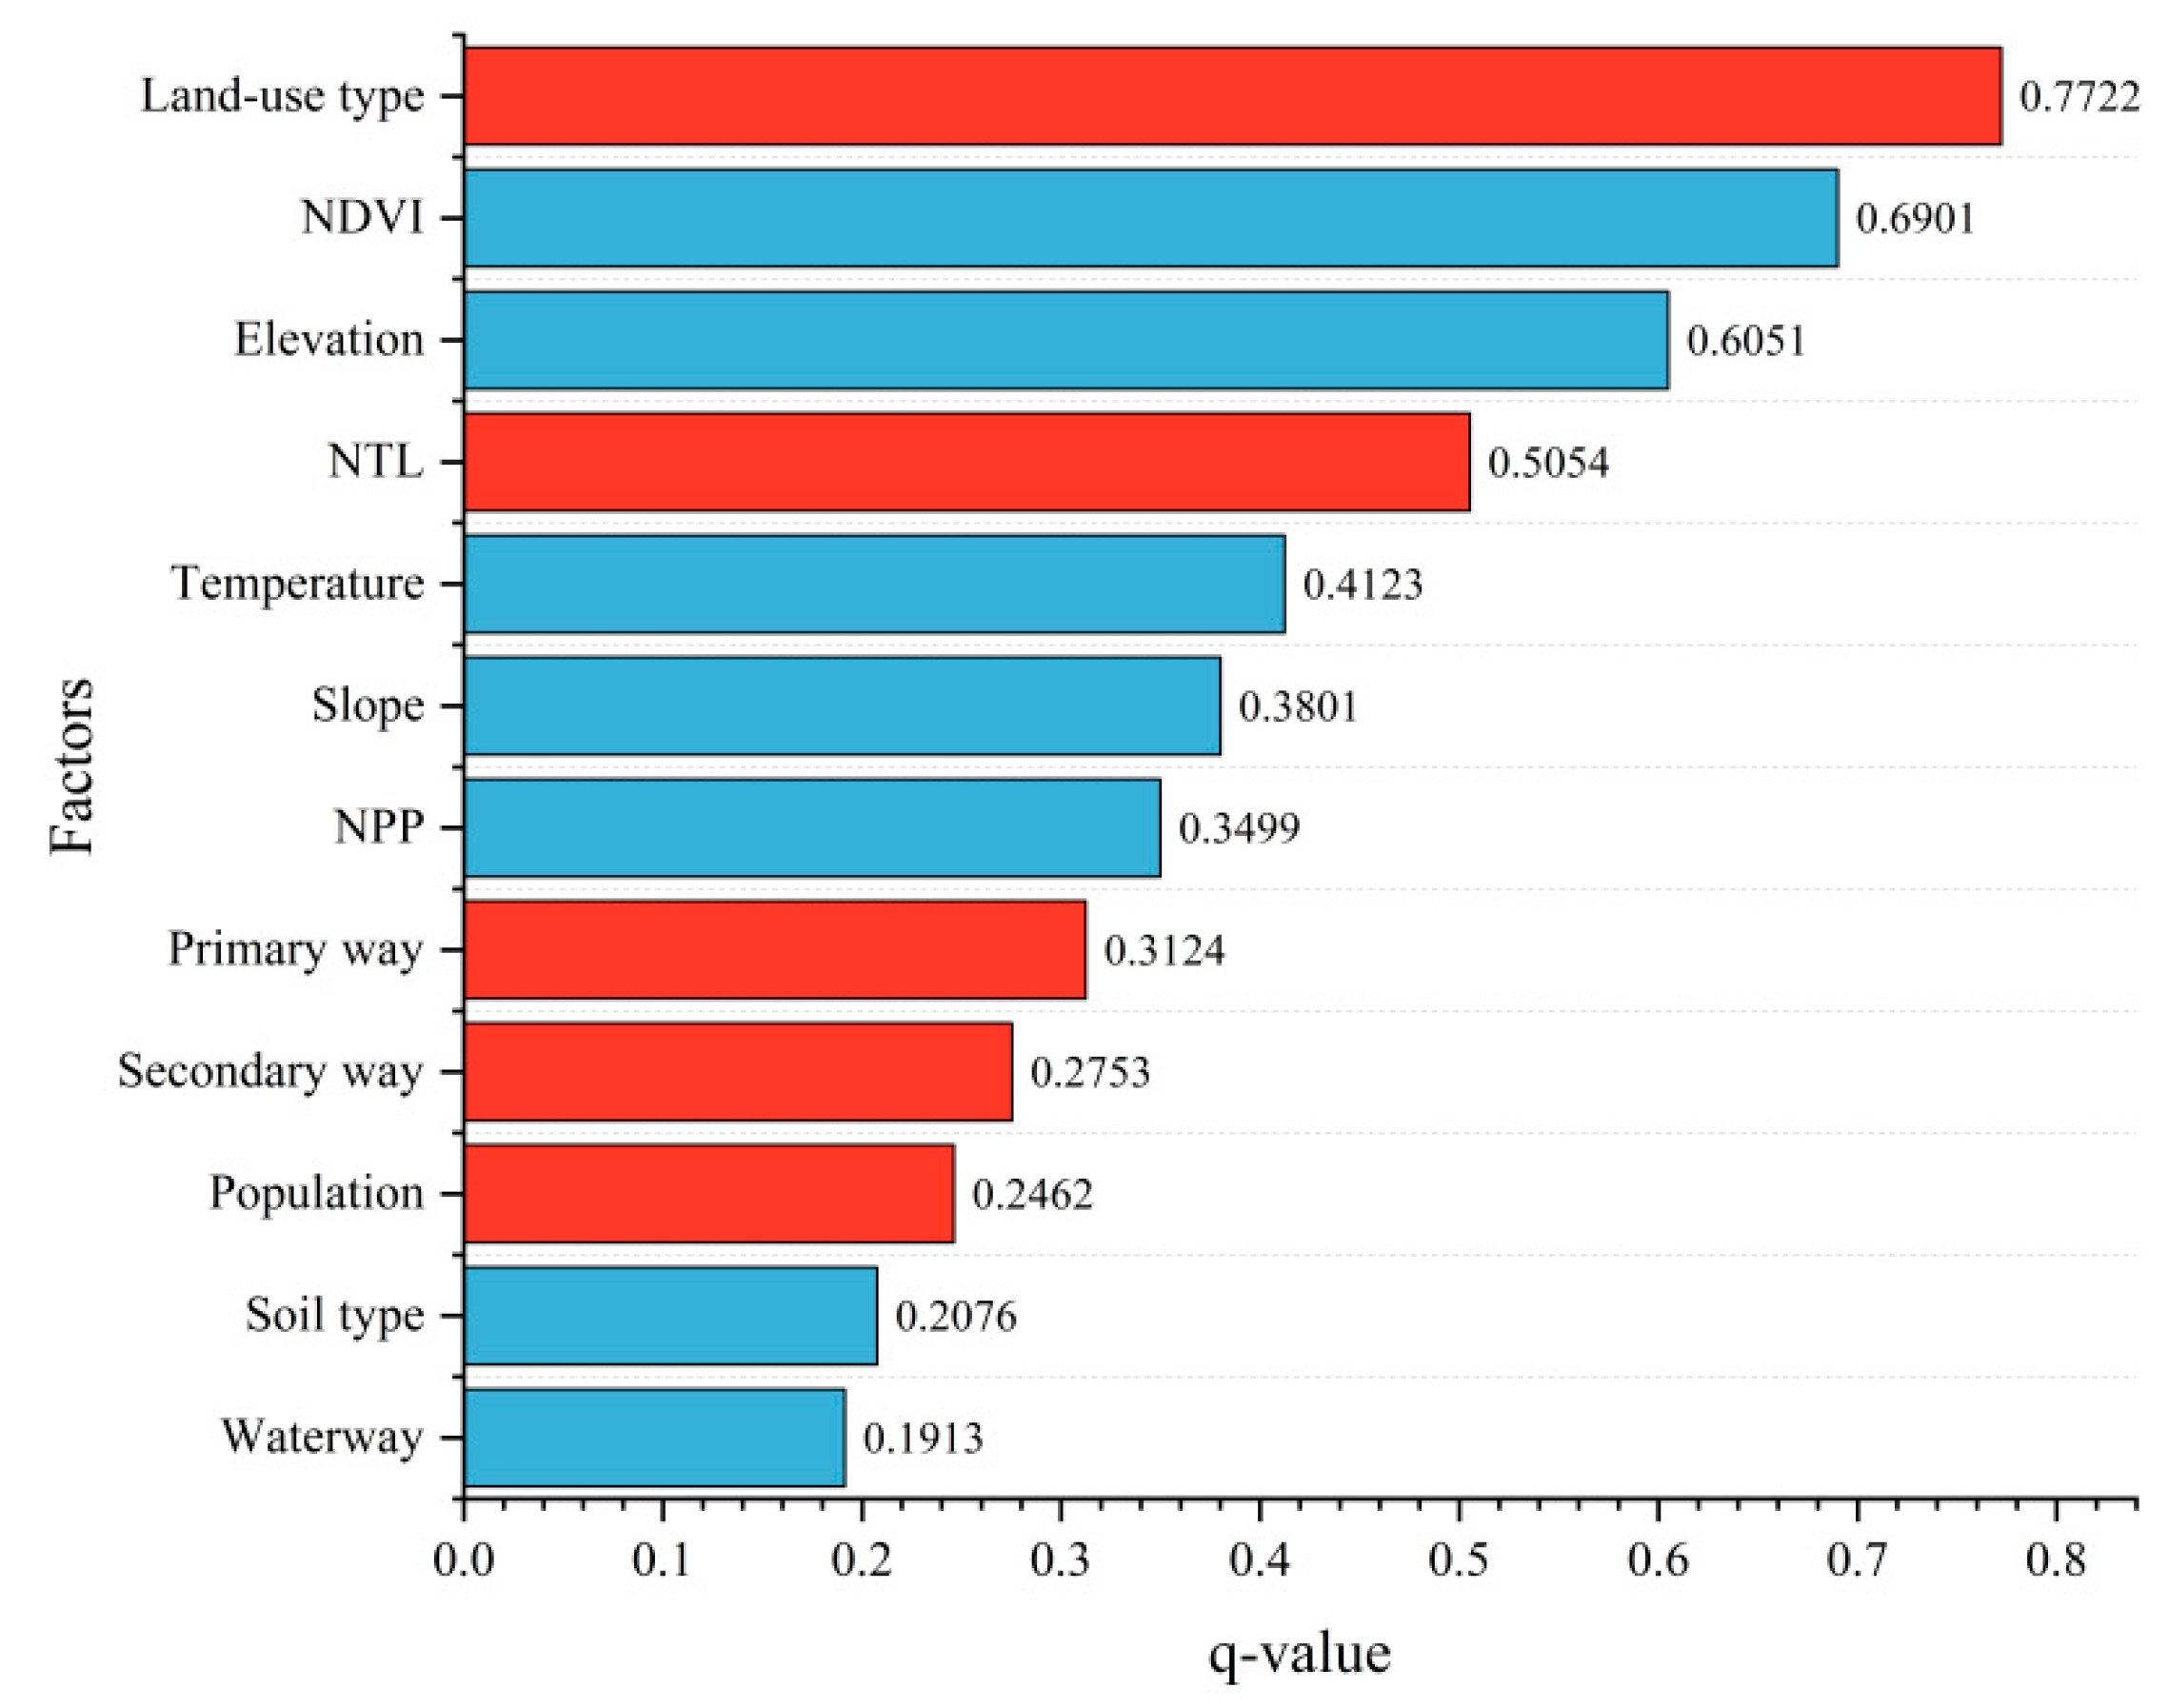
To examine the drivers of spatial heterogeneity in habitat quality, the GeoDetector model was employed to quantify the explanatory power of each factor for habitat quality in Busan Metropolitan City in 2019, as shown in Figure 13. The results from the factor detector indicate varying explanatory power among factors, with all passing the 0.001 significance threshold. Land-use type and NDVI showed the highest explanatory power, followed by elevation, night-time light index, mean annual temperature, and NPP. As a direct reflection of human activity intensity, land-use type underscores urban development as the dominant force shaping habitat quality. As a major topographic metric, elevation demonstrates the significant role of terrain in shaping habitat quality patterns in mountainous cities. Overall, combined biophysical and human-related factors drive the spatial differentiation of habitat quality.
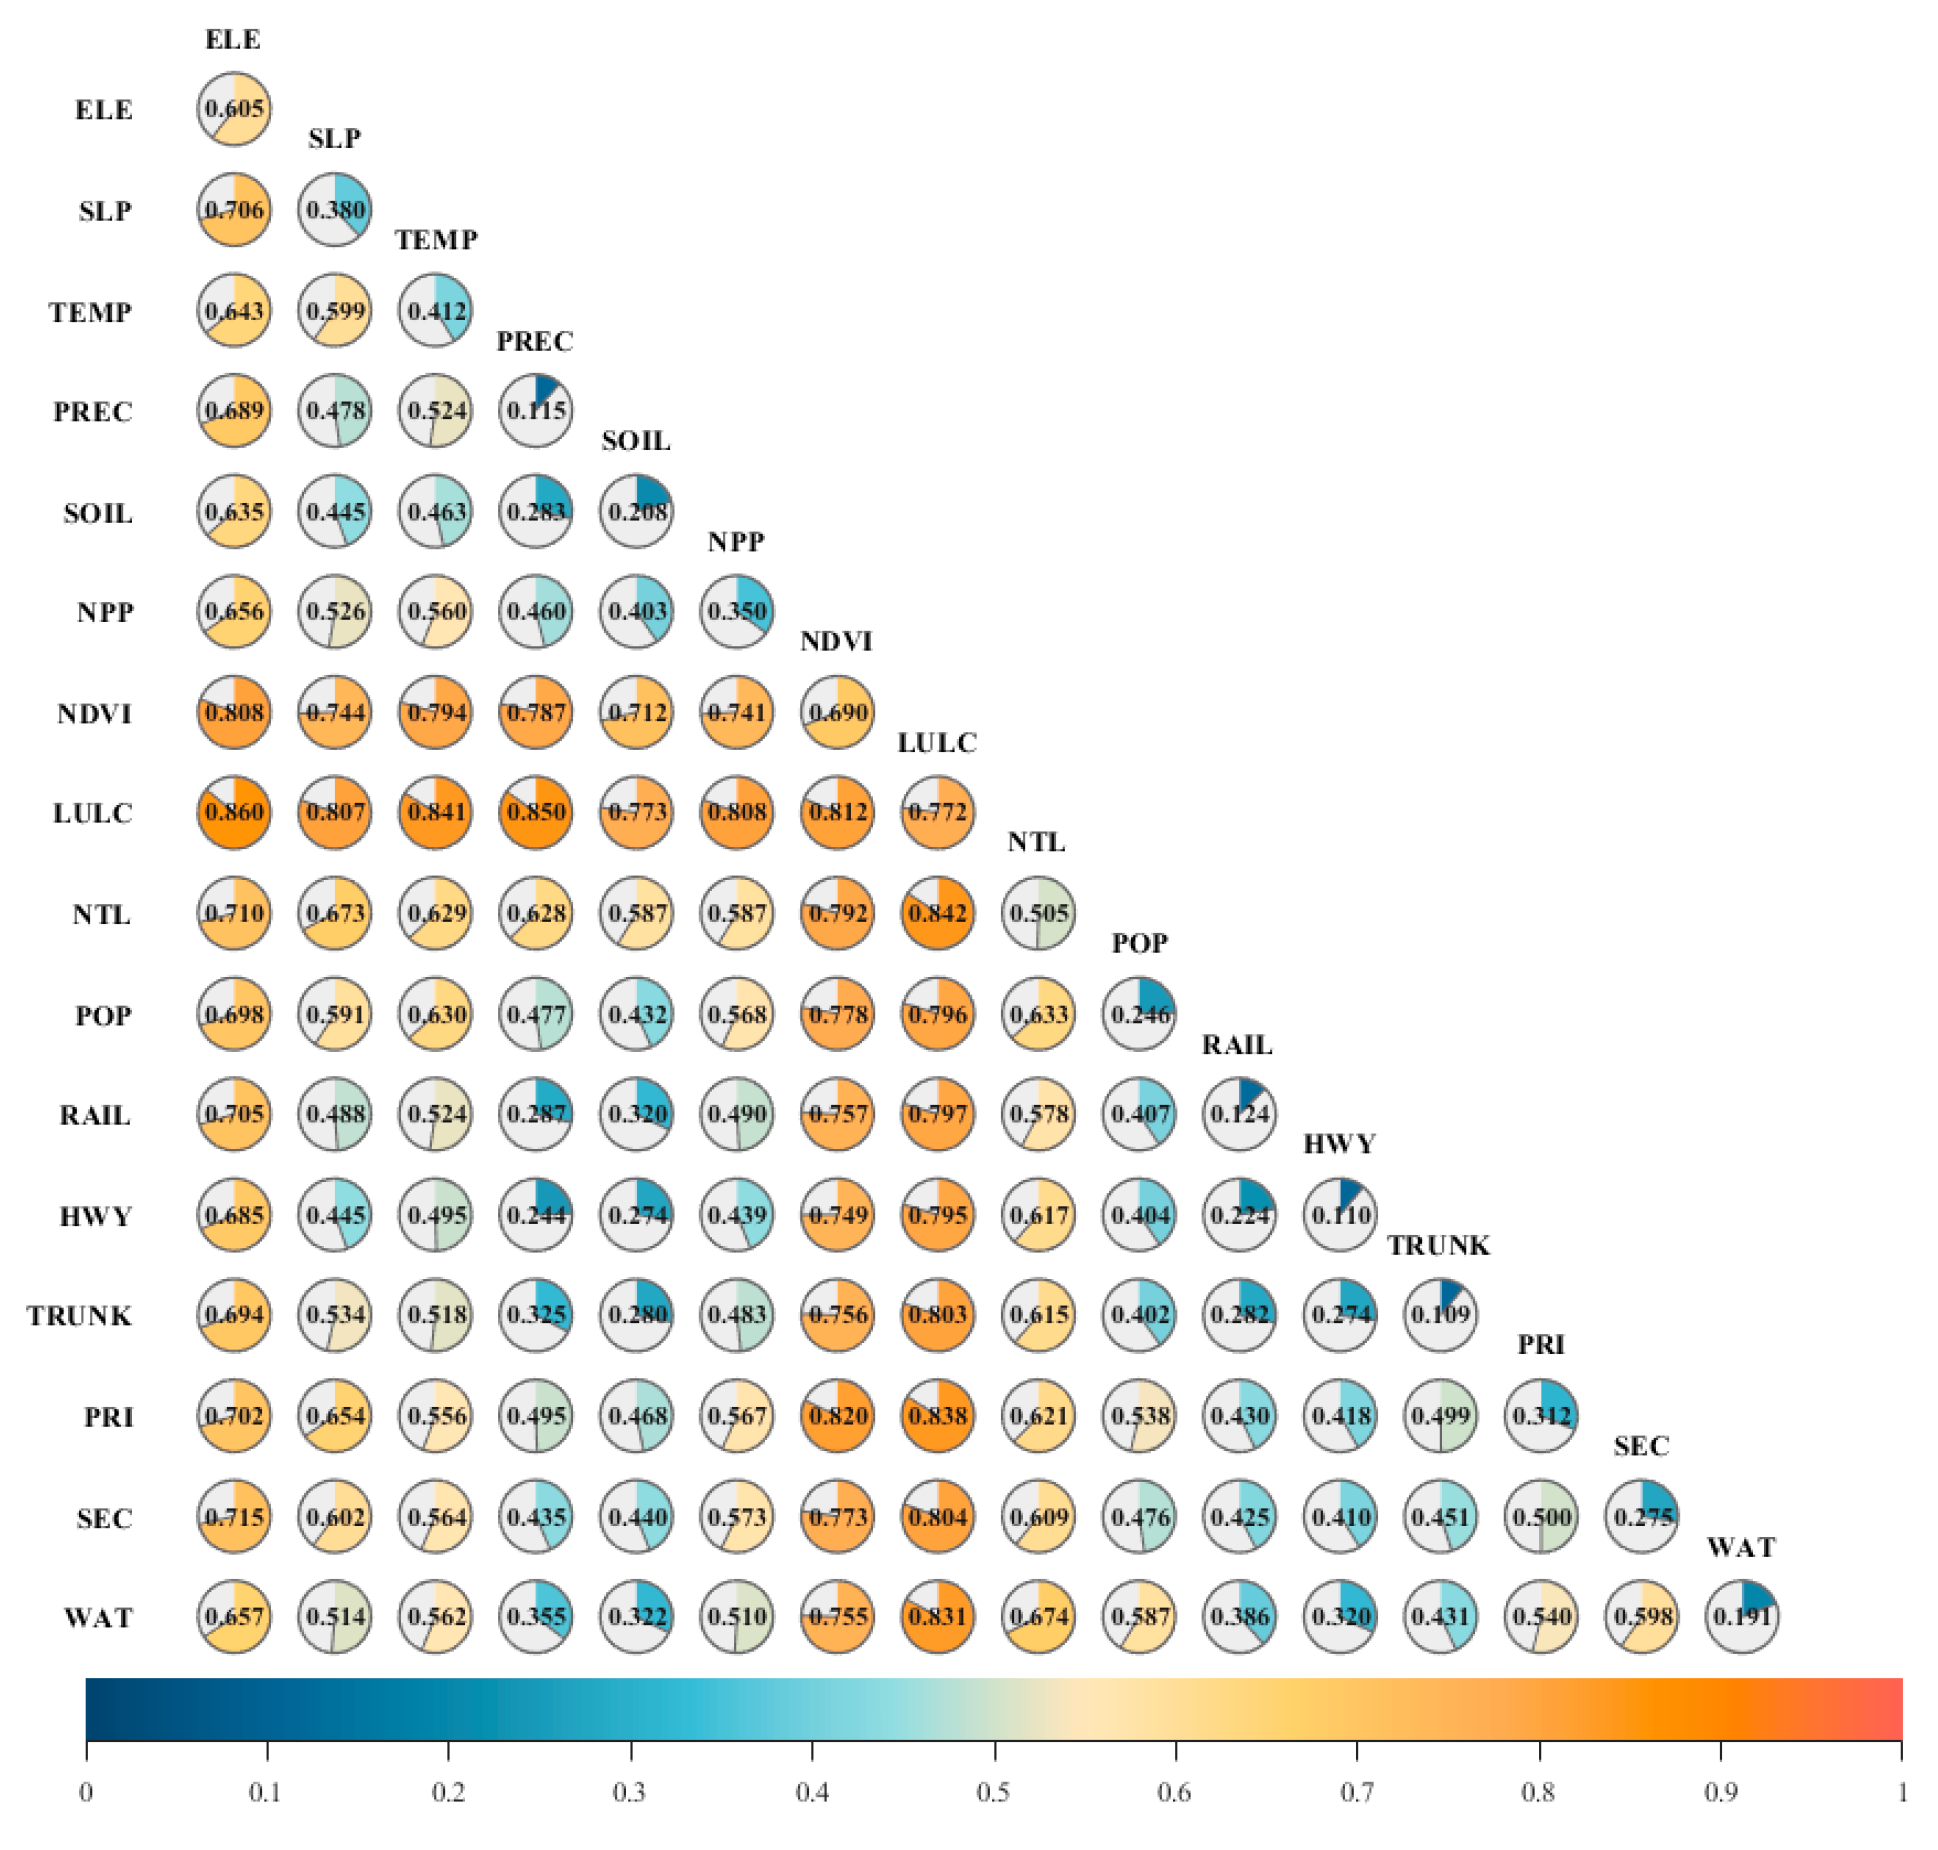
To further clarify factor interactions, the interaction detector was used (Figure 14). Among natural environmental factors, the combination of elevation and NDVI showed the strongest explanatory capacity, yielding a value of 0.808. Among socio-economic variables, the pairing of land-use type and NTL exhibited the most significant effect, with a value of 0.842. Across all factors, the strongest interaction occurred between land-use type and elevation, with an explanatory power of 0.860, highlighting the coupled effects of socio-economic and natural environmental drivers on the spatial pattern of habitat quality.

3.4. Model Accuracy Assessment

3.4.1. Collinearity Diagnostics of Driving Factors

The PLUS model has been widely applied in China, where it has demonstrated satisfactory performance in land-use prediction. However, this study represents its first application in South Korea. Given the cultural, planning, and environmental differences in the study area, we conducted a collinearity test on the driving factors using the Variance Inflation Factor (VIF) to assess their suitability and robustness. The results indicated that the VIF values for the natural environmental factors ranged from 1.357 to 3.017, while those for the socio-economic factors ranged from 1.312 to 3.581. All values were below the commonly accepted threshold of 5, suggesting that the selected variables did not exhibit significant multicollinearity and were, therefore, appropriate for simulating land-use change in the PLUS model (Table S6).

3.4.2. Contribution of the Driving Factors for Land-Use Change

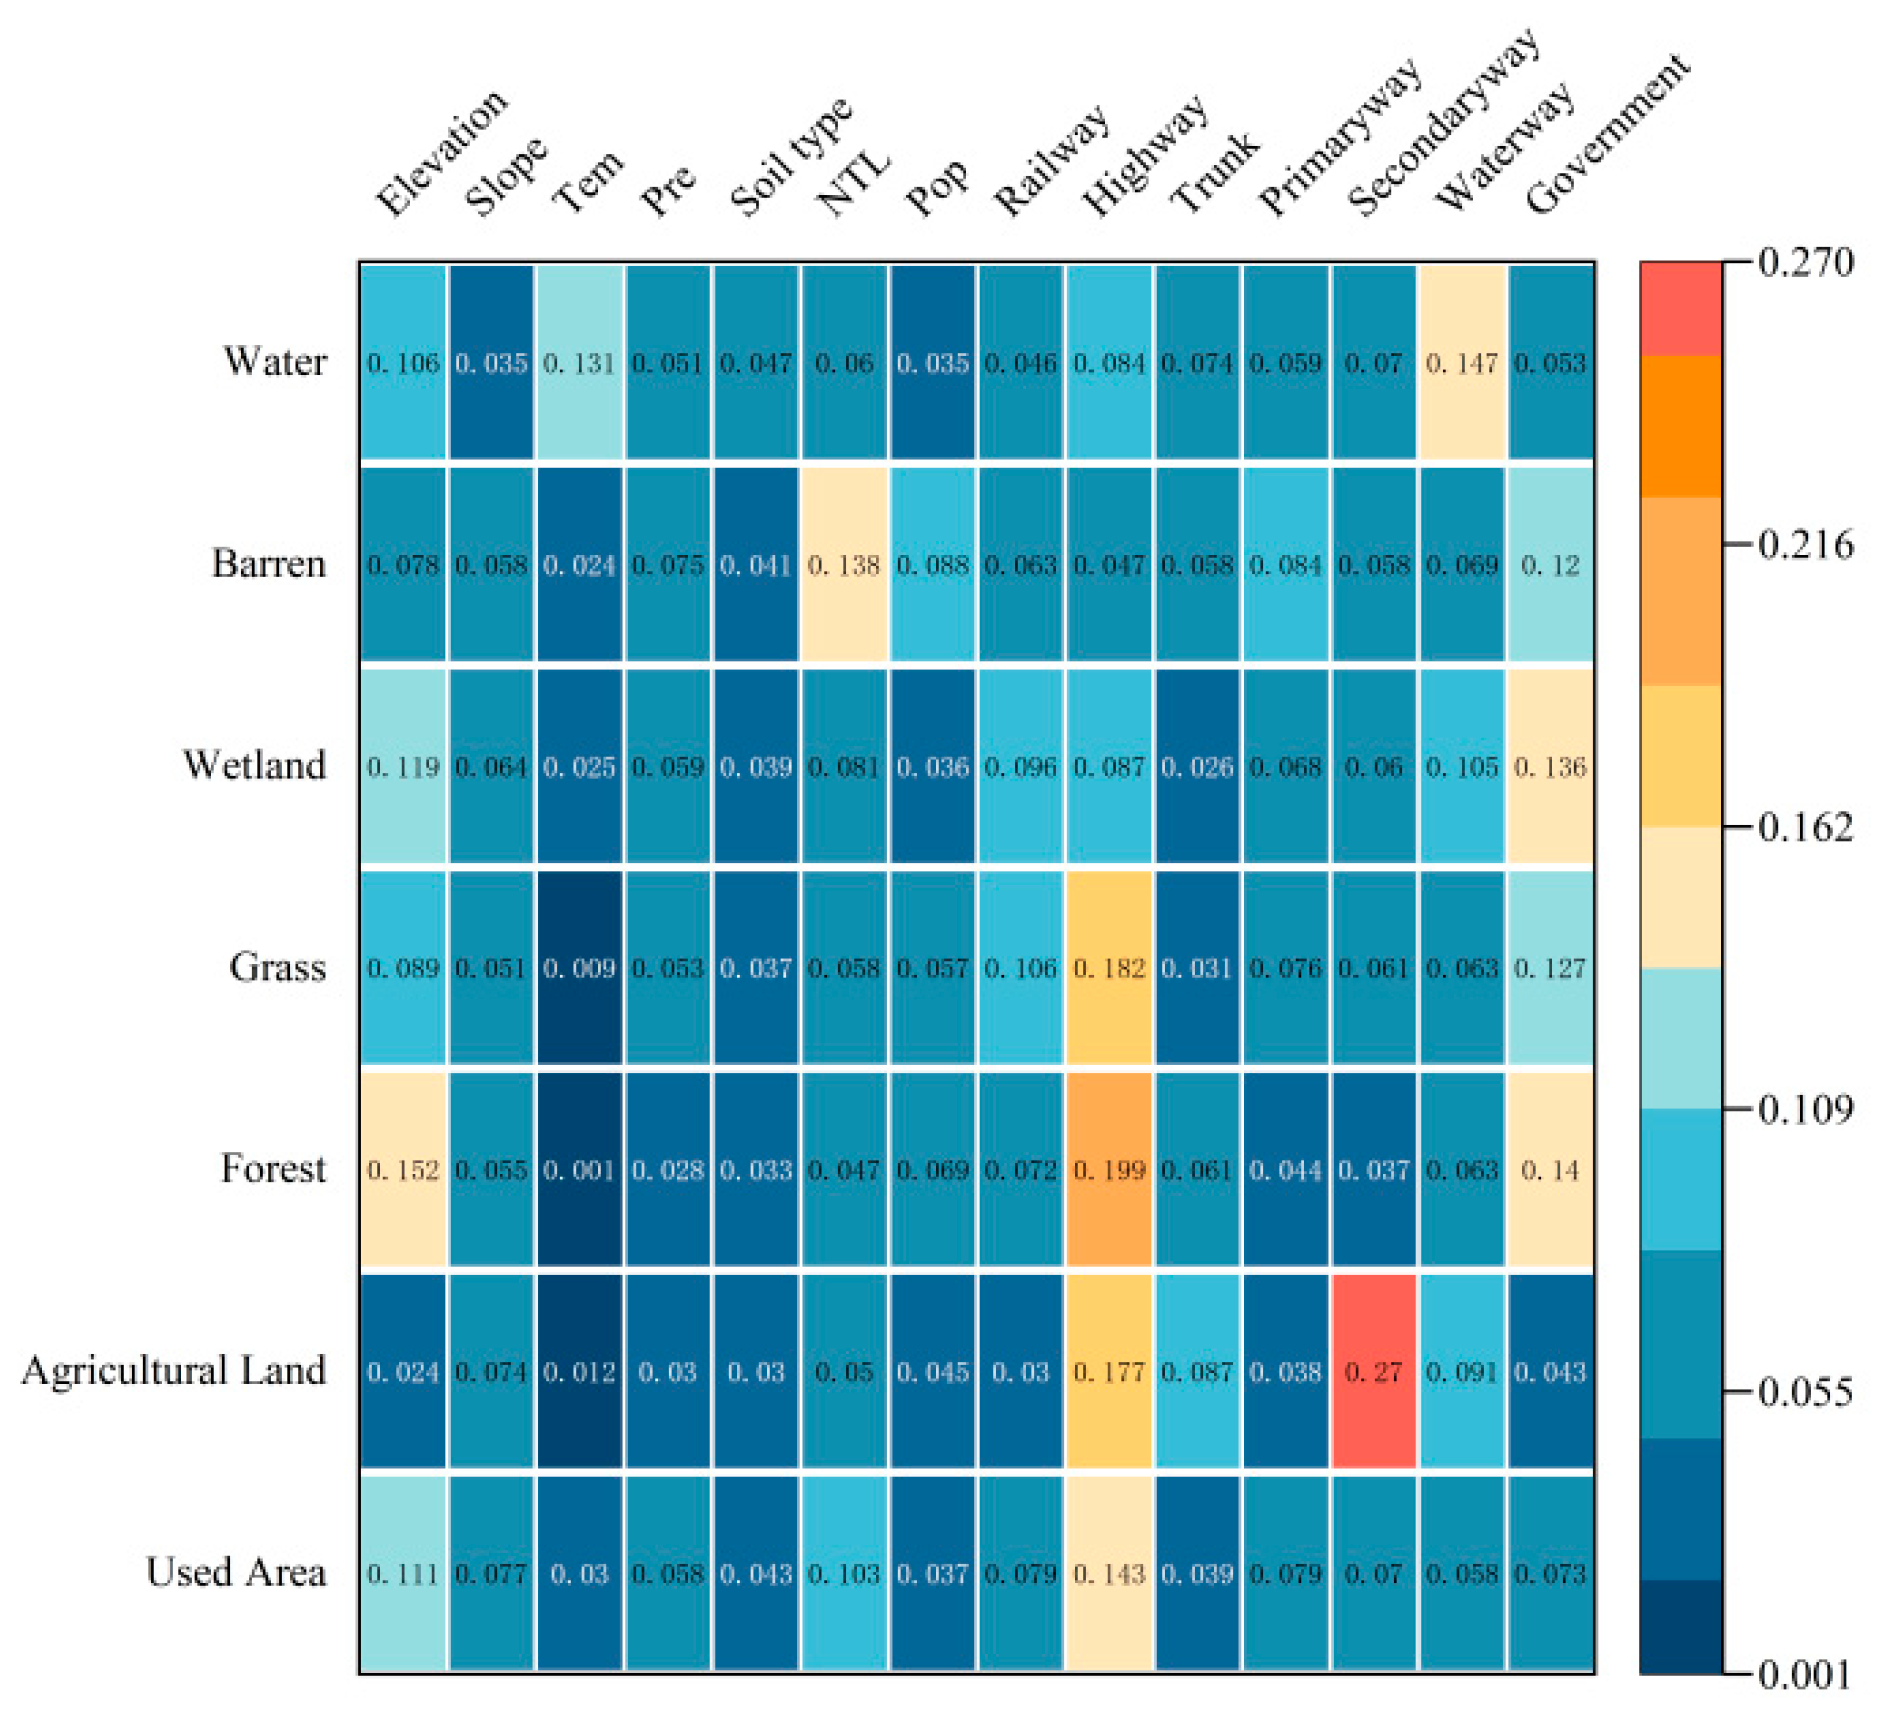
The contribution rates of different driving factors to the expansion of land-use types, derived from the LEAS module (Figure 15), reveal that road-related factors are the dominant drivers of expansion across multiple land categories. Specifically, proximity to expressways exerts the greatest influence on the expansion of construction land, forest, and grassland; proximity to secondary roads contributes most to agricultural land expansion; and proximity to government facilities has the strongest effect on wetland expansion. In addition, the night-time light index is the most influential factor for barren land expansion, while proximity to waterways is most important for the expansion of water bodies. In contrast, natural factors such as slope, precipitation, and others show relatively low contributions, suggesting that human activities and transportation networks are the dominant drivers of land-use change in the study area.

3.4.3. Accuracy Assessment of Habitat Quality

The InVEST model’s habitat quality assessment primarily relies on parameters such as threat source weights, influence ranges, and habitat suitability. Although this study consulted extensive literature and calibrated parameters accordingly, the reliability of the assessment results still warranted verification. Therefore, the Environmental Conservation Value Assessment Map (ECVAM) issued by the Ministry of Environment was employed as an external benchmark, and Spearman correlation analysis together with bivariate spatial autocorrelation analysis was conducted for validation. The ECVAM integrates national ecological, residential, and socio-environmental elements, classifying the territory into five levels: Level 1 denotes legally protected priority conservation zones with exceptional natural attributes; Level 2 comprises ecologically valuable areas of high conservation priority; Level 3 functions as ecological buffer zones where conditional development is allowed; Level 4 permits environmentally friendly development based on rigorous environmental carrying capacity assessments; and Level 5 represents already developed areas.
The analysis produced a Spearman correlation coefficient of ρ = 0.747, indicating a strong and significant positive association between the ECVAM and the habitat quality index (Figure S2). The bivariate Moran’s I statistic was 0.718 (Figure S3), also revealing significant positive spatial autocorrelation. The LISA cluster map further showed that high-grade national land areas coincided with high habitat quality (high–high clusters), whereas low-grade areas coincided with low habitat quality (low–low clusters) (Figure S4). These results demonstrate that the habitat quality estimated by the InVEST model closely matches the official ECVAM. This supports the reliability of the assessment and highlights its value for urban planning and ecological policymaking.

3.4.4. Optimal-Parameter Geodetector

Although the GeoDetector model has been widely applied in studies of driving factor analysis, it functions by discretizing variables to conduct variance-based analyses, thereby effectively avoiding multicollinearity among factors. However, manual parameter settings for discretization may introduce subjective bias, and the results are sensitive to both the discretization method and the number of strata. To mitigate subjective bias, this study adopted the scale–zoning optimization approach of the Optimal-Parameter GeoDetector (OPGD) proposed by Zhao X and implemented the analyses using the OPGD package in R [64,65].
Given that all factors in this study are spatial datasets, variations in spatial sampling scale may also affect the results. Therefore, data sampling scales were set at 100 m, 500 m, 1 km, and 2 km and discretized under multiple stratification schemes. The optimal scheme was determined by comparing their 90th percentile q-statistics, with the results indicating that explanatory power was highest at the 2 km scale. This approach reduced subjective bias in spatial data sampling and discretization, thereby improving the robustness and scientific validity of the driving factor analysis (Figures S5 and S6).

4. Discussion

4.1. Relationship Between Habitat Quality and Land-Use Change

Changes in habitat quality are closely associated with alterations in land-use patterns, which, in turn, are influenced by urban development plans and policies. Therefore, any examination of changes in habitat quality should take into account shifts in land-use structure. Between 1988 and 2019, Busan Metropolitan City experienced a substantial decline in agricultural land, gradually forming a land-use spatial pattern dominated by forest and built-up land. This evolutionary trend is not only linked to the city’s growing political influence and economic vitality but also to a series of land development policies and major projects. Notable examples include the construction of the Jang-an Industrial Complex, the development of residential–commercial complexes in Haeundae and Centum City, the expansion of Busan Port, and various urban infrastructure projects, all of which directly facilitated the conversion of ecological land types such as farmland, forest, and water into built-up land. In this process, barren land often served as a transitional category, with changes occurring in a non-continuous manner. This phenomenon is not unique to Busan, as it is also prevalent in other regions of South Korea and worldwide, indicating that the expansion of built-up land is one of the primary drivers of farmland and forest loss [66,67,68,69,70].
Meanwhile, habitat quality in Busan Metropolitan City has shown a gradual deterioration during the process of urban development. Studies indicate that the mean habitat quality in Busan has declined by 18.23%, reflecting the significant ecological pressure resulting from urban expansion and limited land resources. Spatially, the habitat quality pattern exhibits a degradation gradient from mountainous areas to plains and from inland regions to coastal zones. Areas of pronounced degradation are mainly concentrated in the central urban districts and along major transportation corridors, particularly in regions that have undergone intensive development.
The most severely degraded areas are concentrated in Gangseo District, Haeundae District, and Gijang County, where large-scale infrastructure and real estate development activities are prevalent. This is attributable to large-scale land reclamation in southern Gangseo District, driven by the Busan Port expansion project, which has resulted in damage to marine and estuarine ecosystems and a marked decline in habitat quality. The 4th Basic Port Plan also proposes further port construction in this area, which, while enhancing regional logistics capacity, will likely exacerbate ecosystem degradation. By 2019, the northern waters of Gadeokdo had been transformed into barren land, becoming a key hotspot of habitat degradation. Similarly, the Nakdong River estuary has experienced substantial habitat degradation due to the construction of the Busan Ecocity, where extensive conversion of agricultural land into barren land and built-up areas has disrupted landscape connectivity and habitat integrity. According to Busan Metropolitan City Ordinance No. 2005-324, the northeastern part of Gijang County has been under construction for the Jang-an Industrial Complex since 2005, along with numerous supporting facilities, forming an industrial cluster together with the Ulsan Mipo National Industrial Complex. Consequently, agricultural land has been converted into built-up land, while industrial development has further exacerbated water and air pollution, undermining ecosystem stability. In Haeundae District, designated as a key area for tourism and business functions, the construction of transportation and commercial facilities has led to the conversion of large areas of farmland and forest into built-up land, resulting in gradual habitat degradation. In addition, inappropriate conversions among ecological land types have contributed to this decline; for instance, substantial areas of forest in Haeundae have been converted into golf courses, undermining the original ecological foundation and further reducing habitat quality.
These patterns of habitat quality degradation are consistent with the findings of related studies, indicating that road construction can lead to landscape fragmentation and reduce habitat connectivity, while the development of industry and tourism alters the original land-use patterns, thereby causing habitat quality degradation [31,71]. In addition, inappropriate conversions among ecological land types can also result in habitat quality degradation [72].

4.2. Scenario-Based Strategic Choices for Busan

Previous studies have generally recognized that the SSP1-2.6 scenario provides significant benefits for ecological restoration [73,74]. In line with the findings of this study, under this scenario, grassland, forest, and wetland areas show varying degrees of recovery, whereas built-up land exhibits only a slight increase. Benefiting from this ecologically oriented development pathway, the mean habitat quality in the study area reaches 0.32841, the highest among the three future scenarios, and shows a gradual upward trend compared with that in 2019. This indicates that, under a context of ecological prioritization and constrained urban expansion, the trend of ecological degradation has been markedly suppressed.
However, for a coastal city like Busan, where land resources are scarce and economic development is rapid, the ecological protection pathway under the SSP1-2.6 scenario also reveals certain limitations. Evidence from related studies in Chongqing, another predominantly mountainous city, suggests that an excessive emphasis on ecological prioritization may constrain normal urban development and hinder industrial upgrading as well as economic vitality [75]. Simulation data indicate that, over the 30 years from 2019, built-up land will increase by only 838.8 ha, with an annual growth rate of merely 0.12%, far below the historical level, and is unlikely to meet the demands of future urban development.
In contrast, under SSP5-8.5, both the economy and the city footprint expanded, with built-up land increasing at an annual rate of 2.17%; its development model relies on large-scale and intensive land development and fossil fuel consumption. This not only leads to substantial losses of ecological land types such as forests, grasslands, and wetlands but also conflicts with the targets set by South Korea’s carbon neutrality strategy. From a spatial perspective, the contraction of ecological land is most pronounced under this scenario, with the habitat quality index declining to 0.2334, and, as shown in Figure 12, most areas experiencing habitat quality change are classified as degradation zones.
In contrast, SSP2-4.5 presents a relatively balanced development model. In this pathway, built-up land expands at an annual rate of 1.59%, similar to the historical period and sufficient to meet the needs of urban development. Wetlands and water bodies show annual growth rates of 1.35% and 0.13%, respectively, supporting ecosystem restoration. Although forest area decreases by 5250.96 ha and grassland by 695.07 ha, their annual rates of decrease are both below 1%, indicating that ecological pressure remains within a controllable range. Although habitat quality declines compared with previous periods, there are slight signs of recovery over time, which is associated with wetland expansion and water body restoration in the Nakdong River area. One study indicates that Busan plans to release approximately 34 km2 of green space for construction purposes while also constructing about 14 km2 of green parks in its central urban area. The same study also points out that Busan’s current sustainable development path is not purely ecologically oriented but seeks a balance between urban growth and ecological protection [76]. Relevant studies suggest that, in economically driven coastal regions or urban agglomerations, such a compromise pathway as SSP2-4.5 may be conducive to advancing sustainable urban development [77,78].
Overall, the SSP2-4.5 scenario aligns more closely with Busan’s actual development trajectory, enabling urban expansion while allowing for ecosystem restoration. However, continued degradation of forest and grassland areas warrants attention. To better achieve sustainable development goals, future efforts should focus on strengthening ecological compensation mechanisms and optimizing land-use structures to counteract the decline of ecological land.

4.3. Mechanisms Driving Spatial Heterogeneity in Habitat Quality

The GeoDetector analysis revealed that land-use type and elevation are the primary driving factors affecting habitat quality in Busan Metropolitan City. As a direct manifestation of human activities, land-use type plays a central role. With ongoing urban development, ecologically threatening land-use types have continuously expanded, progressively encroaching upon farmland and forested areas, thereby reducing the extent of habitat types with high suitability and ultimately leading to a decline in habitat quality. Previous studies have confirmed that the composition of land use exerts a profound influence on habitat quality [51,79]. The disturbance of cropland to habitat quality has been confirmed in a global study, which reported that the expansion of agricultural land exerts significant negative impacts on biodiversity and habitat integrity [80].
Among topographic factors, elevation and slope both contribute to explaining the spatial pattern of habitat quality. Busan’s large proportion of mountainous terrain makes topography a major constraint on urban expansion. High-altitude areas are difficult to develop, with vegetation generally well preserved and located farther from the city center, resulting in relatively high habitat quality levels. This pattern aligns with the findings from a study on the Yangtze River Basin, which also identified the influence of elevation on habitat quality distribution [81]. Although slope has been reported as an important factor in other studies [82], its explanatory power in this study is relatively low, differing from results in the Guangdong–Hong Kong–Macao Greater Bay Area [33]. This is because Busan has limited plain areas available for urban development, and under conditions of high-intensity land use, areas with gentler slopes have also been incorporated into urban development zones, thereby weakening the explanatory power of slope for the spatial heterogeneity of habitat quality.
Combining the spatial distribution of habitat quality (Figure 6) with factor detection results (Figure 10), it is evident that habitat quality has significantly declined in the eastern coastal area. The q-values for primary and secondary roads are 0.3124 and 0.2753, respectively, indicating a notable impact of transportation infrastructure on habitat quality. Road construction disrupts the integrity of natural landscape patches, leads to landscape fragmentation, and reduces habitat connectivity. This finding is consistent with previous research, further confirming the negative impacts of road networks on habitat quality [83,84]. Additionally, vegetation-related indicators, such as NDVI and NPP, exhibit strong explanatory power for habitat quality [85,86]. This is consistent with the Natural Grade Map developed by the Korean Ministry of Environment, which highlights the critical role of forests in the eastern and southwestern regions as well as wetlands in the Nakdong River estuary in maintaining ecological stability in Busan Metropolitan City. These results demonstrate that habitat quality is jointly influenced by multiple factors, including land-use patterns, topographic conditions, urban development, and vegetation distribution, underscoring the need to consider both natural and anthropogenic factors in urban planning.

4.4. Limitations and Future Perspectives

This study developed a coupled PLUS–InVEST–GeoDetector framework to predict and assess land use and habitat quality in Busan under multiple scenarios and to identify their key drivers. However, several limitations remain.
First, the core assumption of the PLUS model is that future land expansion mechanisms remain consistent with historical ones. Due to the limited availability of land-cover data, this study only analyzed land expansion based on 2009 and 2019 data, which may result in a temporal lag in the prediction results. In the validation phase, classified land-use data from mid-2024 were used to verify the Kappa coefficient. However, because of differences in classification systems and satellite imagery between the two datasets, the Kappa coefficients were suboptimal (Figure S7). These issues suggest that the model is less sensitive to changes in land-use patterns caused by rapid urbanization or major engineering projects, which may introduce bias into the prediction results. Furthermore, since this is the first application of the PLUS model at the urban scale in South Korea, the selection of driving factors was primarily based on international research. Such reliance may have overlooked variables more relevant to South Korea’s national context, potentially affecting the accuracy of the simulations.
The InVEST model relies on subjectively defined distances and weights for threat factors as well as habitat suitability values for each land-use category. Although this study modified these parameters based on relevant literature and the characteristics of the study area, they remain empirically determined, and the model does not account for processes such as animal migration. Future research could improve accuracy by incorporating remote-sensing-derived ecological indices.
The GeoDetector model depends on the discretization and stratification of continuous variables, and different classification methods may affect the final results. Moreover, the model primarily relies on the overall q-value as a core indicator, which makes it difficult to capture the spatial variability of individual factors and to clearly characterize their influence across different regions. Additionally, the factor detector results carry the risk of false positives, necessitating further significance testing to ensure robustness and reliability.
To address these issues, the National Land Environmental Assessment Map was used as an external reference to validate the habitat quality results, supplemented by Spearman correlation analysis and bivariate spatial autocorrelation analysis, both of which showed strong consistency. In the accuracy evaluation of the PLUS model, the Kappa coefficient reached 0.79, the overall accuracy was 86.4%, and the Figure of Merit (FOM) was 0.434, indicating that the model is well suited for predictions under Korean conditions. When applying the GeoDetector model, various sampling scales and discretization methods were compared, and the one with the highest explanatory power was selected to reduce subjectivity and enhance robustness. To further avoid false positives, significance corrections were applied to the q-values of the factor detector using the Bonferroni, Holm, and BH-FDR methods (Table S7). The results showed that, among the 16 selected driving factors, four exhibited false positives under different methods: distance to highways, average annual precipitation, distance to trunk roads, and distance to railways. Among these, distance to trunk roads and distance to railways failed the Bonferroni significance test. For the sake of rigor, these four factors were removed from the factor detector results (Figure 13). However, it should be noted that the core purpose of the interaction detector is to assess changes in explanatory power when factors are combined. Even if a factor is not significant on its own, it may play an important role through interactions with other factors. Therefore, the four factors mentioned above were retained in the interaction detector results (Figure 14) to fully demonstrate the contribution of interaction effects to the spatial heterogeneity of habitat quality.
Future research will focus on improving prediction accuracy by selecting driving factors that better represent the regional characteristics of South Korea and integrating them with multi-source datasets of high spatiotemporal resolution, as well as the next-generation PLUS model, to address the limitations of model adaptability and data timeliness. Geographically Weighted Regression (GWR) and Geographically and Temporally Weighted Regression (GTWR), combined with bandwidth optimization and spatial autocorrelation analysis, will be introduced to systematically analyze how factors such as climate, economy, and topography shape spatial gradients in habitat quality, thereby providing a basis for regionally specialized management. In addition, machine learning techniques will be employed to generate more refined assessments of ecosystem services, offering targeted scientific support for urban ecological planning and sustainable development.

4.5. Implications for Coastal Mountainous Cities

The results of this study are not only applicable to Busan but also offer theoretical support for the sustainable development of other rapidly urbanizing coastal mountainous cities. Taking the southeastern coastal cities of China as examples, Ningbo, an important port city, is also characterized by more mountainous terrain and limited plains. During the expansion of the Hangzhou Bay New Area, a large portion of coastal wetlands and mudflats were reclaimed, leading to the degradation of the coastal wetland system [87]. Based on the results of this study, Ningbo should establish coastal wetland buffer zones in future urban planning to prevent the direct encroachment of urban areas into wetlands and mudflats. Fuzhou, as a typical city with a “mountain–water–city” spatial pattern, has undergone rapid urbanization, which has further exacerbated the loss of forests and wetlands. This study highlights that ecological land and topographic factors play a significant role in maintaining habitat quality. Therefore, in the context of Fuzhou’s urban development, strict development restriction boundaries should be established in mountainous and gently sloping areas to maintain ecosystem stability. At the same time, related studies have noted that the expansion of urban land in Fuzhou has resulted in significant losses in ecosystem service value [88]. Similar insights can also be extended to coastal mountainous cities such as Wenzhou, Xiamen, Dalian, and Hong Kong. These cities should fully consider the constraints of their terrain and ecological land during development and rationally guide both the expansion of construction land and the restoration of ecosystems to achieve the dual goals of economic development and ecological protection.

4.6. Policy Recommendations

This study found that, in the course of urban development in Busan Metropolitan City, ecological land has continued to shrink, and habitat quality has declined. Based on multi-scenario simulation results, the following policy recommendations are presented.
(1)
Prioritizing internal urban development. In the central urban area, efforts should focus on improving the efficiency of existing land use and avoiding unplanned expansion. The construction of parks and green spaces should be strengthened, serving as key nodes connecting high habitat quality areas, with three ecological corridors established across Busan: the Central Ecological Corridor (Geumjeongsan–Suyeong River–East Coast), the Eastern Ecological Corridor (extending from high-quality habitat areas in the east to the Haeundae coastline), and the Western Ecological Corridor (Geumjeongsan–Baegyangsan–Gudeoksan–southern coastline). These corridors should consolidate and reconnect fragmented green spaces, mitigating landscape fragmentation caused by urban expansion and enhancing ecosystem stability. In Busan Ecocity, located in the Nakdong River Delta adjacent to a wetland protection area, stricter waste discharge regulations should be enforced to prevent water pollution and protect the estuarine wetland ecosystem. For agricultural land in Gangseo District, a farmland protection demonstration zone should be established, strictly prohibiting non-agricultural development.
(2)
Strengthening the ecological barrier function of ecological land. As an important habitat for migratory birds, the coastal zone and the Nakdong River wetlands should be managed based on the Natural Grade Map and the Basic Wetland Conservation Plan, implementing zoned and classified management. The Nakdong River estuary should be subject to strict control, while coastal areas—given their tourism functions—should be managed in a scientifically adaptive manner. Forests, as the dominant land type in the study area, should be managed by region. In high-altitude areas, stricter conservation policies should be implemented, and technologies such as remote sensing and unmanned aerial vehicles should be used to collect real-time data from core forest zones. On this basis, green recreation, environmental education, and ecological learning activities may be appropriately developed to enhance the cultural services of forests and reinforce their role in sustainable urban development. Additionally, the management of forests in urban fringe areas should be strengthened to serve as a buffer zone between urban land and forest ecosystems.
(3)
Improve the urban ecological supervision system. Given the high consistency between habitat quality results and official datasets, it is recommended that government agencies integrate the habitat quality index, the National Land Environmental Evaluation Map, and the Natural Grade Map into a comprehensive urban development evaluation framework. In areas with both high spatial overlap and high habitat quality, a dynamic ecological protection monitoring system and rapid response mechanism based on remote sensing and geographic information system technologies should be established to ensure precise, real-time monitoring and effective ecosystem management. Conversely, in areas with relatively low habitat quality and evaluation scores, differentiated ecological enhancement strategies should be formulated, considering development pressures, ecological functions, and spatial positioning. This approach would enable a more rational and stable improvement in the overall ecological environmental quality of the city.

5. Conclusions

This study combines the PLUS, InVEST, and GeoDetector models within a unified prediction–evaluation–analysis framework to examine the spatiotemporal evolution of land use and habitat quality in Busan from 1988 to 2049 and to identify the drivers of spatial heterogeneity. The main findings are as follows: (1) from 1988 to 2019, construction land expanded significantly, while agricultural land and various types of ecological land continuously decreased; (2) habitat quality exhibited an overall downward trend, with a spatial pattern increasing from coastal to inland areas and from lowlands to mountainous regions; (3) future scenario simulations indicate that, under SSP1-2.6, ecological land area increases and habitat quality gradually improves, under SSP2-4.5, habitat quality follows a U-shaped trajectory—first declining and then recovering, and under SSP5-8.5, habitat quality continues to degrade; (4) GeoDetector analysis reveals that land-use type and NDVI are the most influential factors affecting the spatial heterogeneity of habitat quality, with significant interactions between socio-economic and natural factors, and among these, the interaction between land-use type and elevation shows the strongest explanatory power, indicating that the spatial distribution of habitat quality in Busan is shaped by the combined influence of multiple factors; (5) through multiple testing approaches, this study demonstrates that the three models employed are both applicable and reliable for conducting related research in South Korea.
These findings suggest that cities like Busan—which must shoulder both the responsibility for regional economic development and the task of ecological protection and restoration—urgently need to pursue a more balanced development pathway. Overemphasizing either economic growth or ecological conservation alone is insufficient to achieve genuine sustainability. Therefore, Busan should adopt a coordinated, multi-faceted approach. On one side, it should optimize the land-use structure by rationally allocating construction and ecological land, improving the efficiency of industrial space use, and ensuring that economic growth contributes to ecological restoration. On the opposite side, it should systematically plan ecological corridors to connect forests, rivers, and wetlands, thereby mitigating landscape fragmentation and enhancing the stability and resilience of the urban ecosystem. Through these efforts, Busan can explore a sustainable development path suited to its specific context. The findings offer guidance for optimizing land-use structure, improving the human settlement environment, and supporting sustainable development in Busan and other coastal mountainous cities.

Supplementary Materials

The following supporting information can be downloaded at: https://www.mdpi.com/article/10.3390/land14091805/s1, Figure S1: Kappa Statistic Validation; Figure S2: Spearman correlation results between the habitat quality index and the Environmental Conservation Value Assessment Map; Figure S3: Bivariate Moran’s I between the habitat quality index and the Environmental Conservation Value Assessment Map; Figure S4: LISA cluster map of the habitat quality index and the Environmental Conservation Value Assessment Map; Figure S5: Explanatory power for spatial differentiation of habitat quality and corresponding 90% quantile values under different spatial sampling scales; Figure S6: Optimal discretization results at the 2 km scale; Figure S7: Kappa Coefficient Test between the 2019 and 2024 Official Datasets; Table S1: Data name, data source, spatial resolution, and time period used in the study; Table S2: Land-use transfer rule matrix under the SSP1-2.6 scenario; Table S3: Land-use transfer rule matrix under the SSP2-4.5 scenario; Table S4: Land-use transfer rule matrix under the SSP5-8.5 scenario; Table S5: Land expansion weights under different scenarios; Table S6: Collinearity Test of Driving Factors in the PLUS Model; Table S7: Significance test results of the GeoDetector q-values.

Author Contributions

Conceptualization, Z.W. and S.H.; methodology, Z.W.; software, Z.W.; validation, Z.W. and S.H.; formal analysis, Z.W. and S.H.; investigation, Z.W.; resources, S.H.; data curation, Z.W.; writing—original draft preparation, Z.W.; writing—review and editing, S.H. and Z.W.; visualization, Z.W.; supervision, S.H.; project administration, S.H. All authors have read and agreed to the published version of the manuscript.

Funding

This research received no external funding.

Data Availability Statement

The raw data supporting the conclusions of this article will be made available by the authors on request.

Acknowledgments

The authors would like to thank the anonymous reviewers and editors for their valuable comments and suggestions, which have greatly improved the quality of this paper.

Conflicts of Interest

The authors declare no conflicts of interest.

References

  1. Long, H.; Liu, Y.; Wu, X.; Dong, G. Spatio-temporal dynamic patterns of farmland and rural settlements in Su–Xi–Chang region: Implications for building a new countryside in coastal China. Land Use Policy 2009, 26, 322–333. [Google Scholar] [CrossRef]
  2. Lee, H.K.; Kim, H.Y. Economic growth for ecological conversions: South Korean case. Environ. Sci. Eur. 2018, 30, 21. [Google Scholar] [CrossRef] [PubMed]
  3. Jung, M.; Rowhani, P.; Scharlemann, J.P.W. Impacts of past abrupt land change on local biodiversity globally. Nat. Commun. 2019, 10, 5474. [Google Scholar] [CrossRef] [PubMed]
  4. Chen, Y.; Gao, J.; Hu, Y.; Lv, S. Change of Landscape Patterns in the Huihe National Nature Reserve, Hulun Buir, Inner Mongolia, Northern China. In Proceedings of the 2009 International Conference on Environmental Science and Information Application Technology, Wuhan, China, 4–5 July 2009; IEEE: Piscataway, NJ, USA, 2009; Volume 2, pp. 306–311. [Google Scholar] [CrossRef]
  5. Wang, H.; Lü, Z.; Gu, L.; Wen, C. Observations of China’s forest change (2000–2013) based on Global Forest Watch dataset. Biodivers. Sci. 2015, 23, 575. [Google Scholar] [CrossRef]
  6. Zhao, X.; Huang, Q.; He, C. Scenarios simulation of the spatial stress on wetlands by urban expansion: A case study of Huailai county. J. Nat. Resour. 2017, 32, 1469–1481. [Google Scholar] [CrossRef]
  7. Powers, R.P.; Jetz, W. Global habitat loss and extinction risk of terrestrial vertebrates under future land-use-change scenarios. Nat. Clim. Change 2019, 9, 323–329. [Google Scholar] [CrossRef]
  8. Gomes, E.; Inácio, M.; Bogdzevič, K.; Kalinauskas, M.; Karnauskaitė, D.; Pereira, P. Future land-use changes and its impacts on terrestrial ecosystem services: A review. Sci. Total Environ. 2021, 781, 146716. [Google Scholar] [CrossRef] [PubMed]
  9. Schirpke, U.; Tasser, E.; Borsky, S.; Braun, M.; Eitzinger, J.; Gaube, V.; Getzner, M.; Glatzel, S.; Gschwantner, T.; Kirchner, M.; et al. Past and future impacts of land-use changes on ecosystem services in Austria. J. Environ. Manag. 2023, 345, 118728. [Google Scholar] [CrossRef]
  10. Lee, E.; Sagong, J.; Lee, Y. Influence of land use change on the waterbird community of Sihwa Lake, Republic of Korea. Avian Res. 2020, 11, 36. [Google Scholar] [CrossRef]
  11. Yu, W.; Luo, X.; Tang, L.; Huang, Y. Impact of grain growing objectives on the application of bio-pesticides of rice farmers from the perspective of land fragmentation. Resour. Sci. 2019, 41, 2193–2204. [Google Scholar] [CrossRef]
  12. United Nations. Transforming our world: The 2030 Agenda for Sustainable Development; Assembly U N G. Transforming our world: The 2030 Agenda for Sustainable Development, A/RES/70/1; United Nations: New York, NY, USA, 2015; Available online: https://sdgs.un.org (accessed on 21 October 2015).
  13. Long, H. Analysis of the key factors of ecological environment protection in the national economic sustainable development goals. J. Environ. Public Health 2022, 2022, 3593587. [Google Scholar] [CrossRef] [PubMed]
  14. Peng, B.; Sheng, X.; Wei, G. Does environmental protection promote economic development? From the perspective of coupling coordination between environmental protection and economic development. Environ. Sci. Pollut. Res. 2020, 27, 39135–39148. [Google Scholar] [CrossRef]
  15. Ntshane, B.C.; Gambiza, J. Habitat assessment for ecosystem services in South Africa. Int. J. Biodivers. Sci. Ecosyst. Serv. Manag. 2016, 12, 242–254. [Google Scholar] [CrossRef]
  16. Rahimi, L.; Malekmohammadi, B.; Yavari, A.R. Assessing and modeling the impacts of wetland land cover changes on water provision and habitat quality ecosystem services. Nat. Resour. Res. 2020, 29, 3701–3718. [Google Scholar] [CrossRef]
  17. Li, Z.; Ma, Z.; Zhou, G. Impact of land use change on habitat quality and regional biodiversity capacity: Temporal and spatial evolution and prediction analysis. Front. Environ. Sci. 2022, 10, 1041573. [Google Scholar] [CrossRef]
  18. Mengist, W.; Soromessa, T.; Feyisa, G.L. Landscape change effects on habitat quality in a forest biosphere reserve: Implications for the conservation of native habitats. J. Clean. Prod. 2021, 329, 129778. [Google Scholar] [CrossRef]
  19. Wang, Q.; Wang, H. Evaluation for the spatiotemporal patterns of ecological vulnerability and habitat quality: Implications for supporting habitat conservation and healthy sustainable development. Environ. Geochem. Health 2023, 45, 2117–2147. [Google Scholar] [CrossRef]
  20. Hong, H.J.; Kim, C.K.; Lee, H.W.; Lee, W.K. Conservation, restoration, and sustainable use of biodiversity based on habitat quality monitoring: A case study on Jeju Island, South Korea (1989–2019). Land 2021, 10, 774. [Google Scholar] [CrossRef]
  21. Gao, H.; Song, X.; Xu, H.; Li, X.; Tang, J.; Zhao, G. Promoting sustainable development by mitigation of natural habitat quality decline through multifunctional urban land use: Insights from a multi-scenario simulation. Sustain. Cities Soc. 2024, 110, 105563. [Google Scholar] [CrossRef]
  22. Lin, Y.; An, W.; Gan, M.; Shahtahmassebi, A.; Ye, Z.; Huang, L.; Zhu, C.; Huang, L.; Zhang, J.; Wang, K. Spatial grain effects of urban green space cover maps on assessing habitat fragmentation and connectivity. Land 2021, 10, 1065. [Google Scholar] [CrossRef]
  23. Yin, J.; Fu, P.; Cheshmehzangi, A.; Li, Z.; Dong, J. Investigating the changes in urban green-space patterns with urban land-use changes: A case study in Hangzhou, China. Remote Sens. 2022, 14, 5410. [Google Scholar] [CrossRef]
  24. Nor, A.N.M.; Corstanje, R.; Harris, J.A.; Brewer, T. Impact of rapid urban expansion on green space structure. Ecol. Indic. 2017, 81, 274–284. [Google Scholar] [CrossRef]
  25. Zajac, Z.; Stith, B.; Bowling, A.C.; Langtimm, C.A.; Swain, E.D. Evaluation of habitat suitability index models by global sensitivity and uncertainty analyses: A case study for submerged aquatic vegetation. Ecol. Evol. 2015, 5, 2503–2517. [Google Scholar] [CrossRef]
  26. Duan, H.; Xu, N. Assessing social values for ecosystem services in rural areas based on the SolVES model: A case study from Nanjing, China. Forests 2022, 13, 1877. [Google Scholar] [CrossRef]
  27. Zhong, L.; Wang, J. Evaluation on effect of land consolidation on habitat quality based on InVEST model. Trans. Chin. Soc. Agric. Eng. 2017, 33, 250–255. [Google Scholar] [CrossRef]
  28. Sallustio, L.; De Toni, A.; Strollo, A.; Di Febbraro, M.; Gissi, E.; Casella, L.; Geneletti, D.; Munafò, M.; Vizzarri, M.; Marchetti, M. Assessing habitat quality in relation to the spatial distribution of protected areas in Italy. J. Environ. Manag. 2017, 201, 129–137. [Google Scholar] [CrossRef]
  29. Qin, X.; Yang, Q.; Wang, L. The evolution of habitat quality and its response to land use change in the coastal China, 1985–2020. Sci. Total Environ. 2024, 952, 175930. [Google Scholar] [CrossRef]
  30. Tian, C.; Zhong, J.; You, Q.; Fang, C.; Hu, Q.; Liang, J.; He, J.; Yang, W. Land use modeling and habitat quality assessment under climate scenarios: A case study of the Poyang Lake basin. Ecol. Indic. 2025, 172, 113292. [Google Scholar] [CrossRef]
  31. Wang, H.; Hu, Y.; Yan, H.; Liang, Y.; Guo, X.; Ye, J. Trade-off among grain production, animal husbandry production, and habitat quality based on future scenario simulations in Xilinhot. Sci. Total Environ. 2022, 817, 153015. [Google Scholar] [CrossRef] [PubMed]
  32. Wu, Y.; Wang, J.; Gou, A. Research on the evolution characteristics, driving mechanisms and multi-scenario simulation of habitat quality in the Guangdong-Hong Kong-Macao Greater Bay based on multi-model coupling. Sci. Total Environ. 2024, 924, 171263. [Google Scholar] [CrossRef]
  33. Zhang, S.; Yang, P.; Xia, J.; Wang, W.; Cai, W.; Chen, N.; Hu, S.; Luo, X.; Li, J.; Zhan, C. Land use/land cover prediction and analysis of the middle reaches of the Yangtze River under different scenarios. Sci. Total Environ. 2022, 833, 155238. [Google Scholar] [CrossRef] [PubMed]
  34. Guo, W.; Teng, Y.; Li, J.; Yan, Y.; Zhao, C.; Li, Y.; Li, X. A new assessment framework to forecast land use and carbon storage under different SSP-RCP scenarios in China. Sci. Total Environ. 2024, 912, 169088. [Google Scholar] [CrossRef] [PubMed]
  35. Luan, Y.; Huang, G.; Zheng, G. Spatiotemporal evolution and prediction of habitat quality in Hohhot City of China based on the InVEST and CA-Markov models. J. Arid. Land 2023, 15, 20–33. [Google Scholar] [CrossRef]
  36. Jiang, W.; Deng, Y.; Tang, Z.; Lei, X.; Chen, Z. Modelling the potential impacts of urban ecosystem changes on carbon storage under different scenarios by linking the CLUE-S and the InVEST models. Ecol. Model. 2017, 345, 30–40. [Google Scholar] [CrossRef]
  37. He, Y.; Ma, J.; Zhang, C.; Yang, H. Spatio-temporal evolution and prediction of carbon storage in Guilin based on FLUS and InVEST models. Remote Sens. 2023, 15, 1445. [Google Scholar] [CrossRef]
  38. Liang, X.; Guan, Q.; Clarke, K.C.; Liu, S.; Wang, B.; Yao, Y. Understanding the drivers of sustainable land expansion using a patch-generating land use simulation (PLUS) model: A case study in Wuhan, China. Comput. Environ. Urban Syst. 2021, 85, 101569. [Google Scholar] [CrossRef]
  39. Luo, J.; Fu, H. Constructing an urban cooling network based on PLUS model: Implications for future urban planning. Ecol. Indic. 2023, 154, 110887. [Google Scholar] [CrossRef]
  40. Jiang, H.; Cui, Z.; Fan, T.; Yin, H. Impacts of land use change on carbon storage in the Guangxi Beibu Gulf Economic Zone based on the PLUS-InVEST model. Sci. Rep. 2025, 15, 6468. [Google Scholar] [CrossRef]
  41. Wei, Q.; Abudureheman, M.; Halike, A.; Yao, K.; Yao, L.; Tang, H.; Tuheti, B. Temporal and spatial variation analysis of habitat quality on the PLUS-InVEST model for Ebinur Lake Basin, China. Ecol. Indic. 2022, 145, 109632. [Google Scholar] [CrossRef]
  42. Zhang, X.; Zhou, J.; Li, G.; Chen, C.; Li, M.; Luo, J. Spatial pattern reconstruction of regional habitat quality based on the simulation of land use changes from 1975 to 2010. J. Geogr. Sci. 2020, 30, 601–620. [Google Scholar] [CrossRef]
  43. Zhang, X.; Liao, L.; Xu, Z.; Zhang, J.; Chi, M.; Lan, S.; Gan, Q. Interactive effects on habitat quality using InVEST and GeoDetector models in Wenzhou, China. Land 2022, 11, 630. [Google Scholar] [CrossRef]
  44. Kim, J.H. A Study on the Selection of Priority Conservation Areas Based on Ecosystem Functions in Busan-Evaluation of Habitat Quality and Ecological Connectivity. J. Korean Soc. Environ. Restor. Technol. 2024, 27, 15–25. [Google Scholar] [CrossRef]
  45. Choi, J.; Lee, Y.; Lee, S. A study on the ecosystem services value assessment according to city development: In case of the busan eco-delta city development. J. Environ. Impact Assess. 2019, 28, 427–439. [Google Scholar] [CrossRef]
  46. Kwon, H.Y.; Jang, J.E.; Shin, H.S.; Yu, B.H.; Lee, S.C.; Choi, S.H. Habitat Quality Analysis and an Evaluation of Gajisan Provincial Park Ecosystem Service Using InVEST Model. Korean J. Environ. Ecol. 2022, 36, 318–326. [Google Scholar] [CrossRef]
  47. Kim, T.; Song, C.; Lee, W.K.; Kim, M.; Lim, C.H.; Jeon, S.W.; Kim, J. Habitat quality valuation using InVEST model in Jeju Island. J. Korean Soc. Environ. Restor. Technol. 2015, 18, 1–11. [Google Scholar] [CrossRef]
  48. Shin, H.S.; Jang, J.E.; Kwon, H.Y.; Kim, G.R.; Jang, J.; Choi, S.H. Establishing habitat quality criteria for the ecosystem services InVEST model using AHP techniques. Korean J. Environ. Ecol. 2024, 38, 67–78. [Google Scholar] [CrossRef]
  49. Jang, J.E.; Kwon, H.Y.; Shin, H.; Lee, S.C.; Yu, B.H.; Jang, J.; Choi, S.H. Habitat Quality Analysis and Evaluation of InVEST Model Using QGIS-Conducted in 21 National Parks of Korea. Korean J. Environ. Ecol. 2022, 36, 102–111. [Google Scholar] [CrossRef]
  50. Sun, L.; Yu, H.; Sun, M.; Wang, Y. Coupled impacts of climate and land use changes on regional ecosystem services. J. Environ. Manag. 2023, 326, 116753. [Google Scholar] [CrossRef] [PubMed]
  51. Wu, Q.; Wang, L.; Wang, T.; Ruan, Z.; Du, P. Spatial–temporal evolution analysis of multi-scenario land use and carbon storage based on PLUS-InVEST model: A case study in Dalian, China. Ecol. Indic. 2024, 166, 112448. [Google Scholar] [CrossRef]
  52. Cao, Y.; Wang, C.; Su, Y.; Duan, H.; Wu, X.; Lu, R.; Su, Q.; Wu, Y.; Chu, Z. Study on spatiotemporal evolution and driving forces of habitat quality in the basin along the Yangtze River in Anhui Province based on InVEST model. Land 2023, 12, 1092. [Google Scholar] [CrossRef]
  53. Gao, J. Downscaling Global Spatial Population Projections from 1/8-Degree to 1-km Grid Cells; NCAR Technical Note NCAR/TN-537+STR; National Center for Atmospheric Researcher: Boulder, CO, USA, 2017. [Google Scholar] [CrossRef]
  54. Wang, T.; Sun, F. Global gridded GDP data set consistent with the shared socioeconomic pathways. Sci. Data 2022, 9, 221. [Google Scholar] [CrossRef]
  55. Wang, X.; Liu, B.; Chen, J.; Arash, M.; Zhang, B.; Chang, Q.; Liu, J.; You, W. Assessing the impact of land use change on habitat quality in Zhongwei through multiscenario simulation using the PLUS and InVEST models. Sci. Rep. 2025, 15, 12355. [Google Scholar] [CrossRef]
  56. Deng, G.; Jiang, H.; Ma, S.; He, C.; Sheng, L.; Wen, Y. Revealing the impacts of different urban development on habitat quality: A case study of the Changchun–Jilin region of China. J. Clean. Prod. 2025, 511, 145661. [Google Scholar] [CrossRef]
  57. Wu, Z.; Chen, X.; Liu, B.B.; Chu, J.; Peng, L. Research progress and application of InVEST model. Chin. J. Trop. Agri. 2013, 33, 58–62. [Google Scholar]
  58. Wang, B.; Cheng, W. Effects of land use/cover on regional habitat quality under different geomorphic types based on InVEST model. Remote Sens. 2022, 14, 1279. [Google Scholar] [CrossRef]
  59. Natural Capital Project, 2025. InVEST 3.16.2 User’s Guide. Stanford University, University of Minnesota, Chinese Academy of Sciences, The Nature Conservancy, World Wildlife Fund, Stockholm Resilience Centre and the Royal Swedish Academy of Sciences. Available online: https://naturalcapitalproject.stanford.edu/software/invest/invest-downloads-data (accessed on 1 July 2025).
  60. Wang, J.F.; Zhang, T.L.; Fu, B.J.A. measure of spatial stratified heterogeneity. Ecol. Indic. 2016, 67, 250–256. [Google Scholar] [CrossRef]
  61. Xu, D.; Zhang, K.; Cao, L.; Guan, X.; Zhang, H. Driving forces and prediction of urban land use change based on the geodetector and CA-Markov model: A case study of Zhengzhou, China. Int. J. Digit. Earth 2022, 15, 2246–2267. [Google Scholar] [CrossRef]
  62. Wang, H.; Qin, F.; Xu, C.; Li, B.; Guo, L.; Wang, Z. Evaluating the suitability of urban development land with a Geodetector. Ecol. Indic. 2021, 123, 107339. [Google Scholar] [CrossRef]
  63. Cai, Z.; Zhang, Z.; Zhao, F.; Guo, X.; Zhao, J.; Xu, Y.; Liu, X. Assessment of eco-environmental quality changes and spatial heterogeneity in the Yellow River Delta based on the remote sensing ecological index and geo-detector model. Ecol. Inform. 2023, 77, 102203. [Google Scholar] [CrossRef]
  64. Song, Y.; Wang, J.; Ge, Y.; Xu, C. An optimal parameters-based geographical detector model enhances geographic characteristics of explanatory variables for spatial heterogeneity analysis: Cases with different types of spatial data. GIScience Remote Sens. 2020, 57, 593–610. [Google Scholar] [CrossRef]
  65. Zhao, X.; Tan, S.; Li, Y.; Wu, H.; Wu, R. Quantitative analysis of fractional vegetation cover in southern Sichuan urban agglomeration using optimal parameter geographic detector model, China. Ecol. Indic. 2024, 158, 111529. [Google Scholar] [CrossRef]
  66. Ma, S.; Deng, G.; Wang, L.J.; Hu, H.; Fang, X.; Jiang, J. Telecoupling between urban expansion and forest ecosystem service loss through cultivated land displacement: A case study of Zhejiang Province, China. J. Environ. Manag. 2024, 357, 120695. [Google Scholar] [CrossRef]
  67. Sarkar, L.; Chakraborty, P. Analysing urban sprawl as a response to land use & land cover change dynamics using geospatial techniques: A study of Kolkata and surrounding area. Geo J. 2025, 90, 168. [Google Scholar]
  68. Amaral, S.; Metzger, J.P.; Rosa, M.; Adorno, B.V.; Gonçalves, G.C.; Pinto, L.F.G. Alarming patterns of mature forest loss in the Brazilian Atlantic Forest. Nat. Sustain. 2025, 8, 256–264. [Google Scholar] [CrossRef]
  69. Kang, Y.; Kim, J. Urban expansion and ecosystem service dynamics: A Suncheon city case study. Environ. Dev. Sustain. 2025, 1–19. [Google Scholar] [CrossRef]
  70. Kim, J.H.; Kwon, O.S.; Ra, J.H. Urban type classification and characteristic analysis through time-series environmental changes for land use management for 31 satellite cities around Seoul, South Korea. Land 2021, 10, 799. [Google Scholar] [CrossRef]
  71. Jeong, S.; Sung, K. Assessing Habitat Quality and Risk of Coastal Areasin Busan. J. Environ. Impact Assess. 2022, 31, 95–105. [Google Scholar] [CrossRef]
  72. Hallaj, Z.; Bijani, M.; Karamidehkordi, E.; Yousefpour, R.; Yousefzadeh, H. Forest land use change effects on biodiversity ecosystem services and human well-being: A systematic analysis. Environ. Sustain. Indic. 2024, 23, 100445. [Google Scholar] [CrossRef]
  73. Luo, P.; Wang, X.; Zhang, L.; Zainol, M.R.R.M.A.; Duan, W.; Hu, M.; Guo, B.; Zhang, Y.; Wang, Y.; Nover, D. Future land use and flood risk assessment in the Guanzhong Plain, China: Scenario analysis and the impact of climate change. Remote Sens. 2023, 15, 5778. [Google Scholar] [CrossRef]
  74. Zhang, B.; Zou, H.; Duan, D.; Zhou, X.; Chen, J.; Sun, Z.; Zhang, X. Stability in change: Building a stable ecological security pattern in Northeast China under climate and land use changes. Sci. Rep. 2024, 14, 12642. [Google Scholar] [CrossRef]
  75. Zhong, Y.; Zhang, X.; Yang, Y.; Xue, M. Optimization and simulation of mountain city land use based on MOP-PLUS model: A case study of Caijia Cluster, Chongqing. ISPRS Int. J. Geo-Inf. 2023, 12, 451. [Google Scholar] [CrossRef]
  76. Park, M.; Lee, J.; Won, J. Navigating Urban Sustainability: Urban Planning and the Predictive Analysis of Busan’s Green Area Dynamics Using the CA-ANN Model. Forests 2024, 15, 1681. [Google Scholar] [CrossRef]
  77. Fu, X.; Xue, F.; Liu, Y.; Chen, F.; Yang, H. Evaluation of Urban Flood Susceptibility Under the Influence of Urbanization Based on Shared Socioeconomic Pathways. Land 2025, 14, 621. [Google Scholar] [CrossRef]
  78. Tang, W.; Cui, L.; Zheng, S.; Hu, W. Multi-scenario simulation of land use carbon emissions from energy consumption in Shenzhen, China. Land 2022, 11, 1673. [Google Scholar] [CrossRef]
  79. Ren, Q.; He, C.; Huang, Q.; Zhang, D.; Shi, P.; Lu, W. Impacts of global urban expansion on natural habitats undermine the 2050 vision for biodiversity. Resour. Conserv. Recycl. 2023, 190, 106834. [Google Scholar] [CrossRef]
  80. Cabernard, L.; Pfister, S.; Hellweg, S. Biodiversity impacts of recent land-use change driven by increases in agri-food imports. Nat. Sustain. 2024, 7, 1512–1524. [Google Scholar] [CrossRef]
  81. Zhu, Y.; Jia, P.; Liu, Y. Spatiotemporal evolution effects of habitat quality with the conservation policies in the Upper Yangtze River, China. Sci. Rep. 2025, 15, 5972. [Google Scholar] [CrossRef]
  82. Chen, S.; Liu, X. Spatio-temporal variations of habitat quality and its driving factors in the Yangtze River Delta region of China. Glob. Ecol. Conserv. 2024, 52, e02978. [Google Scholar] [CrossRef]
  83. Bennett, V.J. Effects of road density and pattern on the conservation of species and biodiversity. Curr. Landsc. Ecol. Rep. 2017, 2, 1–11. [Google Scholar] [CrossRef]
  84. Lamb, C.T.; Mowat, G.; Reid, A.; Smit, L.; Proctor, M.; McLellan, B.N.; Nielsen, S.E.; Boutin, S.; Marnewick, K. Effects of habitat quality and access management on the density of a recovering grizzly bear population. J. Appl. Ecol. 2018, 55, 1406–1417. [Google Scholar] [CrossRef]
  85. Xin, P.Y.; Tian, T.; Zhang, M.L.; Han, W.Z.; Song, Y.T. Assessment of habitat quality changes and driving factors in Jilin Province based on InVEST model and geodetector. J. Appl. Ecol. 2024, 35, 2853–2860. [Google Scholar] [CrossRef]
  86. Hui, C.; Liu, X.; Zhang, M.; Zhang, X.; Liu, X. Effects of the Loess Plateau on Habitat Quality of the West Qinling Mountains, China. Ecol. Evol. 2025, 15, e71289. [Google Scholar] [CrossRef] [PubMed]
  87. Jiang, Y.; Li, J.; Gong, H.; Ye, M.; Feng, B.; He, G.; Huang, R. Evaluation of gains and losses in coastal ecosystem service value under the influence of reclamation: A case study of Hangzhou Bay New Area, Ningbo. Econ. Geogr. 2017, 37, 181–190. [Google Scholar] [CrossRef]
  88. Fan, H.; Xu, J.; Gao, S. Modeling the dynamics of urban and ecological binary space for regional coordination: A case of Fuzhou coastal areas in Southeast China. Habitat Int. 2018, 72, 48–56. [Google Scholar] [CrossRef]
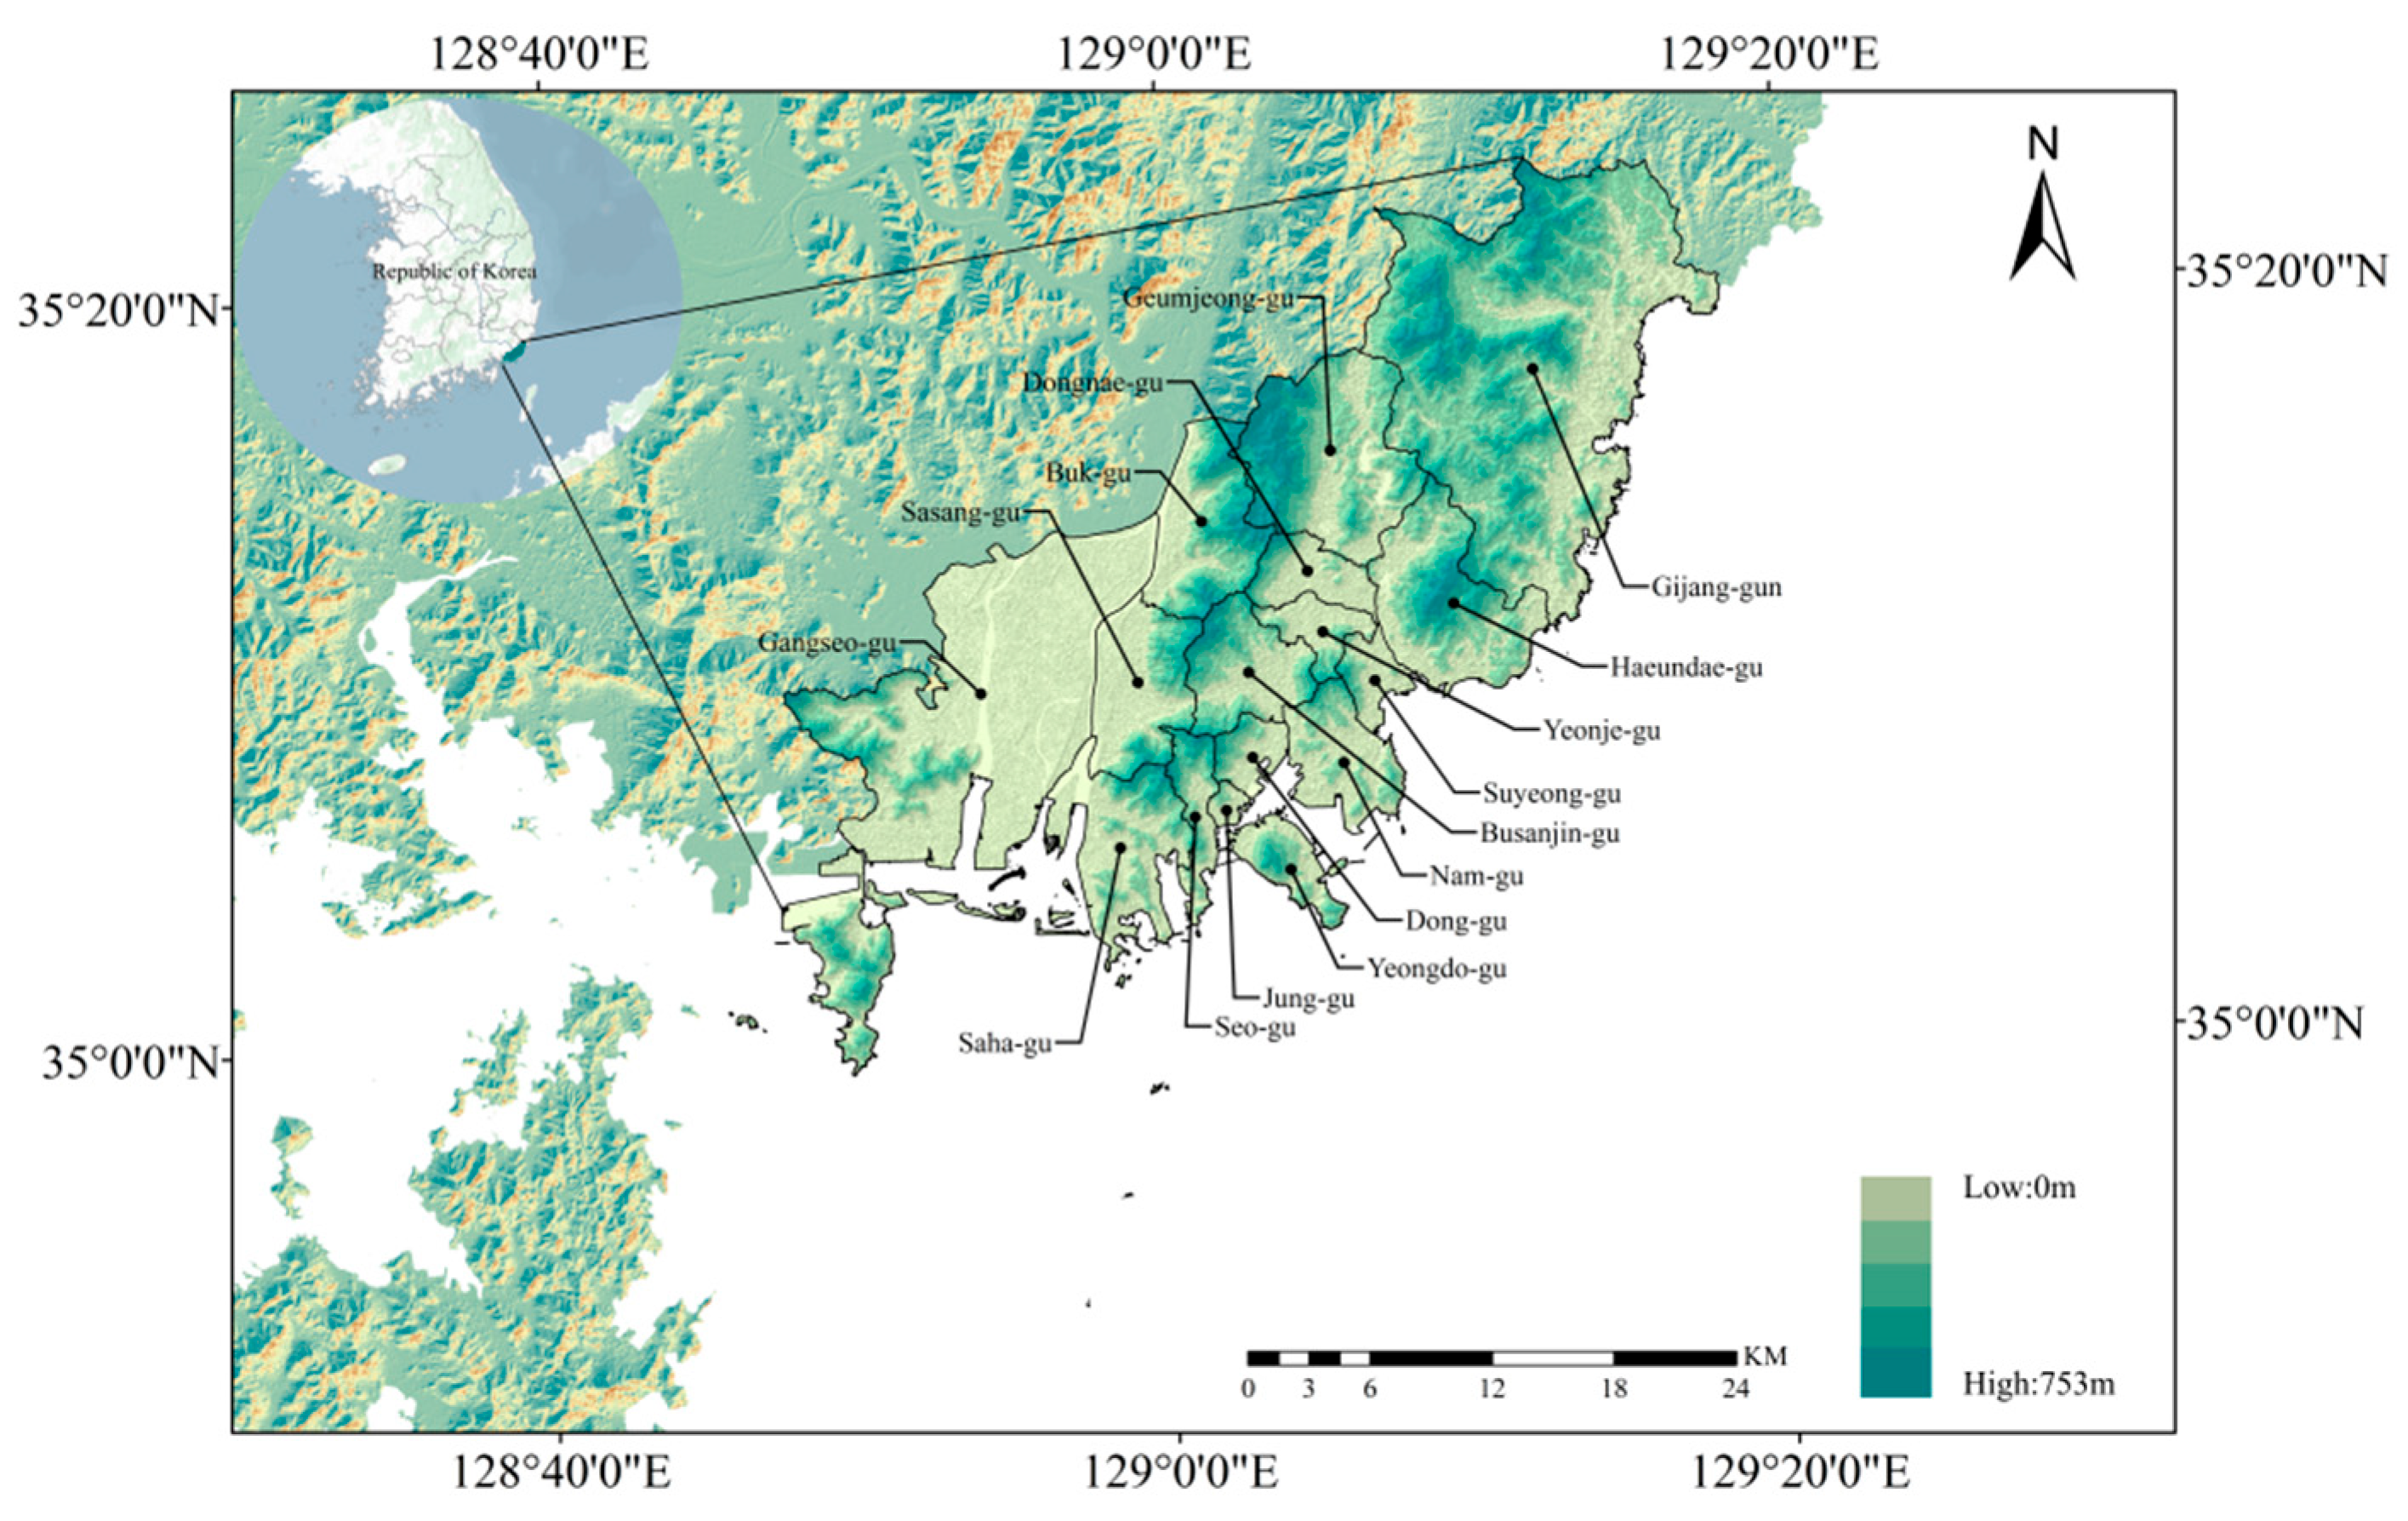
Figure 1. Location map of the study area.
Land 14 01805 g001
Figure 2. The research framework.
Land 14 01805 g002
Figure 3. Land-use patterns in Busan Metropolitan City (1988–2019).
Land 14 01805 g003
Figure 4. Single dynamic degree of each land-use type in Busan Metropolitan City (%).
Land 14 01805 g004
Figure 5. Land use in Busan Metropolitan City across various scenarios (2029–2049).
Land 14 01805 g005
Figure 6. (a) Changes in land area by type from 2019 to 2049 under different scenarios (ha); (b) average annual change rate of land type by type from 2019 to 2049 under different scenarios.
Land 14 01805 g006
Figure 7. Habitat quality patterns in Busan Metropolitan City (1988–2019).
Land 14 01805 g007
Figure 8. Mean habitat quality during the historical period and under different scenarios.
Land 14 01805 g008
Figure 9. Proportion of habitat quality levels.
Land 14 01805 g009
Figure 10. Habitat quality patterns during 2029–2049 under different scenarios.
Land 14 01805 g010
Figure 11. Habitat quality grade proportions under different scenarios.
Land 14 01805 g011
Figure 12. Patterns of change in habitat quality.
Land 14 01805 g012
Figure 13. Factor detector results for habitat quality spatial differentiation.
Land 14 01805 g013
Figure 14. Results of habitat quality interaction analysis.
Land 14 01805 g014
Figure 15. Contribution to land expansion.
Land 14 01805 g015
Table 1. Parameters related to threat sources.
Threat FactorMaximum Impact
Distance/km
WeightDistance Decay
Function
Agricultural Land20.5Linear Decay
Used Area40.8Exponential Decay
Barren20.5Linear Decay
Table 2. Parameters related to habitat types.
Land-Use TypesHabitat SuitabilityAgricultural LandUsed AreaBarren
Used Area0000
Agricultural Land0.40.20.70.5
Forest10.60.80.7
Grass0.60.60.750.4
Wetland0.80.50.70.6
Barren0000
Water0.90.40.80.6
Table 3. Land-use type area and proportion in Busan Metropolitan City (ha,%).
Land-Use Type1988199720092019
AreaProportionAreaProportionAreaProportionAreaProportion
Used Area12,040.5615.4415,381.4519.7218,663.0323.9323,321.2529.90
Agricultural Land15,230.3419.5312,844.7116.4711,405.3414.627419.699.51
Forest39,466.4450.6036,400.6846.6737,905.5748.6035,951.9446.10
Grass4842.366.216114.157.843586.954.6033214.25
Wetland135.540.17518.760.67492.570.631337.851.72
Barren1589.582.043304.534.242970.363.813805.24.88
Water4687.836.013428.374.402968.833.812840.313.64
Table 4. Land-use transition matrix for Busan Metropolitan City (1988–2019, ha).
YearLand-Use Type/haUsed AreaAgricultural LandForestGrassWetlandBarrenWater
1988–1997Used Area10,078.56307.89238.77797.425.29544.1448.51
Agricultural Land1750.149539.821566.541093.05156.69955.71168.39
Forest1030.321984.533,053.042564.91134.82508.23190.62
Grass1047.51733.591387.621327.8612.42304.7428.62
Wetland57.610.44910.813.3213.5920.79
Barren731.7166.2346.89197.7335.73391.4119.89
Water685.62102.2498.82122.4140.49586.712951.55
1997–2009Used Area15,009.3149.1374.2511.342.61120.8713.95
Agricultural Land418.7710,634.131106.82103.511.52556.9213.05
Forest480.51290.0734,966.98232.022.7418.959.45
Grass976.77140.041679.493234.150.6380.732.34
Wetland13.778.738.640.27467.116.24.05
Barren1531.17180.933.395.310.721546.116.93
Water232.742.34360.367.29230.582919.06
2009–2019Used Area18,193.320.09043.4773.71286.9265.52
Agricultural Land1573.387408.717.83273.24714.61334.2593.33
Forest1207.989.8135,908.74228.1521.42399.51129.96
Grass886.231.082.522567.3419.8981.4528.44
Wetland33.66000357.8425.5675.51
Barren1231.83022.84196.1171.11418.6718.81
Water195.75004.1479.83259.292429.82
Disclaimer/Publisher’s Note: The statements, opinions and data contained in all publications are solely those of the individual author(s) and contributor(s) and not of MDPI and/or the editor(s). MDPI and/or the editor(s) disclaim responsibility for any injury to people or property resulting from any ideas, methods, instructions or products referred to in the content.