Abstract
Amid accelerating climate change, climate-related hazards—such as floods, wildfires, hurricanes, and sea-level rise—increasingly drive land transformations and pose growing risks to housing markets by affecting property valuations, insurance availability, mortgage performance, and broader financial stability. This review synthesizes recent progress in two distinct domains and their linkage: (1) assessing climate-related financial risks in housing markets, and (2) applying AI-driven remote sensing for hazard detection and land transformation monitoring. While both areas have advanced significantly, important limitations remain. Existing housing finance studies often rely on static models and coarse spatial data, lacking integration with real-time environmental information, thereby reducing their predictive power and policy relevance. In parallel, remote sensing studies using AI primarily focus on detecting physical hazards and land surface changes, yet rarely connect these spatial transformations to financial outcomes. To address these gaps, this review proposes an integrative framework that combines AI-enhanced remote sensing technologies with financial econometric modeling to improve the accuracy, timeliness, and policy relevance of climate-related risk assessment in housing markets. By bridging environmental hazard data—including land-based indicators of exposure and damage—with financial indicators, the framework enables more granular, dynamic, and equitable assessments than conventional approaches. Nonetheless, its implementation faces technical and institutional barriers, including spatial and temporal mismatches between datasets, fragmented regulatory and behavioral inputs, and the limitations of current single-task AI models, which often lack transparency. Overcoming these challenges will require innovation in AI modeling, improved data-sharing infrastructures, and stronger cross-disciplinary collaboration.
1. Introduction
Housing is not only a basic human need but also a foundational pillar of financial systems. Globally, residential real estate represents one of the largest stores of household wealth, accounting for a significant share of household assets in both developed and developing economies [1]. In addition to its social and cultural significance, housing is deeply embedded in financial markets through instruments such as mortgages, mortgage-backed securities (MBS), real estate investment trusts (REITs), and property insurance [2]. These financial products depend on the assumption that housing assets will retain their value and remain insurable over time. As such, risks to housing assets translate directly into financial risks, affecting lending practices, portfolio valuations, and the stability of financial institutions [3].
The consequences of climate-related hazards, such as flooding, wildfire exposure, hurricanes, and coastal erosion, extend well beyond physical damage. These events drive rapid and often irreversible transformations of the land surface, such as shoreline retreat, ground subsidence, burn scars, and floodplain expansion, which directly affect the usability, insurability, and long-term value of residential properties. These hazard-induced land transformations serve as critical intermediaries through which climate shocks disrupt housing markets. As a result, such changes can materially erode property values, increase mortgage delinquency and default rates, reduce the availability of insurance, and trigger capital reallocation away from climate-vulnerable regions. At a large scale, these impacts can destabilize regional housing markets and contribute to systemic financial risk, particularly where climate hazards intersect with high levels of mortgage leverage or market speculation. For example, studies have shown that floodplain exposure—even in the absence of an actual flood—can depress property values and reduce loan origination volumes [4]. Similarly, insurers are increasingly withdrawing from high-risk zones, raising premiums or denying coverage altogether, which undermines home affordability and financing eligibility.
In light of these dynamics, accurately identifying, quantifying, and pricing climate-related financial risks in housing markets has become a top priority for financial institutions, regulators, investors, and policymakers. Emerging disclosure requirements—such as those guided by the Task Force on Climate-related Financial Disclosures [5] and climate risk guidelines proposed by the United States (US) Securities and Exchange Commission [6]—further underscore the urgency of integrating climate intelligence into housing finance and investment decisions. However, meaningful climate risk assessment requires not only forward-looking financial modeling but also spatially explicit, timely, and high-resolution data on how climate hazards are altering physical landscapes—particularly through land transformations that affect housing directly.
Conventional methods for monitoring environmental threats, such as manual interpretation of satellite imagery, periodic government surveys, or static GIS-based floodplain and fire zone maps, are often labor-intensive, coarse in resolution, and slow to update. These methods lack the spatial granularity and real-time responsiveness required to track the dynamic and localized land changes associated with environmental hazards. More importantly, they are often developed separately from financial studies, which makes it difficult to link evolving hazard exposure and land transformation with financial impacts on housing. This lack of connection between environmental monitoring and financial analysis slows down important, data-driven decisions in areas where rapid responses are critical.
In recent years, artificial intelligence (AI)—particularly when combined with remote sensing technologies—has emerged as a transformative force in hazard detection and land transformation monitoring [7]. Techniques such as deep learning, computer vision, and spatiotemporal modeling now enable automated extraction of environmental signals from large archives of satellite and aerial imagery. These AI-enhanced systems can detect, classify, and track the evolution of climate-related hazards—including flood inundation, wildfire progression, storm intensity, and shoreline retreat—with unprecedented speed, accuracy, and geographic scale. Critically, these models not only capture the presence of hazards but also reveal how these hazards are physically reshaping land in ways that impact housing exposure and financial vulnerability. This technological breakthrough opens the door to real-time, fine-grained hazard and land change monitoring directly relevant to housing markets.
AI-enhanced remote sensing may help financial institutions, insurers, and regulators identify and manage housing-related risks more effectively. By integrating AI-driven remote sensing with geocoded housing, mortgage, and insurance datasets, researchers and practitioners may more effectively map physical hazard exposure and quantify its financial implications. Predictive models trained on remote sensing data of land transformation, historical disaster impacts, and property-level financial outcomes may be used to inform scenario analysis, loan repricing, MBS stress testing, and climate-aligned portfolio management. These capabilities are increasingly vital—not only for internal risk assessment and asset valuation—but also for meeting external requirements related to climate risk disclosure, portfolio decarbonization, and community-level resilience planning. These emerging capabilities highlight the potential for a new generation of spatially explicit financial models that incorporate real-time environmental intelligence—particularly land transformation signals—derived from remote sensing. However, realizing this potential requires more than technical innovation—it calls for methodological integration across disciplines that have traditionally worked independently of one another.
Despite significant progress in the two domains—(1) assessing climate-related financial risks in housing markets, and (2) applying AI-driven remote sensing for hazard detection—there lacks effective integration between them, and a notable gap remains in integrative frameworks and cross-disciplinary reviews that connect these areas. Existing research often proceeds independently, with studies either advancing technical innovations in remote sensing for hazard mapping or conducting narrowly scoped financial analyses of climate vulnerability without using remote sensing data. Few efforts have systematically examined how AI-driven environmental intelligence—particularly land transformations resulting from hazards—can be integrated into financial decision-making processes to evaluate climate-induced risks in housing markets.
This review addresses the critical gap by synthesizing recent advances and limitations in assessing climate-related financial risks in housing systems, while also exploring the emerging potential of AI-driven remote sensing for hazard and land transformation monitoring. We highlight how time-series satellite data, machine learning (ML), and deep learning (DL) algorithms can generate high-resolution, dynamic hazard assessments—and how these tools can inform and improve climate-aware financial risk models in housing markets.
We begin by outlining our review methodology and introducing a conceptual framework that bridges climate hazard monitoring and housing finance. We then assess the current body of research on climate-related financial risks in housing markets, identifying key gaps in existing literature. Next, we examine studies using AI-driven remote sensing to detect and assess climate hazards, comparing their advantages and limitations with traditional financial risk assessment studies. Finally, we propose an integrative framework that embeds AI-enhanced remote sensing into financial modeling, emphasizing its potential to improve the accuracy, scalability, and equity of climate risk assessments in housing markets. We conclude by discussing major implementation challenges—including data misalignments, fragmented regulatory and behavioral datasets, and limited explainability in single-task AI models—and offer directions for future research to support more transparent, equitable, and climate-resilient housing systems.
2. Review Methodology and Conceptual Framework
2.1. Review Methodology
This review adopts a structured, interdisciplinary approach to examine the intersection of climate-related financial risk assessment in housing markets with climate hazard and land transformation monitoring via remote sensing. The literature was identified through comprehensive searches across major academic databases, including Google Scholar, Web of Science, Scopus, IEEE Xplore, ScienceDirect, and SSRN. Search queries combined keywords such as “climate risk”, “housing market”, “real estate”, “AI”, “remote sensing”, “machine learning”, “deep learning”, “environmental hazards”, “flood”, “hurricane”, “wildfire”, “sea-level rise”, and “financial risk”.
Studies were selected based on three main criteria, with inclusion granted if a study met at least one of them. First, some studies applied artificial intelligence or machine learning techniques with remote sensing data to detect, map, or model climate-related hazards—particularly those that result in observable land transformations such as flood inundation, wildfire burn scars, or shoreline retreat. Second, others focused on assessing climate-related financial risks in housing markets, using indicators like property values, mortgage performance, or insurance outcomes. Third, preference was given to studies that linked environmental exposure—including land-based indicators of hazard impact—to financial data or outcomes, helping to explain how physical climate risks can lead to financial vulnerability.
Given the rapid growth of research in the two closely related domains—AI-driven remote sensing for monitoring climate-related hazards and the assessment of climate-related financial risks in housing markets—it is not practical to cite all relevant studies across these expansive and fast-evolving fields. Instead, we present a representative selection of high-quality and influential publications, particularly from the period 2010 to 2025, that showcase key methodological innovations and span a variety of hazard types. By emphasizing studies that combine technical sophistication with thematic relevance, this review offers a balanced overview of current capabilities and emerging trends at the intersection of AI-enhanced environmental monitoring and financial risk assessment in housing markets.
It should be noted that this review does not follow the formal PRISMA (Preferred Reporting Items for Systematic Reviews and Meta-Analyses) protocol, as it is designed as a narrative, interdisciplinary synthesis rather than a systematic review aimed at quantitative meta-analysis. The decision not to adopt a PRISMA framework reflects this review’s primary objective—to integrate insights from two broad and multidisciplinary domains: remote sensing and housing finance. Achieving this objective required methodological flexibility and thematic synthesis rather than the exhaustive enumeration of studies based on narrowly defined inclusion criteria. Nevertheless, we employ a structured comparative meta-synthesis, systematically coding each study by hazard type, methodological approach, geographic scope, data integration, and principal findings. This process, supported by both backward and forward citation tracking, enables the identification of cross-cutting themes, methodological strengths and weaknesses, and research gaps. To enhance transparency and accessibility, the synthesis is presented through a thematic taxonomy, a systematic research gap map, and comparative methodology tables, which reveal patterns across disciplines while preserving methodological diversity. This approach offers a transparent and integrative framework for advancing interdisciplinary climate–housing market research.
2.2. Conceptual Framework
The conceptual framework guiding this review integrates two critical domains: AI-powered climate hazard and land transformation monitoring, and financial risk assessment in housing markets. As illustrated in Figure 1, the framework is designed to link hazard detection technologies with financial modeling to better assess climate-related risks in housing systems.
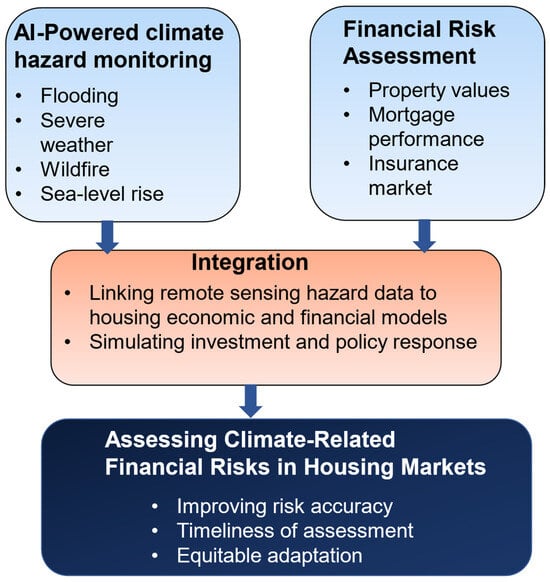
Figure 1.
The conceptual framework.
At the top of the framework, AI-enhanced remote sensing tools are used to detect key climate hazards—including flooding, severe weather, wildfires, and sea-level rise—by processing satellite imagery, radar data, UAV (Unmanned Aerial Vehicle) inputs, and other geospatial sources. These tools also capture the spatial and temporal dynamics of land changes triggered by such hazards, enabling a richer understanding of exposure and impact. This high-resolution environmental data is then aligned with housing-related financial indicators such as property values, mortgage performance, and insurance market metrics. Through this data integration, researchers may simulate how environmental shocks—along with the land alterations they produce—translate into financial impacts, from localized price drops to systemic risks in mortgage-backed securities and insurance portfolios.
The middle of the framework emphasizes the integration layer, where remote sensing outputs are linked to housing economic and financial models. This step allows for dynamic modeling of policy responses and investment risks based on real-time environmental exposure.
Importantly, the framework also accounts for factors that mediate financial outcomes beyond hazard exposure alone. These include socioeconomic vulnerability, behavioral responses (such as relocation and insurance adoption), and institutional factors like zoning laws and disclosure requirements. By embedding these variables, the framework supports a multiscale, interdisciplinary approach that reflects both physical and financial drivers of climate risk.
Ultimately, this conceptual framework highlights the importance of bringing together different fields of study. It shows AI-powered remote sensing, when combined with financial and behavioral data, can enhance the accuracy, timeliness, and fairness of climate risk assessments in housing markets.
To organize the large body of literature reviewed, this study introduces a clear classification framework. Figure 2 shows this thematic classification structure. The framework is based on two main dimensions: the type of climate hazard and the methodological approach used. The first dimension groups studies by the type of climate hazard they examine. These include flooding (both inland and coastal), wildfires (such as wildfire exposure or burn area mapping), severe weather events (including hurricanes, storms, and tornadoes), sea-level rise and coastal erosion (focusing on financial impacts such as property value loss), and multi-hazard or compound events (which involve multiple overlapping hazards). The second dimension distinguishes studies based on their methodological approach. Some studies use AI-driven remote sensing techniques, including machine learning or deep learning, to detect climate hazards or monitor land changes. Others rely on economic and financial models, such as hedonic pricing or econometric regression, to estimate how these hazards affect housing markets. A third group of studies combines both types of data and methods. These integrative or cross-disciplinary approaches explicitly connect remote sensing information with financial outcomes like mortgage performance, property values, or insurance claims.
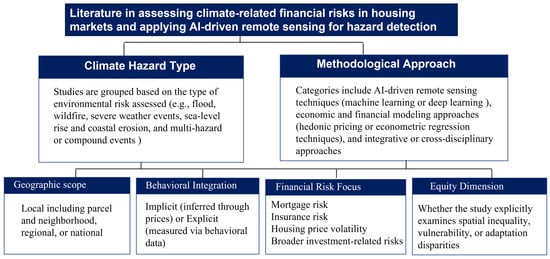
Figure 2.
A thematic classification framework for studies linking AI-enhanced remote sensing, climate hazards, and financial risk in housing markets.
To give the framework more depth, the literature is also classified in four additional ways. First, it considers geographic scale, whether studies focus on local (such as neighborhoods or parcels), regional, or national levels. Second, it considers whether behavioral information is included—either inferred indirectly from market prices or measured directly through sources such as surveys or search activity. Third, it classifies studies by their financial focus, including risks related to mortgages, insurance, housing price volatility, or broader investment concerns. Finally, the framework notes whether a study includes equity considerations, such as how climate risks or responses differ across social groups or places. This classification framework helps make sense of the diverse research landscape. It supports clearer comparisons between studies and highlights where more work is needed. It also shows where new interdisciplinary approaches could improve our understanding of climate-related financial risks in housing markets.
3. Empirical Insights on Climate Risk Impacts in Housing Markets and Financial Systems
Many studies have shown that climate-related hazards have strong effects on housing markets and financial systems (Figure 3). Flooding is one of the most well-studied hazards [8,9,10,11,12,13,14,15,16,17,18,19,20,21,22,23,24,25]. Properties in designated flood zones often sell for less. After flood events or new flood-risk disclosures, home prices tend to fall. These price drops are often temporary and fade over time as public attention to the risk decreases [8,9,10,11,12,13]. Research also shows that flood-prone areas are more likely to be home to financially vulnerable households. This creates added concerns around housing affordability and credit risk [14,15]. In many markets, flood risk is still underpriced. Incomplete disclosure, low insurance coverage, and limited public understanding contribute to this problem. These issues reduce financial resilience and increase instability in housing markets [16,17,18,19].
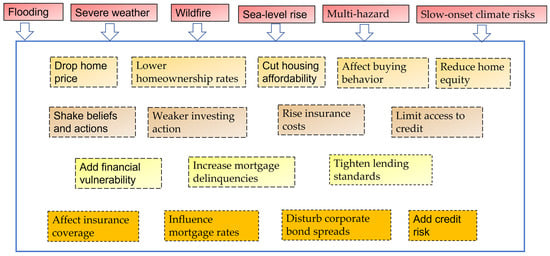
Figure 3.
Impacts of Climate-Related Hazards on Housing Markets and Financial Systems.
Beyond floods, researchers have studied how severe weather—like hurricanes and tornadoes—affects home prices [26,27,28,29,30,31,32,33,34,35,36,37,38,39]. These events usually lead to sharp price drops, due to both damage and increased awareness of risk [26,27,28,29,30]. The effects can last longer in low-income neighborhoods and in places where people were not expecting risk [31,32]. Severe weather also changes how investors act. It can reduce the number of sales, increase demand from wealthier buyers, and affect returns in commercial property markets [33,34,35]. Some events—like Hurricane Sandy—even changed house prices in areas that were not directly affected, simply by changing how people viewed climate risks [36]. Evidence from tornado-prone areas shows that people adjust their buying behavior even for rare but extreme threats [37].
The impact of wildfire risk on housing finance has been widely studied [40,41,42,43,44,45,46,47,48,49]. Research shows that being close to burn zones and increased awareness of wildfire danger both lead to lower property values. The impact becomes stronger when wildfires happen repeatedly [40,41,42,43]. Public information and visible damage influence how housing buyers behave. However, many buyers are still unaware of wildfire risks when they purchase a home [44,45]. The effect of wildfires also depends on the community. Some areas experience larger drops in housing prices or more price instability [46]. In the short term, wildfires can change housing demand. Buyers may start to prefer homes with fire-resistant features [47,48]. At the same time, rising insurance costs and non-renewals in fire-prone regions are putting financial pressure on households and real estate markets. Still, some targeted fire prevention efforts may help reduce these risks [49].
Sea-level rise is another major climate threat to the housing market [50,51,52,53,54,55,56,57]. Many studies have shown that homes located near coastlines with long-term flood risk tend to sell for less, particularly in areas such as North Carolina and Miami-Dade County in the US [50,51]. These price effects are often driven by buyers who are more informed and cautious. Meanwhile, wealthier homeowners or those buying second homes often delay their response, which slows down broader market changes [52,53]. Some markets are beginning to show signs of adjusting to sea-level risk, such as slower price growth or falling values [54]. But this is not true everywhere. High-value, high-risk areas like Miami Beach in the US still show little price decline [55,56]. Political views also play a role. Households that are skeptical about climate change are more likely to stay in at-risk areas, which slows down adaptation and increases financial vulnerability [57].
Climate risk is becoming a growing part of the housing finance system [58,59,60,61,62,63,64,65,66,67,68,69,70,71,72,73,74,75,76,77,78,79,80,81,82,83,84,85,86,87,88,89,90,91,92,93,94,95,96,97,98]. Studies show that natural disasters can increase mortgage delinquencies, reduce home equity, and limit access to credit [58,59,60,61,62]. In response, lenders often raise payment requirements, tighten lending standards, or shift risk through securitization—especially in areas with high climate exposure [63,64,65,66]. Insurance markets also face challenges such as low enrollment, adverse selection, and disaster aid that favors wealthier homeowners [67,68,69,70,71]. Risk misperception, social factors, and financial hardship further weaken insurance coverage [72,73,74]. Some lenders and investors are starting to factor in climate risks when setting mortgage rates or corporate bond spreads. However, this pricing is still uneven across regions and financial institutions [75,76,77,78]. In commercial real estate, hazard exposure increases default risk and makes property valuation more difficult [79,80,81]. Still, deeper integration of climate risk into financial systems is limited by inconsistent regulations, poor data, and weak methods [82,83,84]. Many scholars call for better tools, such as forward-looking credit models, climate-adjusted valuation methods, and stress tests [85,86,87,88].
Beliefs and behavior also matter [99,100,101,102,103,104,105,106,107,108]. How people view climate risk influences their housing and financial decisions. But many homeowners still underestimate the dangers of floods or sea-level rise. This leads to low insurance uptake and overvalued homes in high-risk areas [99,100,101]. Large disasters or updated flood maps can change people’s beliefs and affect prices [102]. However, these changes often depend on local culture and social influence [103,104]. Investment in protective infrastructure can increase property values [105]. Still, many people continue moving into risky areas without fully understanding the long-term dangers [106]. Differences in beliefs also affect borrowing behavior. Pessimistic buyers tend to borrow more, while lenders may reduce credit when worried about climate risk [103,107].
Finally, broader research shows that multi-hazard and slow-onset climate risks—like drought, erosion, and temperature swings—can harm housing markets over time [109,110,111,112,113,114,115,116,117,118]. These risks are linked to falling property values, lower homeownership rates, and weaker investment returns [109,110,111,112]. Many studies also highlight how local perceptions of risk, social vulnerability, and regional capacity to adapt influence outcomes. In some places, this leads to climate gentrification or investors pulling out [113,114]. New research suggests that property valuation is beginning to include long-term climate concerns by using climate-adjusted discount rates [115]. However, meta-analyses show ongoing gaps in local data, sector-specific risk models, and frameworks that connect different types of risk—especially for commercial and low-income housing [116,117,118].
In summary, the growing body of research clearly shows that climate-related hazards have serious impacts on housing markets and financial systems. As summarized in Table 1, various climate risks—such as floods, wildfires, storms, sea-level rise, and slow-onset hazards—affect property values, mortgage performance, insurance markets, and investor behavior. These effects can shift capital flows, reduce housing affordability, and increase the risk of broader financial instability. To respond effectively, there is a pressing need for more detailed and forward-looking climate risk assessments. These assessments require high-resolution, real-time environmental data to improve the accuracy and granularity of financial risk models.

Table 1.
Empirical studies on climate-related risks affecting housing markets and financial systems.
4. Limitations in Assessing Climate-Related Financial Risks in Housing Markets
The literature on assessing climate-related financial risks in housing markets, while growing in scope, exhibits several critical limitations that show the need for integration with AI-enhanced remote sensing technologies for hazard monitoring. A primary shortcoming is the narrow geographic and hazard-specific focus of many empirical studies. Research across different climate hazards—including floods, wildfires, hurricanes, and sea-level rise—tends to rely heavily on localized, single-event case studies, thereby limiting the generalizability and scalability of findings. For example, flood risk analyses often center on specific counties in the US such as Alachua, Florida [8] and Pitt County, North Carolina [26]. Similarly, wildfire studies have focused on isolated regions such as Colorado Springs [44] or Los Angeles County in the US [41], while sea-level rise assessments are typically confined to selected coastal areas [50,52]. Hurricane-related studies also remain geographically constrained, as illustrated in work focused on discrete metropolitan areas [27,28]. Even meta-analyses, such as Beltrán et al. [22], tend to reinforce this fragmentation by synthesizing largely US-based, hazard-specific findings. This fragmented empirical base hinders the development of transferable models and reduces the policy relevance of climate risk research at national or global scales. Moreover, spatial exposure is often defined at coarse administrative levels (e.g., ZIP codes or counties), failing to capture parcel-level heterogeneity that determines actual household risk. Many studies also exclude slow-onset or compound hazards (e.g., droughts coupled with fire risk), which further narrows the scope of analysis. To overcome this limitation, AI-enhanced remote sensing may offer a compelling solution by enabling consistent, high-resolution monitoring of diverse climate hazards across wide geographies and timeframes, thus facilitating more scalable, integrated, and policy-relevant housing financial risk assessments.
A second critical limitation in the literature concerns behavioral and informational gaps. Homebuyers often lack full awareness of environmental risks at the time of property purchase, and most empirical studies infer risk perceptions indirectly through observed price effects rather than measuring them directly. For instance, flood risk perception is commonly inferred in studies such as Bin and Landry [10] and Atreya et al. [99], while research on wildfires and sea-level rise—such as Mueller et al. [41], Champ et al. [45], and Bernstein et al. [52]—typically relies on physical proximity or hazard exposure proxies without capturing actual risk awareness or behavioral responses. This limits our ability to distinguish between informed adaptation and inadvertent risk-taking. Furthermore, existing literature rarely incorporates real-time hazard information dissemination (e.g., climate dashboards, warning systems) or public engagement factors that shape household decision-making under uncertainty. AI-driven remote sensing visualization tools, when integrated with housing transaction data and public communication platforms, offer the potential to generate real-time, spatially explicit climate risk maps that may enhance public awareness and provide a richer empirical foundation for modeling behavioral responses.
From a methodological perspective, the widespread reliance on hedonic pricing models introduces structural constraints in evaluating climate-related financial risk. These models frequently assume static hazard boundaries, binary exposure classifications, rational expectations, and fully efficient markets—assumptions that may not hold under dynamic and evolving climate conditions. For example, studies like Daniel et al. [23] and Bin et al. [50] often use floodplain designations or elevation-based thresholds to represent flooding risk, which may not reflect current or projected hazard realities. Similarly, Hallstrom and Smith [27] infer behavioral shifts from observed price changes without accounting for direct perception data or adaptive measures. Such modeling frameworks are limited in their capacity to capture nonlinear effects, systemic interactions, or shifts in long-term risk salience. In contrast, AI-enhanced remote sensing provides a more adaptive and multidimensional approach. By integrating satellite imagery, UAV data, and socioeconomic indicators, AI models can detect the evolution of environmental hazards in near real time and dynamically link them to financial outcomes. These models can continuously ingest new data, track localized variations in hazard intensity, and adjust for spatial and temporal changes in exposure. When combined with financial and behavioral data, they can simulate valuation impacts, identify emergent risk hotspots, and anticipate behavioral shifts, such as relocation or insurance dropouts, before such responses are reflected in market prices.
Another major limitation in the existing literature is the lack of temporal continuity in the assessment of climate-related risks. Most studies adopt static or event-based approaches—typically comparing pre- and post-disaster periods—without accounting for the gradual progression of environmental hazards or the cumulative nature of market responses over time. For instance, Bin et al. [50] use elevation data to evaluate sea-level rise risk, yet do not incorporate projections of future land development or dynamic exposure patterns. Similarly, Ewing et al. [28] examine hurricane impacts using short-term post-event windows, which may overlook lagged or compounding financial effects. This short-term framing limits the capacity for early warning and obscures the persistent, chronic nature of many climate-related risks. Moreover, studies such as Botzen et al. [108] and Stetler et al. [42] highlight how formal risk designations can lag behind actual environmental exposure due to ongoing climate shifts and land use changes, further compounding informational delays. In contrast, AI-based remote sensing technologies facilitate continuous environmental monitoring—capturing real-time variations in land cover, vegetation stress, hazard extents and intensities. These capabilities enable dynamic, high-frequency risk assessment that aligns more closely with the evolving nature of climate threats and provides a more robust foundation for forward-looking financial analysis and policy intervention. They also support predictive modeling that incorporates both historical hazard trajectories and forecasted risk pathways, enabling financial institutions to implement more responsive risk mitigation strategies.
In addition, the literature largely lacks integrated, multiscale frameworks that link climate-related hazards to systemic financial outcomes. While many studies offer important insights—such as estimating housing price effects—they rarely extend to tracing how environmental risks propagate through interconnected mortgage markets, insurance portfolios, or institutional investment systems [41]. For example, Brunetti et al. [82] underscore that systemic risk modeling remains conceptually underdeveloped and insufficiently linked to asset-level hazard data, leaving critical blind spots in regulatory and institutional frameworks. Craig [84] likewise demonstrates that flood risk poses escalating threats to the US housing finance system, yet emphasizes that fragmented data and a lack of cross-layer modeling prevent a full understanding of financial system vulnerabilities. Although these gaps do not reflect shortcomings of these individual studies, they highlight a broader need for integrated, cross-disciplinary approaches. Moreover, there is a lack of simulation tools to assess cascading effects, such as how increased defaults might influence secondary mortgage markets or municipal bond ratings. AI-enhanced remote sensing can help address this need by enabling the integration of geospatial, financial, and demographic data to detect interdependencies, simulate cross-sector feedback loops, and support proactive, system-wide climate risk management and policy coordination.
Finally, equity considerations remain underexamined in the climate-finance literature. Many studies rely on aggregated demographic proxies that obscure the disproportionate burdens faced by low-income, minority, or tenant populations. For instance, Troy and Romm [9] use zip code–level indicators, while Champ et al. [45] depend on retrospective surveys that lack socioeconomic granularity. Similarly, Votsis and Perrels [119], and Yi and Choi [13], infer distributional consequences based on housing market trends, and do not directly measure household-level vulnerability or adaptive capacity. These limitations hinder the development of equitable climate adaptation and financial resilience strategies. When combined with disaggregated socioeconomic and housing data, AI-enhanced remote sensing can enable fine-grained vulnerability assessments and support more inclusive and equitable climate risk management policies. This includes identifying adaptation gaps across neighborhoods, detecting who is left uninsured or undercompensated after disasters, and guiding the spatial targeting of subsidies or infrastructure upgrades.
Table 2 highlights key limitations in the current literature on assessing climate-related financial risks in housing markets. These gaps—ranging from coarse spatial resolution and static hazard assumptions to inadequate treatment of behavioral and systemic feedback—emphasize the urgent need for new analytical tools. Integrating AI-enhanced remote sensing into climate hazard monitoring may offer a powerful way forward. By combining remote sensing and financial data with advanced AI models, researchers and policymakers may overcome persistent spatial, temporal, and behavioral blind spots. This integration may enable more accurate assessments of how climate hazards impact property values, credit markets, insurance systems, and broader financial stability. Ultimately, it may help shift the approach to understanding and managing climate-related financial risks in the housing sector toward one that is more dynamic, responsive, and equitable.
Table 2.
Summary of limitations of the literature in assessing climate-related financial risks in housing markets.
5. Current Research on AI-Driven Remote Sensing for Climate Risk and Impact Analysis
Remote sensing technologies—when integrated with machine learning and deep learning techniques—offer a transformative opportunity for real-time, multi-scale assessment of environmental exposure and housing market vulnerability. Figure 4 presents an overview of remote sensing imagery types and machine learning/deep learning approaches in climate–housing market research. These AI-driven remote sensing approaches can process vast volumes of satellite imagery (e.g., from Landsat, Sentinel, MODIS, Planet, and Maxar) to detect, classify, and monitor climate hazards—such as flooding, wildfires, sea-level rise, and land subsidence—along with their associated land transformations, with high spatial accuracy and temporal continuity. In fact, an extensive and rapidly growing body of research has demonstrated the effectiveness of AI-driven remote sensing in capturing complex environmental signals and supporting predictive hazard and impact modeling. In the following subsections, we review and synthesize recent advances in this literature grouped by hazard type, highlighting how AI-driven remote sensing is being applied to monitor and assess major climate-related hazards and their implications for land and housing systems.
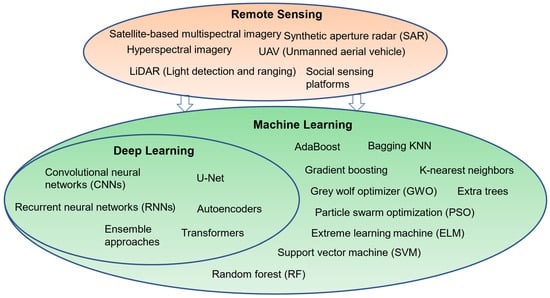
Figure 4.
Overview of remote sensing imagery types and machine learning/deep learning approaches in climate–housing market research.
For flood monitoring, deep learning models such as convolutional neural networks (CNNs), U-Net, autoencoders, and ensemble approaches have shown strong performance [120,121,122,123,124,125,126,127,128,129]. These models support flood susceptibility analysis, extent mapping, and damage detection using data from SAR, DEMs, Sentinel-1 and -2 imagery, UAVs, and social sensing platforms. Real-time radar and optical imagery improve flood detection in complex urban or vegetated areas [130,131]. Machine learning algorithms—such as Random Forest (RF), Support Vector Machine (SVM), Extreme Learning Machine (ELM), and Gradient Boosting—are widely used for different types of floods, including urban, riverine, and coastal flooding [132,133,134,135,136,137,138,139,140,141]. These models incorporate both geophysical and socio-climatic variables, such as elevation, slope, rainfall, land use, and impervious surfaces [142,143,144]. Ensemble techniques—including Grey Wolf Optimizer (GWO), Particle Swarm Optimization (PSO), and Bagging KNN (short for Bootstrap Aggregating with K-Nearest Neighbors)—further enhance predictive accuracy [145,146,147,148,149]. Physics-informed deep learning and explainable AI methods improve model transparency and better capture flood hydrodynamics [150,151]. GIS-based flood inventories are especially useful for flood risk modeling in regions with limited data [152,153,154]. Compound hazard models have been developed to analyze the combined effects of fluvial, pluvial, and coastal flooding [155,156]. Time-series SAR data and rainfall indices like CHIRPS (Climate Hazards Group InfraRed Precipitation with Station data) help track the evolution of flood events over time [157,158,159,160].
In the area of severe weather, AI-driven remote sensing has significantly improved real-time monitoring of hurricanes, cyclones, thunderstorms, and extreme rainfall [161,162,163,164,165,166,167,168,169,170,171,172,173,174,175,176,177,178,179,180,181,182,183,184,185,186,187,188,189,190,191,192]. Deep learning models, such as CNNs, transformers, and hybrid CNN-GRU architectures, are widely used to process satellite, radar, and microwave imagery. These models help estimate storm intensity, rainfall levels, and wind impacts [161,162,163,164,165,166,167,168,169,170,171,172,173,174]. Post-disaster assessments use deep learning techniques such as transfer learning and semi-supervised models to detect structural damage from aerial and satellite imagery [175,176,177,178,179,180,181,182,183]. Social sensing—using geo-tagged tweets and crowd-sourced photos—provides additional ground-level information to support validation [184,185]. Researchers also use ensemble modeling approaches to estimate structural exposure and vulnerability of severe weather [186,187,188]. Large-scale datasets like SEVIR (Storm Event Imagery for Visual Interpretation and Recognition) and IMERG (Integrated Multi-satellite Retrievals for GPM) enable multi-sensor learning and model training at a large scale [189,190,191]. Together, these tools provide important insights into increasing atmospheric volatility and the associated risks for housing markets [192].
In wildfire monitoring, deep learning and machine learning techniques are widely used for mapping fire susceptibility, classifying burned areas, and modeling fire progression [193,194,195,196,197,198,199,200,201,202,203,204,205,206,207,208,209,210,211,212,213,214,215,216,217,218,219,220,221,222,223,224,225,226,227]. Architectures such as U-Net, ConvLSTM, transformers, and CNN-based ensemble models have been successfully applied to multi-sensor satellite imagery [193,194,195,196,197,198,199,200,201,202,203,204,205,206]. Machine learning models such as RF, XGBoost, and SVM are commonly used to assess wildfire risk based on climatic, topographic, and vegetation features [207,208,209,210,211,212,213,214,215,216,217,218,219,220,221,222]. Advanced fire detection methods now combine hyperspectral imaging, UAV surveillance, and hybrid early warning systems to improve speed and accuracy [201,219,220,223]. Recently, a growing number of studies have used AI-driven remote sensing to evaluate wildfire risks to housing markets. These include mapping the wildland-urban interface, assessing property-level exposure, and identifying structural vulnerabilities [224,225,226,227].
Sea-level rise (SLR) monitoring uses deep learning in combination with remote sensing data, such as satellite altimetry, InSAR, GNSS, and satellite-derived bathymetry, to track coastal erosion, shoreline change, and land subsidence [228,229,230,231,232,233,234,235,236,237,238,239,240,241,242,243]. Shoreline change and erosion are often analyzed using CNN-based models for semantic segmentation and classification [244,245,246,247,248,249,250,251]. Correcting for vertical land motion using GNSS and SAR is essential for producing accurate projections of future vulnerability [252,253,254,255,256]. Cloud-based tools such as Google Earth Engine make large-scale sea-level rise assessments more efficient and accessible [257,258]. Finally, spatiotemporal models and neighborhood-scale exposure mapping improve the precision of housing vulnerability assessments in coastal regions [259,260,261].
AI-driven remote sensing is increasingly used to monitor multiple environmental hazards and assess their disaster impacts, offering integrated insights into floods, wildfires, landslides, and earthquakes [7,262,263,264,265,266,267,268,269,270,271,272,273,274,275,276]. Machine learning models such as RF, Gradient Boosting, AdaBoost, and SVM have been used to create multi-hazard susceptibility maps. These tools help support spatial planning and housing risk management across regions [258,262,263,264,265,266,267,268]. Recent advances in deep learning—including CNNs, transformers, and cascaded CNN-RNN models—have improved the detection of multiple hazards and the analysis of structural damage using UAV and satellite imagery [7,269,270,271,272]. Several literature reviews highlight the growing use of these AI tools for modeling disaster resilience, forecasting hazards, and supporting urban sustainability strategies [7,273,274,275,276].
Table 3 summarizes studies that use AI-driven remote sensing to detect climate-related hazards and assess their impact, grouped by hazard type. Together, these studies provide a valuable foundation for linking remote sensing technologies with economic and financial models of housing market risk. By capturing both the occurrence of hazards and the land transformations they induce, AI-driven remote sensing methods help address spatial, temporal, and systemic gaps—enabling more accurate, adaptable, and equitable assessments of financial risks as climate change intensifies.
Table 3.
Summary of AI-driven remote sensing studies for climate-related hazard detection and impact assessment, grouped by hazard type.
Although AI-driven remote sensing has brought powerful advances in detecting and mapping climate-related hazards, it has notable limitations when applied to financial risk assessment in housing markets. The existing AI-driven remote sensing studies mainly focus on physical exposure, such as flood zones, wildfire areas, or eroding coastlines, using satellite imagery, radar, and other sensors e.g., [228,257,258,262]. While this provides high spatial and temporal detail, it rarely connects with financial data such as mortgage performance, credit scores, or insurance claims [86,277]. Moreover, although many of these studies capture visible changes in the land surface caused by hazards, they often do not explicitly frame these changes as land transformations with financial consequences. As a result, these tools are not yet equipped to model how climate risks affect lending, insurance, or investments. They also tend to overlook how households respond to risks. Unlike economics studies that use surveys or behavioral models, remote sensing work often misses critical factors like relocation decisions, insurance uptake, or income-based vulnerability. In addition, key institutional elements—like FEMA (Federal Emergency Management Agency) flood maps, zoning laws, and climate disclosure rules—are rarely built into remote sensing models, though they play a big role in shaping housing market responses [18,278,279].
Another major gap is the limited ability of remote sensing studies to estimate financial impacts, such as changes in housing prices or loan performance. These studies often stop at identifying exposure and do not model how risk affects property values, returns, or financial portfolios. In contrast, economics research uses tools like hedonic pricing or difference-in-differences (DID) regression models to directly estimate these effects [27,50]. Also, many AI-driven remote sensing models lack transparency. Deep learning models are often “black boxes” with outputs that are hard to interpret, making them less useful for regulators or financial analysts who need clear, auditable results. In contrast, economic models offer more explainable, theory-based structures.
Table 4 compares AI-based remote sensing studies with traditional economics and finance studies in assessing climate risks to housing markets. Remote sensing studies focus on mapping physical hazards using satellite data, offering high-resolution and real-time monitoring—particularly of hazard-induced land transformations. In contrast, economics studies focus on pricing, credit risk, and systemic effects, using financial data like mortgages and insurance claims. Remote sensing lacks behavioral and financial integration, while economics studies often miss spatial and temporal detail. Each approach has unique strengths and policy relevance, highlighting the need for combining both to improve risk assessment.
Table 4.
Comparison of AI-based remote sensing and traditional economic studies in assessing climate risks to housing markets.
6. Integrating AI-Enhanced Remote Sensing into Housing Market Climate Risk Assessment
6.1. Current Status of AI-Driven Remote Sensing in Housing Finance Research
Although AI-driven remote sensing provides innovative capabilities for climate hazard detection, its application to assessing climate-related financial risks in housing markets remains limited compared to traditional economics and finance approaches. Very few remote sensing studies directly link hazard detection results—or the associated land transformations—to housing market indicators such as property prices, mortgage performance, insurance liabilities, or investment risks. Notable exceptions include Bency et al. [280], who utilized CNNs on satellite imagery to predict housing prices more effectively than spatial autoregressive models across several UK cities. Yao et al. [281] integrated high-resolution satellite imagery with social media data to accurately map urban housing prices in Shenzhen, China. Additionally, Serdavaa [282] employed deep learning and satellite image analysis to evaluate Mongolia’s affordable housing mortgage program, illustrating a rare integration of remote sensing and macro-financial policy assessment.
Although recent studies in housing finance increasingly apply AI techniques, most rely on structured datasets, such as property transactions or conventional housing indicators, rather than incorporating remote sensing data. Empirical studies such as Choy and Ho [283] applied machine learning methods including Extra Trees, k-Nearest Neighbors, and Random Forest solely using structured property data. Similarly, Dimopoulos and Bakas [284] conducted sensitivity analyses of machine learning models for mass real estate appraisal in Cyprus without incorporating environmental hazard data. Tchuente and Nyawa [285] emphasized geocoding and machine learning for estimating real estate prices in French cities, again excluding remote sensing inputs. Jui et al. [286] used macroeconomic and housing market indicators to develop predictive models for negative equity trends in US housing markets, and Zhou et al. [287] leveraged deep learning on textual rental listings to forecast rents in Atlanta. Other empirical research like Wei et al. [288], Singireddy [289], Park and Bae [290], and Sadhwani et al. [291] applied advanced AI methods for broader financial risk prediction or insurance analytics but did not integrate remote sensing-derived environmental data. Separately, several review studies have explored machine learning applications broadly in housing finance without a specific focus on remote sensing. For instance, Tekouabou et al. [292] systematically surveyed AI and machine learning methods for urban real estate prediction, highlighting methodological advances but not addressing environmental data usage from remote sensing. Kuppan et al. [293] reviewed AI applications for insurance analytics and financial risk prediction, further underscoring this disciplinary separation.
This review reveals that while AI-enhanced remote sensing has rapidly advanced the detection and mapping of climate-related hazards, its integration into financial risk assessment for housing markets remains incomplete and fragmented. Many AI models—particularly deep learning architectures such as convolutional neural networks—deliver high predictive accuracy for hazard segmentation but often lack interpretability, making them challenging to embed in policy, insurance underwriting, and mortgage risk frameworks where transparency is essential. In contrast, econometric approaches grounded in hedonic pricing, spatial econometrics, or panel regression offer greater theoretical interpretability but struggle to process high-dimensional remote sensing data or capture nonlinear hazard–market relationships. This methodological divide has resulted in two parallel research streams with limited cross-fertilization. Hybrid approaches, such as integrating XGBoost with spatial lag models or coupling convolutional feature extraction with causal inference frameworks, remain rare despite their potential to balance predictive performance and explanatory clarity. Table 5 presents a comparative overview of AI and econometric approaches in climate–housing market research.
Table 5.
Comparison of AI and Econometric Approaches in Climate–Housing Market Research.
Beyond methodological divides, the reviewed literature often overlooks the behavioral and socioeconomic heterogeneity that shapes housing market responses to climate risk. Many models implicitly assume homogenous homeowner responses, neglecting differences in income, education, information access, and vulnerability that influence relocation decisions, insurance uptake, and investment behaviors. This omission not only constrains the realism of financial risk forecasts but also limits their ability to address equity concerns. Incorporating behavioral data—via surveys, social media analytics, search trends, or mobility tracking—can help capture these variations, enabling more dynamic and equitable modeling of climate–housing interactions.
Another critical gap lies in the integration of multi-source datasets across physical, financial, and behavioral domains into a unified modeling pipeline. Current AI applications tend to specialize in one domain—hazard detection or financial forecasting—but rarely both. Developing multi-task or transfer learning frameworks that can jointly learn from satellite imagery, economic time series, and behavioral indicators could significantly enhance both forecasting accuracy and policy relevance. However, achieving this requires overcoming data harmonization challenges, addressing computational constraints, and ensuring that outputs are explainable to stakeholders.
Finally, there is a need for systematic, comparative evaluation of AI and econometric methods not only in terms of predictive accuracy but also interpretability, scalability, and suitability for decision-making under regulatory and equity considerations. By explicitly addressing these trade-offs, future research can deliver tools that are both scientifically robust and practically actionable—bridging the current gap between technical innovation and real-world climate resilience in housing markets.
Figure 5 presents a systematic research gap map that synthesizes the current state of knowledge, highlights critical research gaps, and outlines promising directions for future investigation at the intersection of AI-driven remote sensing, econometric housing market modeling, and climate-related financial risk assessment. This map was developed through a multi-stage process that integrated insights from the structured literature review, the thematic classification framework (Figure 2), and the comparative methodological critique presented in the discussion section.
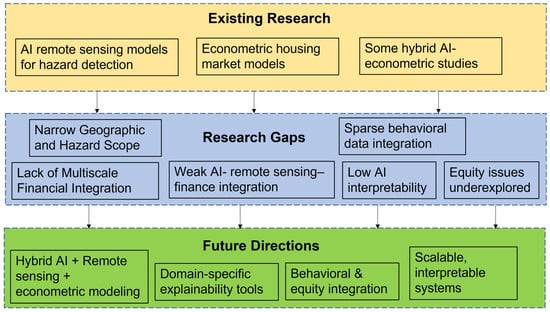
Figure 5.
The Systematic Research Gap Map.
The systematic research gap map synthesizes the current state of knowledge, key limitations, and future priorities in linking AI-driven remote sensing, econometric housing market models, and climate-related financial risk assessment. Existing research is dominated by three strands: AI-based hazard detection, which offers strong spatial feature extraction but limited financial integration; econometric housing market models, which provide interpretable, theory-grounded risk assessments but lack AI’s computational and spatial depth; and a small number of hybrid approaches that attempt to combine both strengths. Across these strands, recurring gaps include narrow geographic and hazard coverage, weak multi-scale financial integration, limited connection between AI hazard outputs and financial modeling, sparse use of behavioral and socioeconomic data, low AI interpretability, and insufficient attention to equity. Addressing these gaps calls for hybrid AI–econometric frameworks, domain-specific explainability tools, systematic behavioral and equity integration, and the development of scalable, interpretable systems that can meet the needs of policymakers, financial institutions, and vulnerable communities.
6.2. A Framework for Using AI-Enhanced Remote Sensing in Housing Market Climate Risk Analysis
6.2.1. Overall Framework
Despite the transformative potential of integrating remote sensing with housing finance research, the literature continues to lack comprehensive links between financial market variables and environmental hazard detection—particularly the land transformations captured through remote sensing. Addressing this gap requires standardized methodologies, enhanced data access, and interdisciplinary collaboration between remote sensing experts and financial economists.
We propose a framework of integrating AI-enhanced remote sensing with financial econometrics to develop more holistic, predictive, and policy-relevant assessments of climate-related financial risk in housing market. Figure 6 illustrates the proposed framework, which consists of three tiers—Data Acquisition and Integration, Integrative Financial Risk Modeling, and Outputs and Decision Support.
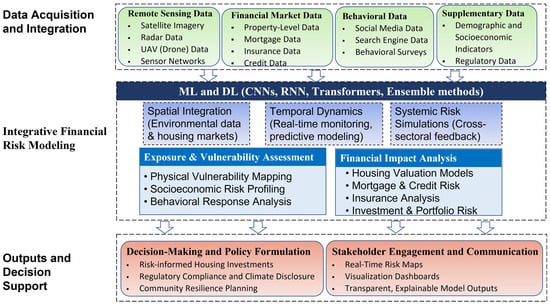
Figure 6.
A framework for using AI-enhanced remote sensing in housing market climate risk analysis.
At the foundational level, the framework begins with multi-source data acquisition. This includes various remote sensing data, such as satellite imagery (e.g., Landsat, Sentinel, MODIS), radar (SAR, InSAR), UAV (drone) data, and sensor networks, capturing geospatial features and land transformations caused by environmental hazards. These are combined with financial datasets covering property prices, mortgage defaults, insurance claims, and credit scores, behavior data, as well as supplementary data including demographic and socioeconomic indicators, and regulatory context (e.g., FEMA flood maps, zoning laws).
Building on a rich foundation of multi-source data, the integrative modeling layer serves as the analytical core of the framework—linking AI-enhanced remote sensing with financial econometrics to assess climate-related risks in housing markets. This layer employs advanced machine learning and deep learning techniques, such as CNNs, recurrent neural networks (RNNs), transformers, and ensemble models, not only to detect and classify environmental hazards like floods, wildfires, coastal erosion, and hurricanes, but also to connect these hazards and their associated land surface changes to spatial and financial datasets relevant to housing markets. By enabling the spatial integration of georeferenced hazard data with localized housing indicators, this layer supports the dynamic tracking of climate exposure over time. It further incorporates temporal modeling for near-real-time monitoring and predictive forecasting. Systemic simulations are also embedded to trace cascading effects across sectors—for instance, how recurrent flooding could simultaneously lower property values, increase mortgage default risk, reduce local tax bases, and destabilize insurance portfolios. This integrative modeling layer divides into two key analytical components. The Exposure and Vulnerability Assessment module evaluates physical hazard exposure (e.g., distance to floodplains), socioeconomic sensitivity (e.g., income, tenure type), and behavioral factors (e.g., relocation trends, insurance uptake). The Financial Impact Analysis module translates these risk signals into economic consequences using housing valuation models (e.g., hedonic regression, AI-based price prediction), credit and mortgage risk tools (e.g., default probability and credit scoring), insurance analytics (e.g., claims forecasting, premium adjustment), and portfolio-level risk metrics. Collectively, these interlinked components form the foundation of integrated financial risk modeling that aligns environmental hazard monitoring—and their associated land transformations—with housing market dynamics.
The final tier of the framework centers on Outputs and Decision Support. This layer delivers real-time risk maps, interactive dashboards, and visualizations designed for use by households, lenders, investors, and policymakers. These tools help users understand which properties or neighborhoods face the greatest climate-related risks. They also support faster decision-making during emergencies or investment planning. The framework also includes transparent modeling tools that assist with regulatory compliance and climate-related financial disclosures. These tools help financial institutions and government agencies meet new climate reporting standards and evaluate risk more clearly. In addition, the framework generates evidence-based recommendations that support community resilience planning. These recommendations can guide zoning policies, infrastructure investments, and insurance programs, especially in vulnerable areas. By linking remote sensing technologies with detailed financial and institutional data, this framework moves beyond static or one-time risk assessments. Instead, it enables ongoing, dynamic monitoring of climate risk and its financial consequences—including those mediated through hazard-induced changes to the physical landscape. This approach helps create more equitable and forward-looking financial systems that respond better to the growing impacts of climate change on housing markets.
To complement the conceptual framework in Figure 6, Figure 7 presents a detailed operational workflow that illustrates how remote sensing–based hazard detection is technically integrated into climate-related financial risk modeling for housing markets. The workflow begins with multiple data sources—including satellite imagery, financial market data (e.g., mortgage and insurance records), and supplementary datasets such as behavior data, zoning laws and socioeconomic indicators. AI models (e.g., CNNs, U-Net, Transformers) process the remote sensing inputs to generate hazard maps, exposure scores, and severity metrics that reflect both hazard presence and landscape-level transformations. These outputs are then linked to geocoded financial data through spatial joins and feature engineering (e.g., calculating distance to hazard, historical exposure frequency). The integrated data feeds into a suite of econometric and machine learning models—ranging from hedonic pricing and DID regressions to deep learning models like LSTMs and XGBoost—tailored for predicting outcomes such as property value loss, loan default risk, and insurance uptake. The workflow concludes with a model validation and calibration phase, incorporating techniques such as cross-validation, SHAP values, and backtesting. Outputs support decision-making through property-level risk scores, climate-adjusted loan pricing, and risk layer dashboards for investors, regulators, and planners.
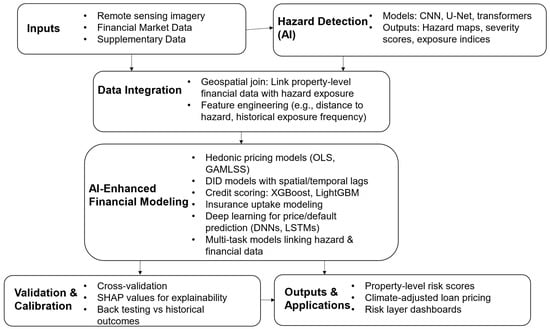
Figure 7.
Operational workflow for remote sensing–enhanced climate risk modeling in housing finance.
6.2.2. Integrating Behavioral Data for Improved Climate Risk Assessment
A critical limitation of current climate-related financial risk assessments in housing markets is the indirect inference of homeowner risk perceptions through property prices. While housing prices offer implicit signals regarding perceived environmental risks, they typically fail to fully capture the complex behavioral dynamics underlying homeowner and market responses to climate hazards. To address this gap, explicit incorporation of behavioral data from nontraditional sources has become an increasingly promising area of research, offering the potential to significantly enhance the responsiveness, equity, and accuracy of financial risk assessment models.
Behavioral data includes information directly reflecting homeowners’ risk perceptions, decision-making processes, and adaptive behaviors, drawn from diverse nontraditional sources. Figure 8 shows the key sources of behavioral data for climate–housing market research. Specifically, these include social media platforms (e.g., Twitter, Facebook, Reddit), which provide real-time insights into community sentiment, risk awareness, and immediate reactions to climate-related events such as floods and wildfires. Geo-tagged social media posts can reveal spatial variations in risk perceptions and localized behavioral responses, which can be integrated directly into spatially explicit hazard exposure and financial risk models. Additionally, search engine query data (e.g., Google Trends) captures temporal shifts in public attention toward climate hazards, including peaks in searches related to flood insurance, home relocations, or disaster preparedness. These search trends can serve as early-warning indicators of behavioral change, often preceding observable shifts in property prices or insurance claims. Furthermore, behavioral surveys targeted toward homeowners provide granular and direct insights into risk perceptions, adaptation intentions, and actual protective behaviors, such as installing flood defenses, relocating from hazard-prone areas, or purchasing hazard-specific insurance policies. Such surveys can be geographically referenced and integrated alongside spatial hazard exposure data, creating richer, behavior-informed risk profiles.
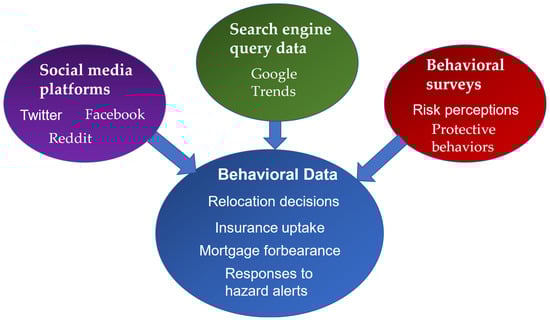
Figure 8.
Key sources of behavioral data for climate–housing market research.
Explicitly incorporating behavioral dimensions, such as homeowner decisions regarding relocation, insurance uptake, mortgage forbearance, or responses to hazard alerts, introduces dynamic realism into climate risk modeling. By capturing not only physical hazard exposure but also human behavioral adaptations, models become more responsive, accurate, and capable of reflecting real-world scenarios where individual decisions mediate financial impacts. For example, real-time modeling of homeowner responses to hazard alerts can substantially refine risk forecasts, enabling better predictions of mortgage default clustering, insurance claim spikes, and property valuation declines. These behavioral variables further enhance the equity and comprehensiveness of assessments by explicitly revealing who adapts proactively, who bears disproportionate costs due to inaction or inability to adapt, and where targeted interventions (e.g., resilience subsidies or adaptive infrastructure investments) are most urgently needed. Moreover, modeling behavioral heterogeneity allows policymakers and financial institutions to recognize and address structural vulnerabilities, such as lower adaptive capacities among marginalized communities or financially constrained populations, resulting in more inclusive adaptation strategies and financial products.
In general, incorporating behavioral data into climate-related financial risk assessment models represents a significant methodological advancement. This integration allows researchers, policymakers, and financial institutions to better anticipate emerging risks, design targeted and inclusive interventions, and ultimately foster greater climate resilience across diverse housing markets and demographic groups.
6.2.3. Innovation of This Framework
What sets the proposed integrative framework apart from existing approaches is its ability to unify environmental monitoring and financial modeling in a way that is both scalable and context-sensitive. Traditional housing risk assessments typically rely on static hazard maps or retrospective economic data, which fail to capture the evolving nature of climate threats—and the land transformations they trigger—as they propagate through financial systems. In contrast, this framework continuously ingests high-resolution, real-time remote sensing inputs—including satellite imagery, UAV footage, and radar-based observations—and fuses them with dynamic financial indicators such as mortgage performance, credit exposure, and insurance claims. This real-time integration enables granular climate risk analysis at multiple spatial levels, from individual properties to metropolitan financial systems.
A key innovation of this framework is its adaptability. By incorporating AI-enhanced analytics, such as CNNs, transformers, and ensemble learning models, it can flexibly detect and respond to a variety of hazards, including floods, wildfires, and sea-level rise, along with their associated land surface changes, without extensive manual calibration. This adaptability supports proactive scenario modeling, allowing stakeholders to simulate “what-if” conditions, test alternative policy strategies, and plan for cascading risks. Moreover, unlike many models that treat household or institutional behavior as fixed, this framework explicitly incorporates behavioral and regulatory data to understand how real-world actors respond to climate stress, such as relocating, modifying investment strategies, or changing insurance coverage.
The framework’s most transformative contribution lies in its ability to simulate complex, evolving risk trajectories across interconnected domains. By linking AI-powered environmental hazard detection—including observable transformations of land driven by climate shocks—with economic, behavioral, and institutional data, it supports advanced early warning systems and identifies cumulative risks that unfold over time. For example, repeated flooding in a low-income neighborhood might not only reduce home values and increase mortgage delinquency but also lead to unaffordable insurance, eventual disinvestment, and weakened municipal revenues. Traditional econometric models often fail to account for such feedback loops. In contrast, this integrative framework uses dynamic learning architectures to track and predict how shocks propagate through the housing and financial systems.
Importantly, this approach also prioritizes equity. By highlighting how climate risks disproportionately affect vulnerable populations, it enables more just and inclusive financial risk assessments. Policymakers and lenders can use the outputs to develop targeted interventions, such as resilience subsidies, zoning code revisions, or differentiated loan products, tailored to the most affected communities. Financial institutions can incorporate spatially explicit environmental insights into credit models, pricing strategies, and investment portfolio design.
Eventually, this framework moves beyond conventional forecasting tools by acting as a continuously evolving system. It provides not just retrospective analysis but forward-looking, adaptive, and socially responsive insights. By operationalizing the full potential of AI-enhanced remote sensing in conjunction with financial modeling, it offers a fundamentally new way to assess and manage climate-related financial risks in the housing sector—one that is real-time, multi-dimensional, and policy-relevant.
6.3. Challenges and Future Directions
Although the framework offers exciting new opportunities by combining environmental and financial insights, it is important to recognize its limits and practical obstacles. These challenges extend beyond generic interdisciplinary integration and demand targeted solutions tailored to the unique demands of climate-finance applications. They are specific to climate and housing finance and require targeted solutions. Table 6 outlines the main technical, policy, and modeling difficulties, along with possible strategies to help develop a working system that is accurate, understandable, and fair.
Table 6.
Key challenges and future directions for implementing the proposed integrative framework.
A core barrier is the asymmetry between the granularity of remote sensing data and the aggregation levels of financial indicators. While satellite and UAV imagery can capture land transformations and environmental changes at sub-meter resolution, most housing finance data, such as mortgage performance or insurance participation, are available only at parcel, ZIP code, or county level [52,65]. This spatial misalignment complicates efforts to map hazard exposure directly to financial vulnerability and constrains the predictive power of machine learning models trained on such mismatched datasets.
Temporal alignment presents an additional challenge. Remote sensing platforms can generate near-daily imagery for hazard tracking and monitoring dynamic changes in land surfaces, but financial systems often update data on monthly or quarterly cycles [294,295]. For example, a flood event might be detected in near real-time using SAR or optical sensors, but default rates and insurance claims may not manifest until months later. This lag hinders dynamic risk estimation and limits the utility of early warning models unless complemented by short-term behavioral proxies such as utility payment lags, social media signals, or geolocated transaction metadata.
Another issue unique to this framework is the difficulty in integrating regulatory and behavioral data at multiple scales. While the framework includes these components, in practice, zoning codes, FEMA flood map amendments, insurance mandates, and climate disclosure policies are stored in fragmented formats across local, state, and federal institutions. Moreover, behavioral responses to climate hazards, such as voluntary relocation, insurance dropout, or refusal to rebuild, are often underreported or inconsistently recorded [296,297]. Capturing such nuances requires designing hybrid survey-remote sensing instruments or using nontraditional data sources such as Google Trends, crowd-sourced hazard mapping, or mobile phone geolocation data.
Integrating behavioral data with remote sensing and financial datasets offers considerable opportunities but also poses technical, ethical, and methodological challenges. Methodologically, spatially aligning geo-tagged behavioral responses from social media or surveys with hazard exposure layers derived from AI-driven remote sensing technologies enables a geographically grounded understanding of risk perceptions and adaptations. Techniques such as data fusion and multi-modal learning can facilitate the integration of satellite-derived spatial hazard data with location-tagged behavioral signals and financial indicators (e.g., mortgage performance, insurance uptake, and property valuation). Temporal alignment across these datasets is equally crucial, as understanding the causal relationships, such as how immediate post-disaster sentiment impacts subsequent housing prices or relocation patterns, requires carefully synchronized datasets. Nonetheless, significant challenges must be addressed, including privacy protection, reliability, and scalability. Ensuring privacy involves anonymization techniques, aggregation of individual data points, and privacy-preserving machine learning methods such as federated learning or differential privacy. Reliability concerns arise due to the inherently noisy and potentially biased nature of social media and search-engine data, necessitating validation procedures against established benchmarks like actual insurance claims or documented migration records. Scalability presents an additional technical hurdle, given the need to efficiently manage, process, and analyze large volumes of high-frequency, unstructured behavioral data. Solutions include cloud-based analytics platforms, automated anomaly detection through machine learning, and feature-extraction methods that allow real-time integration of behavioral insights into financial forecasting models.
From a methodological perspective, integrating multi-source data across physical, financial, and behavioral domains into one coherent modeling pipeline remains an unresolved challenge. Current AI models used in climate or housing applications tend to specialize—either excelling in hazard segmentation or financial forecasting—but not both [298,299]. Developing multi-task or transfer learning architectures that can simultaneously learn from satellite images and economic time series, while also accommodating causal inference frameworks needed for policy simulations, represents a promising but complex research frontier. Another critical future direction is developing domain-specific explainability methods. Standard feature attribution tools used in machine learning may not capture the causal relevance of land change severity, hazard intensity, or spatial dependencies in financial outcomes [300]. Ensuring that AI models are interpretable and trustworthy for end users in finance, insurance, and governance is equally important. While deep learning architectures offer high predictive performance, they often operate as “black boxes,” producing outputs that are difficult to audit or explain. This opacity can hinder their adoption by regulators, underwriters, or institutional investors who require transparent, rule-based rationales for risk classification. To address this, future work should prioritize the development of hybrid models that combine interpretable machine learning (e.g., decision trees, SHAP explanations) with high-capacity AI systems, or embed regulatory logic within model architectures. Incorporating explainability directly into model outputs is essential for compliance, accountability, and stakeholder trust.
Finally, while the proposed framework underscores the analytical potential of AI-enhanced remote sensing for climate-related financial risk assessment, its real-world implementation faces significant socio-technical and institutional barriers. Access to high-resolution satellite imagery is often limited by licensing costs, proprietary restrictions, or geopolitical constraints—particularly in low-resource or high-risk regions. At the same time, key financial datasets, such as mortgage performance, insurance claims, and credit histories, are often siloed within private institutions or protected by strict confidentiality rules. These challenges impede the integration of environmental and financial data at the resolution needed for effective modeling. Without robust data-sharing frameworks, privacy-preserving integration methods, and enabling legal infrastructure, even technically advanced AI systems may fail to deliver actionable insights for policymakers and financial stakeholders. Moreover, the framework’s adaptability across geographies is constrained by variability in data availability, hazard exposure, and institutional capacity. In high-risk but under-resourced areas, such as small coastal towns or marginalized urban neighborhoods, model performance may suffer due to missing financial records or outdated land registries [301]. Future research should explore uncertainty quantification, imputation using environmental analogs, and participatory data generation to improve model reliability under these conditions.
In sum, realizing the full potential of this integrative framework will require targeted advances in spatial-temporal alignment, behavioral and regulatory data integration, multi-task AI modeling, and context-aware interpretability. Equally important will be the development of collaborative infrastructures—open-access platforms, federated data-sharing protocols, and interdisciplinary research consortia—that bridge the divide between environmental science, data engineering, and financial economics in the service of climate-resilient housing markets.
7. Conclusions
This review systematically synthesizes two rapidly advancing yet often disconnected fields: AI-driven remote sensing for climate hazard monitoring and economic analysis of climate-related financial risks in housing markets. By introducing a structured taxonomy, comparative methodological tables, and a research gap map, the study addresses prior limitations in systematization and provides a clearer framework for evaluating current research trends. These tools highlight the uneven distribution of scholarly attention across hazards, methodological approaches, and geographic contexts, revealing critical underexplored intersections, such as multi-hazard modeling, explicit behavioral integration, and socioeconomically targeted risk assessment.
The comparative evaluation underscores that while deep learning models excel in high-resolution hazard detection, their limited interpretability constrains their use in financial and policy contexts. Econometric models, on the other hand, offer causal clarity but face scalability challenges in handling complex, multi-modal datasets. Hybrid approaches, capable of uniting predictive accuracy with interpretability, emerge as a promising yet underdeveloped direction. The analysis also emphasizes that a narrow focus on technical performance without integrating behavioral and equity dimensions risks overlooking the social realities that shape climate-related financial vulnerability.
Looking ahead, the review identifies three urgent priorities for advancing the field. First, methodological innovation should focus on developing hybrid modeling frameworks that merge AI’s predictive capacity with the causal interpretability of econometrics, supported by domain-specific explainability tools. Second, multi-source data pipelines must be designed to combine satellite imagery, economic time series, and behavioral indicators, enabling more dynamic, context-sensitive risk assessment. Third, equity considerations should move from peripheral discussion to central design principles, ensuring that risk models account for socio-economic heterogeneity and guide just adaptation strategies.
By moving beyond descriptive synthesis to offer a critical and integrated evaluation of existing research, this review provides both a conceptual map and a practical agenda for future interdisciplinary work. Implementing these recommendations will help researchers, policymakers, and financial actors develop risk assessment tools that are not only scientifically robust but also socially relevant, regulatory-compliant, and capable of informing effective, equitable responses to the accelerating challenges of climate-related land transformations. Despite its strengths, the framework faces several important challenges. Remote sensing and financial data often do not align in space and time. Regulatory and behavioral data are often fragmented or hard to use. Many current AI models are limited to single tasks and offer little explanation for their predictions. Overcoming these issues will require new methods, such as multi-task learning, better model transparency, and tools for managing uncertainty. It will also require better systems for sharing data and working across disciplines.
In the long run, this approach can help policymakers, financial institutions, and local communities make better decisions. It will support early action, smarter investments, and more inclusive planning. By improving how we assess and respond to climate risk, the framework offers both a research roadmap and a practical tool for building more resilient housing markets.
Author Contributions
Conceptualization, C.Z. and X.L.; methodology, C.Z. and X.L.; formal analysis, C.Z.; investigation, X.L.; resources, C.Z.; data curation, X.L.; writing—original draft preparation, C.Z.; writing—review and editing, X.L.; visualization, X.L.; supervision, C.Z.; project administration, C.Z.; funding acquisition, C.Z. All authors have read and agreed to the published version of the manuscript.
Funding
This research was funded by USA NSF grants numbers 2022036 and 2303575. Authors have the sole responsibility for all of the viewpoints presented in the paper.
Data Availability Statement
No new data were created or analyzed in this study. Data sharing is not applicable to this article.
Conflicts of Interest
The authors declare no conflict of interest.
References
- Benjamin, J.D.; Chinloy, P.; Jud, G.D. Real estate versus financial wealth in consumption. J. Real Estate Financ. Econ. 2004, 29, 341–354. [Google Scholar] [CrossRef]
- Fabozzi, F.J. (Ed.) The Handbook of Mortgage-Backed Securities; Oxford University Press: Oxford, UK, 2016. [Google Scholar]
- Campiglio, E.; Daumas, L.; Monnin, P.; von Jagow, A. Climate-related risks in financial assets. J. Econ. Surv. 2023, 37, 950–992. [Google Scholar] [CrossRef]
- Ostriker, A.; Russo, A. The Effects of Floodplain Regulation on Housing Markets; Lincoln Institute of Land Policy: Cambridge, MA, USA, 2022; Available online: https://ostriker.github.io/papers/Ostriker-Russo_floodplain-regulations.pdf (accessed on 15 April 2025).
- TCFD (Task Force on Climate-related Financial Disclosures). Final Report: Recommendations of the Task Force on Climate-Related Financial Disclosures; Financial Stability Board; Bank for International Settlements: Basel, Switzerland, 2017; Available online: https://www.fsb-tcfd.org/publications/final-recommendations-report/ (accessed on 15 April 2025).
- US Securities and Exchange Commission. The Enhancement and Standardization of Climate-Related Disclosures for Investors. Proposed Rule. Fed. Regist. 2022, 87, 21334–21437. Available online: https://www.sec.gov/rules/proposed/2022/33-11042.pdf (accessed on 15 April 2025).
- Al Shafian, S.; Hu, D. Integrating machine learning and remote sensing in disaster management: A decadal review of post-disaster building damage assessment. Buildings 2024, 14, 2344. [Google Scholar] [CrossRef]
- Harrison, D.; Smersh, G.T.; Schwartz, A. Environmental determinants of housing prices: The impact of flood zone status. J. Real Estate Res. 2001, 21, 3–20. [Google Scholar] [CrossRef]
- Troy, A.; Romm, J. Assessing the price effects of flood hazard disclosure under the California natural hazard disclosure law (AB 1195). J. Environ. Plan. Manag. 2004, 47, 137–162. [Google Scholar] [CrossRef]
- Bin, O.; Landry, C.E. Changes in implicit flood risk premiums: Empirical evidence from the housing market. J. Environ. Econ. Manag. 2013, 65, 361–376. [Google Scholar] [CrossRef]
- Atreya, A.; Ferreira, S.; Kriesel, W. Forgetting the flood? An analysis of the flood risk discount over time. Land Econ. 2013, 89, 577–596. [Google Scholar] [CrossRef]
- Zhang, L.; Leonard, T. Flood hazards impact on neighborhood house prices. J. Real Estate Financ. Econ. 2019, 58, 656–674. [Google Scholar] [CrossRef]
- Yi, D.; Choi, H. Housing market response to new flood risk information and the impact on poor tenant. J. Real Estate Financ. Econ. 2020, 61, 55–79. [Google Scholar] [CrossRef]
- Ratnadiwakara, D.; Venugopal, B. Do areas affected by flood disasters attract lower-income and less creditworthy homeowners? J. Hous. Res. 2020, 29 (Suppl. S1), S121–S143. [Google Scholar] [CrossRef]
- Davlasheridze, M.; Miao, Q. Natural disasters, public housing, and the role of disaster aid. J. Reg. Sci. 2021, 61, 1113–1135. [Google Scholar] [CrossRef]
- Kousky, C.; Kunreuther, H.; LaCour-Little, M.; Wachter, S. Flood risk and the US housing market. J. Hous. Res. 2020, 29 (Suppl. S1), S3–S24. [Google Scholar] [CrossRef]
- Pommeranz, C.; Steininger, B.I. Spatial spillovers in the pricing of flood risk: Insights from the housing market. J. Hous. Res. 2020, 29 (Suppl. S1), S54–S85. [Google Scholar] [CrossRef]
- Hino, M.; Burke, M. The effect of information about climate risk on property values. Proc. Natl. Acad. Sci. USA 2021, 118, e2003374118. [Google Scholar] [CrossRef]
- Gourevitch, J.D.; Kousky, C.; Liao, Y.; Nolte, C.; Pollack, A.B.; Porter, J.R.; Weill, J.A. Unpriced climate risk and the potential consequences of overvaluation in US housing markets. Nat. Clim. Change 2023, 13, 250–257. [Google Scholar] [CrossRef]
- Armal, S.; Porter, J.R.; Lingle, B.; Chu, Z.; Marston, M.L.; Wing, O.E. Assessing property level economic impacts of climate in the US, new insights and evidence from a comprehensive flood risk assessment tool. Climate 2020, 8, 116. [Google Scholar] [CrossRef]
- Atreya, A.; Ferreira, S. Seeing is believing? Evidence from property prices in inundated areas. Risk Anal. 2015, 35, 828–848. [Google Scholar] [CrossRef] [PubMed]
- Beltrán, A.; Maddison, D.; Elliott, R.J. Is flood risk capitalized into property values? Ecol. Econ. 2018, 146, 668–685. [Google Scholar] [CrossRef]
- Daniel, V.E.; Florax, R.J.; Rietveld, P. Flooding risk and housing values: An economic assessment of environmental hazard. Ecol. Econ. 2009, 69, 355–365. [Google Scholar] [CrossRef]
- Gibson, M.; Mullins, J.T.; Hill, A. Climate Change, Flood Risk, and Property Values: Evidence from New York City; Working Paper; Department of Economics, Williams College: Williamstown, MA, USA, 2017; Available online: https://api.semanticscholar.org/CorpusID:15124428 (accessed on 15 April 2025).
- Shr, Y.H.J.; Zipp, K.Y. The aftermath of flood zone remapping: The asymmetric impact of flood maps on housing prices. Land Econ. 2019, 95, 174–192. [Google Scholar] [CrossRef]
- Bin, O.; Polasky, S. Effects of flood hazards on property values: Evidence before and after Hurricane Floyd. Land Econ. 2004, 80, 490–500. [Google Scholar] [CrossRef]
- Hallstrom, D.G.; Smith, V.K. Market responses to hurricanes. J. Environ. Econ. Manag. 2005, 50, 541–561. [Google Scholar] [CrossRef]
- Ewing, B.T.; Kruse, J.B.; Wang, Y. Local housing price index analysis in wind-disaster-prone areas. Nat. Hazards 2007, 40, 463–483. [Google Scholar] [CrossRef]
- Ortega, F.; Taṣpınar, S. Rising sea levels and sinking property values: Hurricane Sandy and New York’s housing market. J. Urban Econ. 2018, 106, 81–100. [Google Scholar] [CrossRef]
- Ellen, I.G.; Meltzer, R. Heterogeneity in the recovery of local real estate markets after extreme events: The case of hurricane Sandy. Real Estate Econ. 2024, 52, 714–752. [Google Scholar] [CrossRef]
- Cohen, J.P.; Barr, J.; Kim, E. Storm surges, informational shocks, and the price of urban real estate: An application to the case of hurricane Sandy. Reg. Sci. Urban Econ. 2021, 90, 103694. [Google Scholar] [CrossRef]
- Holtermans, R.; Niu, D.; Zheng, S. Quantifying the impacts of climate shocks in commercial real estate markets. J. Reg. Sci. 2024, 64, 1099–1121. [Google Scholar] [CrossRef]
- Fisher, J.D.; Rutledge, S.R. The impact of hurricanes on the value of commercial real estate. Bus. Econ. 2021, 56, 129–145. [Google Scholar] [CrossRef]
- Addoum, J.M.; Eichholtz, P.; Steiner, E.; Yönder, E. Climate change and commercial real estate: Evidence from hurricane Sandy. Real Estate Econ. 2024, 52, 687–713. [Google Scholar] [CrossRef]
- Zivin, J.G.; Liao, Y.; Panassie, Y. How hurricanes sweep up housing markets: Evidence from Florida. J. Environ. Econ. Manag. 2023, 118, 102770. [Google Scholar] [CrossRef]
- Fang, L.; Li, L.; Yavas, A. The impact of distant hurricane on local housing markets. J. Real Estate Financ. Econ. 2021, 66, 327–372. [Google Scholar] [CrossRef]
- Sutter, D.; Poitras, M. Do people respond to low probability risks? Evidence from tornado risk and manufactured homes. J. Risk Uncertain. 2010, 40, 181–196. [Google Scholar] [CrossRef]
- Murfin, J.; Spiegel, M. Is the risk of sea level rise capitalized in residential real estate? Rev. Financ. Stud. 2020, 33, 1217–1255. [Google Scholar] [CrossRef]
- Fan, Q.; Bakkensen, L.A. Household sorting as adaptation to hurricane risk in the United States. Land Econ. 2022, 98, 219–238. [Google Scholar] [CrossRef]
- Loomis, J. Do nearby forest fires cause a reduction in residential property values? J. For. Econ. 2004, 10, 149–157. [Google Scholar] [CrossRef]
- Mueller, J.; Loomis, J.; González-Cabán, A. Do repeated wildfires change homebuyers’ demand for homes in high-risk areas? A hedonic analysis of the short and long-term effects of repeated wildfires on house prices in Southern California. J. Real Estate Financ. Econ. 2009, 38, 155–172. [Google Scholar] [CrossRef]
- Stetler, K.M.; Venn, T.J.; Calkin, D.E. The effects of wildfire and environmental amenities on property values in northwest Montana, USA. Ecol. Econ. 2010, 69, 2233–2243. [Google Scholar] [CrossRef]
- Mueller, J.M.; Loomis, J.B. Does the estimated impact of wildfires vary with the housing price distribution? A quantile regression approach. Land Use Policy 2014, 41, 121–127. [Google Scholar] [CrossRef]
- Donovan, G.H.; Champ, P.A.; Butry, D.T. Wildfire risk and housing prices: A case study from Colorado Springs. Land Econ. 2007, 83, 217–233. [Google Scholar] [CrossRef]
- Champ, P.A.; Donovan, G.H.; Barth, C.M. Homebuyers and wildfire risk: A Colorado Springs case study. Soc. Nat. Resour. 2009, 23, 58–70. [Google Scholar] [CrossRef]
- Athukorala, W.; Martin, W.; Neelawala, P.; Rajapaksa, D.; Webb, J.; Wilson, C. The impact of natural disasters on residential property values: Evidence from Australia. In Economics of Natural Disasters; Sharma, S.K., Quah, E., Lee, Z., Eds.; World Scientific: Singapore, 2019; pp. 147–179. [Google Scholar] [CrossRef]
- McCoy, S.J.; Walsh, R.P. Wildfire risk, salience & housing demand. J. Environ. Econ. Manag. 2018, 91, 203–228. [Google Scholar] [CrossRef]
- Hansen, W.D.; Naughton, H.T. The effects of a spruce bark beetle outbreak and wildfires on property values in the wildland–urban interface of south-central Alaska, USA. Ecol. Econ. 2013, 96, 141–154. [Google Scholar] [CrossRef]
- Czajkowski, J.; Young, M.; Giammanco, I.; Nielsen, M.; Russo, E.; Cope, A.; Brandenburg, A.; Groshong, L. Application of Wildfire Mitigation to Insured Property Exposure; Technical Report, CIPR Research Report; NAIC: Kansas City, MO, USA, 2020; Available online: https://content.naic.org/sites/default/files/cipr_report_wildfire_mitigation.pdf (accessed on 15 April 2025).
- Bin, O.; Poulter, B.; Dumas, C.F.; Whitehead, J.C. Measuring the impact of sea-level rise on coastal real estate: A hedonic property model approach. J. Reg. Sci. 2011, 51, 751–767. [Google Scholar] [CrossRef]
- McAlpine, S.A.; Porter, J.R. Estimating recent local impacts of sea-level rise on current real-estate losses: A housing market case study in Miami-Dade, Florida. Popul. Res. Policy Rev. 2018, 37, 871–895. [Google Scholar] [CrossRef] [PubMed]
- Bernstein, A.; Gustafson, M.T.; Lewis, R. Disaster on the horizon: The price effect of sea level rise. J. Financ. Econ. 2019, 134, 253–272. [Google Scholar] [CrossRef]
- Fu, X.; Nijman, J. Sea level rise, homeownership, and residential real estate markets in South Florida. Prof. Geogr. 2021, 73, 62–71. [Google Scholar] [CrossRef]
- Tyndall, J. Sea level rise and home prices: Evidence from Long Island. J. Real Estate Financ. Econ. 2023, 67, 579–605. [Google Scholar] [CrossRef]
- Conyers, Z.A.; Grant, R.; Roy, S.S. Sea level rise in Miami Beach: Vulnerability and real estate exposure. Prof. Geogr. 2019, 71, 278–291. [Google Scholar] [CrossRef]
- Palm, R.; Bolsen, T. Housing Market Response to Sea-Level Rise in Florida; Springer: Cham, Switzerland, 2022. [Google Scholar]
- Bernstein, A.; Billings, S.B.; Gustafson, M.T.; Lewis, R. Partisan residential sorting on climate change risk. J. Financ. Econ. 2022, 146, 989–1015. [Google Scholar] [CrossRef]
- Kousky, C.; Palim, M.; Pan, Y. Flood damage and mortgage credit risk: A case study of hurricane Harvey. J. Hous. Res. 2020, 29 (Suppl. S1), S86–S120. [Google Scholar] [CrossRef]
- Du, D.; Zhao, X. Hurricanes and Residential Mortgage Loan Performance; Office of the Comptroller of the Currency (OCC) Working Paper; Office of the Comptroller of the Currency: Washington, DC, USA, 2020. Available online: https://www.occ.treas.gov/publications-and-resources/publications/economics/working-papers-banking-perf-reg/pub-econ-working-paper-hurricanes-residential-mort-loan-perf.pdf (accessed on 15 April 2025).
- Calabrese, R.; Dombrowski, T.; Mandel, A.; Pace, R.K.; Zanin, L. Impacts of extreme weather events on mortgage risks and their evolution under climate change: A case study on Florida. Eur. J. Oper. Res. 2024, 314, 377–392. [Google Scholar] [CrossRef]
- Gete, P.; Tsouderou, A.; Wachter, S.M. Climate risk in mortgage markets: Evidence from hurricanes Harvey and Irma. Real Estate Econ. 2024, 52, 660–686. [Google Scholar] [CrossRef]
- Rossi, C.V. Assessing the impact of hurricane frequency and intensity on mortgage delinquency. J. Risk Manag. Financ. Inst. 2021, 14, 426–442. [Google Scholar] [CrossRef]
- Ouazad, A.; Kahn, M.E. Mortgage Finance in the Face of Rising Climate Risk; NBER Working Paper Series, Working Paper 26322; National Bureau of Economic Research: Cambridge, MA, USA, 2019; Available online: https://www.nber.org/system/files/working_papers/w26322/revisions/w26322.rev1.pdf?ftag=msfd61514f (accessed on 15 April 2025).
- Sastry, P. Who Bears Flood Risk? Evidence from Mortgage Markets in Florida; Columbia Business School Working Paper. SSRN-4306291; Columbia Business School: New York, NY, USA, 2022; Available online: https://papers.ssrn.com/sol3/papers.cfm?abstract_id=4306291 (accessed on 15 April 2025).
- Keenan, J.M.; Bradt, J.T. Underwaterwriting: From theory to empiricism in regional mortgage markets in the US. Clim. Change 2020, 162, 2043–2067. [Google Scholar] [CrossRef]
- Duanmu, J.; Li, Y.; Lin, M.; Tahsin, S. Natural disaster risk and residential mortgage lending standards. J. Real Estate Res. 2022, 44, 106–130. [Google Scholar] [CrossRef]
- Bradt, J.T.; Kousky, C.; Wing, O.E. Voluntary purchases and adverse selection in the market for flood insurance. J. Environ. Econ. Manag. 2021, 110, 102515. [Google Scholar] [CrossRef]
- Billings, S.B.; Gallagher, E.A.; Ricketts, L. Let the rich be flooded: The distribution of financial aid and distress after hurricane Harvey. J. Financ. Econ. 2022, 146, 797–819. [Google Scholar] [CrossRef]
- Dombrowski, T.; Pace, R.K.; Ratnadiwakara, D.; Slawson, V.C., Jr. Deductible choice in flood insurance: Who chooses the maximum? J. Hous. Res. 2020, 29 (Suppl. S1), S144–S169. [Google Scholar] [CrossRef]
- Wagner, K.R. Adaptation and adverse selection in markets for natural disaster insurance. Am. Econ. J. Econ. Policy 2022, 14, 380–421. [Google Scholar] [CrossRef]
- Blickle, K.; Hamerling, S.N.; Morgan, D.P. How Bad Are Weather Disasters for Banks? Federal Reserve Bank of New York Staff Reports, No. 990; Federal Reserve Bank of New York: New York, NY, USA, 2021; Available online: https://www.econstor.eu/bitstream/10419/247913/1/sr990.pdf (accessed on 15 April 2025).
- Chivers, J.; Flores, N.E. Market failure in information: The national flood insurance program. Land Econ. 2002, 78, 515–521. [Google Scholar] [CrossRef]
- Hu, Z. Social interactions and households’ flood insurance decisions. J. Financ. Econ. 2022, 144, 414–432. [Google Scholar] [CrossRef]
- Liao, Y.; Mulder, P. What’s at Stake? Understanding the Role of Home Equity in Flood Insurance Demand; Office of Financial Research Paper Series, OFR 24-06, SSRN-3756332; Office of Financial Research: Washington, DC, USA, 2021; Available online: https://papers.ssrn.com/sol3/papers.cfm?abstract_id=3756332 (accessed on 15 April 2025).
- Nguyen, D.D.; Ongena, S.; Qi, S.; Sila, V. Climate change risk and the cost of mortgage credit. Rev. Financ. 2022, 26, 1509–1549. [Google Scholar] [CrossRef]
- Allman, E. Pricing climate change risk in corporate bonds. J. Asset Manag. 2022, 23, 596–618. [Google Scholar] [CrossRef]
- Fontana, A.; Jarmulska, B.; Schwarz, C.; Scheid, B.A.; Scheins, C. From Flood to Fire: Is Physical Climate Risk Taken into Account in Banks’ Residential Mortgage Rates? European Central Bank (ECB) Working Paper, No. 2025/3036; SSRN: Rochester, NY, USA, 2025; Available online: https://ssrn.com/abstract=5176497 (accessed on 15 April 2025).
- Chen, L.H.; Silva Gao, L. The pricing of climate risk. J. Financ. Econ. Pract. 2012, 12, 115–131. [Google Scholar] [CrossRef]
- Holtermans, R.; Kahn, M.E.; Kok, N. Climate risk and commercial mortgage delinquency. J. Reg. Sci. 2024, 64, 994–1037. [Google Scholar] [CrossRef]
- Sayce, S.L.; Clayton, J.; Devaney, S.; van de Wetering, J. Climate risks and their implications for commercial property valuations. J. Prop. Invest. Financ. 2022, 40, 430–443. [Google Scholar] [CrossRef]
- Attoh, E.M.; de Bruin, K.; Goosen, H.; van Veldhoven, F.; Ludwig, F. Making physical climate risk assessments relevant to the financial sector–Lessons learned from real estate cases in the Netherlands. Clim. Risk Manag. 2022, 37, 100447. [Google Scholar] [CrossRef]
- Brunetti, C.; Caramichael, J.; Crosignani, M.; Dennis, B.; Kotta, G.; Morgan, D.; Shin, C.; Zer, I. Climate-related financial stability risks for the United States: Methods and applications. Economic Policy Review. 2024, 30, 1–37. [Google Scholar]
- Dennis, B.N. Climate Change and Financial Policy: A Literature Review; Finance and Economics Discussion Series 2022-048; Board of Governors of the Federal Reserve System: Washington, DC, USA, 2022. [CrossRef]
- Craig, M. An overview of flood risk to the housing finance ecosystem. Cityscape 2022, 24, 345–368. [Google Scholar]
- Daniel, K.D.; Litterman, R.B.; Wagner, G. Applying Asset Pricing Theory to Calibrate the Price of Climate Risk; NBER Working Paper Series, Working Paper 22795; National Bureau of Economic Research: Cambridge, MA, USA, 2016; Available online: http://www.nber.org/papers/w22795 (accessed on 15 April 2025).
- Giglio, S.; Kelly, B.; Stroebel, J. Climate finance. Annu. Rev. Financ. Econ. 2021, 13, 15–36. [Google Scholar] [CrossRef]
- Patel, K.B. Managing climate risk in mortgage markets: A role for derivatives. Chic. Fed Lett. 2021, 462, 1–6. [Google Scholar] [CrossRef]
- Lefevre, A.; Tourin, A. Incorporating climate risk into credit risk modeling: An application in housing finance. FinTech 2023, 2, 614–640. [Google Scholar] [CrossRef]
- Blickle, K.; Santos, J.A. Unintended Consequences of “Mandatory” Flood Insurance; Staff Reports, Working Paper No. 1012; Federal Reserve Bank of New York: New York, NY, USA, 2022; Available online: https://www.econstor.eu/bitstream/10419/262062/1/sr1012.pdf (accessed on 15 April 2025).
- Allen, L.; Shan, Y.; Shen, Y. Do FinTech mortgage lenders fill the credit gap? Evidence from natural disasters. J. Financ. Quant. Anal. 2023, 58, 3342–3383. [Google Scholar] [CrossRef]
- Begley, T.A.; Gurun, U.G.; Purnanandam, A.; Weagley, D. Disaster lending: “fair” prices but “unfair” access. Manag. Sci. 2024, 70, 8484–8505. [Google Scholar] [CrossRef]
- Berkman, H.; Jona, J.; Soderstrom, N. Firm-specific climate risk and market valuation. Account. Organ. Soc. 2024, 112, 101547. [Google Scholar] [CrossRef]
- Faccini, R.; Matin, R.; Skiadopoulos, G. Dissecting climate risks: Are they reflected in stock prices? J. Bank. Financ. 2023, 155, 106948. [Google Scholar] [CrossRef]
- Gallagher, J.; Hartley, D. Household finance after a natural disaster: The case of hurricane Katrina. Am. Econ. J. Econ. Policy 2017, 9, 199–228. [Google Scholar] [CrossRef]
- Gallagher, J.; Hartley, D.; Rohlin, S. Weathering an unexpected financial shock: The role of federal disaster assistance on household finance and business survival. J. Assoc. Environ. Resour. Econ. 2023, 10, 525–567. [Google Scholar] [CrossRef]
- Garbarino, N.; Guin, B. High water, no marks? Biased lending after extreme weather. J. Financ. Stab. 2021, 54, 100874. [Google Scholar] [CrossRef]
- Issler, P.; Stanton, R.; Vergara-Alert, C.; Wallace, N.E. Mortgage Markets with Climate-Change Risk: Evidence from Wildfires in California; Fisher Center for Real Estate and Urban Economics, UC Berkeley: Berkeley, CA, USA, 2020. [Google Scholar] [CrossRef]
- Keys, B.J.; Mulder, P. Neglected No More: Housing Markets, Mortgage Lending, and Sea Level Rise; NBER Working Paper Series, Working Paper 27930. 2020. Available online: http://www.nber.org/papers/w27930 (accessed on 15 April 2025).
- Atreya, A.; Ferreira, S.; Michel-Kerjan, E. What drives households to buy flood insurance? New evidence from Georgia. Ecol. Econ. 2015, 117, 153–161. [Google Scholar] [CrossRef]
- Bakkensen, L.A.; Barrage, L. Going underwater? Flood risk belief heterogeneity and coastal home price dynamics. Rev. Financ. Stud. 2022, 35, 3666–3709. [Google Scholar] [CrossRef]
- Filippova, O.; Nguyen, C.; Noy, I.; Rehm, M. Who cares? Future sea level rise and house prices. Land Econ. 2020, 96, 207–224. [Google Scholar] [CrossRef]
- Gibson, M.; Mullins, J.T. Climate risk and beliefs in New York floodplains. J. Assoc. Environ. Resour. Econ. 2020, 7, 1069–1111. [Google Scholar] [CrossRef]
- Bailey, M.; Dávila, E.; Kuchler, T.; Stroebel, J. House price beliefs and mortgage leverage choice. Rev. Econ. Stud. 2019, 86, 2403–2452. [Google Scholar] [CrossRef]
- Baldauf, M.; Garlappi, L.; Yannelis, C. Does climate change affect real estate prices? Only if you believe in it. Rev. Financ. Stud. 2020, 33, 1256–1295. [Google Scholar] [CrossRef]
- Kelly, D.L.; Molina, R. Adaptation infrastructure and its effects on property values in the face of climate risk. J. Assoc. Environ. Resour. Econ. 2023, 10, 1405–1438. [Google Scholar] [CrossRef]
- Schuetz, J. How will US households adjust their housing behaviors in response to climate change? Real Estate Econ. 2024, 52, 596–617. [Google Scholar] [CrossRef]
- Duan, T.; Li, F.W. Climate change concerns and mortgage lending. J. Empir. Financ. 2024, 75, 101445. [Google Scholar] [CrossRef]
- Botzen, W.J.; Aerts, J.C.; van den Bergh, J.C. Willingness of homeowners to mitigate climate risk through insurance. Ecol. Econ. 2009, 68, 2265–2277. [Google Scholar] [CrossRef]
- Butsic, V.; Hanak, E.; Valletta, R.G. Climate change and housing prices: Hedonic estimates for ski resorts in western North America. Land Econ. 2011, 87, 75–91. [Google Scholar] [CrossRef]
- McNamara, D.E.; Keeler, A. A coupled physical and economic model of the response of coastal real estate to climate risk. Nat. Clim. Change 2013, 3, 559–562. [Google Scholar] [CrossRef]
- Semenenko, I.; Yoo, J. Climate change and real estate prices. Int. J. Econ. Financ. 2019, 11, 1. [Google Scholar] [CrossRef]
- Farzanegan, M.R.; Feizi, M.; Gholipour, H.F. Drought and property prices: Empirical evidence from provinces of Iran. Econ. Disasters Clim. Change 2021, 5, 203–221. [Google Scholar] [CrossRef]
- Bunten, D.M.; Kahn, M.E. The Impact of Emerging Climate Risks on Urban Real Estate Price Dynamics; NBER Working Paper Series, Working Paper 20018. 2014. Available online: http://www.nber.org/papers/w20018 (accessed on 15 April 2025).
- Thompson, J.J.; Wilby, R.L.; Hillier, J.K.; Connell, R.; Saville, G.R. Climate gentrification: Valuing perceived climate risks in property prices. Ann. Am. Assoc. Geogr. 2023, 113, 1092–1111. [Google Scholar] [CrossRef]
- Giglio, S.; Maggiori, M.; Rao, K.; Stroebel, J.; Weber, A. Climate change and long-run discount rates: Evidence from real estate. Rev. Financ. Stud. 2021, 34, 3527–3571. [Google Scholar] [CrossRef]
- Clayton, J.; Devaney, S.; Sayce, S.; Van de Wetering, J. Climate risk and real estate prices: What do we know? J. Portf. Manag. 2021, 47, 75–90. [Google Scholar] [CrossRef]
- Warren-Myers, G.; Hurlimann, A. Climate change and risk to real estate. In A Research Agenda for Real Estate; Tiwari, P., Miao, J.T., Eds.; Edward Elgar Publishing: Cheltenham, UK, 2022; pp. 139–164. [Google Scholar]
- Contat, J.; Hopkins, C.; Mejia, L.; Suandi, M. When climate meets real estate: A survey of the literature. Real Estate Econ. 2024, 52, 618–659. [Google Scholar] [CrossRef]
- Votsis, A.; Perrels, A. Housing prices and the public disclosure of flood risk: A difference-in-differences analysis in Finland. J. Real Estate Financ. Econ. 2016, 53, 450–471. [Google Scholar] [CrossRef]
- Bonafilia, D.; Tellman, B.; Anderson, T.; Issenberg, E. Sen1Floods11: A georeferenced dataset to train and test deep learning flood algorithms for Sentinel-1. In Proceedings of the 2020 IEEE/CVF Conference on Computer Vision and Pattern Recognition Workshops, Seattle, WA, USA, 14–19 June 2020; pp. 835–845. [Google Scholar] [CrossRef]
- Hashemi-Beni, L.; Gebrehiwot, A.A. Flood extent mapping: An integrated method using deep learning and region growing using UAV optical data. IEEE J. Sel. Top. Appl. Earth Obs. Remote Sens. 2021, 14, 2127–2135. [Google Scholar] [CrossRef]
- Ghosh, B.I.N.A.Y.A.K.; Garg, S.; Motagh, M. Automatic flood detection from sentinel-1 data using deep learning architectures. ISPRS Ann. Photogramm. Remote Sens. Spat. Inf. Sci. 2022, 3, 201–208. [Google Scholar] [CrossRef]
- Zhang, Y.; Liu, P.; Chen, L.; Xu, M.; Guo, X.; Zhao, L. A new multi-source remote sensing image sample dataset with high resolution for flood area extraction: GF-FloodNet. Int. J. Digit. Earth 2023, 16, 2522–2554. [Google Scholar] [CrossRef]
- Huang, X.; Wang, C.; Li, Z. A near real-time flood-mapping approach by integrating social media and post-event satellite imagery. Ann. GIS 2018, 24, 113–123. [Google Scholar] [CrossRef]
- Konapala, G.; Kumar, S.V.; Ahmad, S.K. Exploring Sentinel-1 and Sentinel-2 diversity for flood inundation mapping using deep learning. ISPRS J. Photogramm. Remote Sens. 2021, 180, 163–173. [Google Scholar] [CrossRef]
- Munawar, H.S.; Ullah, F.; Qayyum, S.; Heravi, A. Application of deep learning on UAV-based aerial images for flood detection. Smart Cities 2021, 4, 1220–1242. [Google Scholar] [CrossRef]
- Sadiq, R.; Akhtar, Z.; Imran, M.; Ofli, F. Integrating remote sensing and social sensing for flood mapping. Remote Sens. Appl. Soc. Environ. 2022, 25, 100697. [Google Scholar] [CrossRef]
- Yang, L.; Cervone, G. Analysis of remote sensing imagery for disaster assessment using deep learning: A case study of flooding event. Soft Comput. 2019, 23, 13393–13408. [Google Scholar] [CrossRef]
- Wu, X.; Zhang, Z.; Xiong, S.; Zhang, W.; Tang, J.; Li, Z.; An, B.; Li, R. A near-real-time flood detection method based on deep learning and SAR images. Remote Sens. 2023, 15, 2046. [Google Scholar] [CrossRef]
- Elkhrachy, I. Flash flood water depth estimation using SAR images, digital elevation models, and machine learning algorithms. Remote Sens. 2022, 14, 440. [Google Scholar] [CrossRef]
- Yokoya, N.; Yamanoi, K.; He, W.; Baier, G.; Adriano, B.; Miura, H.; Oishi, S. Breaking limits of remote sensing by deep learning from simulated data for flood and debris-flow mapping. IEEE Trans. Geosci. Remote Sens. 2020, 60, 4400115. [Google Scholar] [CrossRef]
- Al-Areeq, A.M.; Abba, S.I.; Yassin, M.A.; Benaafi, M.; Ghaleb, M.; Aljundi, I.H. Computational machine learning approach for flood susceptibility assessment integrated with remote sensing and GIS techniques from Jeddah, Saudi Arabia. Remote Sens. 2022, 14, 5515. [Google Scholar] [CrossRef]
- Amiri, A.; Soltani, K.; Ebtehaj, I.; Bonakdari, H. A novel machine learning tool for current and future flood susceptibility mapping by integrating remote sensing and geographic information systems. J. Hydrol. 2024, 632, 130936. [Google Scholar] [CrossRef]
- Avand, M.; Moradi, H. Using machine learning models, remote sensing, and GIS to investigate the effects of changing climates and land uses on flood probability. J. Hydrol. 2021, 595, 125663. [Google Scholar] [CrossRef]
- Ha, M.C.; Vu, P.L.; Nguyen, H.D.; Hoang, T.P.; Dang, D.D.; Dinh, T.B.H.; Şerban, G.; Rus, I.; Brețcan, P. Machine learning and remote sensing application for extreme climate evaluation: Example of flood susceptibility in the Hue Province, Central Vietnam Region. Water 2022, 14, 1617. [Google Scholar] [CrossRef]
- Lei, X.; Chen, W.; Panahi, M.; Falah, F.; Rahmati, O.; Uuemaa, E.; Kalantari, Z.; Ferreira, C.S.S.; Rezaie, F.; Tiefenbacher, J.P.; et al. Urban flood modeling using deep-learning approaches in Seoul, South Korea. J. Hydrol. 2021, 601, 126684. [Google Scholar] [CrossRef]
- Liu, J.; Wang, J.; Xiong, J.; Cheng, W.; Sun, H.; Yong, Z.; Wang, N. Hybrid models incorporating bivariate statistics and machine learning methods for flash flood susceptibility assessment based on remote sensing datasets. Remote Sens. 2021, 13, 4945. [Google Scholar] [CrossRef]
- Park, S.J.; Lee, D.K. Prediction of coastal flooding risk under climate change impacts in South Korea using machine learning algorithms. Environ. Res. Lett. 2020, 15, 094052. [Google Scholar] [CrossRef]
- Roohi, M.; Ghafouri, H.R.; Ashrafi, S.M. Advancing flood disaster management: Leveraging deep learning and remote sensing technologies. Acta Geophys. 2025, 73, 557–575. [Google Scholar] [CrossRef]
- Shahabi, H.; Shirzadi, A.; Ghaderi, K.; Omidvar, E.; Al-Ansari, N.; Clague, J.J.; Geertsema, M.; Khosravi, K.; Amini, A.; Bahrami, S.; et al. Flood detection and susceptibility mapping using sentinel-1 remote sensing data and a machine learning approach: Hybrid intelligence of bagging ensemble based on k-nearest neighbor classifier. Remote Sens. 2020, 12, 266. [Google Scholar] [CrossRef]
- Pham, B.T.; Luu, C.; Van Phong, T.; Trinh, P.T.; Shirzadi, A.; Renoud, S.; Asadi, S.; Van Le, H.; von Meding, J.; Clague, J.J. Can deep learning algorithms outperform benchmark machine learning algorithms in flood susceptibility modeling? J. Hydrol. 2021, 592, 125615. [Google Scholar] [CrossRef]
- Antzoulatos, G.; Kouloglou, I.O.; Bakratsas, M.; Moumtzidou, A.; Gialampoukidis, I.; Karakostas, A.; Lombardo, F.; Fiorin, R.; Norbiato, D.; Ferri, M.; et al. Flood hazard and risk mapping by applying an explainable machine learning framework using satellite imagery and GIS data. Sustainability 2022, 14, 3251. [Google Scholar] [CrossRef]
- Hasnaoui, Y.; Tachi, S.E.; Bouguerra, H.; Yaseen, Z.M.; Gilja, G.; Szczepanek, R.; Navarro-Pedreño, J. Integrated remote sensing and deep learning models for flash flood detection based on spatio-temporal land use and cover changes in the Mediterranean region. Environ. Model. Assess. 2025. [Google Scholar] [CrossRef]
- Islam, T.; Zeleke, E.B.; Afroz, M.; Melesse, A.M. A systematic review of urban flood susceptibility mapping: Remote sensing, machine learning, and other modeling approaches. Remote Sens. 2025, 17, 524. [Google Scholar] [CrossRef]
- Bui, D.T.; Hoang, N.D.; Martínez-Álvarez, F.; Ngo, P.T.T.; Hoa, P.V.; Pham, T.D.; Samui, P.; Costache, R. A novel deep learning neural network approach for predicting flash flood susceptibility: A case study at a high frequency tropical storm area. Sci. Total Environ. 2020, 701, 134413. [Google Scholar]
- Chen, J.; Huang, G.; Chen, W. Towards better flood risk management: Assessing flood risk and investigating the potential mechanism based on machine learning models. J. Environ. Manag. 2021, 293, 112810. [Google Scholar] [CrossRef]
- Costache, R.; Bao Pham, Q.; Corodescu-Roșca, E.; Cîmpianu, C.; Hong, H.; Thi Thuy Linh, N.; Fai, C.M.; Ahmed, A.N.; Vojtek, M.; Pandhiani, S.M.; et al. Using GIS, remote sensing, and machine learning to highlight the correlation between the land-use/land-cover changes and flash-flood potential. Remote Sens. 2020, 12, 1422. [Google Scholar] [CrossRef]
- Costache, R.; Arabameri, A.; Blaschke, T.; Pham, Q.B.; Pham, B.T.; Pandey, M.; Arora, A.; Linh, N.T.T.; Costache, I. Flash-flood potential mapping using deep learning, alternating decision trees and data provided by remote sensing sensors. Sensors 2021, 21, 280. [Google Scholar] [CrossRef]
- Mabdeh, A.N.; Ajin, R.S.; Razavi-Termeh, S.V.; Ahmadlou, M.; Al-Fugara, A.K. Enhancing the performance of machine learning and deep learning-based flood susceptibility models by integrating grey wolf optimizer (GWO) algorithm. Remote Sens. 2024, 16, 2595. [Google Scholar] [CrossRef]
- Bentivoglio, R.; Isufi, E.; Jonkman, S.N.; Taormina, R. Deep learning methods for flood mapping: A review of existing applications and future research directions. Hydrol. Earth Syst. Sci. 2022, 26, 4345–4378. [Google Scholar] [CrossRef]
- Mojaddadi, H.; Pradhan, B.; Nampak, H.; Ahmad, N.; Ghazali, A.H.B. Ensemble machine-learning-based geospatial approach for flood risk assessment using multi-sensor remote-sensing data and GIS. Geomat. Nat. Hazards Risk 2017, 8, 1080–1102. [Google Scholar] [CrossRef]
- Costache, R.; Pham, Q.B.; Sharifi, E.; Linh, N.T.T.; Abba, S.I.; Vojtek, M.; Vojteková, J.; Nhi, P.T.T.; Khoi, D.N. Flash-flood susceptibility assessment using multi-criteria decision making and machine learning supported by remote sensing and GIS techniques. Remote Sens. 2019, 12, 106. [Google Scholar] [CrossRef]
- Munawar, H.S.; Hammad, A.W.; Waller, S.T. Remote sensing methods for flood prediction: A review. Sensors 2022, 22, 960. [Google Scholar] [CrossRef]
- Soria-Ruiz, J.; Fernandez-Ordoñez, Y.M.; Ambrosio-Ambrosio, J.P.; Escalona-Maurice, M.J.; Medina-García, G.; Sotelo-Ruiz, E.D.; Ramirez-Guzman, M.E. Flooded extent and depth analysis using optical and SAR remote sensing with machine learning algorithms. Atmosphere 2022, 13, 1852. [Google Scholar] [CrossRef]
- Asiri, M.M.; Aldehim, G.; Alruwais, N.; Allafi, R.; Alzahrani, I.; Nouri, A.M.; Assiri, M.; Ahmed, N.A. Coastal flood risk assessment using ensemble multi-criteria decision-making with machine learning approaches. Environ. Res. 2024, 245, 118042. [Google Scholar] [CrossRef]
- Muñoz, D.F.; Muñoz, P.; Moftakhari, H.; Moradkhani, H. From local to regional compound flood mapping with deep learning and data fusion techniques. Sci. Total Environ. 2021, 782, 146927. [Google Scholar] [CrossRef]
- Ahmadlou, M.; Al-Fugara, A.K.; Al-Shabeeb, A.R.; Arora, A.; Al-Adamat, R.; Pham, Q.B.; Al-Ansari, N.; Linh, N.T.T.; Sajedi, H. Flood susceptibility mapping and assessment using a novel deep learning model combining multilayer perceptron and autoencoder neural networks. J. Flood Risk Manag. 2021, 14, e12683. [Google Scholar] [CrossRef]
- Kalantar, B.; Ueda, N.; Saeidi, V.; Janizadeh, S.; Shabani, F.; Ahmadi, K.; Shabani, F. Deep neural network utilizing remote sensing datasets for flood hazard susceptibility mapping in Brisbane, Australia. Remote Sens. 2021, 13, 2638. [Google Scholar] [CrossRef]
- Riazi, M.; Khosravi, K.; Shahedi, K.; Ahmad, S.; Jun, C.; Bateni, S.M.; Kazakis, N. Enhancing flood susceptibility modeling using multi-temporal SAR images, CHIRPS data, and hybrid machine learning algorithms. Sci. Total Environ. 2023, 871, 162066. [Google Scholar] [CrossRef] [PubMed]
- Yang, J.; Ahn, D.; Bahk, J.; Park, S.; Rizqihandari, N.; Cha, M. Assessing climate risks from satellite imagery with machine learning: A case study of flood risks in Jakarta. Clim. Risk Manag. 2024, 46, 100651. [Google Scholar] [CrossRef]
- Ahmed, S.M.S.; Güneyli, H. Automatic post-tsunami loss modeling using deep learning CNN case study: Miyagi and Fukushima Japan tsunami. Nat. Hazards 2023, 117, 3371–3397. [Google Scholar] [CrossRef]
- Chen, R.; Zhang, W.; Wang, X. Machine learning in tropical cyclone forecast modeling: A review. Atmosphere 2020, 11, 676. [Google Scholar] [CrossRef]
- Dawood, M.; Asif, A.; Minhas, F.U.A.A. Deep-PHURIE: Deep learning based hurricane intensity estimation from infrared satellite imagery. Neural Comput. Appl. 2020, 32, 9009–9017. [Google Scholar] [CrossRef]
- Devaraj, J.; Ganesan, S.; Elavarasan, R.M.; Subramaniam, U. A novel deep learning based model for tropical intensity estimation and post-disaster management of hurricanes. Appl. Sci. 2021, 11, 4129. [Google Scholar] [CrossRef]
- Essa, Y.; Hunt, H.G.; Gijben, M.; Ajoodha, R. Deep learning prediction of thunderstorm severity using remote sensing weather data. IEEE J. Sel. Top. Appl. Earth Obs. Remote Sens. 2022, 15, 4004–4013. [Google Scholar] [CrossRef]
- Kim, T.; Yang, T.; Zhang, L.; Hong, Y. Near real-time hurricane rainfall forecasting using convolutional neural network models with Integrated Multi-satellitE Retrievals for GPM (IMERG) product. Atmos. Res. 2022, 270, 106037. [Google Scholar] [CrossRef]
- Martinez-Amaya, J.; Radin, C.; Nieves, V. Advanced machine learning methods for major hurricane forecasting. Remote Sens. 2022, 15, 119. [Google Scholar] [CrossRef]
- Tian, W.; Lai, L.; Niu, X.; Zhou, X.; Zhang, Y.; Sian, K.T.C.L.K. Estimation of tropical cyclone intensity using multi-platform remote sensing and deep learning with environmental field information. Remote Sens. 2023, 15, 2085. [Google Scholar] [CrossRef]
- Wang, C.; Li, X. Deep learning in extracting tropical cyclone intensity and wind radius information from satellite infrared images—A review. Atmos. Ocean. Sci. Lett. 2023, 16, 100373. [Google Scholar] [CrossRef]
- Wang, Z.; Zhao, J.; Huang, H.; Wang, X. A review on the application of machine learning methods in tropical cyclone forecasting. Front. Earth Sci. 2022, 10, 902596. [Google Scholar] [CrossRef]
- Maskey, M.; Ramachandran, R.; Ramasubramanian, M.; Gurung, I.; Freitag, B.; Kaulfus, A.; Bollinger, B.; Cecil, J.D.; Miller, J. Deepti: Deep-learning-based tropical cyclone intensity estimation system. IEEE J. Sel. Top. Appl. Earth Obs. Remote Sens. 2020, 13, 4271–4281. [Google Scholar] [CrossRef]
- Yao, S.; Chen, H.; Thompson, E.J.; Cifelli, R. An improved deep learning model for high-impact weather nowcasting. IEEE J. Sel. Top. Appl. Earth Obs. Remote Sens. 2022, 15, 7400–7413. [Google Scholar] [CrossRef]
- Patil, H. Cyclone prediction from remote sensing images using hybrid deep learning approach based on AlexNet. Int. J. Image Graph. Signal Process. 2024, 16, 96–107. [Google Scholar] [CrossRef]
- Wimmers, A.; Velden, C.; Cossuth, J.H. Using deep learning to estimate tropical cyclone intensity from satellite passive microwave imagery. Mon. Weather Rev. 2019, 147, 2261–2282. [Google Scholar] [CrossRef]
- Berezina, P.; Liu, D. Hurricane damage assessment using coupled convolutional neural networks: A case study of hurricane Michael. Geomat. Nat. Hazards Risk 2022, 13, 414–431. [Google Scholar] [CrossRef]
- Calton, L.; Wei, Z. Using artificial neural network models to assess hurricane damage through transfer learning. Appl. Sci. 2022, 12, 1466. [Google Scholar] [CrossRef]
- Cheng, C.S.; Behzadan, A.H.; Noshadravan, A. Deep learning for post-hurricane aerial damage assessment of buildings. Comput.-Aided Civ. Infrastruct. Eng. 2021, 36, 695–710. [Google Scholar] [CrossRef]
- Kaur, S.; Gupta, S.; Singh, S. Hurricane damage detection using machine learning and deep learning techniques: A review. IOP Conf. Ser. Mater. Sci. Eng. 2021, 1022, 012035. [Google Scholar] [CrossRef]
- Kaur, S.; Gupta, S.; Singh, S.; Hoang, V.T.; Almakdi, S.; Alelyani, T.; Shaikh, A. Transfer learning-based automatic hurricane damage detection using satellite images. Electronics 2022, 11, 1448. [Google Scholar] [CrossRef]
- Kaur, S.; Gupta, S.; Singh, S.; Koundal, D.; Zaguia, A. Convolutional neural network based hurricane damage detection using satellite images. Soft Comput. 2022, 26, 7831–7845. [Google Scholar] [CrossRef]
- Li, Y.; Ye, S.; Bartoli, I. Semisupervised classification of hurricane damage from postevent aerial imagery using deep learning. J. Appl. Remote Sens. 2018, 12, 045008. [Google Scholar] [CrossRef]
- McCarthy, M.J.; Jessen, B.; Barry, M.J.; Figueroa, M.; McIntosh, J.; Murray, T.; Schmid, J.; Muller-Karger, F.E. Mapping hurricane damage: A comparative analysis of satellite monitoring methods. Int. J. Appl. Earth Obs. Geoinf. 2020, 91, 102134. [Google Scholar] [CrossRef]
- Sublime, J.; Kalinicheva, E. Automatic post-disaster damage mapping using deep-learning techniques for change detection: Case study of the Tohoku tsunami. Remote Sens. 2019, 11, 1123. [Google Scholar] [CrossRef]
- Sit, M.A.; Koylu, C.; Demir, I. Identifying disaster-related tweets and their semantic, spatial and temporal context using deep learning, natural language processing and spatial analysis: A case study of hurricane Irma. Int. J. Digit. Earth 2019, 12, 1205–1229. [Google Scholar] [CrossRef]
- Villegas, C.A.; Martinez, M.J. Lessons from Harvey: Improving traditional damage estimates with social media sourced damage estimates. Cities 2022, 121, 103500. [Google Scholar] [CrossRef]
- Arachchige, S.M.; Pradhan, B. AI meets the eye of the storm: Machine learning-driven insights for hurricane damage risk assessment in Florida. Earth Syst. Environ. 2025. [Google Scholar] [CrossRef]
- Klepac, S.; Subgranon, A.; Olabarrieta, M. A case study and parametric analysis of predicting hurricane-induced building damage using data-driven machine learning approach. Front. Built Environ. 2022, 8, 1015804. [Google Scholar] [CrossRef]
- Szczyrba, L.; Zhang, Y.; Pamukcu, D.; Eroglu, D.I.; Weiss, R. Quantifying the role of vulnerability in hurricane damage via a machine learning case study. Nat. Hazards Rev. 2021, 22, 04021028. [Google Scholar] [CrossRef]
- Liang, J.; Liu, D. Estimating daily inundation probability using remote sensing, riverine flood, and storm surge models: A case of hurricane Harvey. Remote Sens. 2020, 12, 1495. [Google Scholar] [CrossRef]
- Tiampo, K.F.; Huang, L.; Simmons, C.; Woods, C.; Glasscoe, M.T. Detection of flood extent using Sentinel-1A/B synthetic aperture radar: An application for hurricane Harvey, Houston, TX. Remote Sens. 2022, 14, 2261. [Google Scholar] [CrossRef]
- Veillette, M.; Samsi, S.; Mattioli, C. Sevir: A storm event imagery dataset for deep learning applications in radar and satellite meteorology. Adv. Neural Inf. Process. Syst. 2020, 33, 22009–22019. [Google Scholar]
- Verma, S.; Srivastava, K.; Tiwari, A.; Verma, S. Deep learning techniques in extreme weather events: A review. arXiv 2023, arXiv:2308.10995. [Google Scholar] [CrossRef]
- Bahadori, N.; Razavi-Termeh, S.V.; Sadeghi-Niaraki, A.; Al-Kindi, K.M.; Abuhmed, T.; Nazeri, B.; Choi, S.M. Wildfire susceptibility mapping using deep learning algorithms in two satellite imagery dataset. Forests 2023, 14, 1325. [Google Scholar] [CrossRef]
- Bergado, J.R.; Persello, C.; Reinke, K.; Stein, A. Predicting wildfire burns from big geodata using deep learning. Saf. Sci. 2021, 140, 105276. [Google Scholar] [CrossRef]
- Ghali, R.; Akhloufi, M.A. Deep learning approaches for wildland fires using satellite remote sensing data: Detection, mapping, and prediction. Fire 2023, 6, 192. [Google Scholar] [CrossRef]
- Ghali, R.; Akhloufi, M.A. Deep learning approaches for wildland fires remote sensing: Classification, detection, and segmentation. Remote Sens. 2023, 15, 1821. [Google Scholar] [CrossRef]
- Gupta, R.; Kim, H. A geospatial approach to wildfire risk modeling using machine learning and remote sensing data. IEEE J. Sel. Top. Appl. Earth Obs. Remote Sens. 2024, 17, 13570–13576. [Google Scholar] [CrossRef]
- Huot, F.; Hu, R.L.; Ihme, M.; Wang, Q.; Burge, J.; Lu, T.; Hickey, J.; Chen, Y.-F.; Anderson, J. Deep learning models for predicting wildfires from historical remote-sensing data. arXiv 2020, arXiv:2010.07445. [Google Scholar]
- Huot, F.; Hu, R.L.; Goyal, N.; Sankar, T.; Ihme, M.; Chen, Y.F. Next day wildfire spread: A machine learning dataset to predict wildfire spreading from remote-sensing data. IEEE Trans. Geosci. Remote Sens. 2022, 60, 4412513. [Google Scholar] [CrossRef]
- Illarionova, S.; Shadrin, D.; Gubanov, F.; Shutov, M.; Tasuev, U.; Evteeva, K.; Mironenko, M.; Burnaev, E. Exploration of geo-spatial data and machine learning algorithms for robust wildfire occurrence prediction. Sci. Rep. 2025, 15, 10712. [Google Scholar] [CrossRef]
- Jonnalagadda, A.V.; Hashim, H.A. SegNet: A segmented deep learning based convolutional neural network approach for drones wildfire detection. Remote Sens. Appl. Soc. Environ. 2024, 34, 101181. [Google Scholar] [CrossRef]
- Kanwal, R.; Rafaqat, W.; Iqbal, M.; Weiguo, S. Data-driven approaches for wildfire mapping and prediction assessment using a convolutional neural network (CNN). Remote Sens. 2023, 15, 5099. [Google Scholar] [CrossRef]
- Naderpour, M.; Rizeei, H.M.; Ramezani, F. Forest fire risk prediction: A spatial deep neural network-based framework. Remote Sens. 2021, 13, 2513. [Google Scholar] [CrossRef]
- dos Santos, S.M.B.; Duverger, S.G.; Bento-Gonçalves, A.; Franca-Rocha, W.; Vieira, A.; Teixeira, G. Remote sensing applications for mapping large wildfires based on machine learning and time series in northwestern Portugal. Fire 2023, 6, 43. [Google Scholar] [CrossRef]
- Yue, W.; Ren, C.; Liang, Y.; Liang, J.; Lin, X.; Yin, A.; Wei, Z. Assessment of wildfire susceptibility and wildfire threats to ecological environment and urban development based on GIS and multi-source data: A case study of Guilin, China. Remote Sens. 2023, 15, 2659. [Google Scholar] [CrossRef]
- Zhang, G.; Wang, M.; Liu, K. Deep neural networks for global wildfire susceptibility modelling. Ecol. Indic. 2021, 127, 107735. [Google Scholar] [CrossRef]
- Agrawal, N.; Nelson, P.V.; Low, R.D. A novel approach for predicting large wildfires using machine learning towards environmental justice via environmental remote sensing and atmospheric reanalysis data across the United States. Remote Sens. 2023, 15, 5501. [Google Scholar] [CrossRef]
- Gholamnia, K.; Gudiyangada Nachappa, T.; Ghorbanzadeh, O.; Blaschke, T. Comparisons of diverse machine learning approaches for wildfire susceptibility mapping. Symmetry 2020, 12, 604. [Google Scholar] [CrossRef]
- Hu, P.; Tanchak, R.; Wang, Q. Developing risk assessment framework for wildfire in the United States–a deep learning approach to safety and sustainability. J. Saf. Sustain. 2024, 1, 26–41. [Google Scholar] [CrossRef]
- Iban, M.C.; Sekertekin, A. Machine learning based wildfire susceptibility mapping using remotely sensed fire data and GIS: A case study of Adana and Mersin provinces, Turkey. Ecol. Inform. 2022, 69, 101647. [Google Scholar] [CrossRef]
- Jain, P.; Coogan, S.C.; Subramanian, S.G.; Crowley, M.; Taylor, S.; Flannigan, M.D. A review of machine learning applications in wildfire science and management. Environ. Rev. 2020, 28, 478–505. [Google Scholar] [CrossRef]
- Janiec, P.; Gadal, S. A comparison of two machine learning classification methods for remote sensing predictive modeling of the forest fire in the North-Eastern Siberia. Remote Sens. 2020, 12, 4157. [Google Scholar] [CrossRef]
- Kang, Y.; Sung, T.; Im, J. Toward an adaptable deep-learning model for satellite-based wildfire monitoring with consideration of environmental conditions. Remote Sens. Environ. 2023, 298, 113814. [Google Scholar] [CrossRef]
- Kondylatos, S.; Prapas, I.; Ronco, M.; Papoutsis, I.; Camps-Valls, G.; Piles, M.; Fernández-Torres, M.; Carvalhais, N. Wildfire danger prediction and understanding with deep learning. Geophys. Res. Lett. 2022, 49, e2022GL099368. [Google Scholar] [CrossRef]
- Matougui, Z.; Zouidi, M. A temporal perspective on the reliability of wildfire hazard assessment based on machine learning and remote sensing data. Earth Sci. Inform. 2025, 18, 19. [Google Scholar] [CrossRef]
- Malik, A.; Jalin, N.; Rani, S.; Singhal, P.; Jain, S.; Gao, J. Wildfire risk prediction and detection using machine learning in San Diego, California. In Proceedings of the 2021 IEEE Smartworld, Ubiquitous Intelligence & Computing, Advanced & Trusted Computing, Scalable Computing & Communications, Internet of People and Smart City Innovation (SmartWorld/SCALCOM/UIC/ATC/IOP/SCI), Atlanta, GA, USA, 18–21 October 2021; pp. 622–629. [Google Scholar] [CrossRef]
- Prapas, I.; Kondylatos, S.; Papoutsis, I.; Camps-Valls, G.; Ronco, M.; Fernández-Torres, M.Á.; Guillem, P.M.; Carvalhais, N. Deep learning methods for daily wildfire danger forecasting. arXiv 2021, arXiv:2111.02736. [Google Scholar] [CrossRef]
- Seydi, S.T.; Hasanlou, M.; Chanussot, J. Burnt-Net: Wildfire burned area mapping with single post-fire Sentinel-2 data and deep learning morphological neural network. Ecol. Indic. 2022, 140, 108999. [Google Scholar] [CrossRef]
- Singh, H.; Ang, L.M.; Srivastava, S.K. Active wildfire detection via satellite imagery and machine learning: An empirical investigation of Australian wildfires. Nat. Hazards 2025, 121, 9777–9800. [Google Scholar] [CrossRef]
- Toan, N.T.; Cong, P.T.; Hung, N.Q.V.; Jo, J. A deep learning approach for early wildfire detection from hyperspectral satellite images. In Proceedings of the 2019 7th International Conference on Robot Intelligence Technology and Applications (RiTA), Daejeon, Republic of Korea, 1–3 November 2019; pp. 38–45. [Google Scholar] [CrossRef]
- Yang, J.; Jiang, H.; Wang, S.; Ma, X. A multi-scale deep learning algorithm for enhanced forest fire danger prediction using remote sensing images. Forests 2024, 15, 1581. [Google Scholar] [CrossRef]
- Yang, S.; Lupascu, M.; Meel, K.S. Predicting forest fire using remote sensing data and machine learning. Proc. AAAI Conf. Artif. Intell. 2021, 35, 14983–14990. [Google Scholar] [CrossRef]
- Bhowmik, R.T.; Jung, Y.S.; Aguilera, J.A.; Prunicki, M.; Nadeau, K. A multi-modal wildfire prediction and early-warning system based on a novel machine learning framework. J. Environ. Manag. 2023, 341, 117908. [Google Scholar] [CrossRef]
- Anderson-Bell, J.; Schillaci, C.; Lipani, A. Predicting non-residential building fire risk using geospatial information and convolutional neural networks. Remote Sens. Appl. Soc. Environ. 2021, 21, 100470. [Google Scholar] [CrossRef]
- Kang, D.K.; Olsen, M.J.; Fischer, E.; Jung, J. Residential wildfire structural damage detection using deep learning to analyze uncrewed aerial system (UAS) imagery, aerial imagery, and satellite imagery. Fire Mater. 2023, 49, 744–761. [Google Scholar] [CrossRef]
- Li, S.; Dao, V.; Kumar, M.; Nguyen, P.; Banerjee, T. Mapping the wildland-urban interface in California using remote sensing data. Sci. Rep. 2022, 12, 5789. [Google Scholar] [CrossRef] [PubMed]
- Nur, A.S.; Kim, Y.J.; Lee, J.H.; Lee, C.W. Spatial prediction of wildfire susceptibility using hybrid machine learning models based on support vector regression in Sydney, Australia. Remote Sens. 2023, 15, 760. [Google Scholar] [CrossRef]
- Adebisi, N.; Balogun, A.L.; Min, T.H.; Tella, A. Advances in estimating sea level rise: A review of tide gauge, satellite altimetry and spatial data science approaches. Ocean Coast. Manag. 2021, 208, 105632. [Google Scholar] [CrossRef]
- Bahari, N.A.A.B.S.; Ahmed, A.N.; Chong, K.L.; Lai, V.; Huang, Y.F.; Koo, C.H.; Ng, J.L.; El-Shafie, A. Predicting sea level rise using artificial intelligence: A review. Arch. Comput. Methods Eng. 2023, 30, 4045–4062. [Google Scholar] [CrossRef]
- Bengoufa, S.; Niculescu, S.; Mihoubi, M.K.; Belkessa, R.; Rami, A.; Rabehi, W.; Abbad, K. Machine learning and shoreline monitoring using optical satellite images: Case study of the Mostaganem shoreline, Algeria. J. Appl. Remote Sens. 2021, 15, 026509. [Google Scholar] [CrossRef]
- Boussetta, A.; Niculescu, S.; Bengoufa, S.; Zagrarni, M.F. Deep and machine learning methods for the (semi-) automatic extraction of sandy shoreline and erosion risk assessment basing on remote sensing data (case of Jerba island-Tunisia). Remote Sens. Appl. Soc. Environ. 2023, 32, 101084. [Google Scholar] [CrossRef]
- Chowdhury, P.; Lakku, N.K.G.; Lincoln, S.; Seelam, J.K.; Behera, M.R. Climate change and coastal morphodynamics: Interactions on regional scales. Sci. Total Environ. 2023, 899, 166432. [Google Scholar] [CrossRef]
- Dang, K.B.; Dang, V.B.; Ngo, V.L.; Vu, K.C.; Nguyen, H.; Nguyen, D.A.; Nguyen, T.D.L.; Pham, T.P.N.; Giang, T.L.; Nguyen, H.D.; et al. Application of deep learning models to detect coastlines and shorelines. J. Environ. Manag. 2022, 320, 115732. [Google Scholar] [CrossRef]
- Din, A.H.M.; Zulkifli, N.A.; Hamden, M.H.; Aris, W.A.W. Sea level trend over Malaysian seas from multi-mission satellite altimetry and vertical land motion corrected tidal data. Adv. Space Res. 2019, 63, 3452–3472. [Google Scholar] [CrossRef]
- Erdem, F.; Bayram, B.; Bakirman, T.; Bayrak, O.C.; Akpinar, B. An ensemble deep learning based shoreline segmentation approach (WaterNet) from Landsat 8 OLI images. Adv. Space Res. 2021, 67, 964–974. [Google Scholar] [CrossRef]
- Khurram, S.; Pour, A.B.; Bagheri, M.; Ariffin, E.H.; Akhir, M.F.; Hamzah, S.B. Developments in deep learning algorithms for coastline extraction from remote sensing imagery: A systematic review. Earth Sci. Inform. 2025, 18, 292. [Google Scholar] [CrossRef]
- Krishnamoorthy, R.; Tanaka, K.; Begum, M.A. Integrating GIS-remote sensing: A comprehensive approach to predict oceanographic health and coastal dynamics. Remote Sens. Earth Syst. Sci. 2025, 8, 200–212. [Google Scholar] [CrossRef]
- Kumar, L.; Afzal, M.S.; Afzal, M.M. Mapping shoreline change using machine learning: A case study from the eastern Indian coast. Acta Geophys. 2020, 68, 1127–1143. [Google Scholar] [CrossRef]
- Linh, T.G.; Kinh, B.D.; Thanh, Q.B. Coastline and shoreline change assessment in sandy coasts based on machine learning models and high-resolution satellite images. Vietnam J. Earth Sci. 2023, 45, 251–270. [Google Scholar]
- Lv, Q.; Wang, Q.; Song, X.; Ge, B.; Guan, H.; Lu, T.; Tao, Z. Research on coastline extraction and dynamic change from remote sensing images based on deep learning. Front. Environ. Sci. 2024, 12, 1443512. [Google Scholar] [CrossRef]
- Manaf, S.A.; Mustapha, N.; Sulaiman, M.N.; Husin, N.A.; Shafri, H.Z.M.; Razali, M.N. Hybridization of SLIC and Extra Tree for object-based image analysis in extracting shoreline from medium resolution satellite images. Int. J. Intell. Eng. Syst. 2018, 11, 62–72. [Google Scholar] [CrossRef]
- Shola, A.A.; Huaming, Y.U.; Kejian, W.U. Review of machine learning methods for sea level change modeling and prediction. Sci. Total Environ. 2024, 954, 176410. [Google Scholar]
- Tsiakos, C.A.D.; Chalkias, C. Use of machine learning and remote sensing techniques for shoreline monitoring: A review of recent literature. Appl. Sci. 2023, 13, 3268. [Google Scholar] [CrossRef]
- Park, S.J.; Achmad, A.R.; Syifa, M.; Lee, C.W. Machine learning application for coastal area change detection in Gangwon province, South Korea using high-resolution satellite imagery. J. Coast. Res. 2019, 90, 228–235. [Google Scholar] [CrossRef]
- Park, S.; Song, A. Shoreline change analysis with deep learning semantic segmentation using remote sensing and GIS data. KSCE J. Civ. Eng. 2024, 28, 928–938. [Google Scholar] [CrossRef]
- Pradeep, J.; Shaji, E.; Chandran, S.; Chandra, S.V.; Dev, S.D.; Babu, D.S. Assessment of coastal variations due to climate change using remote sensing and machine learning techniques: A case study from west coast of India. Estuar. Coast. Shelf Sci. 2022, 275, 107968. [Google Scholar] [CrossRef]
- Scala, P.; Manno, G.; Ciraolo, G. Semantic segmentation of coastal aerial/satellite images using deep learning techniques: An application to coastline detection. Comput. Geosci. 2024, 192, 105704. [Google Scholar] [CrossRef]
- Seale, C.; Redfern, T.; Chatfield, P.; Luo, C.; Dempsey, K. Coastline detection in satellite imagery: A deep learning approach on new benchmark data. Remote Sens. Environ. 2022, 278, 113044. [Google Scholar] [CrossRef]
- Splinter, K.D.; Harley, M.D.; Turner, I.L. Remote sensing is changing our view of the coast: Insights from 40 years of monitoring at Narrabeen-Collaroy, Australia. Remote Sens. 2018, 10, 1744. [Google Scholar] [CrossRef]
- Tzepkenlis, A.; Grammalidis, N.; Kontopoulos, C.; Charalampopoulou, V.; Kitsiou, D.; Pataki, Z.; Patera, A.; Nitis, T. An integrated monitoring system for coastal and Riparian areas based on remote sensing and machine learning. J. Mar. Sci. Eng. 2022, 10, 1322. [Google Scholar] [CrossRef]
- Vitousek, S.; Buscombe, D.; Vos, K.; Barnard, P.L.; Ritchie, A.C.; Warrick, J.A. The future of coastal monitoring through satellite remote sensing. Camb. Prism. Coast. Futures 2023, 1, e10. [Google Scholar] [CrossRef]
- Nieves, V.; Radin, C.; Camps-Valls, G. Predicting regional coastal sea level changes with machine learning. Sci. Rep. 2021, 11, 7650. [Google Scholar] [CrossRef]
- Raj, N.; Gharineiat, Z.; Ahmed, A.A.M.; Stepanyants, Y. Assessment and prediction of sea level trend in the South Pacific Region. Remote Sens. 2022, 14, 986. [Google Scholar] [CrossRef]
- Raj, N.; Brown, J. Prediction of mean sea level with GNSS-VLM correction using a hybrid deep learning model in Australia. Remote Sens. 2023, 15, 2881. [Google Scholar] [CrossRef]
- Raj, N.; Pasfield-Neofitou, S. Assessment and prediction of sea level and coastal wetland changes in small islands using remote sensing and artificial intelligence. Remote Sens. 2024, 16, 551. [Google Scholar] [CrossRef]
- Wang, G.; Li, P.; Li, Z.; Liu, J.; Zhang, Y.; Wang, H. InSAR and machine learning reveal new understanding of coastal subsidence risk in the Yellow River Delta, China. Sci. Total Environ. 2024, 915, 170203. [Google Scholar] [CrossRef]
- Ashphaq, M.; Srivastava, P.K.; Mitra, D. Advancing climate change research: Robust methodology for precise mapping of sea level rise using satellite-derived bathymetry and the Google Earth Engine API. Remote Sens. Appl. Soc. Environ. 2025, 38, 101557. [Google Scholar] [CrossRef]
- Munoz, D.F.; Munoz, P.; Alipour, A.; Moftakhari, H.; Moradkhani, H.; Mortazavi, B. Fusing multisource data to estimate the effects of urbanization, sea level rise, and hurricane impacts on long-term wetland change dynamics. IEEE J. Sel. Top. Appl. Earth Obs. Remote Sens. 2021, 14, 1768–1782. [Google Scholar] [CrossRef]
- Ennouali, Z.; Fannassi, Y.; Lahssini, G.; Benmohammadi, A.; Masria, A. Mapping coastal vulnerability using machine learning algorithms: A case study at north coastline of Sebou estuary, Morocco. Reg. Stud. Mar. Sci. 2023, 60, 102829. [Google Scholar] [CrossRef]
- Fogarin, S.; Zanetti, M.; Dal Barco, M.K.; Zennaro, F.; Furlan, E.; Torresan, S.; Pham, H.; Critto, A. Combining remote sensing analysis with machine learning to evaluate short-term coastal evolution trend in the shoreline of Venice. Sci. Total Environ. 2023, 859, 160293. [Google Scholar] [CrossRef] [PubMed]
- Sorkhabi, O.M.; Shadmanfar, B.; Al-Amidi, M.M. Deep learning of sea-level variability and flood for coastal city resilience. City Environ. Interact. 2023, 17, 100098. [Google Scholar] [CrossRef]
- He, Q.; Jiang, Z.; Wang, M.; Liu, K. Landslide and wildfire susceptibility assessment in Southeast Asia using ensemble machine learning methods. Remote Sens. 2021, 13, 1572. [Google Scholar] [CrossRef]
- Kim, C.; Park, S.; Han, H. Multi-hazard susceptibility mapping using machine learning approaches: A case study of South Korea. Remote Sens. 2025, 17, 1660. [Google Scholar] [CrossRef]
- Nachappa, T.G.; Ghorbanzadeh, O.; Gholamnia, K.; Blaschke, T. Multi-hazard exposure mapping using machine learning for the State of Salzburg, Austria. Remote Sens. 2020, 12, 2757. [Google Scholar] [CrossRef]
- Nguyen, H.D.; Dang, D.K.; Bui, Q.T.; Petrisor, A.I. Multi-hazard assessment using machine learning and remote sensing in the North Central region of Vietnam. Trans. GIS 2023, 27, 1614–1640. [Google Scholar] [CrossRef]
- Pourghasemi, H.R.; Pouyan, S.; Bordbar, M.; Golkar, F.; Clague, J.J. Flood, landslides, forest fire, and earthquake susceptibility maps using machine learning techniques and their combination. Nat. Hazards 2023, 116, 3797–3816. [Google Scholar] [CrossRef]
- Rahmati, O.; Yousefi, S.; Kalantari, Z.; Uuemaa, E.; Teimurian, T.; Keesstra, S.; Pham, T.D.; Tien Bui, D. Multi-hazard exposure mapping using machine learning techniques: A case study from Iran. Remote Sens. 2019, 11, 1943. [Google Scholar] [CrossRef]
- Yousefi, S.; Pourghasemi, H.R.; Emami, S.N.; Pouyan, S.; Eskandari, S.; Tiefenbacher, J.P. A machine learning framework for multi-hazards modeling and mapping in a mountainous area. Sci. Rep. 2020, 10, 12144. [Google Scholar] [CrossRef]
- Kamilaris, A.; Prenafeta-Boldú, F.X. Disaster monitoring using unmanned aerial vehicles and deep learning. arXiv 2018, arXiv:1807.11805. [Google Scholar] [CrossRef]
- Nex, F.; Duarte, D.; Tonolo, F.G.; Kerle, N. Structural building damage detection with deep learning: Assessment of a state-of-the-art CNN in operational conditions. Remote Sens. 2019, 11, 2765. [Google Scholar] [CrossRef]
- Padmaja, S.M.; Naveenkumar, R.; Kumari, N.L.; Pimo, E.S.J.; Bindhu, M.; Konduri, B.; Jangir, P. Deep learning in remote sensing for climate-induced disaster resilience: A comprehensive interdisciplinary approach. Remote Sens. Earth Syst. Sci. 2025, 8, 145–160. [Google Scholar] [CrossRef]
- Wang, C.; Yu, Q.; Law, K.H.; McKenna, F.; Yu, S.X.; Taciroglu, E.; Zsarnóczay, A.; Elhaddad, W.; Cetiner, B. Machine learning-based regional scale intelligent modeling of building information for natural hazard risk management. Autom. Constr. 2021, 122, 103474. [Google Scholar] [CrossRef]
- Abraham, K.; Abdelwahab, M.; Abo-Zahhad, M. Classification and detection of natural disasters using machine learning and deep learning techniques: A review. Earth Sci. Inform. 2024, 17, 869–891. [Google Scholar] [CrossRef]
- Kameswari, L. A review on application of machine learning techniques in climate change and disaster management. Technoarete Trans. Clim. Change Disaster Manag. Res. 2023, 2, 1–10. [Google Scholar]
- Kumar, D.; Bassill, N.P.; Ghosh, S. Analyzing recent trends in deep-learning approaches: A review on urban environmental hazards and disaster studies for monitoring, management, and mitigation toward sustainability. Int. J. Smart Sens. Intell. Syst. 2024, 17, 1–36. [Google Scholar] [CrossRef]
- Pugliese Viloria, A.D.J.; Folini, A.; Carrion, D.; Brovelli, M.A. Hazard susceptibility mapping with machine and deep learning: A literature review. Remote Sens. 2024, 16, 3374. [Google Scholar] [CrossRef]
- Caldecott, B.; Kruitwagen, L.; McCarten, M.; Zhou, X.; Lunsford, D.; Marchand, O.; Hadjikyriakou, P.; Bickel, V.; Sachs, T.; Bohn, N. Climate Risk Analysis from Space: Remote Sensing, Machine Learning, and the Future of Measuring Climate-Related Risk; University of Oxford: Oxford, UK, 2018; 53p, Available online: https://gfzpublic.gfz-potsdam.de/pubman/item/item_5001359_2 (accessed on 15 April 2025).
- Keenan, J.M.; Hill, T.; Gumber, A. Climate gentrification: From theory to empiricism in Miami-Dade County, Florida. Environ. Res. Lett. 2018, 13, 054001. [Google Scholar] [CrossRef]
- Ouazad, A. Coastal flood risk in the mortgage market: Storm surge models’ predictions vs. flood insurance maps. arXiv 2020, arXiv:2006.02977. [Google Scholar] [CrossRef]
- Bency, A.J.; Rallapalli, S.; Ganti, R.K.; Srivatsa, M.; Manjunath, B.S. Beyond spatial auto-regressive models: Predicting housing prices with satellite imagery. In Proceedings of the 2017 IEEE Winter Conference on Applications of Computer Vision (WACV), Santa Rosa, CA, USA, 24–31 March 2017; pp. 320–329. [Google Scholar]
- Yao, Y.; Zhang, J.; Hong, Y.; Liang, H.; He, J. Mapping fine-scale urban housing prices by fusing remotely sensed imagery and social media data. Trans. GIS 2018, 22, 561–581. [Google Scholar] [CrossRef]
- Serdavaa, B. A Satellite Image Analysis on Housing Conditions and the Effectiveness of the Affordable Housing Mortgage Program in Mongolia: A Deep Learning Approach. SSRN 4664966. 2023. Available online: https://papers.ssrn.com/sol3/papers.cfm?abstract_id=4664966 (accessed on 15 April 2025).
- Choy, L.H.; Ho, W.K. The use of machine learning in real estate research. Land 2023, 12, 740. [Google Scholar] [CrossRef]
- Dimopoulos, T.; Bakas, N. Sensitivity analysis of machine learning models for the mass appraisal of real estate: Case study of residential units in Nicosia, Cyprus. Remote Sens. 2019, 11, 3047. [Google Scholar] [CrossRef]
- Tchuente, D.; Nyawa, S. Real estate price estimation in French cities using geocoding and machine learning. Ann. Oper. Res. 2022, 308, 571–608. [Google Scholar] [CrossRef]
- Jui, A.H.; Alam, S.; Nasiruddin, M.; Ahmed, A.; Mohaimin, M.R.; Rahman, M.K.; Anonna, F.R.; Akter, R. Understanding negative equity trends in US housing markets: A machine learning approach to predictive analysis. J. Econ. Financ. Account. Stud. 2023, 5, 99–120. [Google Scholar] [CrossRef]
- Zhou, X.; Tong, W.; Li, D. Modeling housing rent in the Atlanta metropolitan area using textual information and deep learning. ISPRS Int. J. Geo-Inf. 2019, 8, 349. [Google Scholar] [CrossRef]
- Wei, Y.; Xu, K.; Yao, J.; Sun, M.; Sun, Y. Financial risk analysis using integrated data and transformer-based deep learning. J. Comput. Sci. Softw. Appl. 2024, 4, 1–8. [Google Scholar]
- Singireddy, S. Applying deep learning to mobile home and flood insurance risk evaluation. Am. Adv. J. Emerg. Discip. 2024, 2, 3067–4190. [Google Scholar] [CrossRef]
- Park, B.; Bae, J.K. Using machine learning algorithms for housing price prediction: The case of Fairfax County, Virginia housing data. Expert Syst. Appl. 2015, 42, 2928–2934. [Google Scholar] [CrossRef]
- Sadhwani, A.; Giesecke, K.; Sirignano, J. Deep learning for mortgage risk. J. Financ. Econom. 2021, 19, 313–368. [Google Scholar] [CrossRef]
- Tekouabou, S.C.; Gherghina, Ş.C.; Kameni, E.D.; Filali, Y.; Idrissi Gartoumi, K. AI-based on machine learning methods for urban real estate prediction: A systematic survey. Arch. Comput. Methods Eng. 2024, 31, 1079–1095. [Google Scholar] [CrossRef]
- Kuppan, K.; Acharya, D.B.; Divya, B. Foundational AI in insurance and real estate: A survey of applications, challenges, and future directions. IEEE Access 2024, 12, 181282–181302. [Google Scholar] [CrossRef]
- Woodhouse, I.H. Introduction to Microwave Remote Sensing; CRC Press: Boca Raton, FL, USA, 2017. [Google Scholar]
- Gerardi, K.; Herkenhoff, K.F.; Ohanian, L.E.; Willen, P.S. Can’t pay or won’t pay? Unemployment, negative equity, and strategic default. Rev. Financ. Stud. 2018, 31, 1098–1131. [Google Scholar] [CrossRef]
- Williams, L.; Kay, D. Might I have to move due to climate change? The role of exposure to risk and political partisanship in anticipation of future relocation. Clim. Change 2024, 177, 142. [Google Scholar] [CrossRef]
- Eusse-Villa, L.; Bonardi Pellizzari, C.; Franceschinis, C.; Thiene, M.; Borga, M.; Scolobig, A. Identification of maladaptive behavioural patterns in response to extreme weather events. Sci. Rep. 2024, 14, 10563. [Google Scholar] [CrossRef]
- Amnuaylojaroen, T. Advancements and challenges of artificial intelligence in climate modeling for sustainable urban planning. Front. Artif. Intell. 2025, 8, 1517986. [Google Scholar] [CrossRef] [PubMed]
- Sezer, O.B.; Gudelek, M.U.; Ozbayoglu, A.M. Financial time series forecasting with deep learning: A systematic literature review: 2005–2019. Appl. Soft Comput. 2020, 90, 106181. [Google Scholar] [CrossRef]
- Akbari, K.; Winter, S.; Tomko, M. Spatial causality: A systematic review on spatial causal inference. Geogr. Anal. 2023, 55, 56–89. [Google Scholar] [CrossRef]
- Kousky, C. Financing flood losses: A discussion of the national flood insurance program. Risk Manag. Insur. Rev. 2018, 21, 11–32. [Google Scholar] [CrossRef]
Disclaimer/Publisher’s Note: The statements, opinions and data contained in all publications are solely those of the individual author(s) and contributor(s) and not of MDPI and/or the editor(s). MDPI and/or the editor(s) disclaim responsibility for any injury to people or property resulting from any ideas, methods, instructions or products referred to in the content. |
© 2025 by the authors. Licensee MDPI, Basel, Switzerland. This article is an open access article distributed under the terms and conditions of the Creative Commons Attribution (CC BY) license (https://creativecommons.org/licenses/by/4.0/).