Abstract
Wetlands play a critical role in modulating the global carbon cycle and significantly contribute to climate change mitigation. China’s wetlands are characterized by high diversity, a large total area, wide distribution, and strong regional variability. However, the carbon exchange dynamics across different wetland types and their controlling mechanisms remain poorly understood. Here, we quantified and compared CO2 fluxes (gross primary productivity (GPP), ecosystem respiration (ER), and net ecosystem productivity (NEP)) among China’s wetland types using eddy covariance measurements, analyzing spatial patterns and controlling mechanisms. Coastal wetlands exhibited higher annual GPP, ER, and NEP compared with inland wetlands. Among all wetland types, mangrove ecosystems had the highest carbon uptake capacity. The carbon conversion efficiency (CCE) of inland wetlands (0.89 ± 0.24) was higher than that of coastal wetlands (0.66 ± 0.12), suggesting that inland wetlands are less efficient at carbon fixation than coastal wetlands. However, due to their larger total area than that of coastal wetlands, inland wetlands in China likely constitute a greater overall CO2 sink. Spatially, GPP and NEP showed significant differences between the tropical/subtropical zones and the temperate/plateau zones (p < 0.05), indicating the influence of climatic conditions. Climate factors influenced carbon fluxes primarily through their regulation of vegetation and soil features. The cascading relationships among climate, vegetation, and soil, as revealed by structural equation modeling (SEM), explained 61–71% of the spatial variation in GPP and ER, and 68% in NEP. Our findings provide valuable theoretical insights into the role of China’s wetland ecosystem in the global carbon cycle.
1. Introduction
Growing concerns about global climate change have increased interest in studying CO2 exchange processes and control mechanisms between the atmosphere and vegetation [1]. Wetlands, as key ecosystems in the carbon cycle, cover approximately 1% of the Earth’s surface area, yet they store about 15% of terrestrial carbon [2]. Studying the wetland ecosystem carbon balance is fundamental to understanding global carbon cycles.
Net ecosystem carbon exchange (NEP), which represents the relationship between gross primary production (GPP) and ecosystem respiration (ER), is a key indicator for assessing whether an ecosystem functions as a carbon source or sink [3]. Based on the measurements of CO2 flux (NEP, GPP and ER) from the eddy covariance method, previous studies have established that wetlands are highly productive ecosystems, with anaerobic conditions constraining respiratory carbon losses [4]. However, carbon sequestration capacity varies significantly among wetland types [5]. Wetlands may alter functioning as either net carbon sinks or sources, depending on environmental conditions and vegetation composition [6]. For instance, a marsh in the Winous Point Marsh Conservancy (Lake Erie) transitioned from being a long-term carbon sink to a source under abnormal climate conditions [7]. While tidal salt marshes are recognized as effective carbon sinks [8], studies of three diurnal intertidal marshes in Mobile Bay estuary revealed net carbon emissions due to elevated ecosystem respiration [9]. Additionally, carbon fluxes differ between natural and constructed wetlands [10], as well as between forested wetland communities and those dominated by water lotus [11]. These variations highlight the need to account for wetland type and community structure when evaluating wetlands’ roles in global carbon budgets.
China’s wetlands span 65.94 million hectares, representing 10% global wetland coverage [12]. China’s coastal wetlands cover approximately 5.80 million hectares [13], accounting for 12.7% of the global coastal wetland area [14,15], and play a key role in global blue carbon storage. Inland wetlands in China, including rivers, lakes, and marshes, account for approximately 7.1% of the world’s inland wetlands [16,17]. China’s wetlands are widely distributed across diverse geographical regions, ranging from tropical to boreal zones, coastal areas to inland regions, and lowland plains to high-elevation plateaus [12]. CO2 fluxes in wetland ecosystems exhibit significant spatiotemporal variability, influenced by wetland type [18], soil properties [19], and climatic conditions [13]. This heterogeneity establishes China’s wetlands as an ideal natural transect for investigating carbon exchange responses to environmental gradients. Understanding the spatial patterns and underlying mechanisms governing wetland carbon cycling across diverse climatic and ecological settings is fundamental for refining global carbon models and predicting wetland responses to climate change.
Several studies have investigated environmental drivers of CO2 fluxes in Chinese wetlands. Zhong et al. (2015) found that temperature and photosynthetically active radiation (PAR) were the primary micrometeorological factors driving seasonal variation in NEP in a reclaimed coastal wetland [20]. Chu et al. (2021) reported that annual NEP in a salt marsh was primarily influenced by precipitation during early plant growth [21]. Gou et al. (2024) identified solar radiation as the principal regulatory factor of NEP in aquaculture ponds and mangrove forests [22]. Rodda et al. (2022) observed a strong correlation between CO2 fluxes and the satellite-derived enhanced vegetation index (EVI) in the Sundarban mangrove forest [23]. Zhang et al. (2016) found a significant correlation between soil temperature and CO2 fluxes in the Zhangye oasis–desert region, China [24]. Wei et al. (2021) reported that both altitude-related patterns of GPP and ER had a negative relationship with soil water content (SWC) [25]. CO2 emissions and uptake are generally dependent on the presence of macrophytes, inundation extent, and temperature, as well as soil pH [26]. These studies indicated that carbon exchange capacity in wetlands is largely influenced by complex environmental factors, including meteorological, biological, and edaphic characteristics [14]. However, most studies have primarily examined the effects of a single environment factor (temperature, precipitation, or radiation) on carbon fluxes [27,28]. Owing to the vast geographical range of China’s wetlands, no single factor can adequately explain carbon flux variability.
Here, we compiled CO2 fluxes (GPP, ER and NEP) from eddy covariance measurements in China’s wetlands reported in the literature. The magnitude of these fluxes was then quantified across different climate zones and wetland types. This study aims to (1) quantify the magnitude and patterns of annual GPP, NEP, and ER across different climate zones in China, (2) compare these fluxes among different wetland types, (3) examine carbon allocation characteristics across wetland types, and (4) identify the underlying mechanisms driving carbon fluxes by establishing a cascading relationship among climate, vegetation, and soil. This research utilized China’s exceptionally wide spectrum of wetland ecosystems, spanning tropical to plateau climates, to investigate controls on wetland CO2 fluxes. The integrated eddy covariance dataset enables the quantification of national-scale carbon flux patterns while providing mechanistic insights into climate-mediated carbon cycling through vegetation and soil properties. These mechanistic understandings are valuable for projecting wetland carbon sequestration capacity under global change scenarios, with broad implications for international wetland management strategies.
2. Materials and Methods
2.1. Data Collection and Processing
2.1.1. Eddy Covariance Observations
We collected data from 38 eddy covariance sites located in wetlands across China (Table S1). Two types of CO2 flux data (GPP, ER and NEP) were acquired from eddy covariance observations: literature-based data and raw data. Literature data were obtained through systematic searches in the Web of Science (http://apps.webofknowledge.com/) and the China National Knowledge Infrastructure (https://www.cnki.net/) databases, using the keywords: wetland, eddy covariance, carbon flux, and China. Raw data were downloaded from National Ecosystem Science Data Center, National Science & Technology Infrastructure of China (http://www.nesdc.org.cn).The dataset includes 22 coastal wetland sites and 17 inland wetland sites, spanning four major climatic zones (Figure 1). In addition, site-specific information was collected, including wetland type, latitude (LAT, °), longitude (LON, °), and meteorological variables such as mean annual temperature (MAT, °C) and mean annual precipitation (MAP, mm).
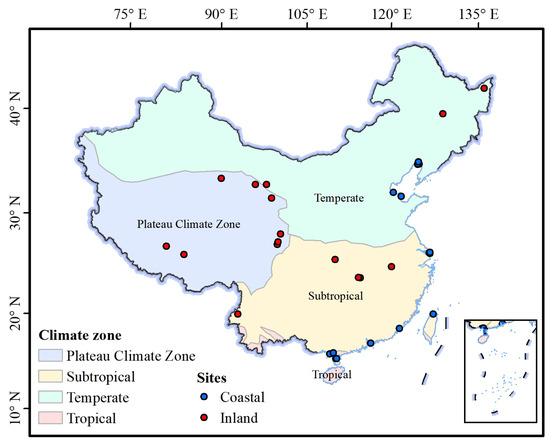
Figure 1.
Geographic distribution of wetland eddy covariance flux tower sites in China.
2.1.2. Environment Data from Remote Sensing
To better understand the effects of environmental controls on CO2 flux dynamics, biological and soil-related parameters were also collected. However, most published studies did not report these parameters. To compensate for the missing data, remote sensing products were used. Specifically, data on photosynthetically active radiation (PAR), leaf area index (LAI, %), enhanced vegetation index (EVI), and normalized difference vegetation index (NDVI) were obtained from Moderate-resolution Imaging Spectroradiometer (MODIS) products with a spatial resolution of 250 m. In addition, data on soil organic carbon (SOC, %), soil water content (SWC), soil bulk density (SBD), and pH within the top layer of soil were obtained from OpenLandMap. Soil temperature (Ts, °C) was sourced from [29]. Environmental variable data were extracted using the geographic coordinates of each eddy covariance site.
2.2. Data Analysis
Within this work, Python v3.11 was used to perform variance analysis, correlation analysis, and Bayesian structural equation modeling (SEM). One-way analysis of variance (ANOVA) was used to assess the significance of variations in GPP, NEP, and ER across different wetland types and climate zones. Spearman’s rank correlation coefficient was applied to quantify associations between these carbon flux metrics and environmental factors. A Bayesian SEM was constructed using the PyMC package in Python to model the cascading relationships between environmental variables and carbon fluxes. SEM enables the decomposition of net effects into direct and indirect pathways. Unlike traditional regression models, SEM allows interactions among environmental variables instead of treating each factor in isolation. To ensure that all variables contributed equally to the model results, the data were standardized before building the Bayesian SEM model. We implemented Bayesian SEM using two parallel Markov chain Monte Carlo (MCMC) chains, each running for 3000 iterations with an initial warm-up period of 1500 iterations. All Rhat values (the ratio of the effective sample size to the overall number of iterations) were below 1.01 and effective sample sizes exceeded 1000 for all coefficient estimates (Table S2), confirming model convergence. The estimate of a coefficient is considered significant when its confidence interval does not include zero. For model evaluation, we employed the leave-one-out cross-validation information criterion (LOOIC) and expected log predictive density (ELPD), where lower LOOIC values and higher ELPD values indicate better model performance [30,31]. The computed composite LOOIC value of 290.94 ± 22.57 suggests reasonable predictive capability.
3. Results
3.1. Spatial Patterns of Annual GPP, ER, and NEP Across Different Climate Zones
The carbon fluxes of China’s wetlands varied across different climate zones. GPP, ER, and NEP showed significant differences between the subtropical zone and both the temperate and plateau climate zones (p < 0.05), while no significant differences were found between the temperate and plateau zones (p > 0.05, Figure 2a–c). In the subtropical zone, GPP, ER, and NEP were 1683 ± 579 g C m−2 yr−1, 1167 ± 426 g C m−2 yr−1, and 523 ± 261 g C m−2 yr−1, respectively. These values were 1.9, 1.8, and 2.5 times higher than those in the temperate zone, and 2.4, 1.8, and 7.3 times higher than those in the plateau zone. GPP and NEP showed significant differences between the tropical zone and both the temperate and plateau climate zone (p < 0.05), while ER did not differ significantly. There were no significant differences in GPP, ER, and NEP between tropical and subtropical zone. Notably, ER was higher in the subtropical zone than in the tropical zone, even though GPP levels were comparable between the two.
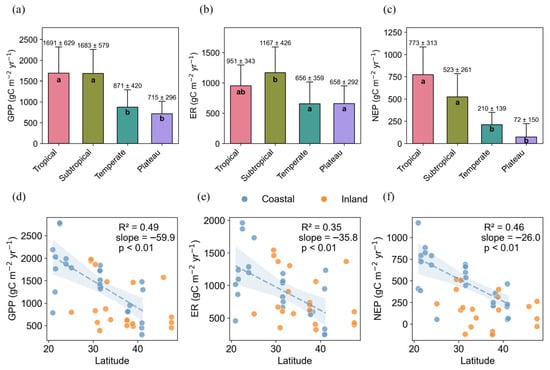
Figure 2.
Variations in GPP, ER, and NEP among climate zones (a–c), and their latitudinal relationships (d–f). The shaded areas represent the 95% confidence intervals of the regression lines.
Spatially, GPP, NEP, and ER in coastal wetlands showed clear latitudinal patterns, decreasing linearly with increasing latitude (Figure 2d–f). On average, for each 1° increase in latitude, GPP, NEP, and ER decreased by 59.9, 26.0, and 35.8 g C m−2 yr−1, respectively. In contrast, no significant latitudinal trends were observed for GPP, ER, or NEP in inland wetlands (p > 0.05).
3.2. The Comparison of GPP, ER, and NEP in Different Wetland Types
The annual CO2 fluxes were quantitatively contrasted between inland and coastal wetlands (Figure 3a–c). In general, the average annual GPP, ER, and NEP in coastal wetlands were 1444 ± 647, 947 ± 457, and 501 ± 290 g C m−2 yr−1 respectively, all of which were higher than those in inland wetlands (943 ± 545, 798 ± 404, and 158 ± 203 g C m−2 yr−1). Significant differences were found in average annual GPP and NEP between inland and coastal wetlands (p < 0.05), whereas ER did not differ significantly. The average annual NEP of coastal wetlands was approximately twice that of inland wetlands, indicating that coastal wetlands in China have a strong carbon sink capacity compared with inland wetlands.
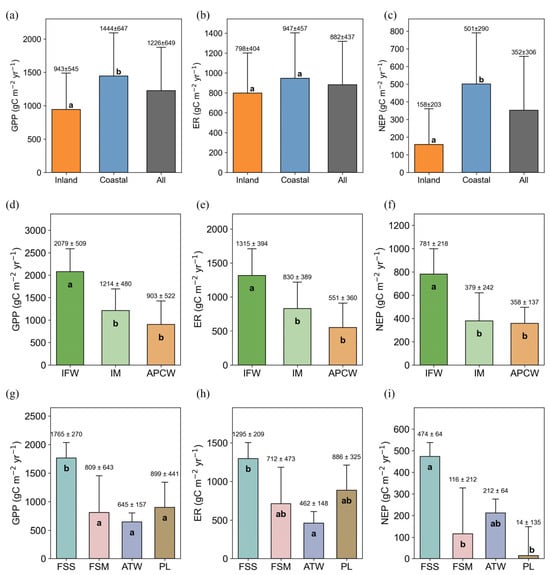
Figure 3.
Variations in GPP, ER, and NEP in China’s total wetlands, coastal wetlands, and inland wetlands (a–c), specific wetland types within inland (d–f) and coastal wetlands (g–i).
We also compared CO2 fluxes across wetland types in both inland and coastal wetlands (Figure 3d–i). Coastal wetlands comprise intertidal marshes (IMs), intertidal forested wetlands (IFWs), and anthropogenic perturbations coastal wetlands (APCWs) [5]. In China’s coastal wetlands, GPP, ER, and NEP differed significantly between IFW and both IM and APCW (Figure 3d–f). GPP, ER and NEP were significantly higher in IFW (2079 ± 509, 1315 ± 394, and 781 ± 218 g C m−2 yr−1) than in IM (1214 ± 480, 830 ± 389, and 379 ± 242 g C m−2 yr−1) and APCW (903 ± 522, 551 ± 360, and 358 ± 137 g C m−2 yr−1).
Inland wetlands consist of freshwater swamp marsh (FSM), freshwater shrub swamp (FSS), peatland (PL), and alpine tundra wetlands (ATWs). FSS exhibited significantly higher GPP than all other inland wetlands (p < 0.05, Figure 3g–i), but still lower than that in IFW. Annual ER differed significantly between FSS and ATW (p < 0.05), whereas NEP differed significantly between FSS and both FSM and PL. Annual GPP, ER, and NEP showed no significant differences among FSM, ATW, and PL (p > 0.05).
In general, IFWs, mainly consisting of mangrove ecosystems, had higher GPP than any other wetland type, indicating a greater carbon uptake capacity. IM had significantly higher GPP than FSM, PL, and ATW. Although PL showed higher GPP and ER than ATW and FSW, their NEP was the lowest due to the higher ER.
3.3. The Comparison of Carbon Allocation in Different Wetland Types
GPP showed significant positive correlations with both ER (R2 = 0.83, p < 0.001) and NEP (R2 = 0.65, p < 0.001) (Figure 4a,d). The slope of the ER relationship (0.61) was greater than that of NEP (0.38). On average, the carbon consumption efficiency (CCE, ER/GPP) and carbon use efficiency (CUE, NEP/GPP) of wetlands were 0.76 and 0.25, respectively (Figure 4b,e), suggesting that 76% of GPP was allocated to respiration, while 25% was retained as organic matter.
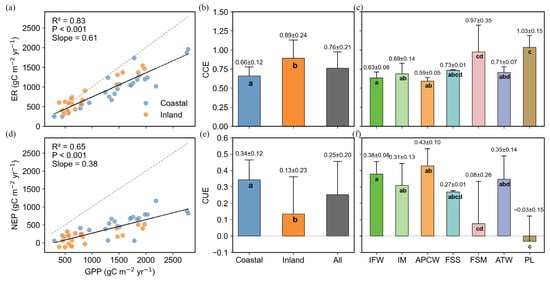
Figure 4.
Relationships between GPP and ER (a), GPP and NEP (d), and CCE(ER/GPP) and CUE (ER/GPP) in the total China’s wetlands, coastal wetlands, and inland wetlands (b,e), and specific wetland types within both inland and coastal wetlands (c,f). The different letters indicated significant differences among groups (p < 0.05).
All data points for coastal wetlands were located below the 1:1 line, establishing this coastal wetland as a totally autotrophic ecosystem (Figure 4a,d), while a few points in inland wetlands were located above the 1:1 line. The CCE of inland wetlands (0.89 ± 0.24) was higher than that of coastal wetlands (0.66 ± 0.12), indicating that coastal wetlands achieve more efficient carbon fixation. The CUE of inland wetlands was 0.13 ± 0.23, whereas that of coastal wetlands was 0.34 ± 0.12.
Among the different wetland types (Figure 4c,f), the highest CCE values were observed in PL (1.03 ± 0.15) and FSM (0.97 ± 0.35), indicating that nearly all GPP was consumed by respiration. APCW exhibited the highest CUE (0.43 ± 0.10), followed by IFW (0.38 ± 0.08) and ATW (0.35 ± 0.14).
3.4. The Effects of Environmental Variables on GPP, ER, and NEP
The heatmap analysis illustrated the correlations between GPP, NEP, and ER and various environmental variables, as well as interrelationships among the variables. Both mean annual temperature (MAT) and mean annual precipitation (MAP) showed significant positive correlations with wetland CO2 fluxes (p < 0.05, Figure 5). Linear regression analysis demonstrated that MAT explained 38–51% of the variation in coastal wetlands, and 39–55% of the variation in GPP, NEP, and ER in inland wetlands (Figure 6). MAP explained 54% and 61% of the variations in GPP and ER, respectively, in inland wetlands, which were higher than those in coastal wetlands (41% and 42%). As an important soil variable, soil temperature showed strong correlations with CO2 fluxes (Figure 5). In inland wetlands, each 1 °C increment in soil temperature resulted in increases of 61, 41, and 18 g C m−2 yr−1 in GPP, ER, and NEP, respectively.
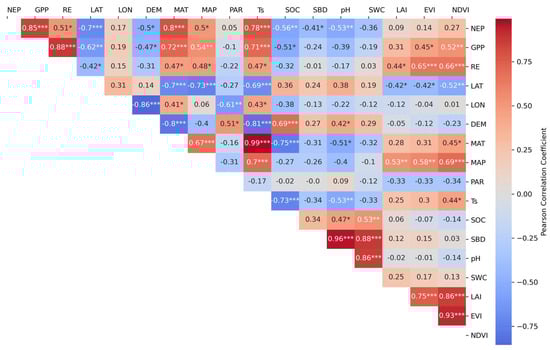
Figure 5.
Heat map of correlation coefficients between carbon fluxes (GPP, NEP, and ER) and: geographic factors (latitude (LAT, °), longitude (LON, °), and elevation (DEM, m)); climatic drivers (mean annual temperature (MAT, °C), mean annual precipitation (MAP, mm), and photosynthetically active radiation (PAR, MJ m−2 yr−1)); soil properties (soil temperature (Ts, °C), soil organic carbon (SOC, g kg−1), soil bulk density (SBD, kg m−3), soil pH, and soil water content (SWC, %)); and vegetation indices (leaf area index (LAI, m2 m−2), enhanced vegetation index (EVI), and normalized difference vegetation index (NDVI)). Inter-parameter correlations are also shown. Significance levels: * p < 0.05, ** p < 0.01, *** p < 0.001.
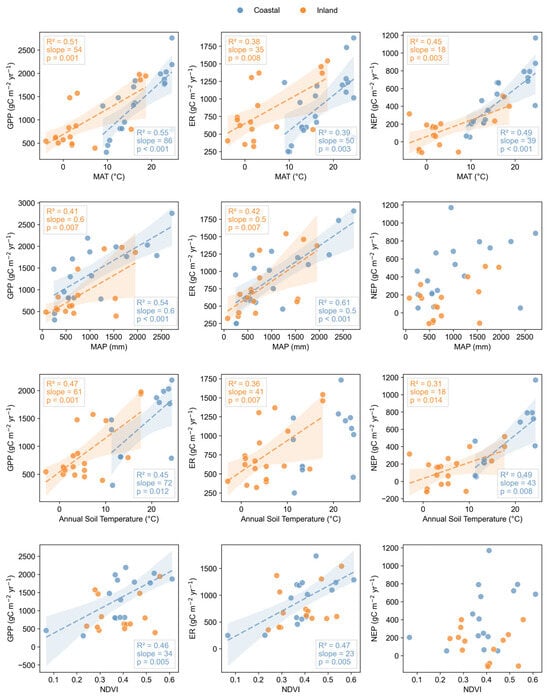
Figure 6.
Linear relationships between carbon fluxes (GPP, ER, and NEP) and environmental drivers (MAT, MAP, Ts, and NDVI) in China’s wetlands.
Moreover, spectral vegetation indices such as NDVI and EVI showed significant positive correlations with both GPP and ER (Figure 6). In inland wetlands, NDVI could explain 46% and 47% of the variations in GPP and RE. In coastal wetlands, NDVI has no significant relationship with CO2 flux. Significant interrelationships were observed among environmental variables. For example, significant positive correlations were observed among longitude (LON), elevation (DEM), soil temperature (Ts), and MAT, as well as NDVI, EVI, and LAI.
In general, wetland CO2 flux was strongly affected by a combination of geographic, climatic, biological, and edaphic factors. Following the hypothesized cascading relationships among geography, climate, vegetation, and soil, we constructed a SEM to quantify the pathways linking these factors to carbon fluxes (Figure 7). The geography factor (LAT) showed the strongest negative effect on climate factors (combined effects of MAT and MAP), which subsequently explained 69% of the variations in vegetation (NDVI). Climate and vegetation jointly influenced soil conditions (Ts), explaining 61% of the variation. GPP was primarily modulated by vegetation and climate, with a combined explanatory power of 71%. GPP and soil collectively determined the ER, explaining 68% of its variation. Climate, GPP, and ER together explained 61% of the spatial variation in NEP.
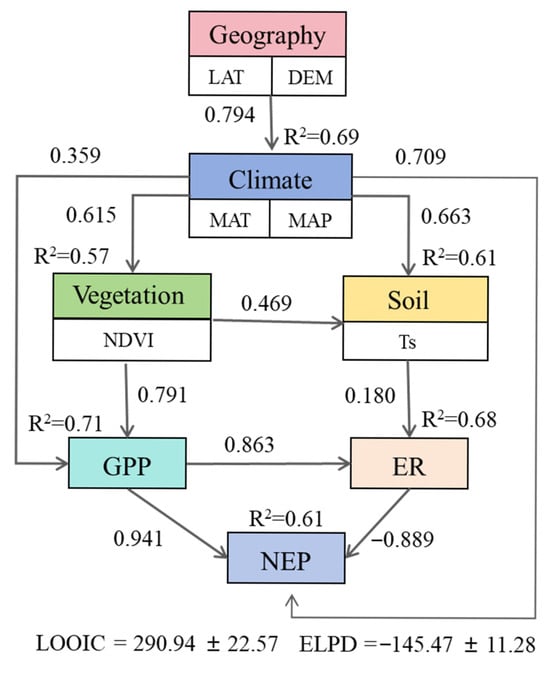
Figure 7.
Conceptual framework illustrating the relative influence of geographical (latitude, longitude, and elevation), climatic (MAT and MAP), vegetative (NDVI), and soil (Ts) factors on GPP, ER, and NEP in China’s wetlands. Line weights indicate standardized path coefficients.
4. Discussion
4.1. Differences in Carbon Dioxide Fluxes Between Inland and Coastal Wetlands
Our national-scale analysis revealed distinct patterns in CO2 flux dynamics between inland and coastal wetlands. In general, the mean value of China’s wetlands was 352 ± 306 g C m−2 yr−1, which significantly exceeded the global wetland mean NEP (56.4 g C m−2 yr−1) [32]. Inland wetlands generally functioned as modest CO2 sinks or approached carbon neutrality, whereas coastal wetlands typically exhibited greater CO2 sequestration capacity. This underscores their critical role in offsetting anthropogenic CO2 emissions, aligning with previous reports of coastal wetlands serving as robust carbon sinks compared with their inland counterparts [5,26]. Coastal wetlands play a significant role in regulating the global carbon cycle and mitigating global warming, and are thus increasingly recognized as nature-based solutions for climate change mitigation [33]. Notably, annual CO2 fluxes varied significantly across different sub-types of inland and coastal wetlands. The intertidal forested wetlands (IFWs, mangrove-dominated) had the highest carbon uptake capacity (781 ± 218 g C m−2 yr−1) among all wetland types. Susana Alvarado-Barrientos et al. demonstrated that mangrove ecosystems in Puerto Morelos, Quintana Roo, Mexico, function as annual net CO2 sinks (709 ± 09 g C m−2 yr−1) [34]. According to a newly revised global blue carbon budget, mangrove ecosystems exhibit a mean NEP of 794 g C m−2 yr−1 [35]. Cui et al. (2018) found that mangrove wetlands could sequester significantly more carbon than adjacent terrestrial forests [36]. Intertidal marshes (IMs) also showed relatively higher NEP (379 ± 242 g C m−2 yr−1), which is slightly lower than that reported for IMs globally [5]. Peatlands exhibited the lowest NEP due to the relatively high RE. In contrast with salt marshes, peatlands store less carbon per unit area [4]. Mangroves achieved the highest NEP due to the high GPP coupled with suppressed ER (from tidal flushing and salinity) and large belowground biomass, facilitating long-term burial. Salt marshes followed a similar pattern, but with lower NEP than that of mangroves due to the shallower root systems and reduced biomass. Peatlands had low NEP despite significant carbon stocks because slow GPP was counterbalanced by persistent ER from deep organic layers. The divergence in GPP and NEP across wetlands arises from interactions between salinity, hydrology, nutrient availability, and plant adaptations. Coastal systems leverage tidal energy for nutrient renewal and salinity-driven suppression of respiration, maximizing carbon use efficiency [37]. Inland peatlands prioritize long-term storage over high productivity, while freshwater marshes are highly sensitive to nutrient fluxes and hydroperiods [38,39]. Vegetation traits (e.g., mangrove root vs. moss dominance) further modulate carbon partitioning between GPP and ER.
However, inland wetlands constitute the predominant proportion of wetland areas, accounting for 70.5% of China’s total wetland area. Among the subtypes, inland marshes and swamps covered 152,429 ± 373 and 8230 ± 191 km2, respectively, whereas coastal marshes and swamps covered 2979 ± 22 and 259 ± 15 km2, respectively [40]. Applying the mean annual NEP rates observed in inland and coastal wetlands to wetlands over China, the annual net CO2 uptake of inland marsh and swamp would be 31.5 Tg C yr−1, while that of coastal marsh and swamp would be 0.59 Tg C yr−1, respectively. Additionally, aquaculture ponds, covering 11,896 ± 124 km2, are estimated to sequester 4.1 Tg C yr−1. Therefore, China’s inland wetlands together likely constitute a larger overall CO2 sink than coastal wetlands. At the global scale, Lu et al. also found that the annual net CO2 uptake of global inland wetlands (3092.49 Tg C yr−1) was higher than that of coastal wetlands (101.89 Tg C yr−1) [5]. From this perspective, coastal wetlands may appear to contribute insignificantly to carbon sequestration, primarily due to their limited spatial coverage. However, this observation implies that, while their current contribution to the overall carbon budget may seem modest, coastal wetlands demonstrate remarkable carbon sequestration efficiency per unit area. This underscores their significant potential for climate change mitigation should their areal extent increase. Consequently, protecting and restoring coastal wetlands—such as through expanded mangrove rehabilitation efforts—becomes imperative to enhance their crucial role in climate regulation.
4.2. Carbon Allocation in Coastal and Inland Wetland Ecosystems
The relationships among carbon fluxes reflect carbon allocation patterns across different ecosystems [41]. Our results showed that both ER and NEP were positively correlated with GPP in wetlands (Figure 4a,d). This aligns well with the observed covariation among GPP, NEP, and ER in ecosystems across Europe [41], China [14,42], and global ecosystems [43]. The CCE of wetlands in this study was 0.76 (Figure 4b), lower than the global average for terrestrial ecosystems (0.87) [43], but higher than that of China’s terrestrial ecosystems (0.68) [42].
Both inland and coastal wetlands exhibited strong positive correlations between annual GPP and ER, demonstrating that GPP served as the primary source of substrate for RE. However, we observed distinct carbon allocation patterns between these wetland types. Inland wetlands allocated 89% of GPP to RE, higher than the 66% observed in coastal wetlands. Conversely, only 13% of GPP contributed to NEP in inland wetlands, compared with 34% in coastal wetlands. These results are consistent with a global study [5], which reported that 93% and 67% of GPP allocated to RE, and 7% and 33% to NEP, in inland and coastal wetlands, respectively.
Among the subtype’s wetlands, APCW and IFM exhibited the highest CCE. IFW, such as mangroves and estuarine forests, are characterized by high photosynthetic efficiency and low respiratory loss. A newly revised blue carbon budget for the world’s mangroves indicates a mean ecosystem GPP to ER ratio of 1.35, reflecting net autotrophy [35]. Anthropogenically disturbed coastal wetlands mainly include areas where mangroves and salt marshes have been converted to aquaculture ponds or paddy fields. A study comparing natural and artificial wetlands in the Sanjiang Plain by Song (2007) also found that converting wetlands into paddy fields increased carbon fixation, with rice paddies fixing 218 g C m−2 yr−1 more NEP during the growing season than natural wetlands [44].
4.3. Spatial Patterns of Ecosystem Carbon Fluxes and Controlling Mechanisms in China’s Wetland
China’s wetlands span a wide range of biogeographic regions and exhibit substantial climatic heterogeneity. As a result, carbon fluxes varied significantly across climatic zones. GPP and NEP showed significant differences between the tropical/subtropical zones and the temperate/plateau zones (p < 0.05, Figure 2). However, no significant differences in ER between the tropical zone and either the temperate or plateau zones were observed. This is primarily attributed to the relatively low ER in the tropical zone. Observations in the tropical zone only include mangrove sites, which exhibited significantly lower ER than adjacent terrestrial forests in a previous study [36].
Additionally, Lu et al. (2017) found that MAT and MAP accounted for 71% (GPP), 54% (ER), and 57% (NEP) of the variations [5]. In this study, considering both inland and coastal wetlands, annual CO2 fluxes exhibited significant correlations with MAT and MAP (Figure 6). Our SEM results showed that climate (MAT and MAP) had a direct effect on GPP (0.359) and an indirect effect via vegetation on GPP (0.791), together explaining 71% of the variation in GPP (Figure 7). MAT and MAP influenced ER indirectly through soil factors, and together with GPP, they explained 68% of the variation in ER. Our SEM results confirmed that climate factors regulate wetland carbon fluxes primarily through their effects on vegetation characteristics and soil conditions. The consistent cascading controls provide a transferable framework for predicting wetland carbon responses globally, particularly in data-scarce regions sharing similar climate–vegetation couplings. Furthermore, the integrated quantification of CCE divergence between coastal and inland wetlands offers transferable benchmarks for assessing wetland restoration priorities worldwide, particularly under the Intergovernmental Panel on Climate Change (IPCC) climate scenarios where blue carbon ecosystems gain prominence in international mitigation portfolios.
Although this study integrated flux observation data from as many monitoring sites as possible, the extensive distribution and high fragmentation of wetlands across China may limit the representativeness of current sites for all wetland types. The uneven distribution of monitoring sites among different wetland types, particularly the scarcity of observations for certain categories like freshwater wetlands, may introduce uncertainties to the analysis results. Additionally, the quantification of carbon sink capacity involves significant uncertainties due to complex interactions among atmospheric, vegetation, soil, and aquatic components. Coastal wetlands continuously export carbon laterally to adjacent ecosystems [45], with studies showing that tidal export of dissolved inorganic carbon (DIC) from salt marshes to oceans can offset 69% of regional net ecosystem productivity [46]. Future research should prioritize establishing long-term monitoring networks across diverse wetland types, especially in data-deficient regions, while incorporating all potential carbon processes (including lateral carbon fluxes) into comprehensive carbon budget assessments to improve the accuracy of wetland carbon sequestration estimates. The development of integrated assessment models accounting for multi-interface carbon cycling processes would be particularly valuable for advancing our understanding of coastal wetland carbon dynamics.
5. Conclusions
This study systematically characterized ecosystem carbon fluxes and analyzed their controlling mechanisms across China’s wetlands. Distinct spatial patterns were revealed, with coastal wetlands exhibiting higher annual GPP, ER, and NEP than inland wetlands. Notably, coastal wetlands demonstrated 3.2 times higher NEP and 2.6 times higher carbon use efficiency than inland wetlands, highlighting their superior carbon sequestration potential. Nevertheless, the extensive spatial coverage of inland wetlands implied their predominant contribution to China’s national-scale wetland carbon sink. Crucially, climatic drivers indirectly regulated GPP and ER through cascading effects on vegetation physiology and soil carbon processes, with structural equation models explaining 68–71% of their spatial variance. These mechanistic insights underscore the necessity of region-specific conservation strategies, such as prioritizing coastal wetland protection and mangrove restoration. Building on these findings and addressing spatial data gaps, future research should prioritize expanding long-term monitoring across diverse wetlands, especially in data-deficient regions, and incorporate all carbon processes to refine sequestration estimates.
Supplementary Materials
The following supporting information can be downloaded at: https://www.mdpi.com/article/10.3390/land14081629/s1, Tabe S1: The information of 38 eddy covariance sites; Table S2: Posterior Summary Statistics for Bayesian SEM Parameters.
Author Contributions
Conceptualization, F.D., X.L. (Xiaojing Liu) and D.Y.; methodology, F.D. and X.L. (Xiaojing Liu); software, X.L. (Xixi Li) and X.K.; validation, F.D., X.L. (Xiaojing Liu) and D.Y.; formal analysis, Z.C. and J.L.; resources, Z.C., J.L. and X.K.; data curation, F.D. and Z.C.; writing—original draft preparation, F.D.; writing—review and editing, F.D. and X.L. (Xiaojing Liu); visualization, X.L. (Xixi Li) and Y.W.; project administration, X.L. (Xiaojing Liu) and D.Y.; funding acquisition, D.Y. All authors have read and agreed to the published version of the manuscript.
Funding
This research was funded by the Natural Resources Development Funds of Jiangsu Province (JSZRHYKJ202310).
Data Availability Statement
The data presented in this study are available on request from the corresponding author upon reasonable request.
Acknowledgments
We acknowledge Dandan Du for her technical guidance in implementing the Python code used for data analysis and model construction in this study.
Conflicts of Interest
The authors declare no conflicts of interest.
References
- Zhou, L.; Zhou, G.; Jia, Q. Annual Cycle of CO2 Exchange Over a Reed (Phragmites australis) Wetland in Northeast China. Aquat. Bot. 2009, 91, 91–98. [Google Scholar] [CrossRef]
- Zhang, F.; Liu, A.; Li, Y.; Zhao, L.; Wang, Q.; Du, M. CO2 Flux in Alpine Wetland Ecosystem on the Qinghai-Tibetan Plateau, China. Acta Ecol. Sin. 2008, 28, 453–462. [Google Scholar] [CrossRef]
- Bonneville, M.-C.; Strachan, I.B.; Humphreys, E.R.; Roulet, N.T. Net ecosystem CO2 exchange in a temperate cattail marsh in relation to biophysical properties. Agric. For. Meteorol. 2008, 148, 69–81. [Google Scholar] [CrossRef]
- Chmura, G.L.; Anisfeld, S.C.; Cahoon, D.R.; Lynch, J.C. Global carbon sequestration in tidal, saline wetland soils. Glob. Biogeochem. Cycles 2003, 17, 1111. [Google Scholar] [CrossRef]
- Lu, W.; Xiao, J.; Liu, F.; Zhang, Y.; Liu, C.a.; Lin, G. Contrasting ecosystem CO2 fluxes of inland and coastal wetlands: A meta-analysis of eddy covariance data. Glob. Change Biol. 2016, 23, 1180–1198. [Google Scholar] [CrossRef]
- Cao, S.; Cao, G.; Feng, Q.; Han, G.; Lin, Y.; Yuan, J.; Wu, F.; Cheng, S. Alpine wetland ecosystem carbon sink and its controls at the Qinghai Lake. Environ. Earth Sci. 2017, 76, 210. [Google Scholar] [CrossRef]
- Chu, H.; Gottgens, J.F.; Chen, J.; Sun, G.; Desai, A.R.; Ouyang, Z.; Shao, C.; Czajkowski, K. Climatic variability, hydrologic anomaly, and methane emission can turn productive freshwater marshes into net carbon sources. Glob. Change Biol. 2014, 21, 1165–1181. [Google Scholar] [CrossRef]
- Chmura, G.L. What do we need to assess the sustainability of the tidal salt marsh carbon sink? Ocean. Coast. Manag. 2013, 83, 25–31. [Google Scholar] [CrossRef]
- Wilson, B.J.; Mortazavi, B.; Kiene, R.P. Spatial and temporal variability in carbon dioxide and methane exchange at three coastal marshes along a salinity gradient in a northern Gulf of Mexico estuary. Biogeochemistry 2015, 123, 329–347. [Google Scholar] [CrossRef]
- Kayranli, B.; Scholz, M.; Mustafa, A.; Hedmark, Å. Carbon Storage and Fluxes Within Freshwater Wetlands: A Critical Review. Wetlands 2009, 30, 111–124. [Google Scholar] [CrossRef]
- Bernal, B.; Mitsch, W.J. Comparing carbon sequestration in temperate freshwater wetland communities. Glob. Change Biol. 2012, 18, 1636–1647. [Google Scholar] [CrossRef]
- Ma, Z.; Lu, M.; Jin, H.; Sheng, X.; Wei, H.; Yang, Q.; Qi, L.; Huang, J.; Chen, L.; Dou, X. Greenhouse gas emissions and environmental drivers in different natural wetland regions of China. Environ. Pollut. 2023, 330, 121754. [Google Scholar] [CrossRef] [PubMed]
- Hu, M.; Sardans, J.; Yang, X.; Peñuelas, J.; Tong, C. Patterns and environmental drivers of greenhouse gas fluxes in the coastal wetlands of China: A systematic review and synthesis. Environ. Res. 2020, 186, 109576. [Google Scholar] [CrossRef] [PubMed]
- Wang, J.; Yu, G.; Han, L.; Yao, Y.; Sun, M.; Yan, Z. Ecosystem carbon exchange across China’s coastal wetlands: Spatial patterns, mechanisms, and magnitudes. Agric. For. Meteorol. 2024, 345, 109859. [Google Scholar] [CrossRef]
- Barbier, E.B.; Hacker, S.D.; Kennedy, C.; Koch, E.W.; Stier, A.C.; Silliman, B.R. The value of estuarine and coastal ecosystem services. Ecol. Monogr. 2011, 81, 169–193. [Google Scholar] [CrossRef]
- State Forestry Administration (SFA). Outcomes of the Second National Wetland Resources Survey. Available online: http://www.china.com.cn/zhibo/zhuanti/ch-xinwen/2014-01/13/content_31170329.htm (accessed on 26 July 2025).
- National Bureau of Statistics of China (NBSC). China Statistical Yearbook; China Statistics Press: Beijing, China, 2022; ISBN 978-7-5037-9950-1.
- Olefeldt, D.; Euskirchen, E.S.; Harden, J.; Kane, E.; McGuire, A.D.; Waldrop, M.P.; Turetsky, M.R. A decade of boreal rich fen greenhouse gas fluxes in response to natural and experimental water table variability. Glob. Change Biol. 2017, 23, 2428–2440. [Google Scholar] [CrossRef]
- Estop-Aragonés, C.; Zając, K.; Blodau, C. Effects of extreme experimental drought and rewetting on CO2 and CH4 exchange in mesocosms of 14 European peatlands with different nitrogen and sulfur deposition. Glob. Change Biol. 2016, 22, 2285–2300. [Google Scholar] [CrossRef]
- Zhong, Q.; Wang, K.; Lai, Q.; Zhang, C.; Zheng, L.; Wang, J. Carbon Dioxide Fluxes and Their Environmental Control in a Reclaimed Coastal Wetland in the Yangtze Estuary. Estuaries Coasts 2015, 39, 344–362. [Google Scholar] [CrossRef]
- Chu, X.; Han, G.; Wei, S.; Xing, Q.; He, W.; Sun, B.; Li, X.; Hui, D.; Wu, H.; Wang, X.; et al. Seasonal not annual precipitation drives 8-year variability of interannual net CO2 exchange in a salt marsh. Agric. For. Meteorol. 2021, 308–309, 108557. [Google Scholar] [CrossRef]
- Gou, R.; Feng, J.; Zhou, H.; Lang, T.; Zhao, J.; Mo, L.; Song, S.; Lin, G. CO2 fluxes contrast between aquaculture ponds and mangrove forests and its implications for coastal wetland rehabilitation in Leizhou Peninsula, China. Agric. Ecosyst. Environ. 2024, 367, 108968. [Google Scholar] [CrossRef]
- Rodda, S.R.; Thumaty, K.C.; Fararoda, R.; Jha, C.S.; Dadhwal, V.K. Unique Characteristics of Ecosystem CO2 Exchange in Sundarban Mangrove Forest and Their Relationship with Environmental Factors. Estuar. Coast. Shelf Sci. 2022, 267, 107764. [Google Scholar] [CrossRef]
- Zhang, Q.; Sun, R.; Jiang, G.; Xu, Z.; Liu, S. Carbon and energy flux from a Phragmites australis wetland in Zhangye oasis-desert area, China. Agric. For. Meteorol. 2016, 230–231, 45–57. [Google Scholar] [CrossRef]
- Wei, D.; Qi, Y.; Ma, Y.; Wang, X.; Ma, W.; Gao, T.; Huang, L.; Zhao, H.; Zhang, J.; Wang, X. Plant uptake of CO2 outpaces losses from permafrost and plant respiration on the Tibetan Plateau. Proc. Natl. Acad. Sci. USA 2021, 118, e2015283118. [Google Scholar] [CrossRef] [PubMed]
- Xiao, D.; Deng, L.; Kim, D.G.; Huang, C.; Tian, K. Carbon budgets of wetland ecosystems in China. Glob. Change Biol. 2019, 25, 2061–2076. [Google Scholar] [CrossRef] [PubMed]
- Han, G.; Xing, Q.; Yu, J.; Luo, Y.; Li, D.; Yang, L.; Wang, G.; Mao, P.; Xie, B.; Mikle, N. Agricultural reclamation effects on ecosystem CO2 exchange of a coastal wetland in the Yellow River Delta. Agric. Ecosyst. Environ. 2014, 196, 187–198. [Google Scholar] [CrossRef]
- Han, G.; Chu, X.; Xing, Q.; Li, D.; Yu, J.; Luo, Y.; Wang, G.; Mao, P.; Rafique, R. Effects of episodic flooding on the net ecosystem CO2 exchange of a supratidal wetland in the Yellow River Delta. J. Geophys. Res. Biogeosciences 2015, 120, 1506–1520. [Google Scholar] [CrossRef]
- Lembrechts, J.J.; van den Hoogen, J.; Aalto, J.; Ashcroft, M.B.; De Frenne, P.; Kemppinen, J.; Kopecký, M.; Luoto, M.; Maclean, I.M.D.; Crowther, T.W.; et al. Global maps of soil temperature. Glob. Change Biol. 2022, 28, 3110–3144. [Google Scholar] [CrossRef]
- Vehtari, A.; Gelman, A.; Gabry, J. Practical Bayesian model evaluation using leave-one-out cross-validation and WAIC. Stat. Comput. 2016, 27, 1413–1432. [Google Scholar] [CrossRef]
- Yan, P.; Fernández-Martínez, M.; Van Meerbeek, K.; Yu, G.; Migliavacca, M.; He, N. The essential role of biodiversity in the key axes of ecosystem function. Glob. Change Biol. 2023, 29, 4569–4585. [Google Scholar] [CrossRef]
- Li, J.; Yuan, J.; Ciais, P.; Kang, H.; Freeman, C.; Huang, Y.; Dong, Y.; Liu, D.; Li, Y.; Ding, W. Two decades of improved wetland carbon sequestration in northern mid-to-high latitudes are offset by tropical and southern declines. Nat. Ecol. Evol. 2025. [Google Scholar] [CrossRef]
- Wang, F.; Liu, J.; Qin, G.; Zhang, J.; Zhou, J.; Wu, J.; Zhang, L.; Thapa, P.; Sanders, C.J.; Santos, I.R.; et al. Coastal blue carbon in China as a nature-based solution toward carbon neutrality. Innovation 2023, 4, 100481. [Google Scholar] [CrossRef]
- Alvarado-Barrientos, M.S.; López-Adame, H.; Lazcano-Hernández, H.E.; Arellano-Verdejo, J.; Hernández-Arana, H.A. Ecosystem-Atmosphere Exchange of CO2, Water, and Energy in a Basin Mangrove of the Northeastern Coast of the Yucatan Peninsula. J. Geophys. Res. Biogeosciences 2021, 126, e2020JG005811. [Google Scholar] [CrossRef]
- Alongi, D.M. Lateral Export and Sources of Subsurface Dissolved Carbon and Alkalinity in Mangroves: Revising the Blue Carbon Budget. J. Mar. Sci. Eng. 2022, 10, 1916. [Google Scholar] [CrossRef]
- Cui, X.; Liang, J.; Lu, W.; Chen, H.; Liu, F.; Lin, G.; Xu, F.; Luo, Y.; Lin, G. Stronger ecosystem carbon sequestration potential of mangrove wetlands with respect to terrestrial forests in subtropical China. Agric. For. Meteorol. 2018, 249, 71–80. [Google Scholar] [CrossRef]
- Sun, B.; Yan, L.; Jiang, M.; Li, X.; Han, G.; Xia, J. Reduced magnitude and shifted seasonality of CO2 sink by experimental warming in a coastal wetland. Ecology 2021, 102, e03236. [Google Scholar] [CrossRef] [PubMed]
- Jordan, T.E.; Correll, D.L.; Whigham, D.F. Nutrient flux in the Rhode River: Tidal exchange of nutrients by brackish marshes. Estuar. Coast. Shelf Sci. 1983, 17, 651–667. [Google Scholar] [CrossRef]
- Yang, L.; Han, G.; Yu, J.; Wu, L.; Zhu, M.; Xing, Q.; Wang, G.; Mao, P. Net Ecosystem CO2 Exchange and its Environmental Regulation Mechanisms in a Reed Wetland in the Yellow River Delta of China During the Growth Season. Chin. J. Appl. Ecol. 2013, 24, 2415–2422. [Google Scholar] [CrossRef]
- Mao, D.; Wang, Z.; Du, B.; Li, L.; Tian, Y.; Jia, M.; Zeng, Y.; Song, K.; Jiang, M.; Wang, Y. National wetland mapping in China: A new product resulting from object-based and hierarchical classification of Landsat 8 OLI images. ISPRS J. Photogramm. Remote Sens. 2020, 164, 11–25. [Google Scholar] [CrossRef]
- Janssens, I.; Lankreijer, H.; Matteucci, G.; Kowalski, A.; Buchmann, N.; Epron, D.; Pilegaard, K.; Kutsch, W.L.; Bernard, L.; Grünwald, T.; et al. Productivity overshadows temperature in determining soil and ecosystem respiration across European forests. Glob. Change Biol. 2001, 7, 269–278. [Google Scholar] [CrossRef]
- Yu, G.R.; Zhu, X.J.; Fu, Y.L.; He, H.L.; Wang, Q.F.; Wen, X.F.; Li, X.R.; Zhang, L.M.; Zhang, L.; Su, W.; et al. Spatial patterns and climate drivers of carbon fluxes in terrestrial ecosystems of China. Glob. Change Biol. 2012, 19, 798–810. [Google Scholar] [CrossRef]
- Chen, Z.; Yu, G.; Zhu, X.; Wang, Q.; Niu, S.; Hu, Z. Covariation between gross primary production and ecosystem respiration across space and the underlying mechanisms: A global synthesis. Agric. For. Meteorol. 2015, 203, 180–190. [Google Scholar] [CrossRef]
- Song, T. Long Term Carbon Dioxide Flux Measurements in Sanjiang Plain, Northeastern China. Ph.D. Thesis, Nanjing University of Information Science and Technology, Nanjing, China, 2007. [Google Scholar]
- Santos, I.R.; Burdige, D.J.; Jennerjahn, T.C.; Bouillon, S.; Cabral, A.; Serrano, O.; Wernberg, T.; Filbee-Dexter, K.; Guimond, J.A.; Tamborski, J.J. The renaissance of Odum’s outwelling hypothesis in ‘Blue Carbon’ science. Estuar. Coast. Shelf Sci. 2021, 255, 107361. [Google Scholar] [CrossRef]
- Yau, Y.Y.; Xin, P.; Chen, X.; Zhan, L.; Call, M.; Conrad, S.R.; Sanders, C.J.; Li, L.; Du, J.; Santos, I.R. Alkalinity export to the ocean is a major carbon sequestration mechanism in a macrotidal saltmarsh. Limnol. Oceanogr. 2022, 67, S158–S170. [Google Scholar] [CrossRef]
Disclaimer/Publisher’s Note: The statements, opinions and data contained in all publications are solely those of the individual author(s) and contributor(s) and not of MDPI and/or the editor(s). MDPI and/or the editor(s) disclaim responsibility for any injury to people or property resulting from any ideas, methods, instructions or products referred to in the content. |
© 2025 by the authors. Licensee MDPI, Basel, Switzerland. This article is an open access article distributed under the terms and conditions of the Creative Commons Attribution (CC BY) license (https://creativecommons.org/licenses/by/4.0/).