
Decreasing Impact of Intra-City Disparities on Ecosystem Services During Rapid Urbanization in the Beijing–Tianjin–Hebei Urban Agglomeration


Abstract
1. Introduction
2. Materials and Methods
2.1. Study Area
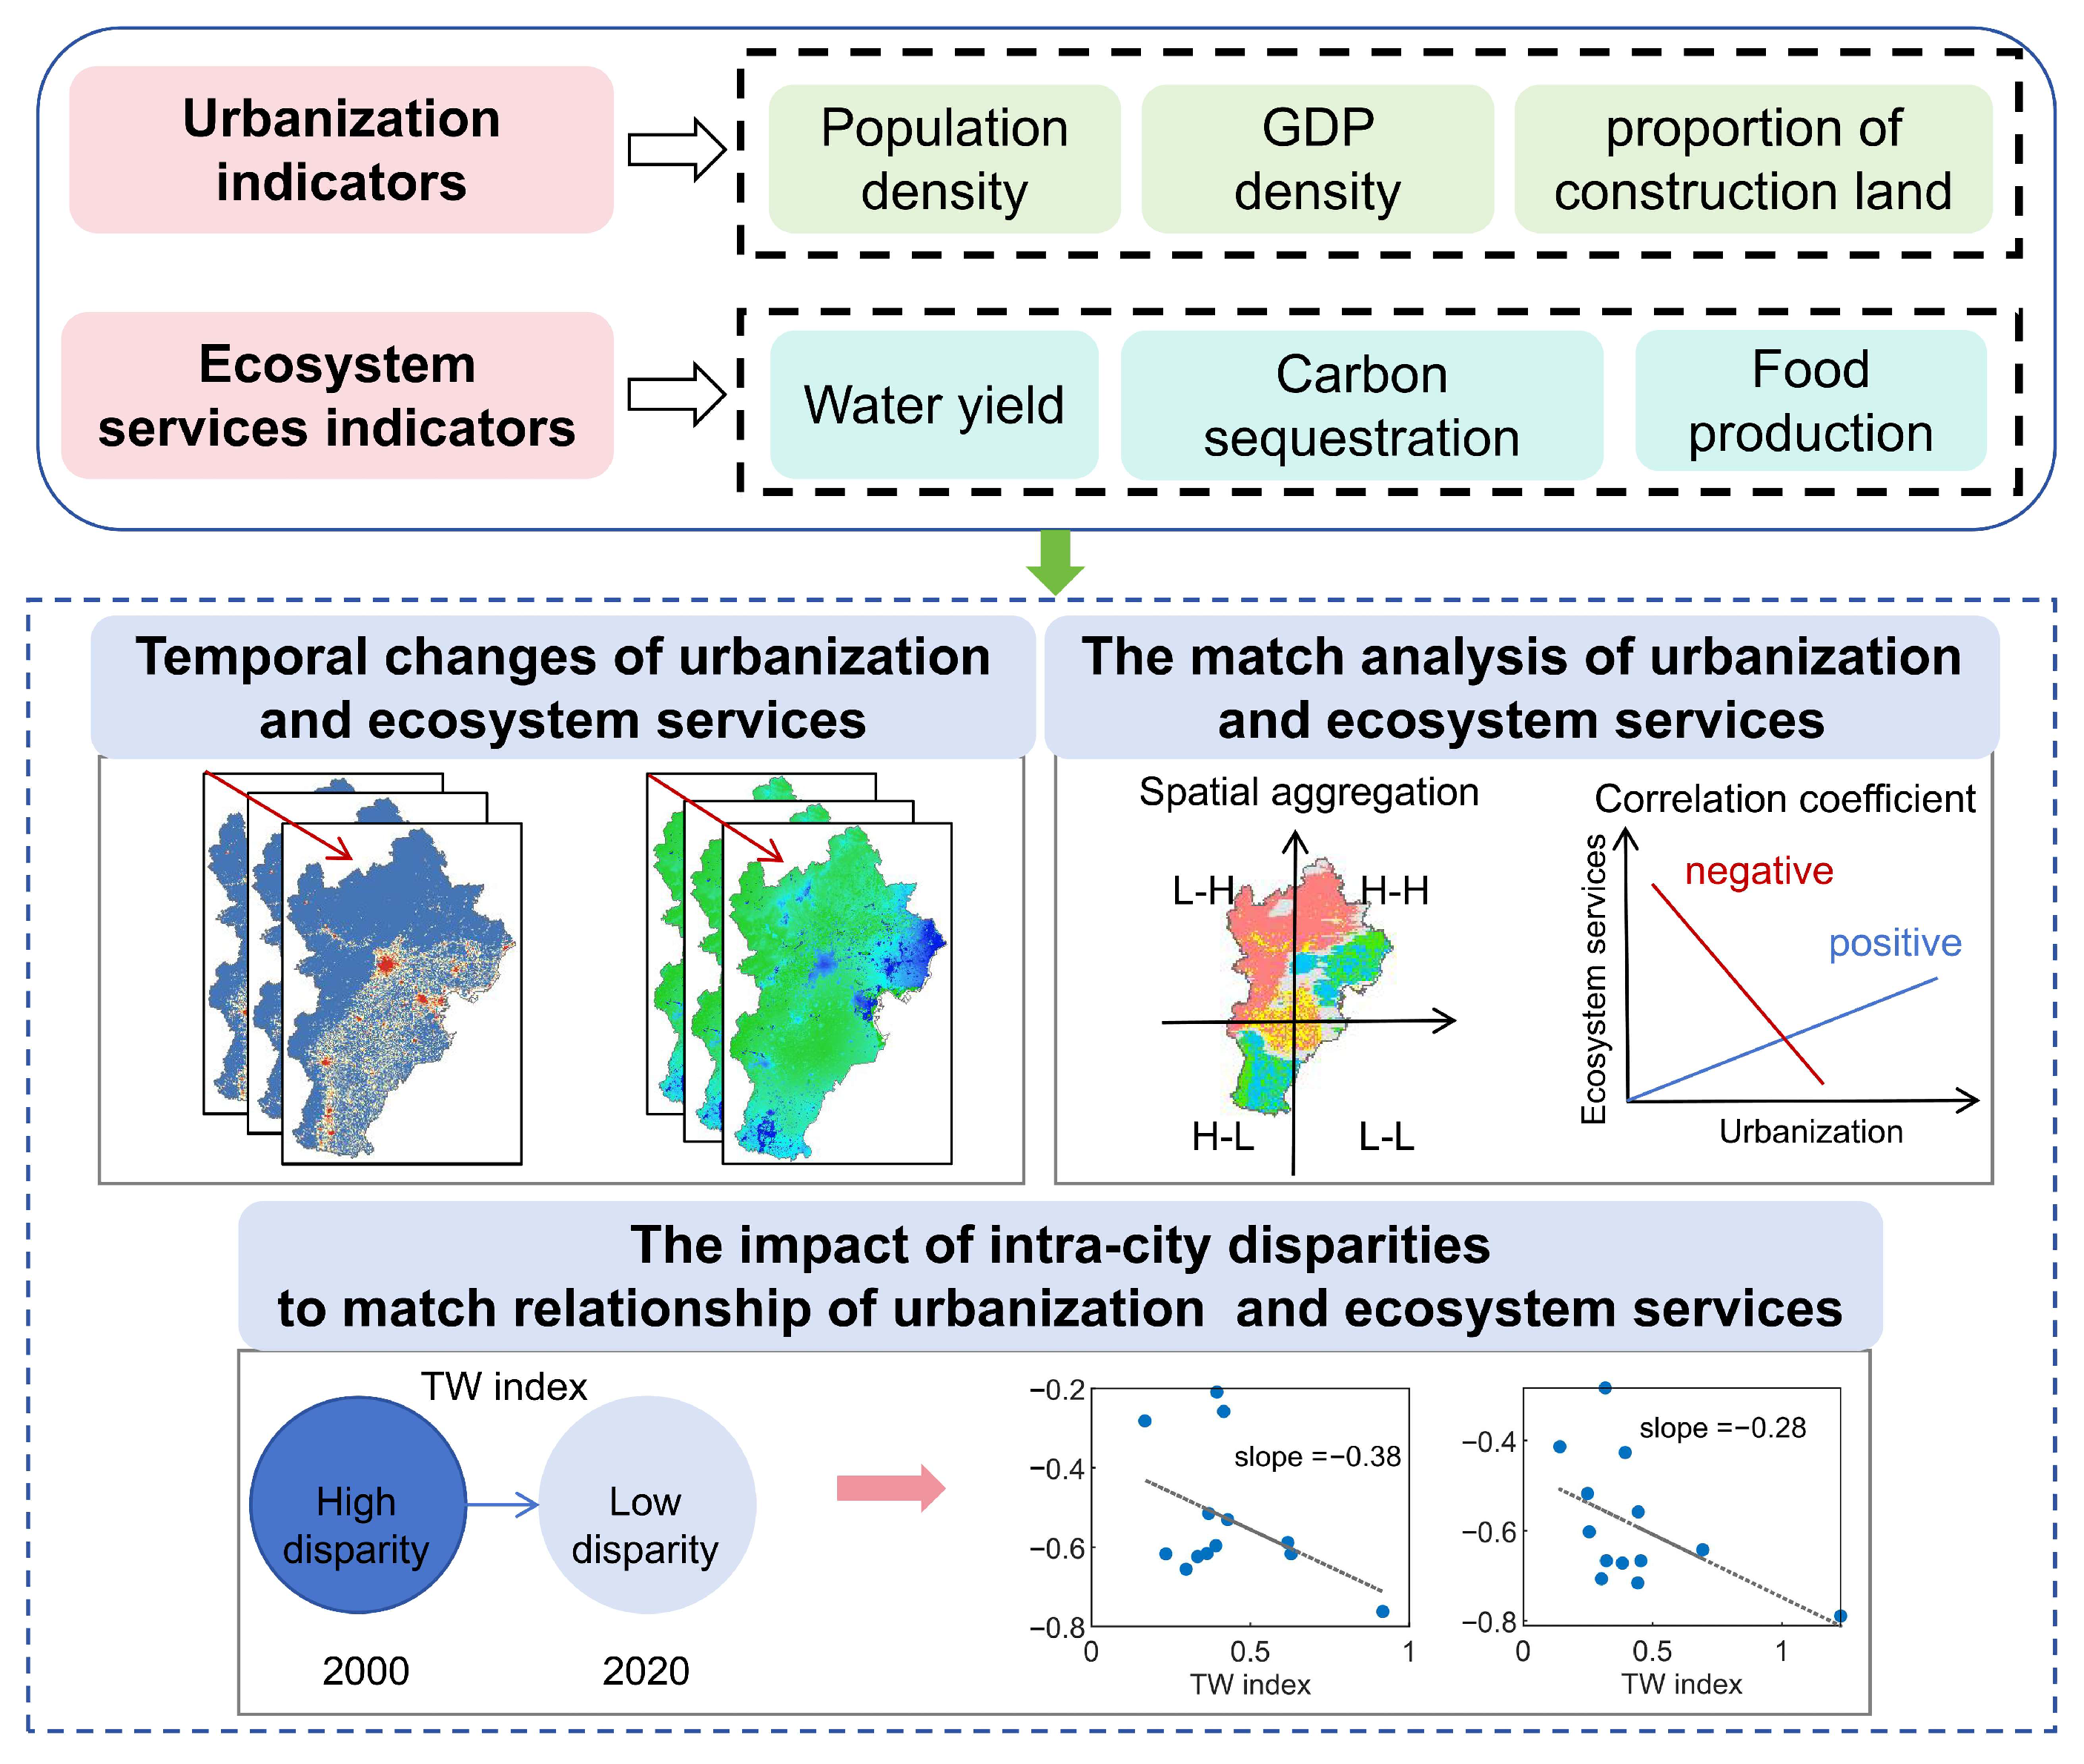
2.2. Framework
2.3. Materials
2.4. Methods
2.4.1. Assessment of Ecosystem Services
- (1)
- Water yield
- (2)
- Food production
- (3)
- Carbon sequestration
2.4.2. Measurement of the Comprehensive Urbanization Index
2.4.3. Economic Polarization Model
2.4.4. Analysis of Match Relationship Between Urbanization and Ecosystem Services
3. Results
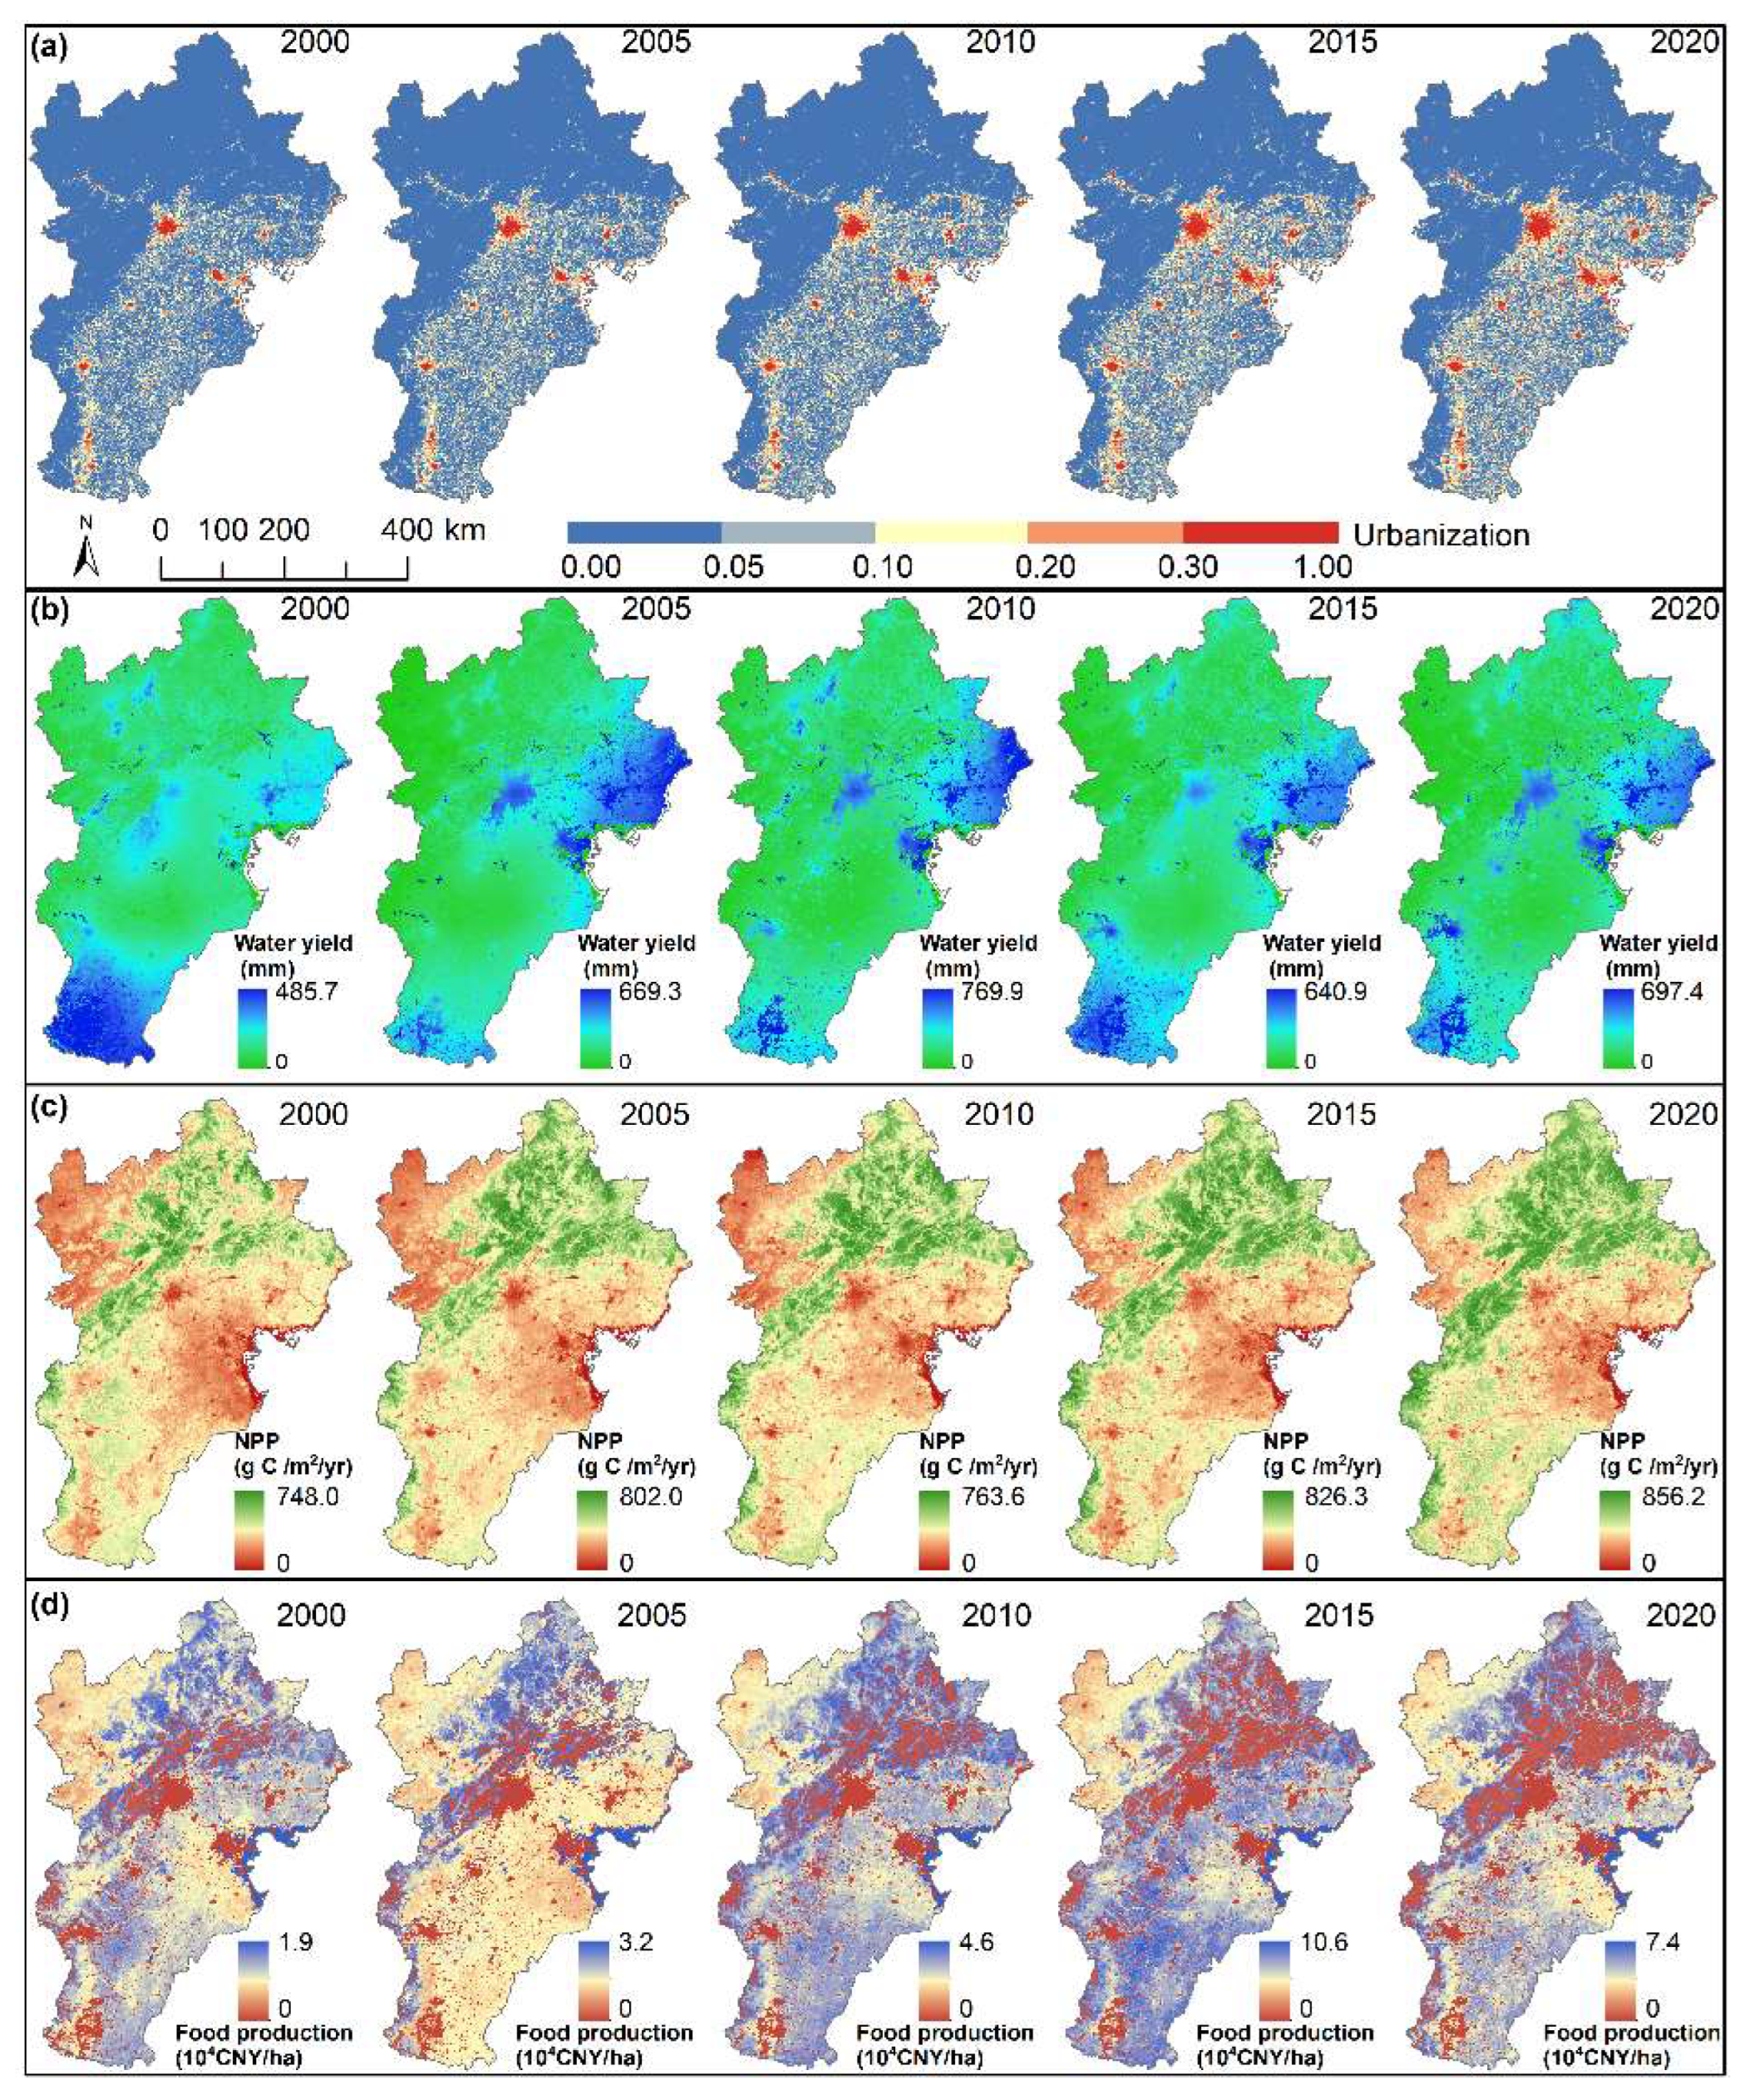
3.1. Temporal Change of Urbanization and Ecosystem Services
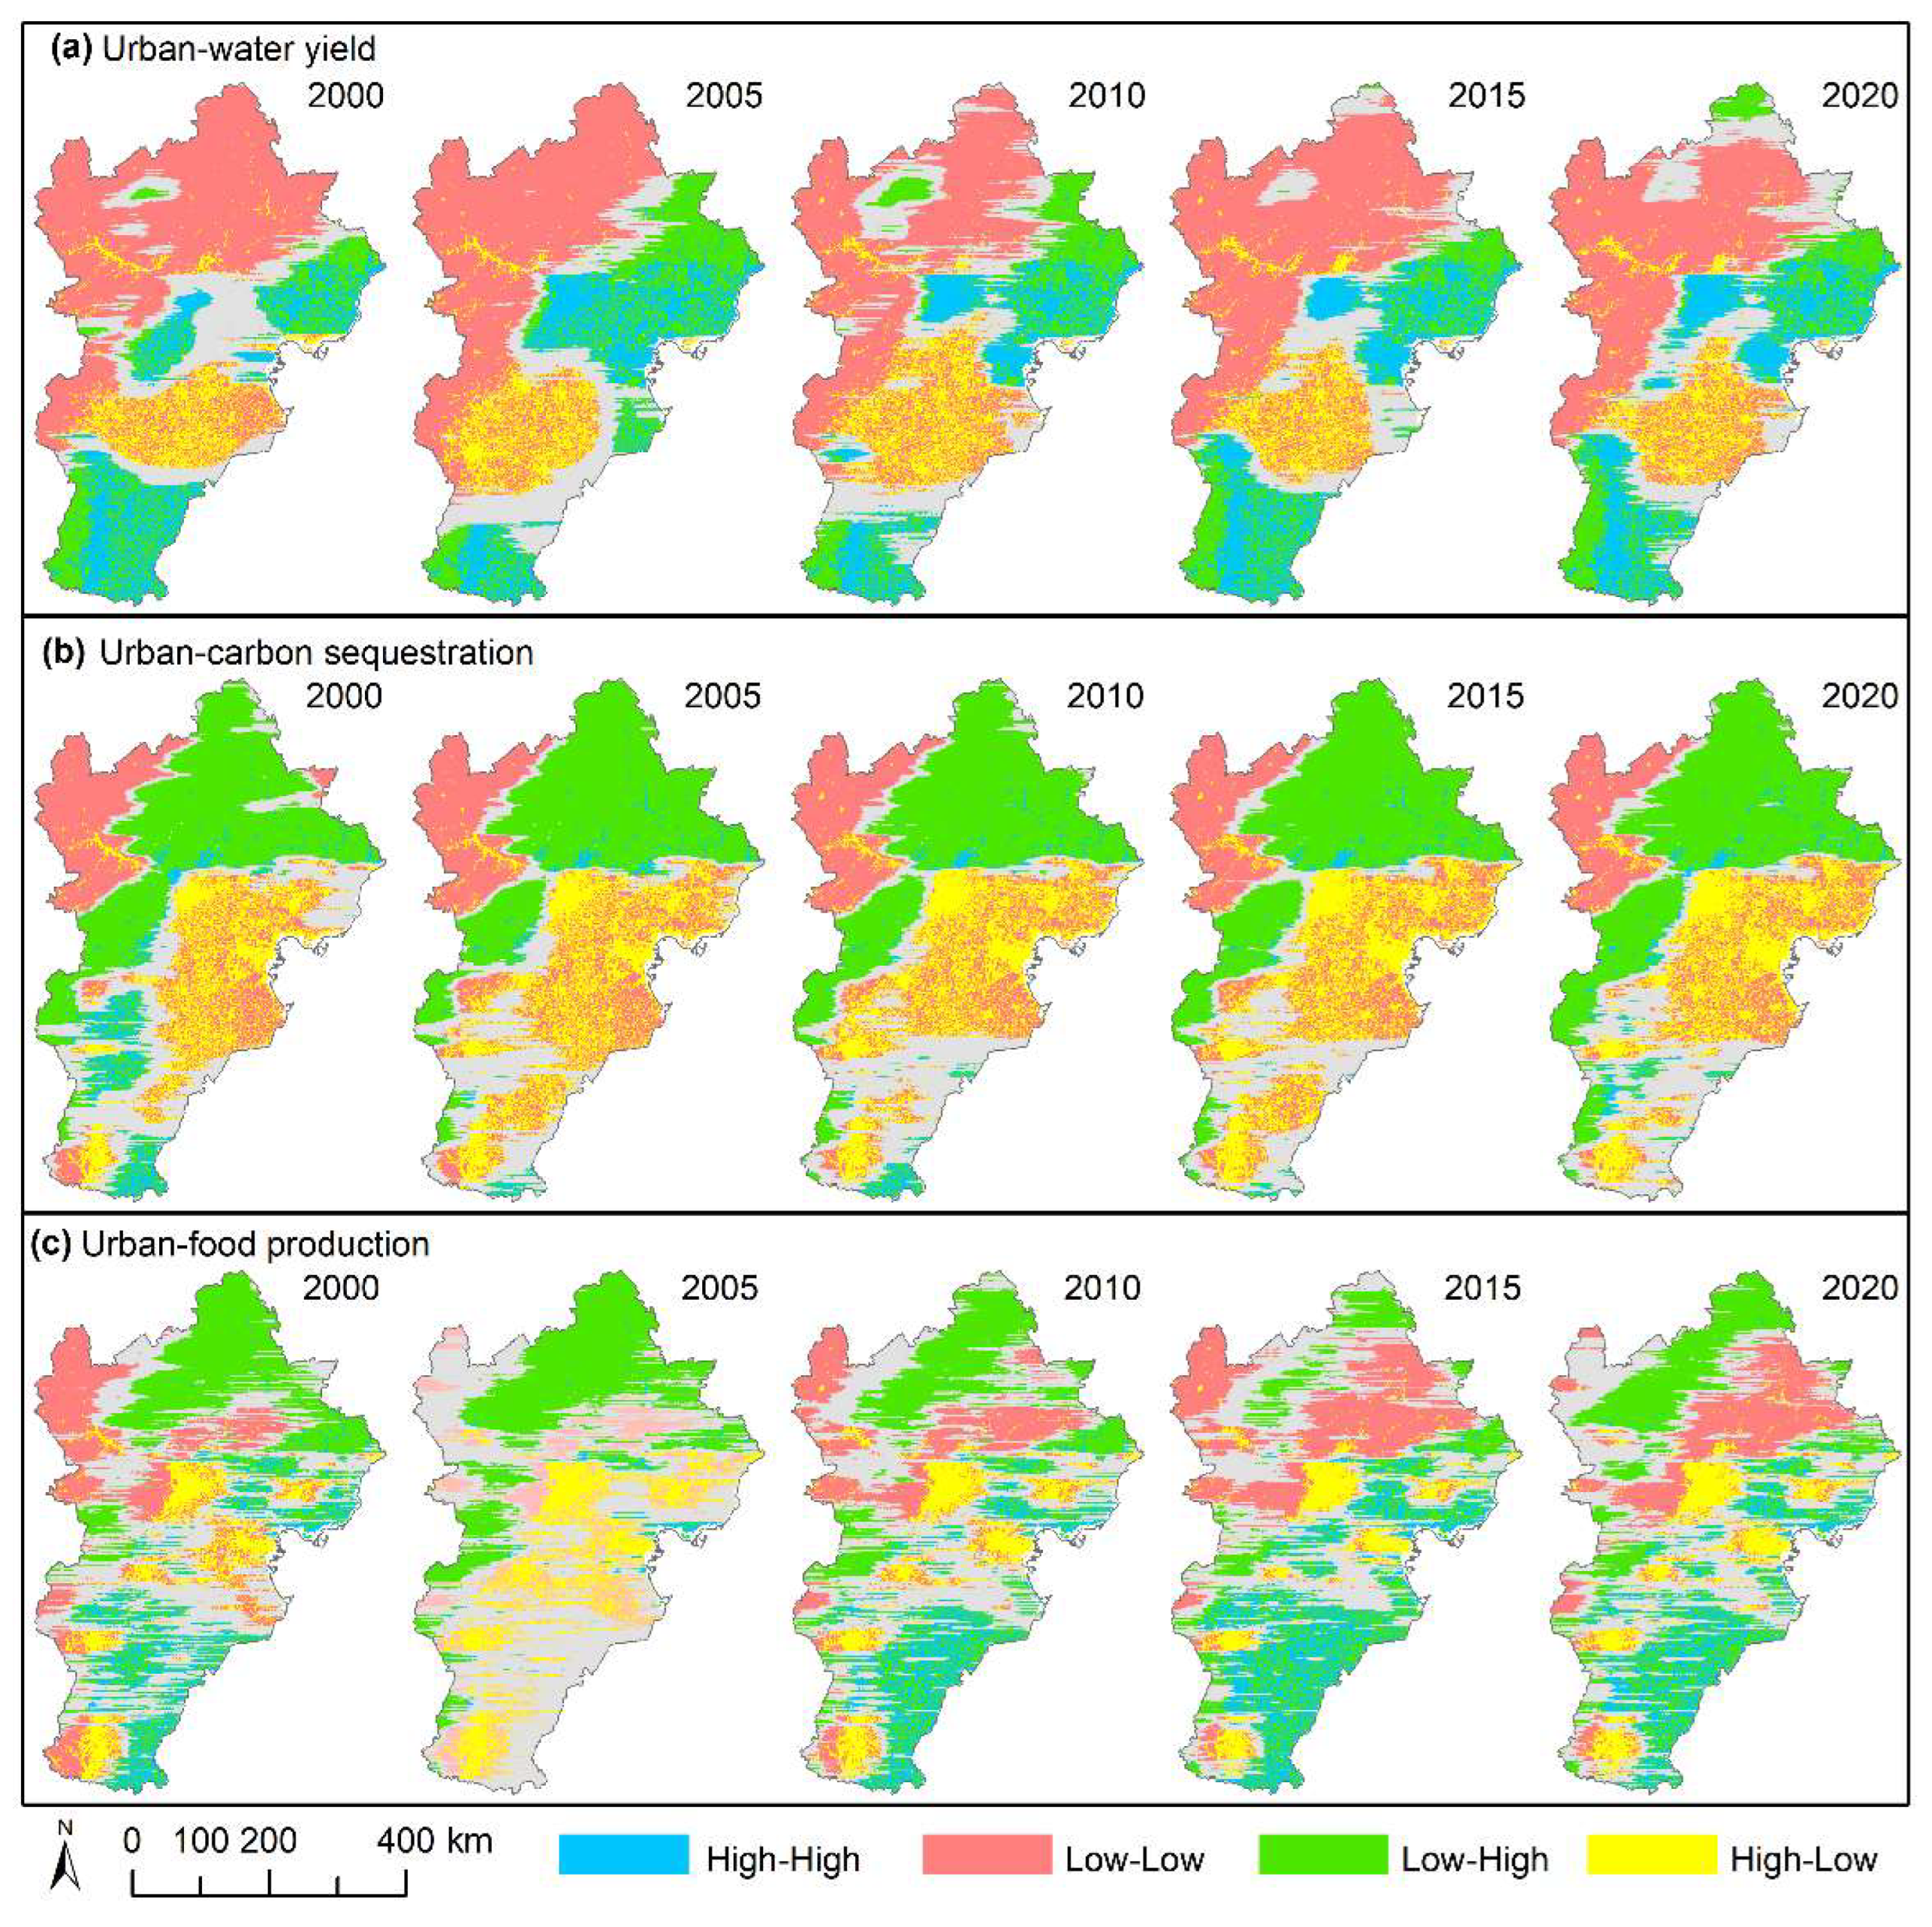
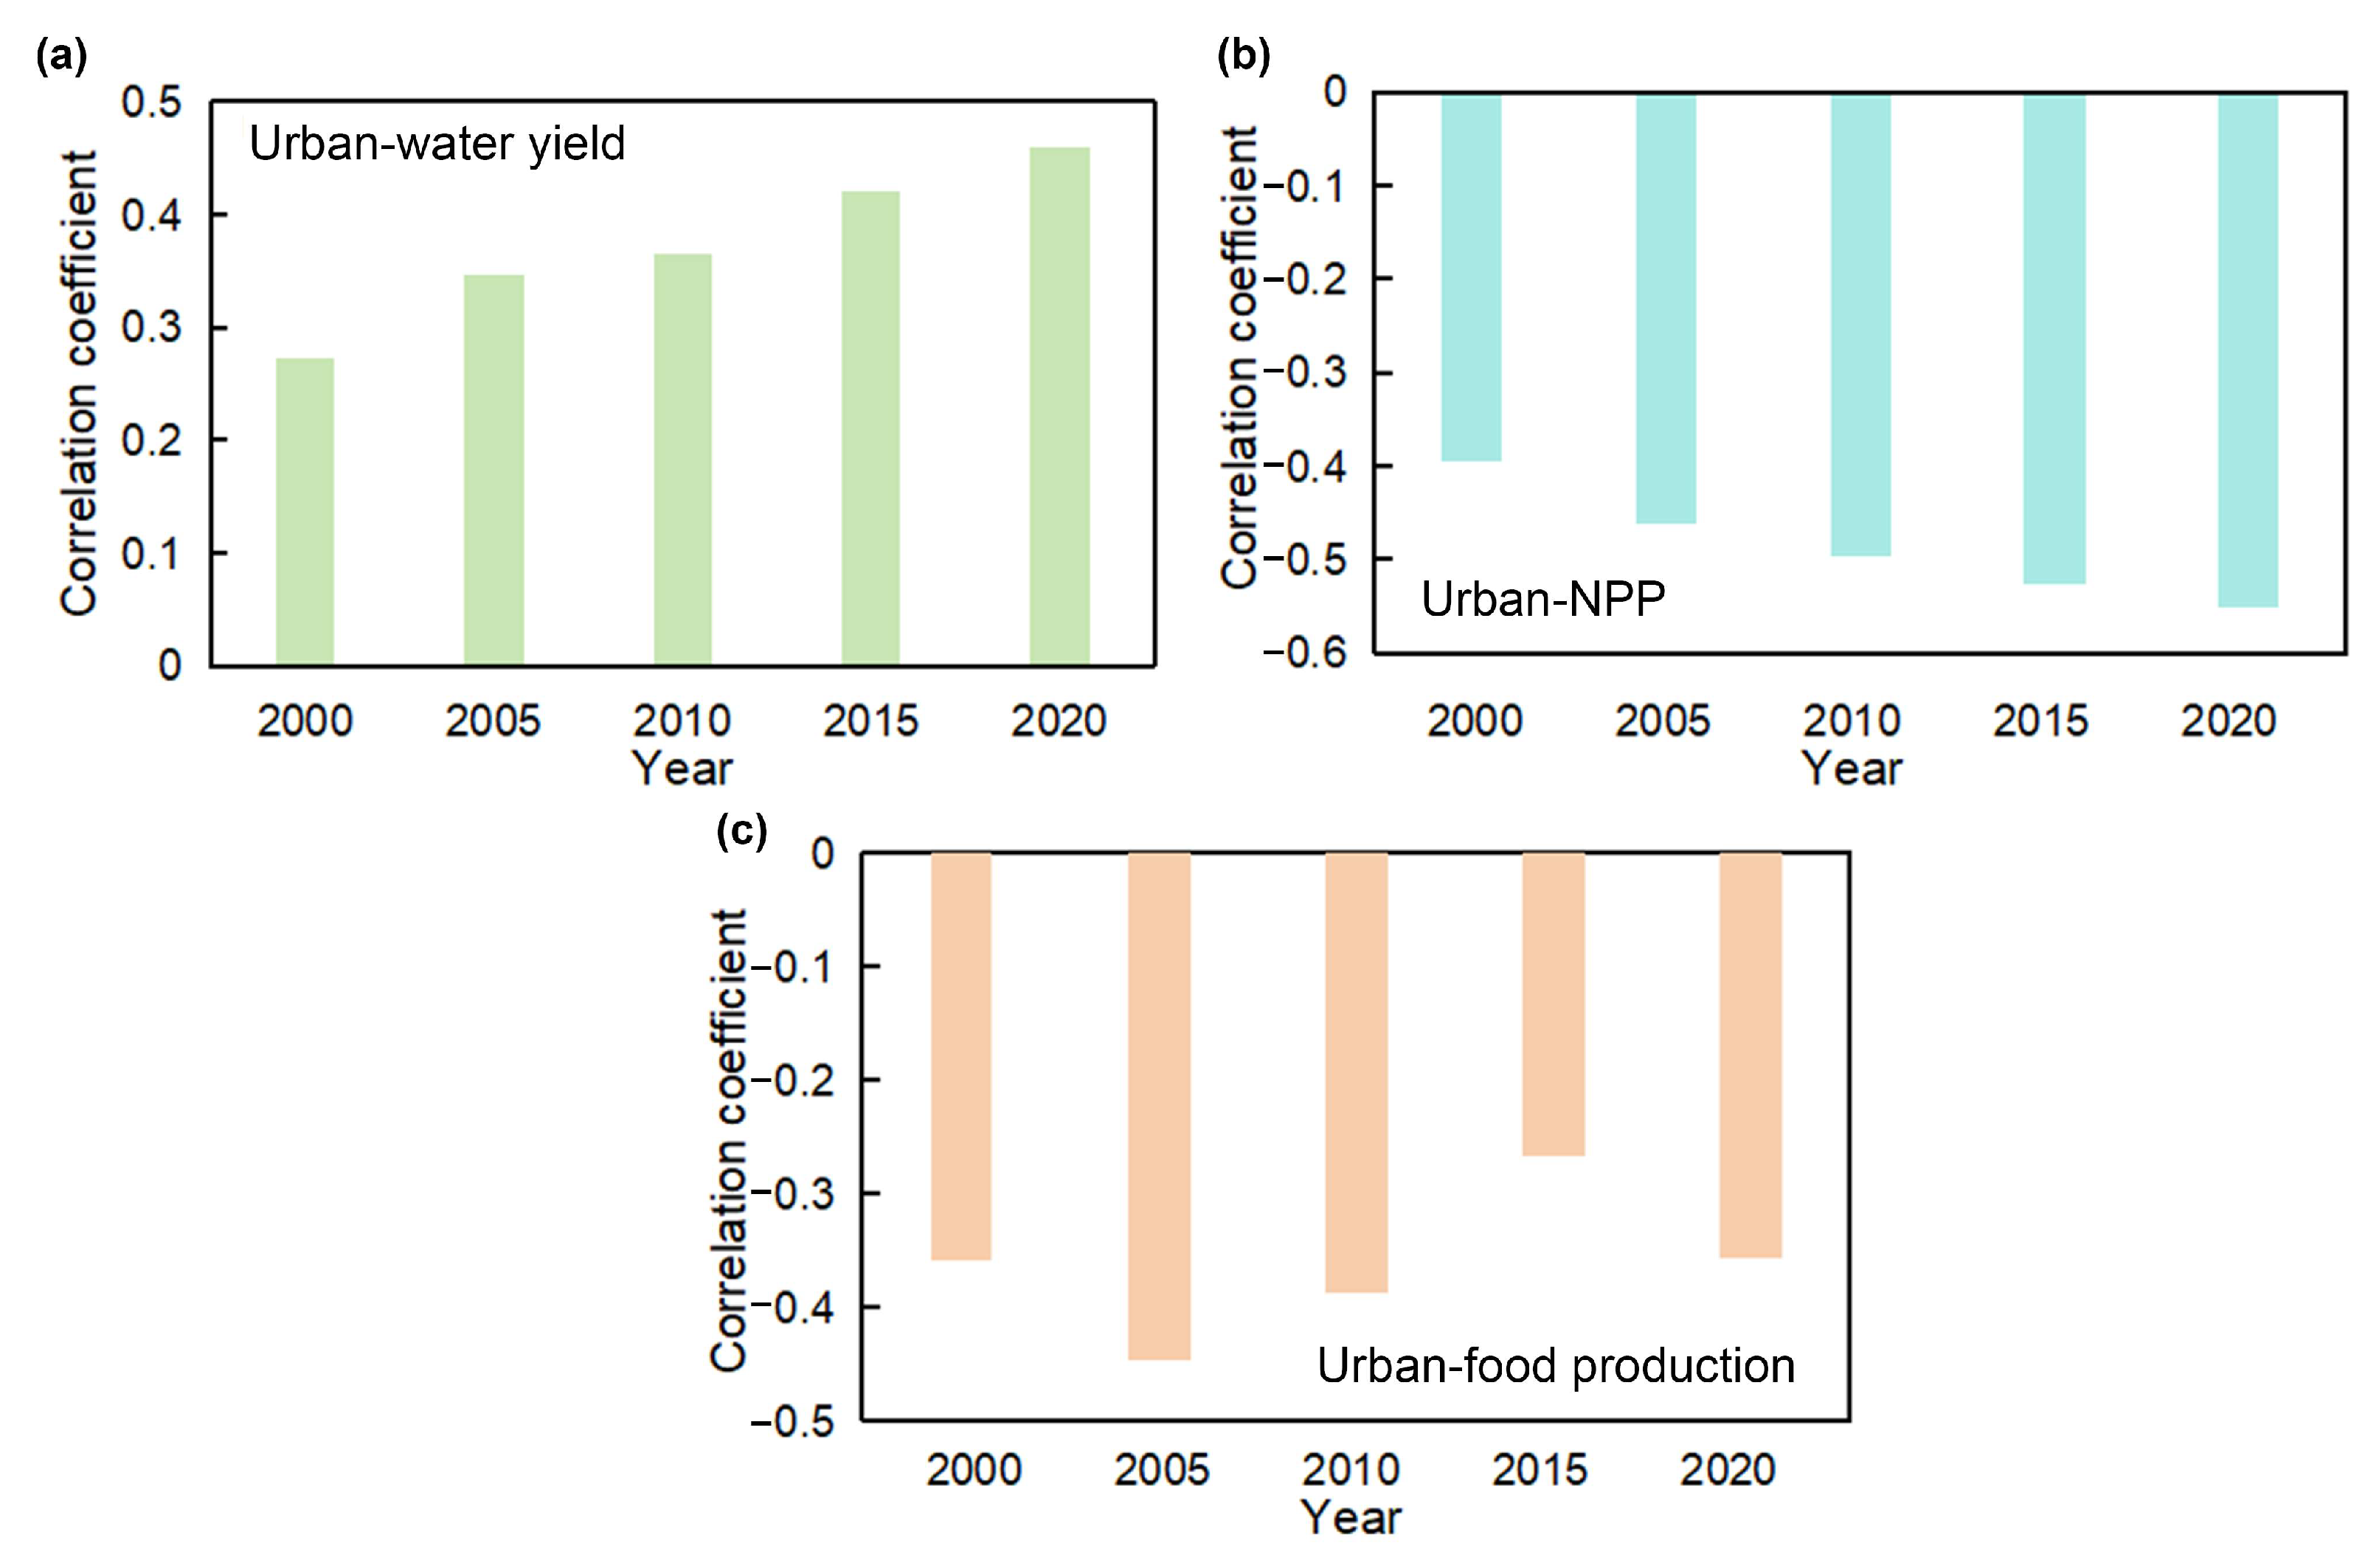
3.2. The Match Relationship Between Urbanization and Ecosystem Services
3.3. The Impact of Intra-City Disparities to Match Relationship Between Urbanization and Ecosystem Services
4. Discussions
4.1. The Changes in Urbanization and Ecosystem Services
4.2. The Reasons for the Match Relationship Between Urbanization and Ecosystem Services
4.3. Urbanization Under Sustainable Development
4.4. Implications and Limitations
5. Conclusions
Supplementary Materials
Author Contributions
Funding
Data Availability Statement
Conflicts of Interest
References
- Zhong, W.; Song, J.; Ren, J.; Yang, W.; Wang, S. Revealing the nexus among energy-economy system with Haken model: Evidence from China’s Beijing-Tianjin-Hebei region. J. Clean. Prod. 2019, 228, 319–330. [Google Scholar] [CrossRef]
- Zhou, D.; Tian, Y.; Jiang, G. Spatio-temporal investigation of the interactive relationship between urbanization and ecosystem services: Case study of the Jingjinji urban agglomeration, China. Ecol. Indic. 2018, 95, 152–164. [Google Scholar] [CrossRef]
- Kang, P.; Chen, W.; Hou, Y.; Li, Y. Spatial-temporal risk assessment of urbanization impacts on ecosystem services based on pressure-status—Response framework. Sci. Rep. 2019, 9, 16806. [Google Scholar] [CrossRef] [PubMed]
- Daily, G.C. Nature’s Services: Societal Dependence on Natural Ecosystems; Island Press: Washington, DC, USA, 1997. [Google Scholar]
- Hernández, R.C.; Camerin, F.J.F. The application of ecosystem assessments in land use planning: A case study for supporting decisions toward ecosystem protection. Futures 2024, 161, 103399. [Google Scholar] [CrossRef]
- Karabulut, A.; Egoh, B.N.; Lanzanova, D.; Grizzetti, B.; Bidoglio, G.; Pagliero, L.; Bouraoui, F.; Aloe, A.; Reynaud, A.; Maes, J.; et al. Mapping water provisioning services to support the ecosystem–water–food–energy nexus in the Danube river basin. Ecosyst. Serv. 2016, 17, 278–292. [Google Scholar] [CrossRef]
- Vargas, L.; Willemen, L.; Hein, L. Assessing the Capacity of Ecosystems to Supply Ecosystem Services Using Remote Sensing and An Ecosystem Accounting Approach. Environ. Manag. 2019, 63, 1–15. [Google Scholar] [CrossRef]
- van den Bosch, M.; Ode Sang, A. Urban natural environments as nature-based solutions for improved public health—A systematic review of reviews. Environ. Res. 2017, 158, 373–384. [Google Scholar] [CrossRef]
- Salmond, J.A.; Tadaki, M.; Vardoulakis, S.; Arbuthnott, K.; Coutts, A.; Demuzere, M.; Dirks, K.N.; Heaviside, C.; Lim, S.; Macintyre, H.; et al. Health and climate related ecosystem services provided by street trees in the urban environment. Environ. Health 2016, 15, 36. [Google Scholar] [CrossRef]
- Zhai, Y.; Zhai, G.; Yu, Z.; Lu, Z.; Chen, Y.; Liu, J. Coupling coordination between urbanization and ecosystem services value in the Beijing-Tianjin-Hebei urban agglomeration. Sustain. Cities Soc. 2024, 113, 105715. [Google Scholar] [CrossRef]
- Wang, S.; Hu, M.; Wang, Y.; Xia, B. Dynamics of ecosystem services in response to urbanization across temporal and spatial scales in a mega metropolitan area. Sustain. Cities Soc. 2022, 77, 103561. [Google Scholar] [CrossRef]
- Fang, C.; Liu, H.; Wang, S. The coupling curve between urbanization and the eco-environment: China’s urban agglomeration as a case study. Ecol. Indic. 2021, 130, 108107. [Google Scholar] [CrossRef]
- Sun, J.; Zhai, N.; Mu, H.; Miao, J.; Li, W.; Li, M. Assessment of urban resilience and subsystem coupling coordination in the Beijing-Tianjin-Hebei urban agglomeration. Sustain. Cities Soc. 2024, 100, 105058. [Google Scholar] [CrossRef]
- Li, C.; Meng, Y.; Li, Y.; Ge, J.; Zhao, C. Inter-Metropolitan Land-Price Characteristics and Patterns in the Beijing-Tianjin-Hebei Urban Agglomeration in China. Sustainability 2019, 11, 4726. [Google Scholar] [CrossRef]
- Yang, Z.; Yang, H.; Wang, H. Evaluating urban sustainability under different development pathways: A case study of the Beijing-Tianjin-Hebei region. Sustain. Cities Soc. 2020, 61, 102226. [Google Scholar] [CrossRef]
- Sun, Y.; Zhao, S. Spatiotemporal dynamics of urban expansion in 13 cities across the Jing-Jin-Ji Urban Agglomeration from 1978 to 2015. Ecol. Indic. 2018, 87, 302–313. [Google Scholar] [CrossRef]
- Buckley, Y.M.; Austin, A.; Bardgett, R.; Catford, J.A.; Hector, A.; Iler, A.; Mariotte, P. The plant ecology of nature-based solutions for people, biodiversity and climate. J. Ecol. 2024, 112, 2424–2431. [Google Scholar] [CrossRef]
- Meng, F.; Guo, J.; Guo, Z.; Lee, J.C.K.; Liu, G.; Wang, N. Urban ecological transition: The practice of ecological civilization construction in China. Sci. Total Environ. 2021, 755, 142633. [Google Scholar] [CrossRef]
- Li, J.; Yang, T. China's Eco-City Construction; Springer: Berlin/Heidelberg, Germany, 2015. [Google Scholar]
- Tian, Y.; Zhou, D.; Jiang, G. Conflict or Coordination? Multiscale assessment of the spatio-temporal coupling relationship between urbanization and ecosystem services: The case of the Jingjinji Region, China. Ecol. Indic. 2020, 117, 106543. [Google Scholar] [CrossRef]
- Yang, J.; Huang, X. The 30 m annual land cover dataset and its dynamics in China from 1990 to 2019. Earth Syst. Sci. Data 2021, 13, 3907–3925. [Google Scholar] [CrossRef]
- Friedl, M.; Sulla-Menashe, D. MODIS/Terra+Aqua Land Cover Type Yearly L3 Global 500m SIN Grid V061. 2022. Available online: https://lpdaac.usgs.gov/products/mcd12q1v061/ (accessed on 30 October 2024).
- Sharp, R.; Chaplin-Kramer, R.; Wood, S.; Guerry, A.; Tallis, H.; Ricketts, T.; Nelson, E.; Ennaanay, D.; Wolny, S.; Olwero, N.; et al. InVEST User’s Guide. 2018. Available online: https://naturalcapitalproject.stanford.edu/software/invest (accessed on 24 October 2024).
- Quarmby, N.A.; Milnes, M.; Hindle, T.L.; Silleos, N. The use of multi-temporal NDVI measurements from AVHRR data for crop yield estimation and prediction. Int. J. Remote Sens. 1993, 14, 199–210. [Google Scholar] [CrossRef]
- Liu, H.; Zhu, J.; Zeng, L.; Gou, M.; Chen, B.; Lv, J.; Xiao, W. Identification of Urban Ecological Security Pattern Based on Ecosystem Services Supply–Demand. Ecosyst. Health Sustain. 2024, 10, 0146. [Google Scholar] [CrossRef]
- Jia, K.; Huang, A.; Yin, X.; Yang, J.; Deng, L.; Lin, Z. Investigating the Impact of Urbanization on Water Ecosystem Services in the Dongjiang River Basin: A Spatial Analysis. Remote Sens. 2023, 15, 2265. [Google Scholar] [CrossRef]
- Li, X.; Song, W.; Cao, S.; Mo, Y.; Du, M.; He, Z. The impact of multidimensional urbanization on sustainable development goals (SDGs): A long-term analysis of the 31 provinces in China. Ecol. Indic. 2024, 169, 112822. [Google Scholar] [CrossRef]
- Bi, Y.; Zheng, L.; Wang, Y.; Li, J.; Yang, H.; Zhang, B. Coupling relationship between urbanization and water-related ecosystem services in China’s Yangtze River economic Belt and its socio-ecological driving forces: A county-level perspective. Ecol. Indic. 2023, 146, 109871. [Google Scholar] [CrossRef]
- Wang, Y.Q.; Tsui, K.Y. Polarization orderings and new classes of polarization indices. J. Public. Econ. Theory 2000, 2, 349–363. [Google Scholar] [CrossRef]
- Wu, W.; Zhao, S.; Zhu, C.; Jiang, J. A comparative study of urban expansion in Beijing, Tianjin and Shijiazhuang over the past three decades. Landsc. Urban. Plann. 2015, 134, 93–106. [Google Scholar] [CrossRef]
- Zhou, T.; Jiang, G.; Zhang, R.; Zheng, Q.; Ma, W.; Zhao, Q.; Li, Y. Addressing the rural in situ urbanization (RISU) in the Beijing–Tianjin–Hebei region: Spatio-temporal pattern and driving mechanism. Cities 2018, 75, 59–71. [Google Scholar] [CrossRef]
- Yan, M.; Zhao, J.; Yan, S.; Zhu, M. Coupling coordination of new urbanization in Chinese urban agglomeration-characteristics and driving factors. Environ. Sci. Pollut. Res. Int. 2023, 30, 117082–117095. [Google Scholar] [CrossRef]
- Zhang, X.; Wang, H.; Ning, X.; Zhang, X.; Liu, R.; Wang, H. Identification of Metropolitan Area Boundaries Based on Comprehensive Spatial Linkages of Cities: A Case Study of the Beijing–Tianjin–Hebei Region. ISPRS Int. J. Geo-Inf. 2022, 11, 396. [Google Scholar] [CrossRef]
- Lu, Y.; Xu, X.; Zhu, G.; Peng, Y.; Li, Y.; Zhao, X. Land Space and High-Speed Transportation Coordinated Development Evaluation in the Beijing–Tianjin–Hebei Urban Agglomeration of China. Land 2024, 13, 1693. [Google Scholar] [CrossRef]
- Zhang, L.; Cheng, L.; Chiew, F.; Fu, B. Understanding the impacts of climate and landuse change on water yield. Curr. Opin. Environ. Sust. 2018, 33, 167–174. [Google Scholar] [CrossRef]
- Zhao, Y.; Qie, X. Quantitative assessment of the relative impacts of climate change and human activities on net primary productivity of vegetation in the Beijing-Tianjin-Hebei region. Front. Environ. Sci. 2024, 12, 1508433. [Google Scholar] [CrossRef]
- Luo, J.; Zhang, H.; Qi, Y.; Pei, H.; Shen, Y. Balancing water and food by optimizing the planting structure in the Beijing–Tianjin–Hebei region, China. Agric. Water Manag. 2022, 262, 107326. [Google Scholar] [CrossRef]
- Yang, M.; Gao, X.; Siddique, K.H.M.; Wu, P.; Zhao, X. Spatiotemporal exploration of ecosystem service, urbanization, and their interactive coercing relationship in the Yellow River Basin over the past 40 years. Sci. Total Environ. 2023, 858, 159757. [Google Scholar] [CrossRef] [PubMed]
- Gao, J.; Li, F.; Gao, H.; Zhou, C.; Zhang, X. The impact of land-use change on water-related ecosystem services: A study of the Guishui River Basin, Beijing, China. J. Clean. Prod. 2017, 163, S148–S155. [Google Scholar] [CrossRef]
- Na, R.; Xu, X.; Wang, S. Spatiotemporal Analysis of Economic and Ecological Coupled Coordination: A Case Study of the Beijing–Tianjin–Hebei Urban Agglomeration. Land 2024, 13, 1138. [Google Scholar] [CrossRef]
- Hu, Y.N.; Connor, D.S.; Stuhlmacher, M.; Peng, J.; Turner Ii, B.L. More urbanization, more polarization: Evidence from two decades of urban expansion in China. NPJ Urban. Sustain. 2024, 4, 33. [Google Scholar] [CrossRef]
- Cao, Y.; Kong, L.; Zhang, L.; Ouyang, Z. The balance between economic development and ecosystem service value in the process of land urbanization: A case study of China’s land urbanization from 2000 to 2015. Land Use Policy 2021, 108, 105536. [Google Scholar] [CrossRef]
- Lourdes, K.; Gibbins, C.; Hamel, P.; Sanusi, R.; Azhar, B.; Lechner, A. A Review of Urban Ecosystem Services Research in Southeast Asia. Land 2021, 10, 40. [Google Scholar] [CrossRef]
- Malherbe, H.; Pauleit, S.; Lorz, C. Mapping the Loss of Ecosystem Services in a Region Under Intensive Land Use Along the Southern Coast of South Africa. Land 2019, 8, 51. [Google Scholar] [CrossRef]


Disclaimer/Publisher’s Note: The statements, opinions and data contained in all publications are solely those of the individual author(s) and contributor(s) and not of MDPI and/or the editor(s). MDPI and/or the editor(s) disclaim responsibility for any injury to people or property resulting from any ideas, methods, instructions or products referred to in the content. |
© 2025 by the authors. Licensee MDPI, Basel, Switzerland. This article is an open access article distributed under the terms and conditions of the Creative Commons Attribution (CC BY) license (https://creativecommons.org/licenses/by/4.0/).
Share and Cite
Lv, J.; Dong, C.; Yan, Q.; Liu, H.; Fu, L.; Wei, X. Decreasing Impact of Intra-City Disparities on Ecosystem Services During Rapid Urbanization in the Beijing–Tianjin–Hebei Urban Agglomeration. Land 2025, 14, 1196. https://doi.org/10.3390/land14061196
Lv J, Dong C, Yan Q, Liu H, Fu L, Wei X. Decreasing Impact of Intra-City Disparities on Ecosystem Services During Rapid Urbanization in the Beijing–Tianjin–Hebei Urban Agglomeration. Land. 2025; 14(6):1196. https://doi.org/10.3390/land14061196
Chicago/Turabian StyleLv, Jinxia, Chun Dong, Qin Yan, Huayan Liu, Liyong Fu, and Xuemei Wei. 2025. "Decreasing Impact of Intra-City Disparities on Ecosystem Services During Rapid Urbanization in the Beijing–Tianjin–Hebei Urban Agglomeration" Land 14, no. 6: 1196. https://doi.org/10.3390/land14061196
APA StyleLv, J., Dong, C., Yan, Q., Liu, H., Fu, L., & Wei, X. (2025). Decreasing Impact of Intra-City Disparities on Ecosystem Services During Rapid Urbanization in the Beijing–Tianjin–Hebei Urban Agglomeration. Land, 14(6), 1196. https://doi.org/10.3390/land14061196