1. Introduction
Against the backdrop of accelerated global urbanization, historical and cultural districts, as the material carriers of urban context, have seen a shift in the public’s demand for urban space from simply pursuing quantitative growth to focusing on high standards and quality [
1]. The architectural color of these districts is not only an intuitive expression of spatial aesthetics but also a visual representation of regional cultural genes. Their preservation and renewal have become important topics in urban development. Architectural color, as a core visual element of district features, is not only an explicit expression of historical culture but also an important symbol of regional identity. However, with the advancement of modernization, many cities in China face the dilemma of “uniformity across cities”, “facade chaos”, and “loss of identity”, where the distinctive colors of historical and cultural districts gradually fade. On one hand, the excessive use of new materials and technologies has led to a disruption in traditional color genes; on the other hand, the lack of color harmony between new and old districts has caused a disconnection in cultural imagery. Typical cases such as Tianjin’s Five Avenues and Beijing’s Old City show issues such as the color disconnection between old and new districts, disordered accumulation of advertising signs, and aging and fading building materials, which have led to a rupture in traditional color context [
2,
3]. The continuous construction of new buildings in historical districts has led to inconsistencies between historical and modern architecture, as well as the degradation of the historical landscape [
4]. A survey of 230 citizens in Tianjin revealed that 39% of respondents expressed dissatisfaction with the urban color environment, believing that traditional colors such as brick red and brick gray are disappearing [
5]. This phenomenon not only weakens the readability of the spirit of place but also causes a cultural identity crisis. In this context, conducting systematic architectural color evaluation research is both an inevitable requirement for preserving urban historical context and a scientific approach to achieving organic renewal in the spirit of “preserving nostalgia”.
From a theoretical perspective, color assessment is a key link between cultural heritage preservation and urban design [
6]. Norberg-Schulz believes that architectural design should evoke emotional resonance and a sense of belonging to a specific place through perceptual elements such as color, material, and light and shadow. He emphasizes the emotional and existential relationship between humans and the environment [
7]. The color of building facades is a critical element of the urban environment, carrying historical characteristics and regional features. The color of building facades can be considered the most important type of color in the color control of historical and cultural districts [
8]. In historical areas, both the facades of renovated historical buildings and newly constructed modern buildings should be controlled to maintain the historical appearance of the area [
9]. The harmony of building facade colors in historical districts means they are in harmony with authentic architectural colors. The harmony of building facade colors (HBFc) is one of the core principles of color geography [
10]. Only when the facade colors of buildings in historical districts are in harmony can the characteristics of the area be well displayed [
11]. Kevin Lynch introduced the concept of “Image of the City”, emphasizing that people form mental maps by perceiving the physical elements of a city in order to achieve spatial orientation and navigation [
12]. Therefore, constructing a color assessment system that balances historical authenticity and contemporary adaptability is of urgent importance for the sustainable development of historical and cultural districts.
From a technical perspective, traditional color assessment often relies on manual research and subjective interpretation, which has drawbacks such as low efficiency and insufficient standardization. For example, early research in Tianjin involved manually extracting the color spectrum from Yangliuqing New Year paintings and Mudan Zhang clay sculptures. While these had cultural value, they were difficult to apply to the dynamic and complex built environment [
13]. As urban renewal shifts from large-scale demolition and construction to more “refined repairs”, establishing a scientific and systematic urban architectural color assessment system has become urgent. In 2020, the “Beijing Urban Color Design Guidelines” for the first time combined the primary color scheme of “Dan Yun Yin Lü” (a harmonious blend of crimson elegance and silver proportions) with micro-updates in neighborhoods, marking the entry of China’s color planning into a new stage of “enhancing existing quality” [
14]. Shenzhen, in combination with remote sensing technology, uses street view images and deep learning algorithms to conduct urban-scale mapping of building facade colors. It analyzes the color characteristics of different urban areas and explores the relationship between these characteristics and socioeconomic attributes [
15]. In Shanghai, based on deep learning and pattern recognition technologies, a method for identifying urban architectural colors has been proposed. This method utilizes convolutional neural networks and the K-means clustering algorithm to extract and analyze color features from building images, providing data support for urban planning and design [
16]. Against this backdrop, exploring interdisciplinary assessment methods is of significant practical importance for preserving historical context and shaping distinctive urban images.
The study of urban architectural color in China began relatively late but has yielded significant results. Over the past two decades, it has developed into a multi-dimensional research framework. Early scholars such as Guo [
17] proposed the “climate-adaptive color spectrum”, emphasizing the constraints of natural geographic factors on color generation; Chen [
3], through the case of Beijing’s old city, developed the theory of “ceremonial color”, revealing the influence of political culture on the formation of traditional architectural color. In terms of methodology, three major research paths have emerged:
- (1)
Humanities-oriented Locality Research
This approach focuses on the exploration of regional cultural genes, extracting cultural symbols through the color deconstruction of traditional crafts and folk art.
For example, the Tianjin team conducted a chromatographic analysis focusing on four major intangible cultural heritage folk art forms: Zhang’s Clay Figurines, Wei’s Kites, Yangliuqing New Year Paintings, and Liu’s Brick Carvings. These art forms are rich in unique color elements that encapsulate the characteristics of Tianjin’s folk culture, serving as mediums for conveying the city’s historical and cultural information. By analyzing the proportion of colors in the artworks, they distinguished between primary and secondary colors. Considering aspects such as hue, brightness, and saturation, the colors were systematically arranged to produce comprehensive chromatograms of Tianjin’s traditional primary and secondary colors. This analysis led to the identification of twelve primary color systems, centered around brick red (5R 4.4/14) and indigo (6.3PB 3.5/7.6) [
13]. The architectural colors of Tianjin exhibit distinct regional characteristics. Brick red and indigo are closely linked to the city’s history, visually harmonizing with the surrounding natural environment and cultural traditions. Located in the North China Plain, Tianjin has a dry climate and barren land, making brick and stone-based architectural styles widely adopted. Brick red, as a building color, aligns with the local resources and environmental features. Indigo, introduced during the cultural exchange between China and the West, symbolizes the openness and diversity of Tianjin as a port city. The use of brick red and indigo in Tianjin’s architecture not only reflects the city’s historical changes, cultural integration, and modernization process, but also reveals the city’s diverse human spirit and deep heritage. These colors, when combined with architectural forms, complement each other and together form Tianjin’s unique urban landscape, becoming an important symbol of the city’s identity. In Fuzhou, based on the spatial layout of the “Three Mountains and Two Towers”, traditional dark gray tiles (N4.5) were integrated with modern matte neutral grays to continue the color legacy [
18]. This type of research underscores the value of color as a cultural archetype symbol and analyzes the artistic expression of traditional colors in Tianjin and Fuzhou. It highlights the importance of a humanistic orientation in region-specific studies. However, it often remains confined to static historical elements, lacking sufficient adaptability to the dynamic evolution of contemporary spaces.
- (2)
Technologically driven Quantitative Analysis
In recent years, breakthroughs in computer vision technology have driven a shift from qualitative to quantitative color research. Zhang [
19] used FCN semantic segmentation and K-means clustering algorithms to analyze 58 street view images in the northern area of Tianjin West Station, deconstructing them into a three-level system of “primary color—secondary color—accent color”. They found that existing residential areas were dominated by mid-brightness warm grays (7.5YR 6/3), but 23% of buildings showed color differences (ΔE > 7.5) due to material aging. The team led by Jiang [
20] processed tens of thousands of street view images from historical districts in Shanghai through OpenCV, established a color harmony evaluation model, and constructed urban color evaluation indicators and methods. These technological approaches have improved data collection efficiency, but the integration of cultural semantics of color with quantitative metrics remains unresolved.
- (3)
Human-centered Perceptual Evaluation
Introducing environmental psychology theories, this approach explores the relationship between color perception and spatial experience. The Zhanzhu Wang team, using Suzhou’s Shiquan Street as an example, analyzed the color authenticity of historical areas. They proposed color direction maps and spatial maps based on the HSV color model, providing color protection strategies for the sustainable development of historical areas. This approach aims to preserve the unique aesthetic characteristics of historic districts while accommodating modern urban development [
4]. Zhao Chunshui’s team [
5] conducted psychological experiments on 24 groups of Tianjin buildings using the SD method, revealing that citizens rated the “comfort” of warm gray (7.5R 3/4.8) 1.8 times higher than cool tones, and the traditional brick red (5R 4.4/14) stood out in terms of “vitality”. Liu [
21] used the SD method to conduct a visual perception survey and found that over 60% of the continuous traditional color spectra in historical districts enhanced the spatial sense of identity by 40%. Yang [
22] confirmed the role of street greening in improving the mobility of elderly people. Jiang [
23] used an innovative deep learning method to detect and classify street trees through street view images (SVIs), proving that the abundance and species mix of street trees correlated positively with pedestrian traffic. These studies deepen the understanding of the emotional value of color, but sample sizes and spatial dimensions still need to be expanded [
23].
Despite these significant results, current research faces three major bottlenecks: First, there is a gap in mid-level research on neighborhood color, with a lack of coordination between macro-level overall planning and micro-level architectural guidelines; second, traditional manual surveys struggle to meet the demands of large-scale evaluation of existing spaces, with insufficient integration of multi-source data such as drones and street view images [
24]; and third, the systems for cultural gene identification, quantitative analysis, and perceptual evaluation have yet to form a closed loop, resulting in a disconnect between technical rationality and humanistic value [
25].
To address the above issues, this study focuses on the historical and cultural districts of Tianjin. Based on the “point-line-plane” protection system, a multi-scale architectural color analysis system of “building-street-district” is constructed. This system integrates micro-level building color analysis with meso-level district color analysis, linking it to macro-level urban planning, thereby providing better support for decision making in urban color planning.
Furthermore, this study employs deep learning technology from the field of computer vision to perform semantic segmentation (DeepLabV3+) on street view data of Tianjin. The Mean-Shift algorithm, a non-parametric density-based clustering method, is used to replace the traditional k-means algorithm to extract building images and establish a dynamic color database. The k-means algorithm requires users to predefine the number of clusters (k value) before clustering, which can result in inaccurate clustering results due to the varying conditions of Tianjin’s 14 districts. The Mean-Shift algorithm automatically determines the number of clusters based on the data’s density distribution, avoiding the bias introduced by manually setting the k value. It effectively reduces the influence of noise and outliers on the clustering results and improves clustering stability [
26].
By evaluating Tianjin’s traditional architectural colors in terms of color richness and color coordination, this study explores scalable technical pathways and provides scientific support for the micro-updating of urban historical and cultural districts.
2. Research Background
Machine learning-based methods have the ability to capture micro-scale urban environments with a larger geographical range and greater efficiency [
27,
28,
29]. Currently, street view analysis technology has become a hot topic in the research on urban architectural color evaluation and refined urban management. Street view data not only provide a detailed depiction of the city’s visual environment from a human perspective but also enable the quantification of visual information from street images based on visual landscape perception through image recognition technology. This includes elements such as color, quantity, area, and proportion [
30,
31]. Additionally, street views implicitly convey information related to urban functions, socioeconomic conditions, and human activities that lie behind the visible environment [
32], providing an opportunity for refined urban street design and management. For example, Chen [
33] identified and proposed management strategies for disordered elements in street spaces based on street view images; Ye [
34] extracted street network data using the Baidu Maps API and applied a convolutional neural network tool (SegNet) based on machine learning algorithms to extract image features and visualize green visibility. In terms of color evaluation, Lu [
35] classified color information from street view images and evaluated the street color environment based on hue, saturation, and brightness; Fu [
36] extracted architectural colors from the main urban area of Changsha using the K-means clustering method in MATLAB after acquiring a large number of street view images. They summarized color features such as hue and brightness, and analyzed the phenomenon of color disorder in the space; Zhong [
15] improved color recognition methods to increase the accuracy of the results, such as using gamma correction and white balance algorithms to correct color deviations and brightness, applying erosion and closing algorithms to refine building edges, removing shadows from extracted urban façade images through shadow detection, and converting panoramic images from equidistant cylindrical projection to equidistant azimuth projection for results that more closely match the human eye’s perspective. They finally validated the recognition results through expert assessments. Furthermore, Chen [
37] used Sentinel-2A remote sensing data to quantitatively measure the color harmony of five major cities—London, Tokyo, Chicago, Paris, and Beijing—in 2020, providing policy insights for color management.
3. Research Methodology
3.1. Research Scope
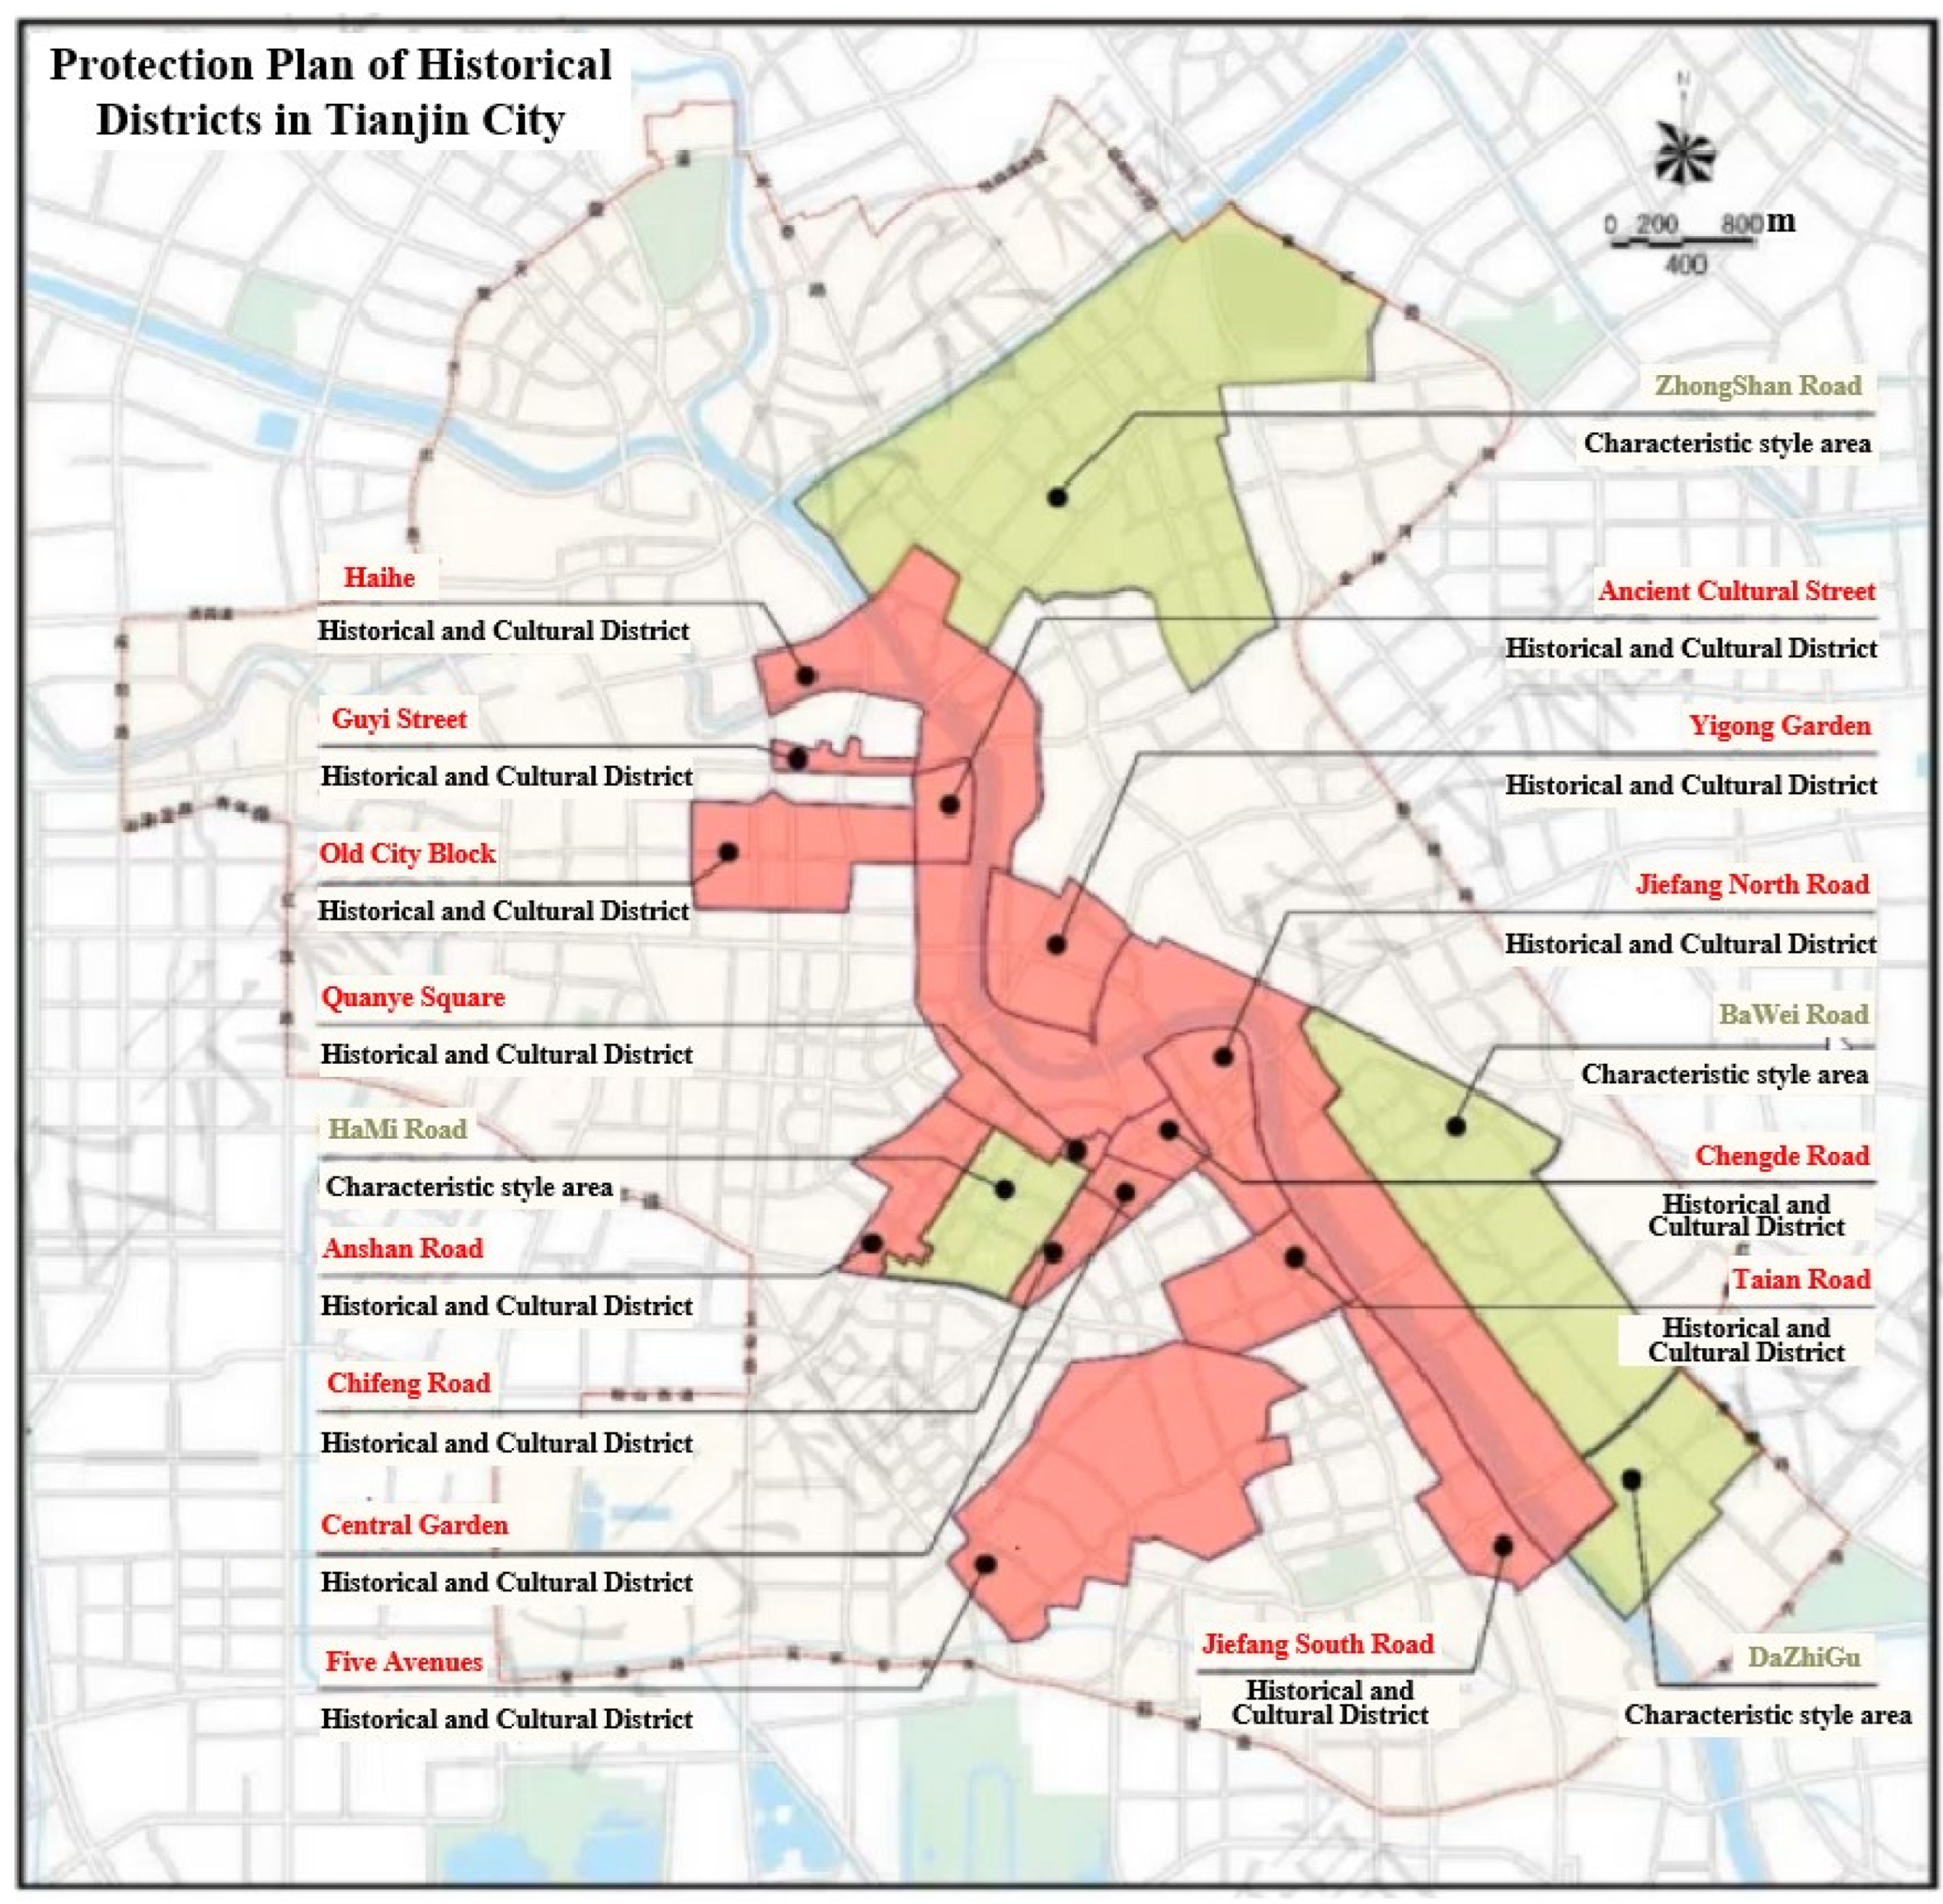
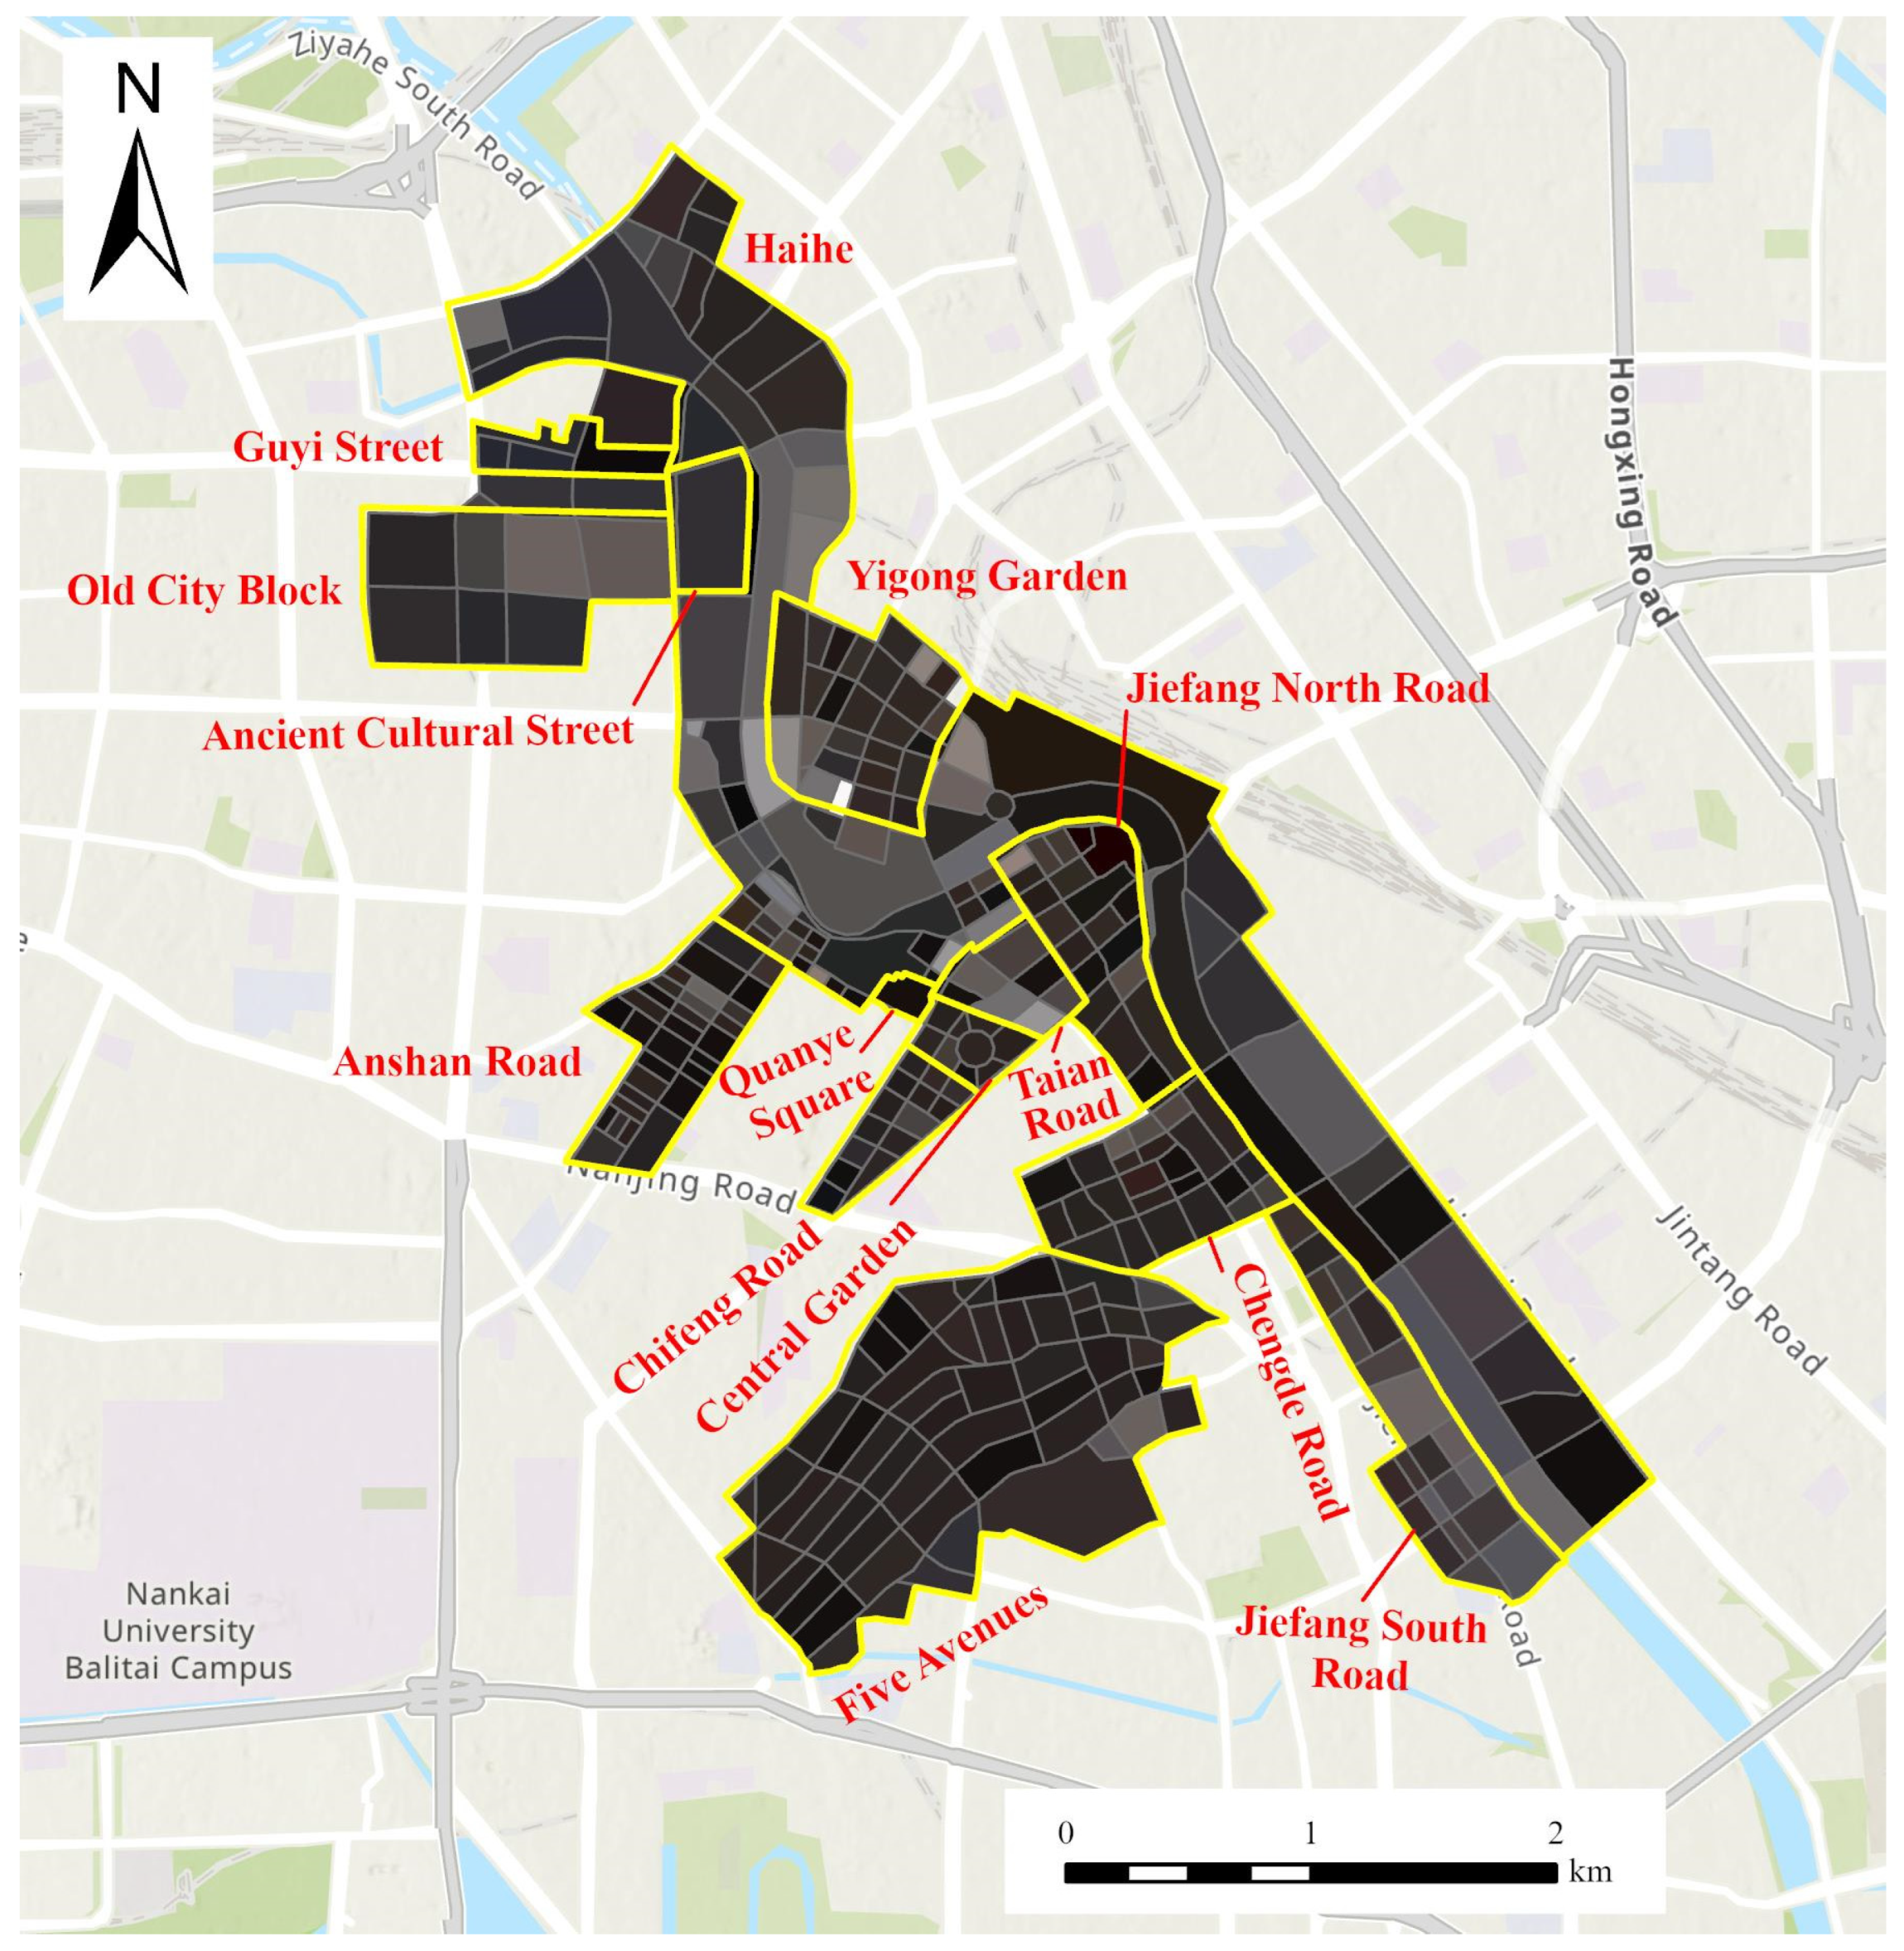
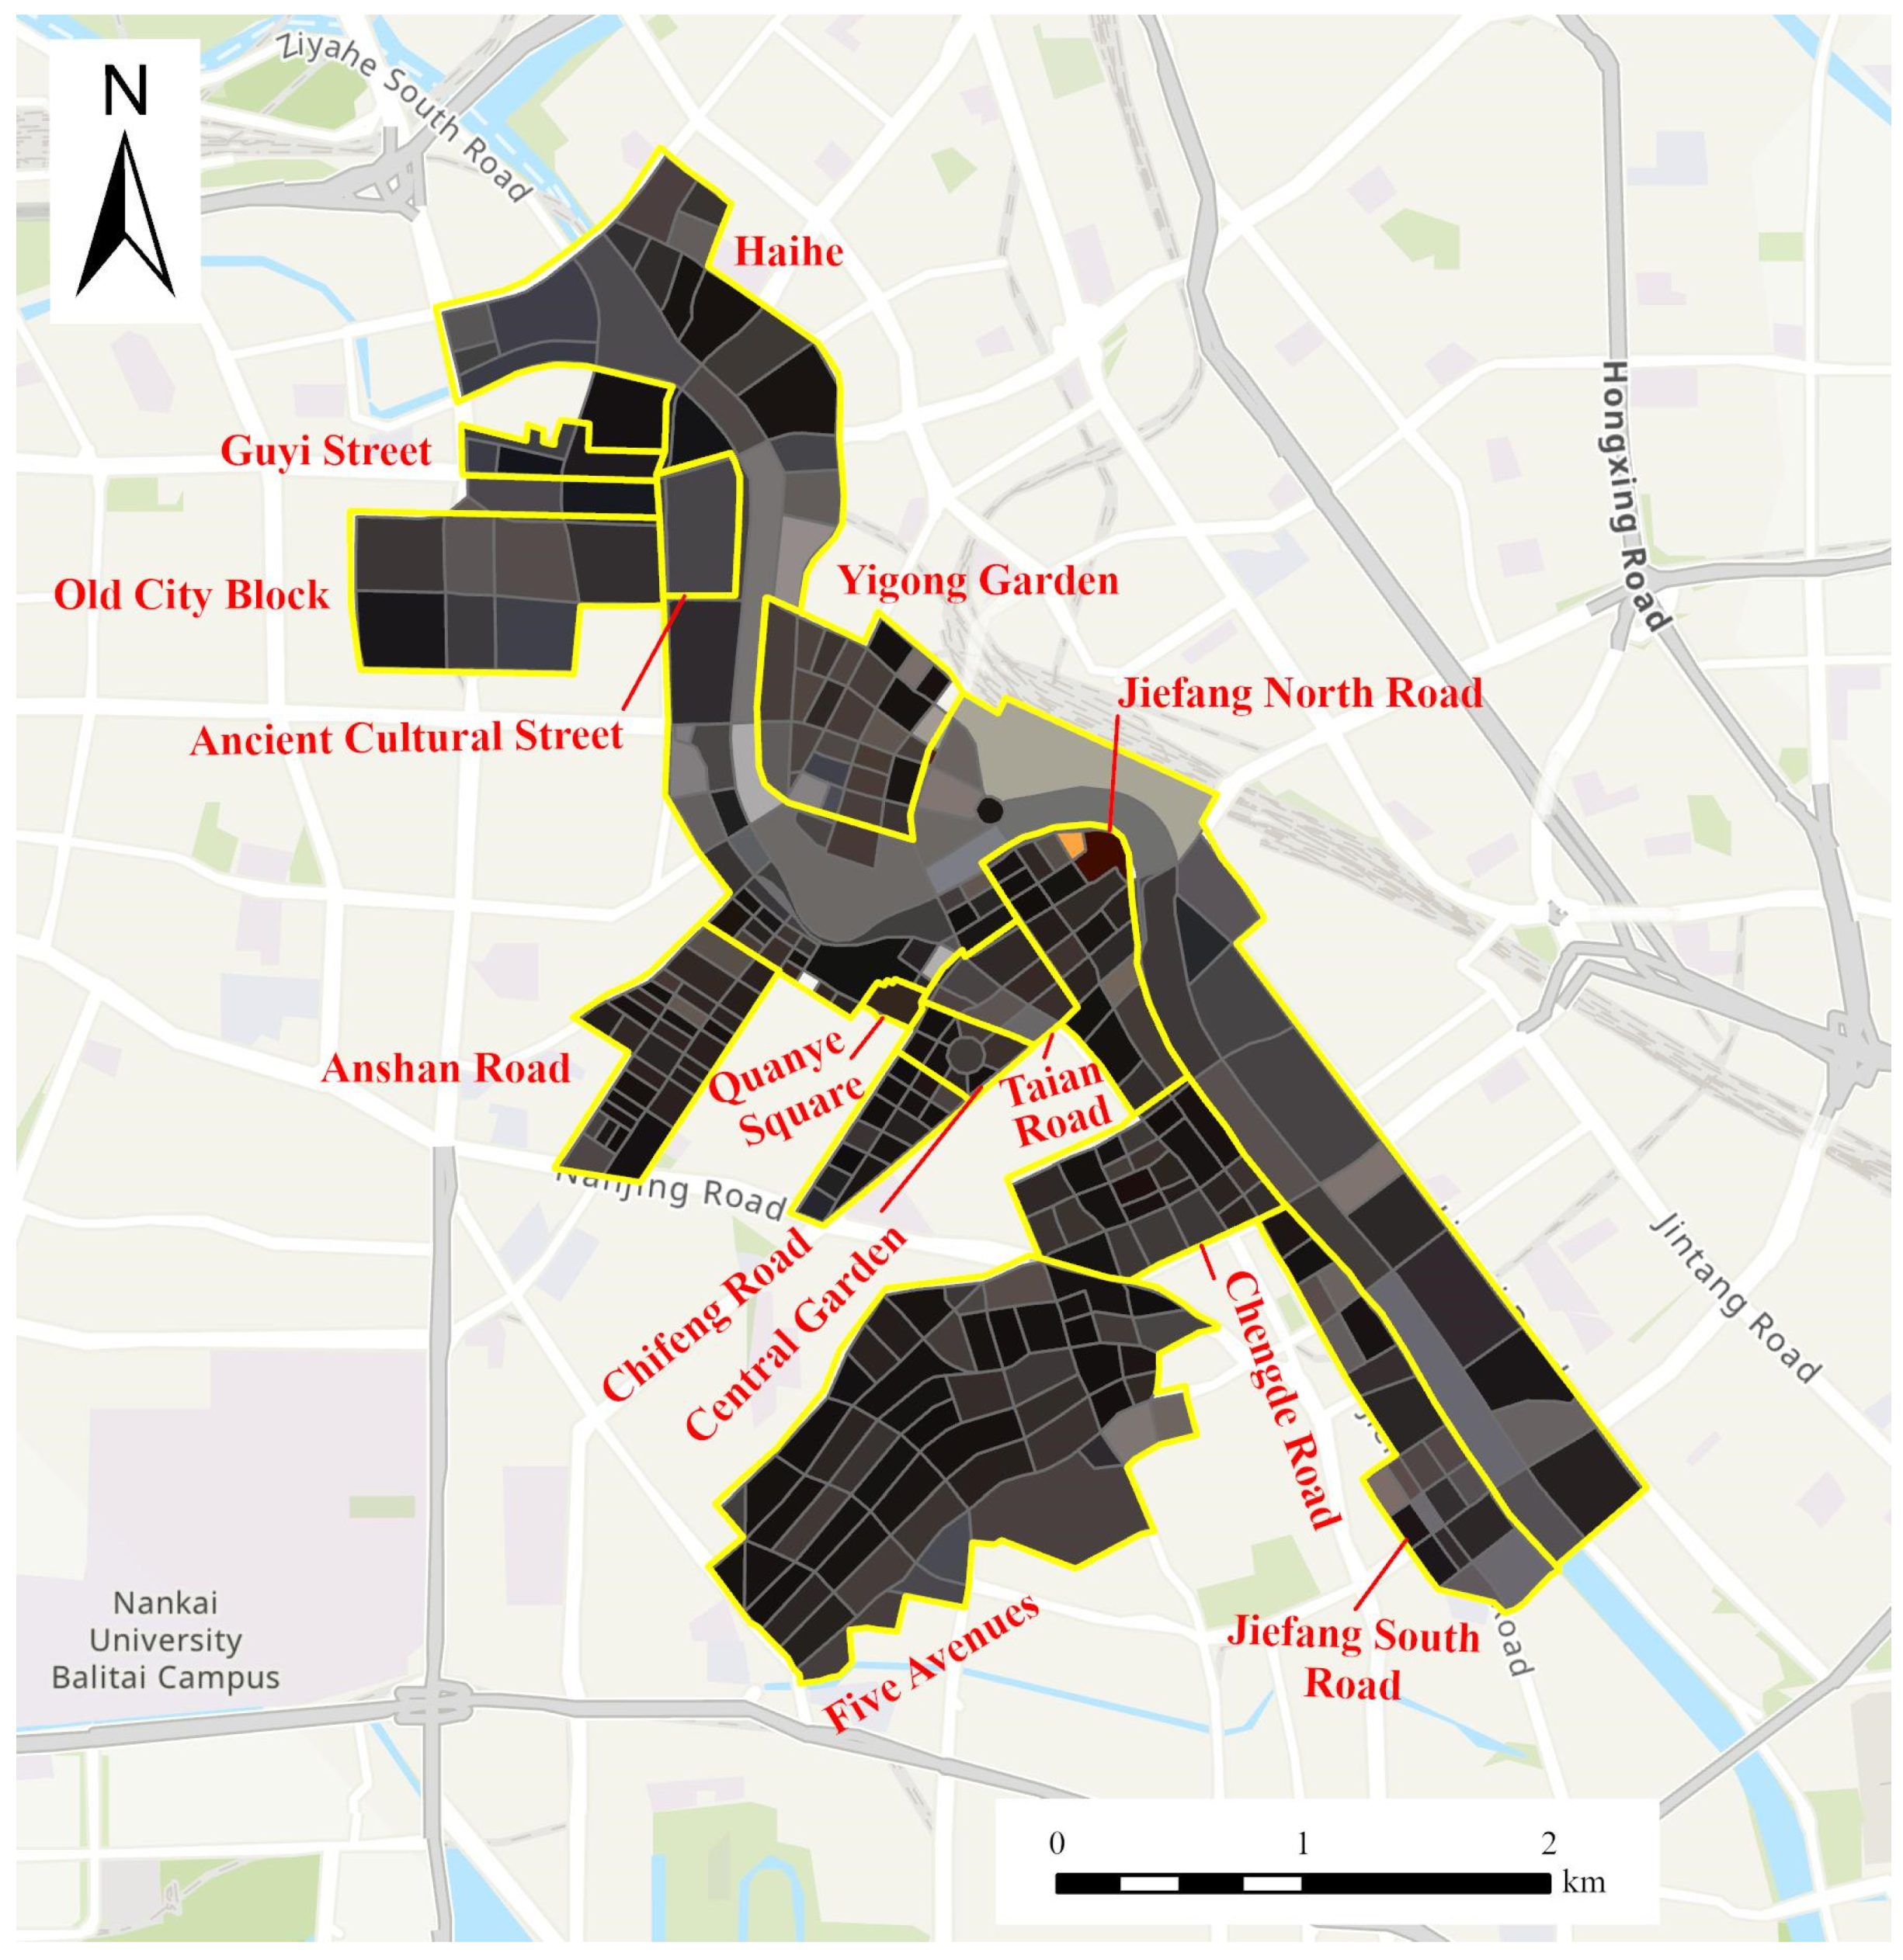
Architectural color is one of the most important aspects to focus on in the historical and cultural districts of Tianjin. The “Tianjin Historical and Cultural City Protection Plan (2021–2035)” [
38], compiled by the Tianjin Municipal Bureau of Planning and Natural Resources, outlines the overall protection framework of “One City, Two Districts, Two Belts, Multiple Points”: One City refers to the historic district centered on old Tianjin; Two Districts include the Five Avenues–Jiefang North Road Historical and Cultural District and the Guyi Street–Ancient Cultural Street Historical and Cultural District; Two Belts consist of the Haihe Cultural Belt and the Beijing–Hangzhou Grand Canal Tianjin section Cultural Belt; Multiple Points refers to 14 historical and cultural districts (Haihe, Guyi Street, Old City Block, Quanye Square, Anshan Road, Chifeng Road, Central Garden, Five Avenues, Ancient Cultural Street, Yigong Garden, Jiefang North Road, Chengde Road, Taian Road, and Jiefang South Road) and 877 historical buildings with distinctive architectural features. The spatial layout of the 14 historical and cultural districts is shown in
Figure 1.
As early as 2005, the Standing Committee of the Tianjin People’s Congress enacted the “Tianjin Historical Building Protection Regulation” based on local conditions, providing comprehensive protection and effective utilization of historical buildings [
39]. The 14 historical and cultural districts, with their high aesthetic quality and relatively mature development, fully reflect the urban historical and cultural characteristics of Tianjin, making them an ideal subject for the study of color environment evaluation and management in historical and cultural districts.
3.2. Method for Color Recognition in Historical and Cultural Districts
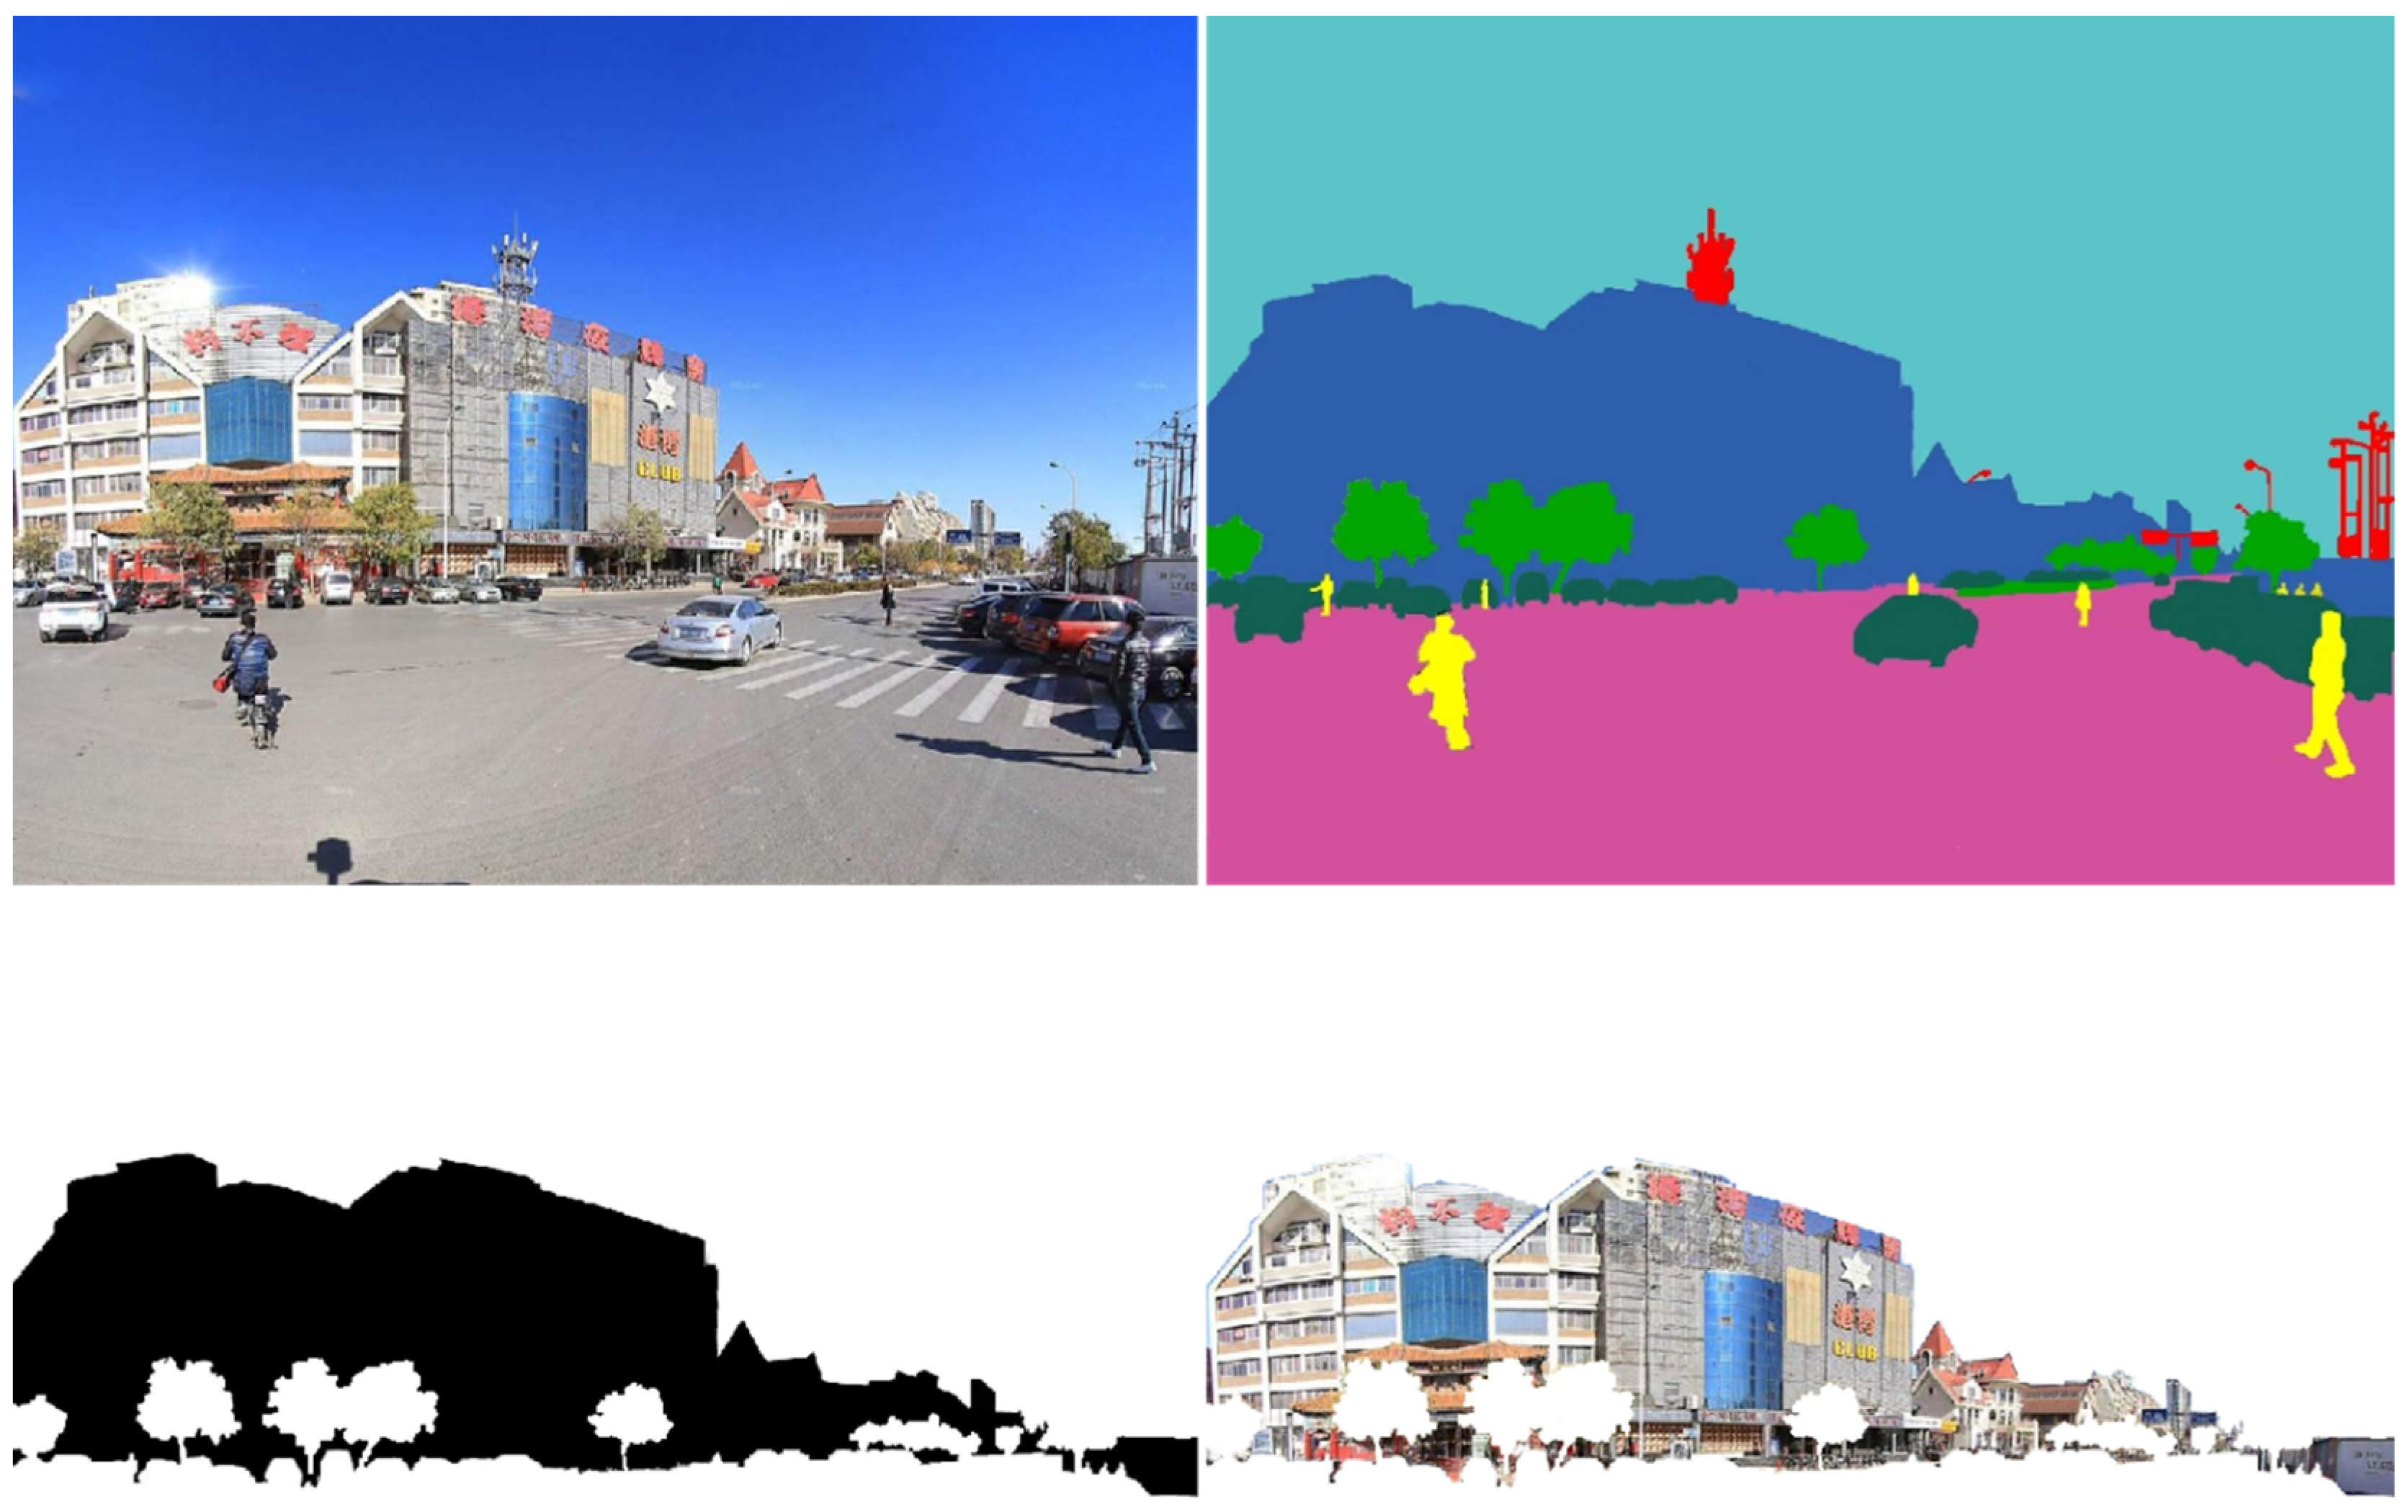
This study collected a total of 25,240 street view images from 14 historical and cultural districts in Tianjin through Baidu Street View data. For image acquisition, road network data were obtained from OpenStreetMap, and ArcGIS 10.8 was used to generate one street view point every 30 m. The geographic coordinates of these points were converted using a Python script 3.11.0, and the street view panorama images were then obtained by calling the Baidu Street View Map API. In terms of building element extraction, the Deeplabv3+ semantic segmentation algorithm was employed to extract street elements, and a threshold segmentation algorithm was used to extract building elements, which became the subject of the architectural color evaluation. The process of building element extraction is shown in
Figure 2. During the image preprocessing stage, shadow removal from the street view images was achieved using the maximum–minimum filtering algorithm, while the Numpy and OpenCV basic functions helped reduce the interference caused by varying brightness by applying a white balance algorithm. The identification of the dominant color tones of buildings in historical and cultural districts primarily relies on the Haishoku library in Python 3’s Pillow package, which allows for the extraction of the color scheme of an input image, including the proportion of each RGB color. After obtaining the dominant color tones of each street view point, the methods for core color extraction proposed by Wu et al. [
40] and Nguyen et al. [
41] were referenced. Based on the literature [
42,
43,
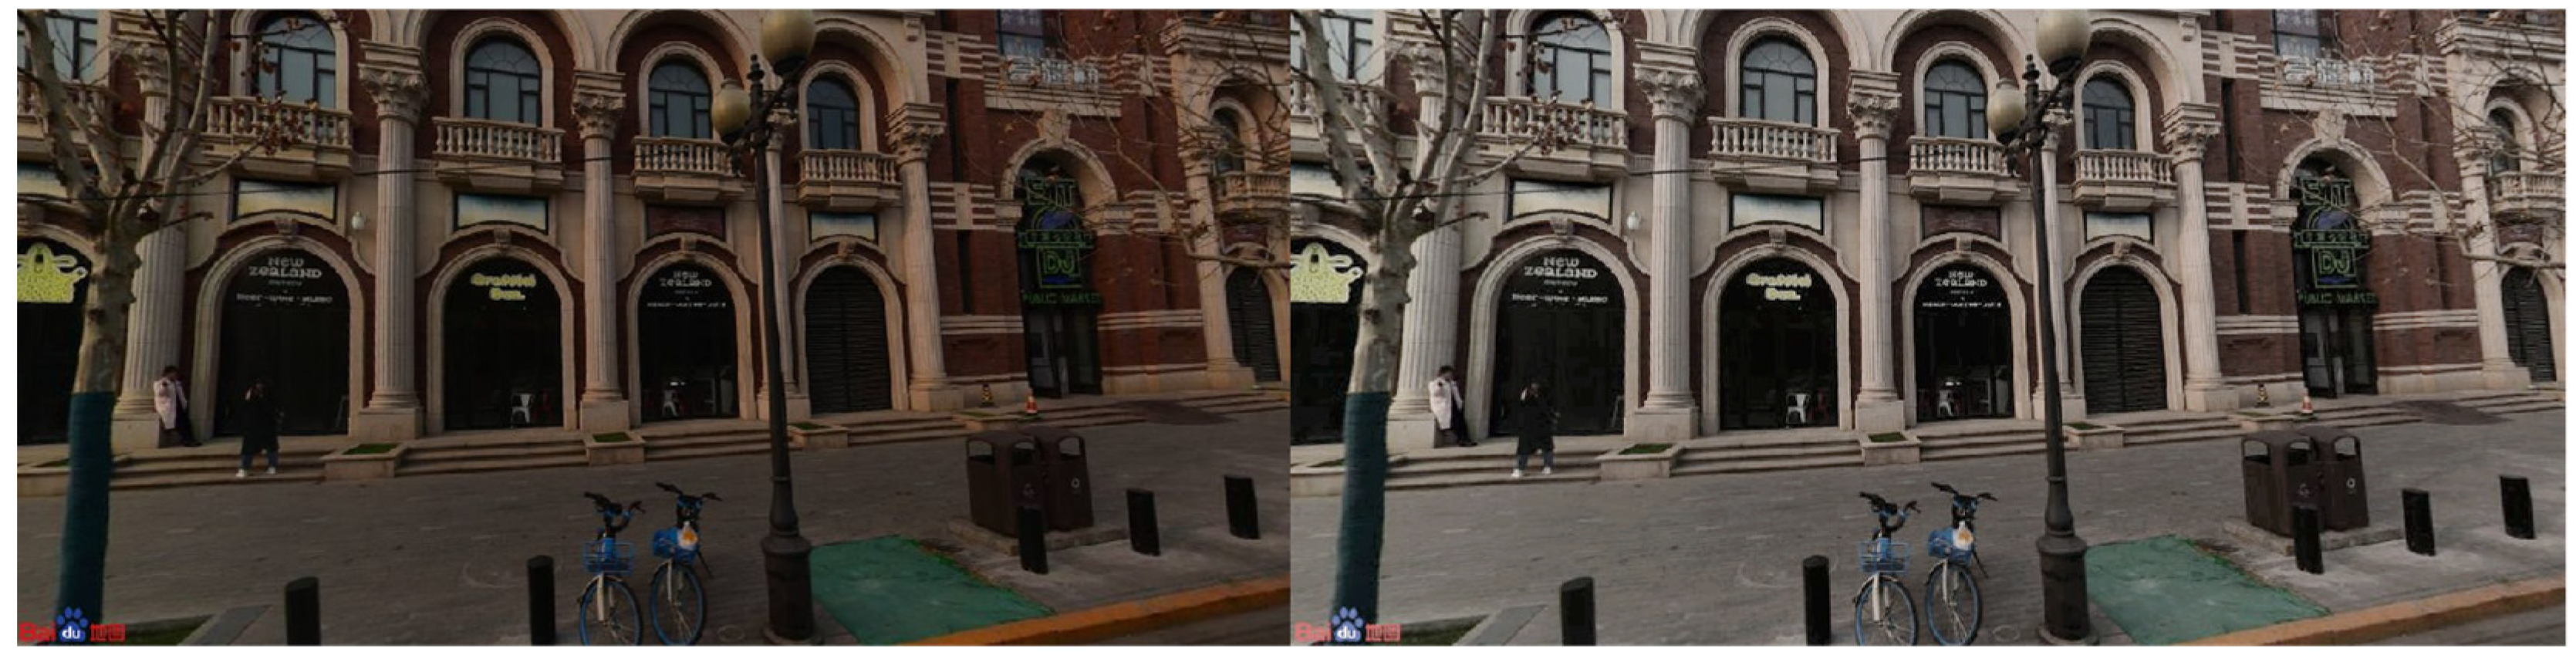
44], this study employed the mean-shift algorithm instead of the k-means clustering method as the primary algorithm for color clustering. Using HSV as the variable, the color data were clustered and filtered into n major color clusters, with the mean core point of each cluster representing the dominant color of the district. However, due to the limited resolution of hue, saturation, and brightness in HSV, it may lead to a loss of color representation accuracy. In contrast, RGB allows for fine adjustment of each color channel and enables high-fidelity color reproduction of the scene. In this study, RGB data are directly used after comprehensive consideration. Additionally, to reduce the impact of weather and lighting shadows on street view data in Tianjin, the Gray World Algorithm method [
15] is applied to adjust the proportion of red, green, and blue channels in the image. This helps remove the influence of the light source’s color temperature and restores the image’s true colors.
Figure 3 shows a comparison between the original street view and the street view after white balance processing.
The Mean-Shift non-parametric density-based clustering algorithm is widely used in image processing, pattern recognition, and data mining. The core concept of the Mean-Shift algorithm is based on gradient descent methods from optimization theory (also referred to as Newton’s method or steepest descent) [
45], where the goal is to find the extremum of a target function by following the direction of the gradient. In the task of color extraction from images, Mean-Shift identifies dominant colors by locating dense regions of pixel colors within the image. Unlike traditional clustering algorithms, such as K-Means, the Mean-Shift algorithm does not require a predefined number of clusters (K); instead, it automatically determines the number of clusters based on the distribution of the data.
The fundamental idea of the algorithm is to iteratively slide a window through a specified color space, progressively moving toward the region of maximum density where the data points (pixel colors) are located. These regions of maximum density represent the cluster centers, corresponding to the dominant colors in the image. Specifically, the algorithm calculates the “density center” of each pixel and updates it iteratively until the “shift” of the point approaches zero (i.e., convergence). Through this process, Mean-Shift can adaptively identify the convergence points of different color regions in the image.
Each pixel point in the image is treated as a data point. The color value of each data point can be represented as , where d is the dimension of the color space (for example, in the RGB space). All pixels form an matrix, where N is the total number of pixels in the image.
In the Mean-Shift algorithm, the local density is typically estimated using a weighted kernel function. A common choice for the kernel function is the Gaussian kernel, which has the following form:
In this expression, x is the target data point, represents the neighboring points, and h is the bandwidth (window size), which controls the density range of the local region. The choice of bandwidth affects the accuracy of the density estimation. The kernel function assigns higher weights to points that are more concentrated within the neighborhood, thus reflecting higher local density.
For each data point , the Mean-Shift algorithm determines its new position by calculating the weighted average of the point’s neighboring locations. This process is achieved through iterative updates to the position of the data point.
The updated formula is as follows:
Here, represents the neighborhood of the data point, and is the weight of the kernel function, indicating the similarity with point . The new position is the weighted average of all points within the neighborhood. In this way, the data point “shifts” toward the direction of higher local density, that is, toward its densest region.
The algorithm iterates continuously until the shift of each data point is smaller than a predefined threshold
, or the maximum number of iterations
is reached. The convergence condition can be expressed as:
Here, is the predefined convergence threshold, representing the allowable error in position change. The algorithm terminates if the drift of all points is sufficiently small.
After the algorithm converges, all data points will converge to regions of higher density, and the centroids of these regions will serve as the final cluster centers. Each data point is assigned to the cluster center closest to it, forming the final clustering result. In the context of image processing, the cluster centers represent the dominant colors in the image. The mathematical expression of the clustering result is:
Here, is the i-th cluster, is the centroid of the cluster, and δ is the radius of the cluster, representing the assignment of each point to its nearest cluster center.
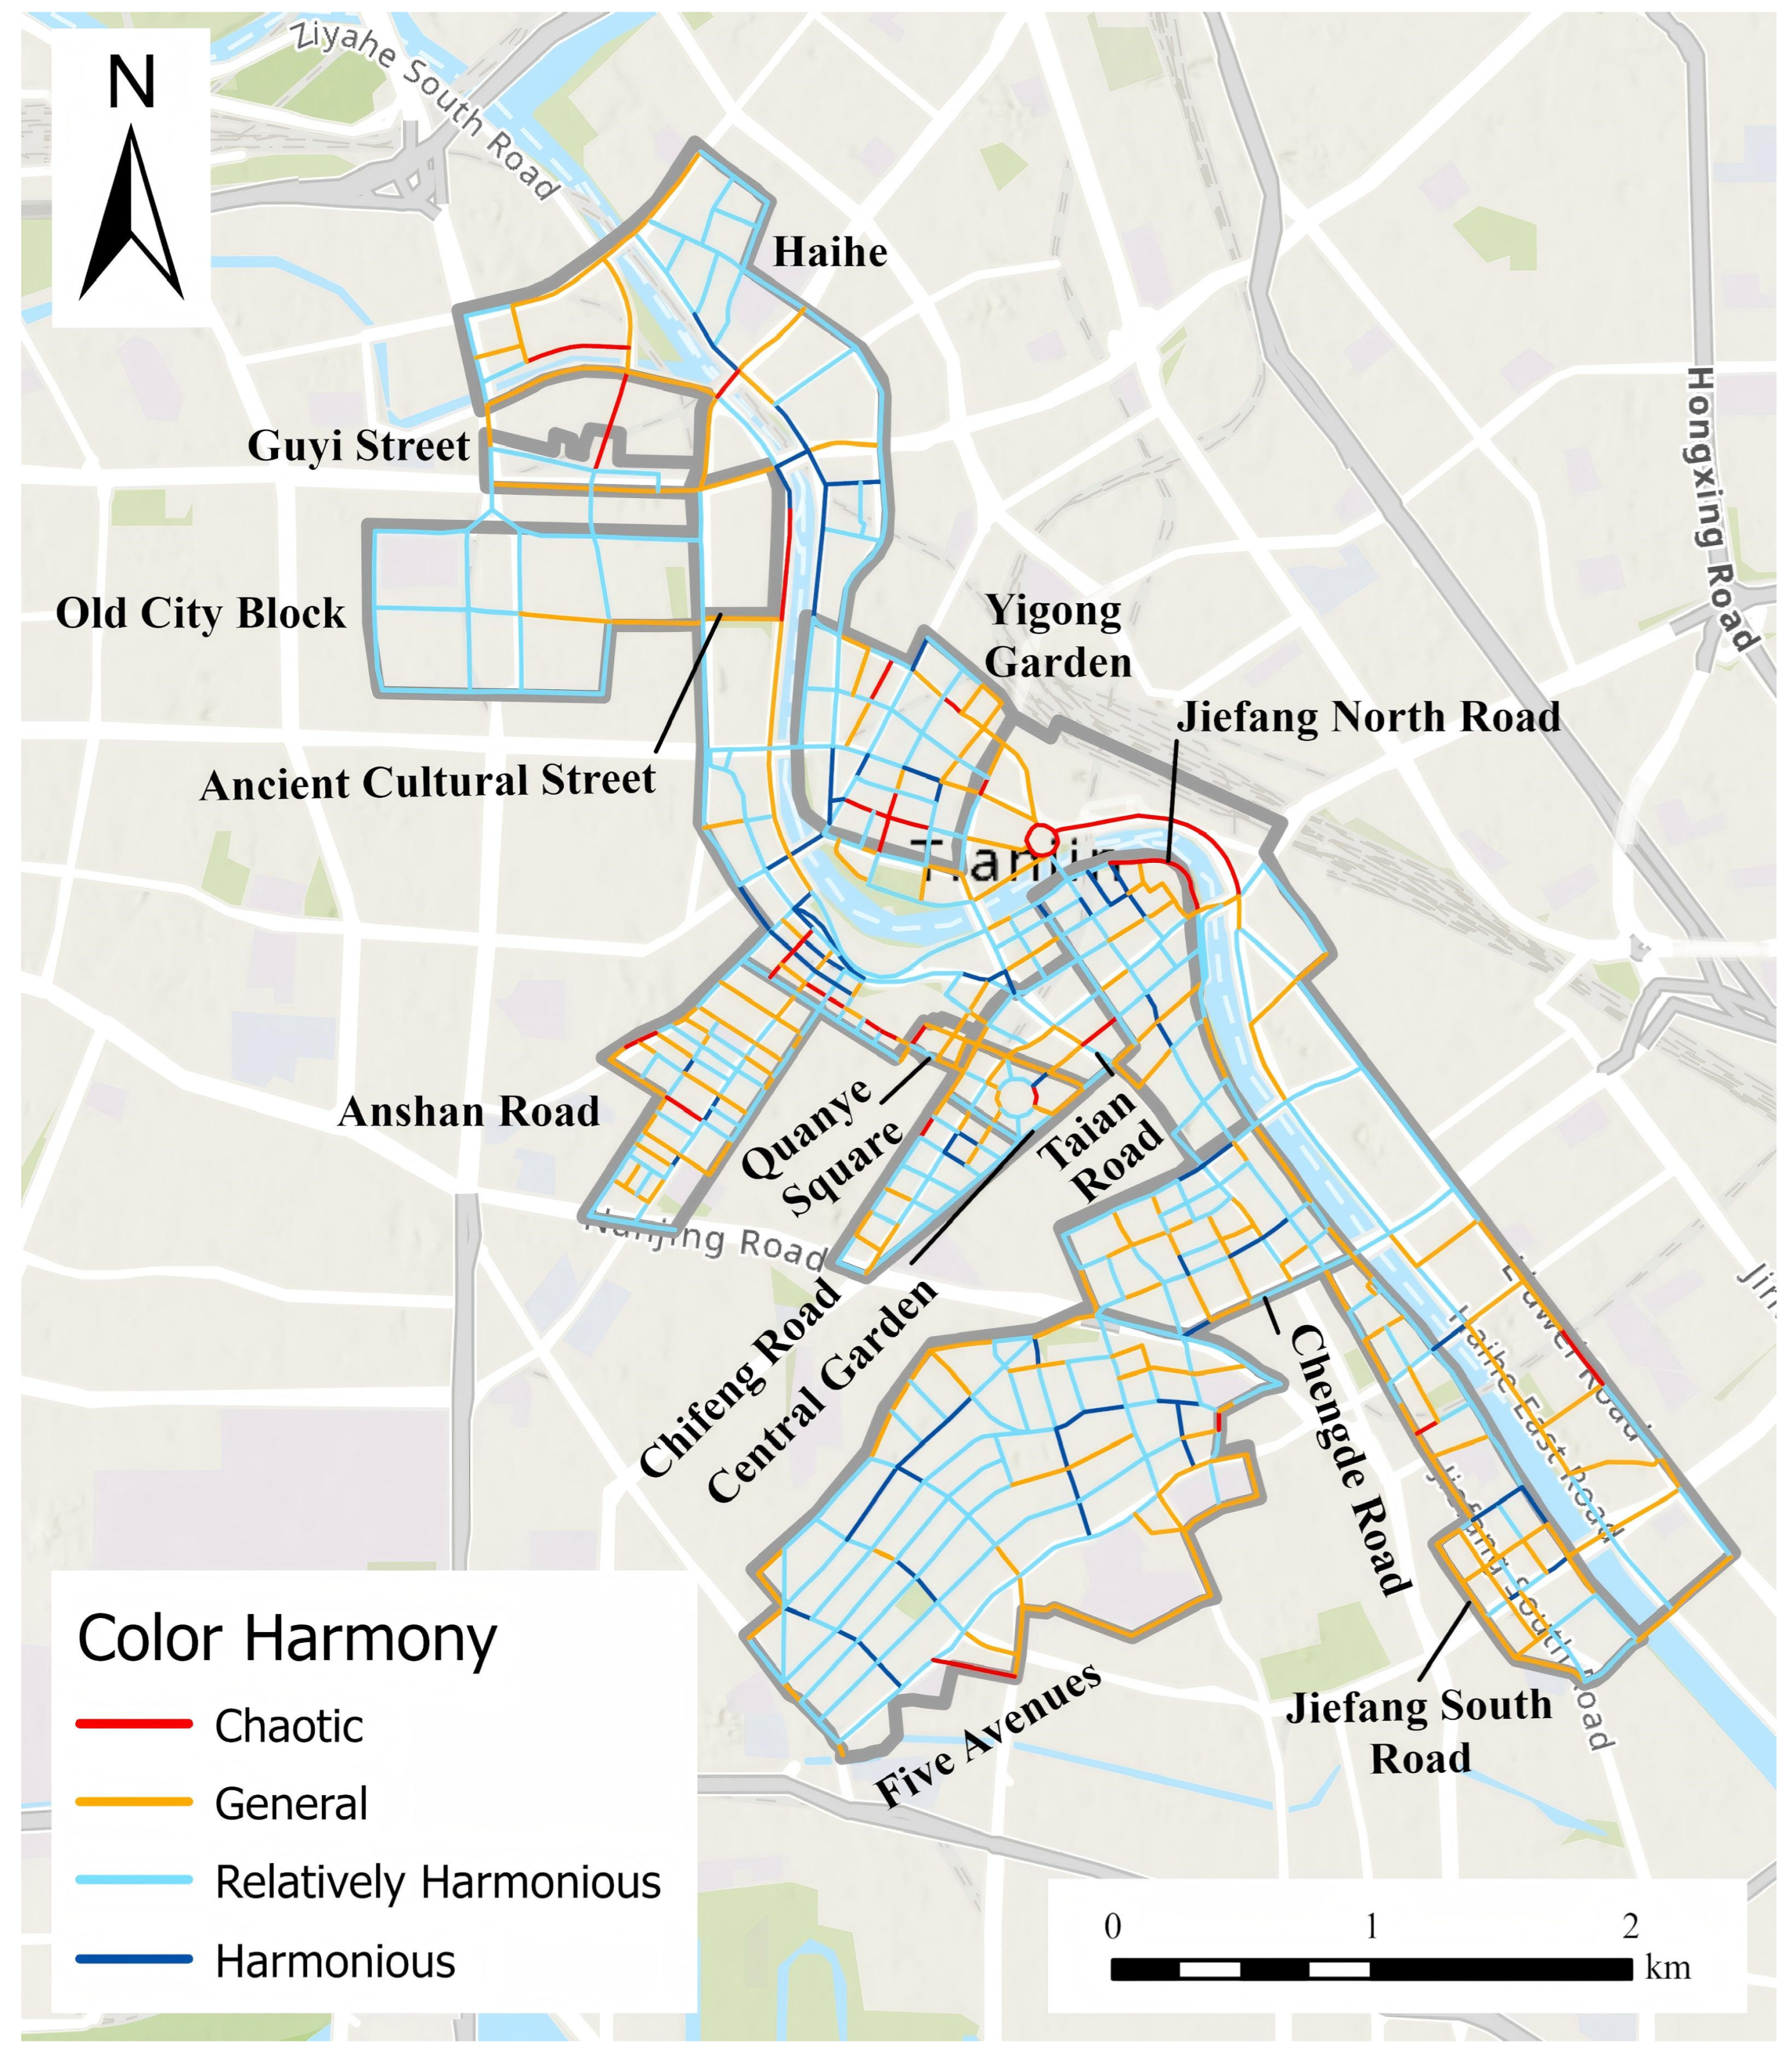
3.3. Building Color Evaluation Method
Building color can be evaluated from two aspects: overall cohesion and diversity, which reflect the balance, order, and richness of colors [
46]. The spatial effect achieved through overall color cohesion results in a visually harmonious and unified streetscape, avoiding chaotic color combinations. On the other hand, color diversity provides a rich visual experience, preventing monotony and lack of character, with colors exhibiting rhythm and layers. Based on these evaluation principles, the coordination and richness indicators of color are used to assess the architectural color environment of historical and cultural districts.
- (1)
Color Harmony
The measurement of Color Harmony is achieved by presenting colors with a similar or identical hue and chroma in similar proportions across the entire image. Typically, the difference between two colors is represented by the color distance
, which refers to the unit of color difference perceived by the human eye in a uniform color space. Using the Lab color space, the formula for
is as follows:
In the Lab color space, colors are represented by the values of
L,
a, and
b. By comparing the sample color with the reference color, the differences in the
L,
a, and
b values between the two colors are denoted as
,
, and
, respectively, which can be used to calculate the total color difference between the two colors. Since the three channels have different influences on human vision, and the effect of different values within the same channel is also not uniform, significant errors may occur. To address these issues, the International Commission on Illumination (CIE) improved the
and introduced
, which aligns more closely with human visual perception. To consider the area covered by each color when comparing perceived colors,
will weight the colors based on the proportion of the area covered by the extracted colors. In this study, to assess the overall color harmony of street scene images, the weighted average distance between each pair of colors extracted from the image is calculated. The formula for calculating color harmony is as follows:
In the equation: represents color harmony; h indicates the degree of coordination; and refer to the percentage of the area covered by the two compared colors (color i and color j); {1, 2, 3, …, n}, ; the product of is denoted as w; n represents the number of colors extracted from the image; and the expression represents the total number of all possible pairwise combinations that can be selected from these n colors, which is the number of “color pairs”. The color harmony value ranges from , with smaller values indicating lower overall color harmony in the street scene image, and larger values indicating higher overall color harmony.
- (2)
Color richness
Color richness is a metric that describes the diversity and variation of colors and brightness in an image or other visual media. In this study, we draw on the economic principle of the Herfindahl–Hirschman Index (HHI) to assess the color richness of an image by quantifying the concentration of color distribution. The core logic is that the more diverse the colors and the more evenly they are distributed, the higher the color richness. In economics, the HHI is represented by the sum of the squared market shares of all firms in a specific market. Its formula is:
where
M represents the total market size,
denotes the size of the
i-th firm,
represents the market share of the
i-th firm, and
n indicates the number of firms in the industry. By calculating the sum of the squares of the market shares of all firms in the market, the degree of market concentration is measured. Clearly, the larger the HHI, the higher the level of market concentration and the greater the degree of monopoly. Based on the standard form of the HHI, the formula for color richness should be:
In the equation: represents color richness, with larger values indicating higher richness; denotes the area proportion of the i-th color in the image (); and n represents the number of dominant colors extracted (as determined by the clustering algorithm described earlier).
5. Conclusions and Management Recommendations
This study integrates Baidu Street View data of historical and cultural districts in Tianjin, employing deep learning and computer vision technologies to develop a color evaluation method for the “building-street-district” framework in Tianjin’s historical and cultural areas. The innovation of this method lies in its ability to efficiently identify the dominant color tones of buildings at the district and street scales, based on the existing “point-line-plane” protection system of Tianjin’s historical and cultural heritage. Additionally, the method utilizes two key indicators, color harmony and richness, to conduct color evaluation at the street scale. Based on the research findings, the study proposes the following recommendations for color planning and management in Tianjin’s historical and cultural street areas.
- (1)
Deepening Color Management Content
The development of preservation plans should follow the principle of categorized protection, and color management should similarly be categorized and graded to prevent a “one-size-fits-all” approach. The evaluation of the overall cohesion and diversity of colors in historical and cultural districts reveals significant variations between roads within different districts. For streets in areas with low color harmony, targeted improvements can be made to the color landscape based on the evaluation results of street view points, avoiding the issue of “a red spot in a sea of green”. In areas with low color richness, urban design can guide the appropriate enhancement of the landscape features. When approving building facades, the evaluation should be based on the building renderings provided by the property owner, in conjunction with the recommended color palette and design management guidelines for the district. At the same time, the “Regulations on the Protection of Historical and Cultural Buildings in Tianjin” should be updated in a timely manner and strictly implemented. Additionally, design standards should be revised based on the current situation in Tianjin, and color control in the city should be further refined from the perspectives of laws, regulations, and urban planning.
- (2)
Enhancing the Color Assessment of Historical Buildings
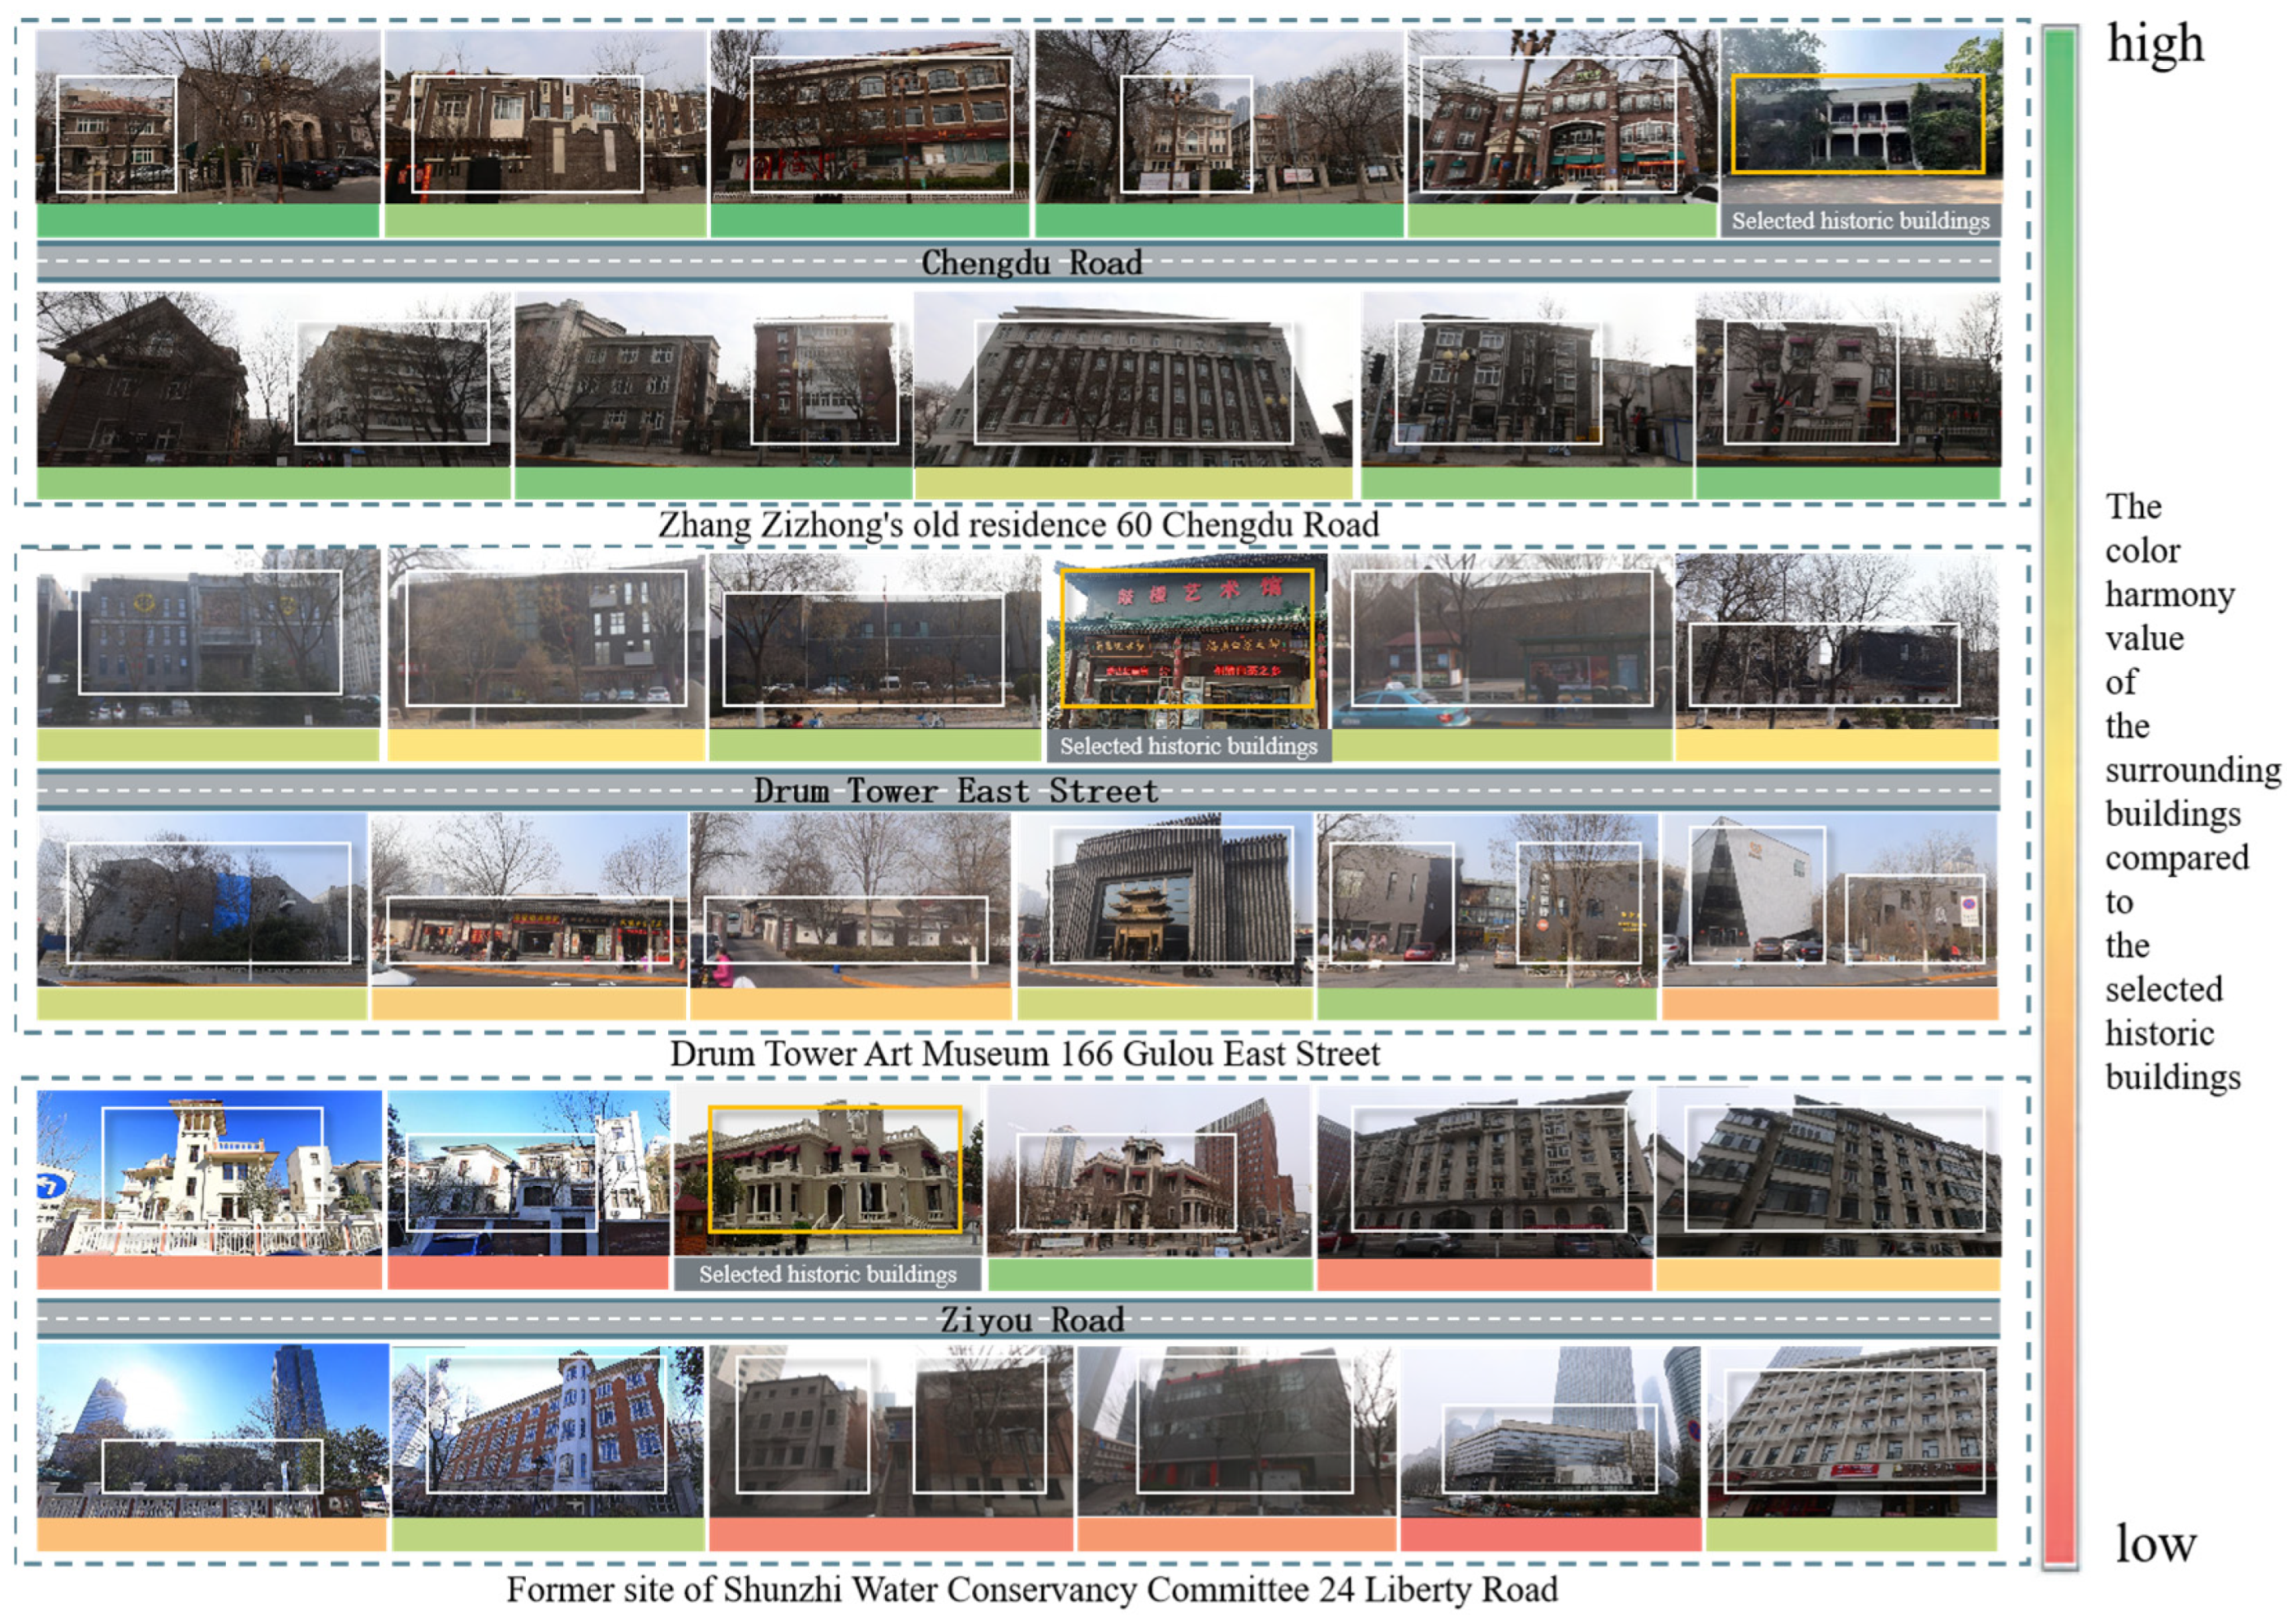
As the most important element for preservation in historical and cultural districts, it is recommended to designate a 20–30 m radius surrounding historical buildings as a color harmony zone for these buildings, where a comprehensive color assessment should be conducted. Through planning and regulatory control, the color variations of surrounding buildings should be kept within a defined threshold. At the same time, elements with a significant impact on color harmony, such as shop signs, should undergo strict approval and beautification design. For example, based on the findings of Won [
47], adopting a white or light-colored sign with a dark-colored building can enhance aesthetic harmony and readability. The protected area should not be monotonous or dull; on the contrary, it should achieve a diverse yet coordinated appearance within the framework of regulatory requirements, ultimately improving the quality of the historical and cultural district.
The research has certain limitations, as it is based solely on street view data for an objective visual perception color evaluation. In fact, further research is needed on the subjective color perception evaluations of residents and experts in historical and cultural districts. In the future, experts will be organized to conduct field observations to further explore the accuracy of combining urban semantic culture with computer metrics. To assess the validity of the objective results from street view data analysis, further on-site verification and calibration based on subjective evaluations are required. Additionally, as a port city, Tianjin benefits from abundant sunlight, which influences street view data through varying weather conditions and lighting shadows. Although white balance algorithms were applied during the experimental process to process images, and the top three dominant hues were analyzed comprehensively, the robustness of color metrics under different lighting conditions in the experimental samples requires further investigation and discussion. Moreover, while street view data are publicly accessible, easily obtainable, and information rich, they are captured by street view vehicles at different times. It is also uncertain whether the same camera was used and properly calibrated across all captures, necessitating further on-site verification
1.


