Abstract
Innovation is the core driving force behind the high-quality development and global competitiveness of cities. The spatial distribution characteristics and influencing factors of innovation are of significant value in optimizing the allocation of innovation resources. This study focuses on Harbin, utilizing 46,057 patent application data from 2004 to 2022, and employs spatial analysis methods such as KDE, ESDA, and DBSCAN to analyze the spatiotemporal evolution patterns of innovation space. Through the MGWR model, this study investigates the factors influencing the spatial agglomeration of innovation from five dimensions: innovation subjects, infrastructure support, public service support, population and market, and spatial carrier. The findings are as follows: (1) In terms of spatiotemporal patterns, Harbin’s innovation space distribution shows a “one core, four cluster” spatial structure, with innovation activities clustering primarily around universities as the core and new districts as key support, gradually evolving toward a multi-center agglomeration development model. (2) Regarding influencing factors, the geographic proximity of universities is significantly associated with higher innovation density. Among infrastructure, metro stations show a positive association with innovation agglomeration, potentially reflecting the role of transport accessibility. Public service support displays significant spatial heterogeneity across different regions. (3) The Historical Area requires policy guidance for urban renewal; the New Town Area forms exogenous-driven innovation clusters; the Industrialized Park Area achieves endogenous development through industrial collaboration.
1. Introduction
As the global economy enters the era of innovation-driven development, knowledge economy and technological innovation have become core drivers for cities to compete globally. Urban innovation space, as the carrier of innovation activities and the agglomeration of innovation factors, shapes whether spatial structures support high-quality socio-economic development through innovation. Its distribution patterns result from interactions of socio-economic and cultural forces [1], influenced by objective and subjective factors, warranting comprehensive spatiotemporal analysis to guide policy and enhance vitality [2]. The distribution of innovation activities in space is agglomerated and uneven, with high concentration in a few narrow geographic areas of a country, such as Silicon Valley in the United States, which serves as a model for highly concentrated technological innovation in developed countries and even globally [3]. Its technological innovation is mainly concentrated in a narrow “triangular” geographic space [4]. This agglomeration model generates substantial advantages including knowledge spillovers, specialized labor markets, and robust innovation ecosystems that facilitate face-to-face interaction and resource sharing. However, it also presents significant drawbacks, particularly escalating costs (housing, land, labor), exacerbated regional inequality through brain drain from peripheral areas, and increased systemic vulnerabilities to external shocks. In recent years, innovation agglomeration has been shown to directly influence a country or region’s innovation capacity and competitiveness, yet measuring and describing this phenomenon remain challenging [5,6]. The level of innovation agglomeration restricts economic productivity [7], and the formation mechanisms of innovation cooperation, among others, need to be distinguished and identified [4]. The big data era and interdisciplinary approaches now enable quantitative studies of innovation clustering, revealing deeper intercity connections and spatial organization.
The spatial agglomeration of innovation activities is central to innovation space research. Globally and regionally, innovation concentrates in a few areas [8,9]. Scholars quantify agglomeration using R&D investment, patent counts, and new-product outputs, measured with indices like the Herfindahl Index, Gini Coefficient [10], and EG Index [11], while continuous spatial analysis methods refine these measures [4]. Additionally, in studies on spatial scale, some scholars found that innovation clustering is highly distance-sensitive, with efficient clusters forming only within very small spatial ranges [12]: patent citations decline sharply with distance [13], and knowledge spillovers within 1 km exceed those at 2–5 km by over tenfold and virtually vanish beyond 10 km [14]. However, geographic proximity alone is neither sufficient nor necessary; organizational, institutional, technological, and social proximities also matter, leading to the multidimensional proximity concept [15].
Explaining spatial clustering involves three core mechanisms: knowledge spillover, matching, and sharing [16]. Knowledge spillover—the transmission of uncertain, tacit knowledge—relies on face-to-face interaction to reduce transaction costs like negotiation and technical guidance [5,17,18,19]. Knowledge externalities within industrial clusters further enhance innovation output [20,21]. The matching mechanism improves high-skilled labor markets by increasing mobility and accelerating knowledge diffusion [22,23,24]. The sharing mechanism, via scale returns, fosters specialization in innovation services, lowering costs and encouraging innovation [25,26].
Empirical urban studies have applied these insights. Duan Jie and Meng Guoli examined policy-driven carriers, revealing spatial patterns and driving logic of platforms like industrial parks and makerspaces [27,28]; Luan Feng used micro-location theory to demonstrate significant clustering within a 500 m radius of high-level public service nodes, metro hubs, and universities [29]. Against the backdrop of innovations in data science methods, scholars such as Duan Dezhong and Li Lingyue visualized urban innovation spaces using big data on patents, publications, and other outputs [2,30]. Wang Jiwu developed predictive models to forecast trends in innovation space evolution [31].
The evaluation of urban innovation activities and their drivers has been approached from multiple angles. Esmaeilpoorarabi et al. combined qualitative and quantitative methods to analyze four cities [32] and three innovation districts in one city [33], identifying five innovation-cluster dimensions—context, form, function, ambiance, and image. They argued that effective innovation environments balance “hard” factors (economy, infrastructure) with “soft” factors (culture, society). Using two Delphi rounds and AHP, they developed the Delphic Hierarchy Process (DHP) to weight indicators and build a multi-level evaluation framework spanning regional, city, and cluster scales [34].
Other scholars have developed systems for identifying the influencing factors of urban innovation space distribution and clustering, focusing on the determination of influencing factors, research data, and methods. Li Lingyue, analyzing Shanghai patent data (2000–2015), documented micro-scale clustering evolving into a multi-center network. They found enterprises dominant, with universities and individuals also contributing, and showed that public budget expenditure and green-space area significantly boost overall innovation output [2]. Wang Jiwu applied a Boosting ensemble algorithm in Hangzhou to decompose seven factors—industry concentration, knowledge intensity, talent resources, service facilities, external and public transport convenience, and ecological environment—within an explanatory framework [31]. Yang Chengfeng used OLS and spatial econometric models on Hefei POI data to classify influencers into market potential, clustering environment, and surrounding built environment [35]. Guan Manling proposed a generalized urban innovation space framework for Nanjing’s core area and conducted a layered, multi-scale geographically weighted regression analysis of three innovation space types [36].
The above studies have established spatial correlations between innovation activities and patent outputs at regional and urban scales, enriching understanding of clustering and its determinants. However, there are still gaps in existing research. First, most studies target macro- [37,38,39] and medium-scale urban areas [31,40], leaving micro-scale, multi-type innovation patterns within cities underexplored. Second, although cities concentrate talent, technology, capital, and enterprises [41,42,43], existing work predominantly examines broader regional trends and intra-urban comparisons rather than detailed spatial layouts of diverse innovation subjects [30,44]. Moreover, the emphasis on innovative enterprises overlooks other actors and actual innovation outputs, creating a gap in quantitative, medium- and micro-scale analyses from an output perspective.
To summarize the development patterns of innovation activities across time and space, identify potential growth areas, elucidate the generation and development mechanisms of innovation spaces, and provide references for the future development of urban innovation spaces, this study builds a GIS database of Harbin patent data and employs multidimensional spatial analysis models to investigate two core questions. First, it reveals the spatial distribution characteristics and spatiotemporal evolutionary patterns of innovation activities through agglomeration analysis. Second, it establishes a systematic framework to identify the determinants and mechanisms of innovation space formation.
By addressing these research gaps, this study advances existing knowledge in three dimensions. Theoretically, it enriches micro-scale and multi-type innovation activity research while promoting multidisciplinary integration across management, economics, geography, and urban planning. Methodologically, it develops quantitative analytical approaches that integrate multi-source big data for micro-scale innovation space analysis. Practically, it provides empirical evidence for planners to optimize innovation resource allocation and formulate differentiated policies, ultimately guiding efforts to boost Harbin’s innovation vitality and foster high-quality urban socio-economic growth.
2. Materials and Methods
This section provides an integrated description of the study area, the research data employed, and the methodology adopted in this research. A concise summary of the analytical steps is illustrated in the accompanying flowchart (Figure 1) to offer a clear and systematic overview of the research design.
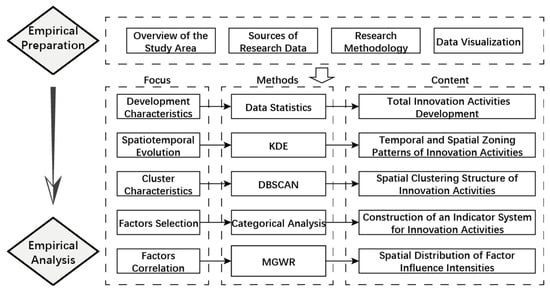
Figure 1.
Flowchart of the methodological framework.
2.1. Overview of the Study Area
The study combines the distribution characteristics of patent data and delineates the study area as the central urban area of the Territorial Spatial Master Plan of Harbin Municipality (2021–2035), encompassing the Nangang, Xiangfang, Daoli, Daowai, Pingfang, Songbei, and Hulan Districts [45,46]. Harbin, a core city in China’s northern opening-up and leader of the Harbin–Daqing–Qiqihar National Independent Innovation Demonstration Zone [47,48], is pivotal to revitalizing the Northeast’s industrial base and driving regional innovation. In 2022, Harbin’s GDP reached CNY 549.01 billion. Calculated at comparable prices, this figure represents a 2.5% increase compared with the previous year. In terms of industrial structure, the city has established a “tertiary–secondary–primary” development pattern dominated by the tertiary sector. Regarding population composition, by the end of 2022, Harbin had a registered population of 9.395 million, including 5.286 million registered urban residents, corresponding to a registered urbanization rate of 56.3%.
2.2. Research Data
Quantitative research on urban innovation spaces commonly uses STI (Science, Technology, Innovation) data—including innovation inputs, outputs, media, and networks—to capture different aspects of innovation. Among these, output data, particularly inventions and patent applications, is vital for mapping spatial distribution and temporal trends [8] and has become the primary metric in spatial innovation studies [9,10,11]. Patent applications, as key output indicators, reflect the type and status of innovation activities and underpin analyses of innovation volume, spatial clustering, disciplinary patterns, and evolution. Patent records capture both intermediate outputs and final market products, bridging R&D efforts and commercial outcomes. These data record applicant categories, addresses, application years, and subject classifications, effectively delineating spatial and sectoral characteristics of urban innovation.
Due to the limited availability of patent records in Harbin before 2000, this study focuses on the period from 2004 to 2022. A total of 48,172 patent applications were retrieved from the PatSnap database, and after removing duplicates, invalid or expired patents, incomplete records, and entries outside the study area, 46,057 valid patents were retained. It is important to clarify that, in the analysis of influencing factors, the dependent variable reflects the stock of patents that remained valid as of 2022, rather than the cumulative filing volume from 2004 to 2022. Therefore, the variable reflects the state of innovation outcomes in 2022, which aligns temporally with the built environment and socio-economic indicators (primarily drawn from 2020–2022 datasets), avoiding a temporal mismatch between the dependent and independent variables.
All valid patent records, including applicant type, address, filing year, and technological category, were geocoded in ArcGIS Pro 3.1 to construct the spatial dataset used in the analysis (Figure 2). A meso-to-micro analytical framework was then applied to assess the multidimensional spatial distribution of innovation using spatial econometric modeling techniques.
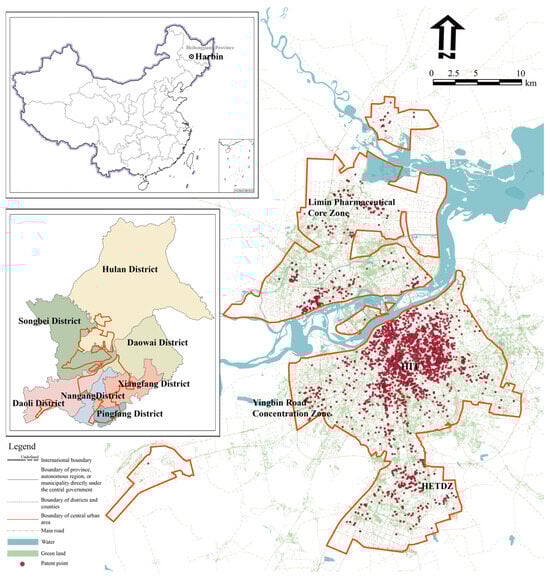
Figure 2.
Location of the studied area and spatial distribution of patent data.
While this approach ensures temporal consistency between variables, it should be noted that the validity year of patents does not fully capture their temporal filing sequence. Due to the lack of complete historical data for explanatory variables, this study is unable to distinguish the temporal lag effects between patent generation and changes in the built environment. This limitation is acknowledged, and future research may incorporate yearly patent records and historical POI or demographic data to construct longitudinal or panel-based models, enabling more explicit analysis of temporal dynamics.
Based on the research framework of integrating meso and micro scales, this study uses spatial econometric models to analyze the multidimensional distribution patterns of urban innovation spaces. The research area is divided into a 1 km × 1 km regular grid, consisting of 878 grid units, which serve as the basic units for innovation space analysis. During the regression analysis, Harbin’s patent application data are selected as indicators representing the distribution of innovation space. By spatially discretizing the data, the number of innovation spaces is overlaid on the grid system, generating 878 valid observations for the innovation space study unit. Compared to macro-level statistics of innovation space quantity, the spatial density index based on grid units better reveals the spatial heterogeneity of innovation factors at the micro scale.
2.3. Indicator System
Based on existing relevant research, this study integrates macro-level factors with micro-level service facility data to establish an influencing factor index system across five dimensions: innovation subjects, infrastructure, public services, population and market, and spatial carriers (Figure 3). Studies with different research objects are used to inform the selection of analytical dimensions and the quantitative methods for variable measurement, while studies with similar research objects are used to identify appropriate influencing factors. By integrating both sources of reference, a refined and context-specific index system of influencing factors is established.
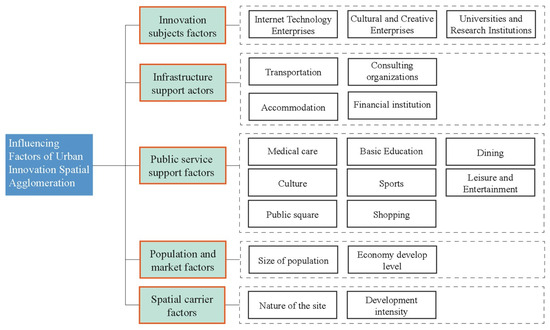
Figure 3.
System of factors influencing innovation space.
Studies on factors affecting the distribution of different types of spaces, such as the research on hackerspaces in Nanjing, propose a four-dimensional framework—policy, transportation, market, and innovation—with eleven specific indicators [49]. Research on hackerspaces in Fuzhou and Shenzhen identifies five dimensions—innovation atmosphere, living services, policy environment, inclusiveness, and traffic—and 23 detailed indicators [50]; similarly, a study on new-generation information technology enterprises in Nanjing develops an eight-first-level dimensional system that includes land cost, industrial base, labor resources, policy foundation, production services, ecological services, public services, and living services—further subdivided into second-level dimensions and indicators for a comprehensive multidimensional evaluation [51].
In the research on factors influencing innovation spaces, studies on Shenzhen’s innovation space indicator system include variables such as the number of universities/research institutions, manufacturing enterprises, information technology enterprises, and cultural innovation enterprises, and the number of metro stations, bus stops, hospitals, dining facilities, sports facilities, and leisure facilities [52]. Research on the innovation space pattern in Nanjing categorizes factors into innovation environment support—ecological, industrial, investment, and policy—and innovation entity services—transportation, dining, shopping, cultural, leisure, and production services [36].
Drawing from these studies and considering data availability, this research selects 27 influencing factors to form a three-level indicator system (Table 1). Data sources comprise POI from Gao De Map and China Eyeballs (Chinese company search engine), population statistics from WorldPop, and land use data from the Status Map of the Territorial Spatial Master Plan of Harbin Municipality (2021–2035). Through Variance Inflation Factor (VIF) testing, the medical facility density variable exhibits VIF > 7.5 and is therefore excluded to reduce covariance interference in subsequent regression analyses.

Table 1.
Factors influencing innovation space clustering and data sources.
2.4. Research Methodology
This study adopts three principal analytical methods—kernel density estimation (KDE), Density-Based Spatial Clustering of Applications with Noise (DBSCAN), and multi-scale geographically weighted regression (MGWR)—to examine the spatiotemporal distribution patterns and potential influencing mechanisms of patent applications in Harbin. The selection and ordering of these methods correspond to the overarching analytical framework of the research: (1) KDE is applied to characterize the spatial evolution and temporal dynamics of innovation activities. The results reveal overarching spatial dynamics and provide a foundational reference for identifying areas of concentration in subsequent analyses. (2) DBSCAN is employed to identify clustering trends, cluster structures, and potential innovation hotspots. The clustering outputs refine the understanding of spatial configuration and support the recognition of innovation spatial structures. (3) MGWR is utilized to explore spatially varying relationships between patent activity and a set of explanatory factors, thereby providing a tentative interpretation of possible localized drivers underlying spatial heterogeneity. The results provide exploratory evidence that helps interpret variations in spatial patterns observed in KDE and DBSCAN. In addition to these core analytical approaches, supplementary methods are incorporated where appropriate. The complete methodological procedures are presented below.
2.4.1. Kernel Density Analysis
KDE, as a distance-decay-based smoothing estimation, is suitable for capturing continuous spatial intensity patterns without requiring predefined boundaries. The model is as follows:
where x1, x2…xn are independently distributed n patent application data; h denotes the bandwidth; the kernel is a symmetric function that integrates to one and determines the local weighting (distance decay) around ; and the estimator is an estimated density (intensity) at .
2.4.2. DBSCAN Clustering Algorithm
DBSCAN is appropriate for detecting irregular spatial clusters and distinguishing meaningful innovation agglomerations from dispersed noise. The DBSCAN algorithm is capable of dividing sufficiently dense regions into clusters, and can effectively deal with noise points to discover spatial clusters of arbitrary shape. The algorithm mainly contains 2 important parameters: Eps and MinPts. Eps refers to the neighborhood distance; MinPts refers to the minimum number of samples contained in the neighborhood of Eps [53]. In this study, the algorithm is used to identify the spatial aggregation characteristics of patent data in Harbin, and the optimal parameters are selected with the help of a k-dist plot after several iterations in order to obtain the optimal clustering results.
2.4.3. Measurement of Land Use Mix Ratio
Referring to the calculation method of the degree of land use mix in existing studies [54], the specific calculation formula is as follows:
The constraints are
where is the entropy value indicating the degree of land use mix; k is the number of land use types in grid i. In this paper, according to the current status map of land use status and land use type classification of the Territorial Spatial Master Plan of Harbin Municipality (2021–2035), six land use types related to innovation space were selected—residential land, administration land, business land, industrial land, manufacture land, and utilities land—with other types classified into one category, and thus, k = 6; denotes the proportion of the k-th land use type in the total area of grid i. The value of obtained according to Equation (2) ranges from 0 to 1, where a higher value indicates a more balanced distribution of land uses, i.e., a higher degree of land use mix, while a lower value indicates a less balanced distribution.
2.4.4. Ordinary Least Squares Method
To study the impact of different factors on the distribution of innovation space, this study first performs spatial regression analysis using the Ordinary Least Squares (OLS) method, one of the most commonly used regression methods. The equation is as follows:
where Y is the dependent variable; β0 is the equation constant; βn is the coefficient of the independent variable Xn; and ε is the random error.
2.4.5. Multi-Scale Geographically Weighted Regression Analysis
Innovation space aggregation is often the result of multiple influencing factors acting together, requiring a comprehensive consideration of the influence scale of each independent variable. To avoid analysis errors caused by the equalization of influence scales, this study adopts the MGWR model to explore the relationship between independent and dependent variables, comparing the model’s fit with the OLS model and the classic geographically weighted regression (GWR) model to select the optimal model.
where (ui,vi) is the center geographic coordinate of the i-th sample; βk(ui,vi) is the value of the continuous function βk(u,v) in the i-th sample’s spatial unit; bwk is the bandwidth used for the regression coefficients of the k-th variable; and βbwk is the locally estimated regression coefficient, with specific bandwidth for each variable.
3. Results
3.1. Characterization of the Spatial Evolution Pattern of Innovation Activities
3.1.1. Analysis Framework of Innovation Activities
Through statistical analysis, kernel density estimation, and clustering analysis, this study investigates the overall characteristics of innovation activities in Harbin and their multi-scale spatiotemporal evolution (Figure 4). First, the general characteristics of innovation activities are examined to identify their temporal patterns, actor attributes, and technological theme structures. Subsequently, the spatial dimension of innovation activities is explored by analyzing temporal dynamics and regional patterns to reveal the evolutionary characteristics of innovation space. Finally, the analysis focuses on the spatial agglomeration of innovation, clarifying the developmental trajectory and underlying mechanisms of innovation clustering.
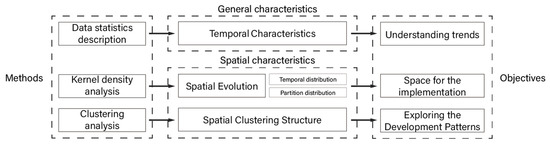
Figure 4.
Flowchart of the research on the spatial evolution pattern of innovation activities.
3.1.2. Temporal Evolution of Innovation Activities
From a temporal perspective, annual patent applications in Harbin (2004–2022) (Figure 5) exhibit four phases: slow rise, rapid surge, slight fluctuation, and sharp short-term decline. From 407 applications in 2004 to 1802 in 2011, applications grew at an average of 199.3 per year. Between 2011 and 2015, annual growth accelerated to 775.2 applications, peaking at 4360 in 2019. By 2022, patent applications declined sharply. While COVID-19 disruptions—including reduced onsite R&D activity in universities and industrial parks—likely contributed to this downturn, recent changes in China’s national patent policy framework (such as stricter examination standards, the shift from quantity-driven to quality-oriented evaluation, and the removal of patent subsidies) may also have played an important role. Therefore, the decrease may reflect both temporary pandemic effects and long-term institutional adjustments in the patent system [55].
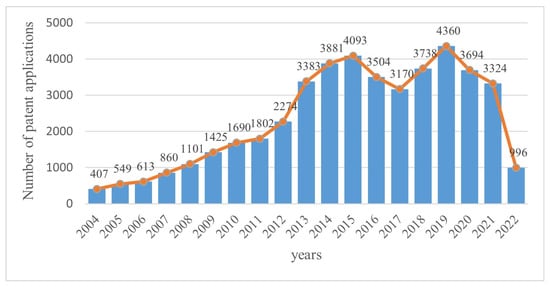
Figure 5.
Statistical chart of the number of patent applications filed in Harbin year by year.
3.1.3. Spatial Evolution of Innovation Activities
- ①
- Temporal Distribution of Innovation Activities
Kernel density analysis for 2004, 2010, and 2022 (Figure 4) maps the spatiotemporal dynamics of innovation in Harbin’s central urban districts. In 2004, innovation was nascent and concentrated around major universities, with minimal activity in the Harbin Economic and Technological Development Zone (HETDZ) and scattered instances in Songbei District (Figure 6a). By 2010, HETDZ and Songbei’s activity had grown, yielding a “one core, two wings” pattern: a central core around Nangang’s universities supported by the HETDZ and Songbei, alongside emerging eastern clusters (Figure 6b). In 2022, innovation space expanded rapidly into a “one core, four clusters” structure (Figure 6c). The historical core—centered on Harbin Institute of Technology (HIT), Harbin Engineering University (HEU), and environs—formed a high-density nucleus. Four peripheral clusters emerged: the Li-min Pharmaceutical Core Zone in Hulan District, Songbei Science and Technology Innovation City, Yingbin Road Concentration Zone, and HETDZ. This configuration underscores key universities’ centrality in innovation and industrial parks’ role in integrating external resources.
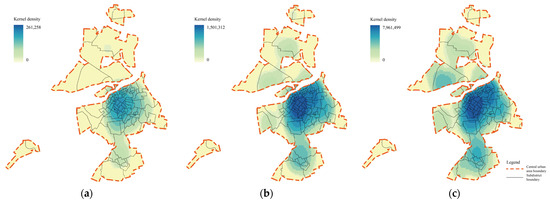
Figure 6.
Spatial kernel density of innovation activities analyzed over time: (a) 2004; (b) 2010; (c) 2022.
- ②
- Innovation Activity Partition Distribution
The KDE results of the current innovation activities were reclassified by a standard deviation-based approach. Specifically, the continuous density surface was categorized according to ±1 standard deviation from the mean density. The standard deviation classification emphasizes deviations from the mean density, ensuring that cluster cores are visually distinguishable from surrounding lower-density areas. This method highlights the core structure of innovation clusters, allowing for clear identification of high-density aggregation areas.
As a result (Figure 7a), one major high-density core and two smaller dispersed cores were identified. Accordingly, Harbin’s central urban innovation space was partitioned into three components, refined by spatial evolution, industrial concentration, and administrative hierarchy: the Historical Area primarily includes parts of Nangang District, Xiangfang District, Daoli District, and Daowai District; the Industrialized Park Area mainly includes the HETDZ in Xiangfang District and Pingfang District, and parts of Haxi New District in Nangang District and Daoli District; and the New Town Area includes parts of Songbei District and Hulan District (Figure 7b).
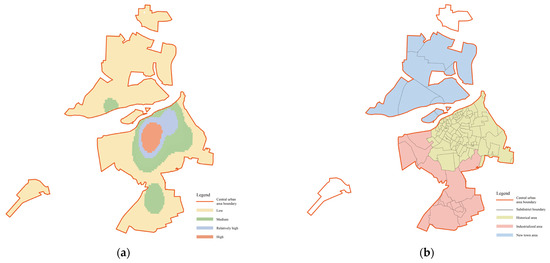
Figure 7.
Innovation activity partition distribution: (a) standard deviation classification of kernel density; (b) zoning map of innovation activity space.
Kernel density analysis was conducted on patent data for the three areas, mapped to subdistrict-level city maps to assess innovation space distribution. Historical Area: Innovation space centers on HIT, with HEU forming a secondary core, together creating a saddle-like pattern (Figure 8a). These universities, along with Northeast Agricultural University, Northeast Forestry University, and Harbin University of Science and Technology, exert a radiation effect across the area, forming a major innovation hub in Harbin’s central urban region.
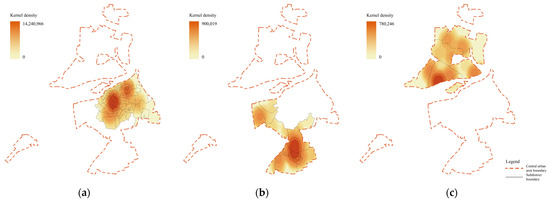
Figure 8.
Kernel density analysis of spatial zoning for innovation activities: (a) Historical Area; (b) Industrialized Park Area; (c) New Town Area.
Industrialized Park Area: Innovation activities concentrate in the HETDZ of the Xiangfang and Pingfang Districts, with secondary activity in the Harbin High-Tech Industrial Development Zone and Yingbin Road Concentration Zone, forming a “main–secondary” structure (Figure 8b). Due to geographical distance and limited interaction, these areas are evolving into separate innovation poles in the south and west.
New Town Area: This area’s innovation space includes the Songbei Digital Economy Industrial Park, Shenzhen–Harbin Biotechnology Industrial Incubation Park, and Li-min Pharmaceutical Core Zone in Hulan District (Figure 8c). These small, dispersed parks form a multi-point, multi-core pattern. While individual cores are weak in radiation and scattered, they show increasing influence and signs of interconnection.
3.1.4. Spatial Clustering Analysis Based on DBSCAN
Using the k-dist graph and iterative testing, optimal DBSCAN parameters were set as MinPts = 4 and Eps = 300 m (Figure 9), producing 228 clearly bounded clusters (Figure 9). Most clusters concentrate in the Historical Area, especially near universities and research institutes, often aligning with administrative boundaries. The largest cluster (cluster 1) spans the northern Nangang and western Xiangfang Districts; the second-largest (cluster 2) lies in the eastern Daoli and western Daowai Districts. Outside the Historical Area, clusters are fewer, smaller, and loosely packed, reflecting weaker innovation agglomeration consistent with the broader innovation space pattern.
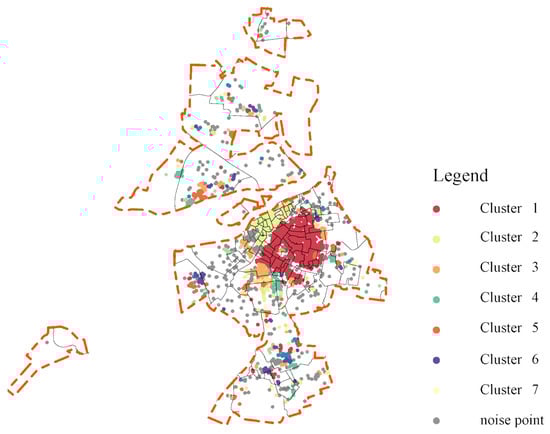
Figure 9.
Distribution of spatial clusters of innovation activities identified by DBSCAN.
3.2. Analysis of Influencing Factors
3.2.1. Regression Model Selection and Comparison
The OLS model, GWR model, and MGWR model were constructed, and after comprehensive consideration of residual sum of squares, AICc, −2 log-likelihood, and adjusted R2, the MGWR model showed the best performance (Table 2). Therefore, the MGWR model was selected for further analysis.
Table 2.
OLS, GWR, and MGWR model fitting effects.
3.2.2. Intensity of Effect of Influencing Factors
The coefficients from the MGWR analysis of innovation space were summarized, and the results are shown in Table 3.
Table 3.
Statistics on the results of the overall MGWR coefficient for innovation spaces.
- ①
- Significant coefficient proportion
The significant coefficient proportion refers to the share of grid units where explanatory variables are statistically significant (p < 0.05), indicating the spatial robustness of variable effects.
Based on the results, variables like Road buffer zone area, Density of dining facilities, and Density of sports facilities show significant coefficients in over 75% of grid units, suggesting strong influence on innovation activities. Variables like Distance between nearest advisory bodies and center point and Density of cultural facilities (50–75%) show moderate spatial correlations. Variables such as Internet technology enterprises, Distance between nearest universities/research institutes and center point, and Distance between nearest metro stations and center point have less than 50%, showing weaker spatial explanatory power. Some variables with 0% significance (e.g., Density of leisure facilities) had no notable local impact. Notably, results from global and local models may diverge; for instance, Density of dining facilities is globally insignificant but has 100% local significance, likely due to spatial heterogeneity masking global effects.
- ②
- Extreme value of coefficients
Extreme value analysis examines variable behavior in different regions. Variables such as Internet technology enterprises, Distance between nearest universities/research institutes and center point, and Density of cultural facilities had large fluctuations, indicating varying regional effects. Variables like Density of sports facilities, Distance between nearest major transportation hub and center point, and Road buffer zone area exhibited smaller variations, suggesting more stable performance. Many variables showed both positive and negative effects depending on location, underscoring the need to further explore spatial boundaries where factor effects shift.
- ③
- Average value of coefficients
Average value analysis captures the overall direction and dominant magnitude of each factor’s influence across the study area. In this study, most density- and land use-related variables (such as densities of service facilities and the road buffer zone area) present small-to-moderate positive mean coefficients, indicating that, on average, higher levels of these resources are associated with higher innovation intensity. By contrast, distance-based variables (for example, distances to metro stations, universities or research institutes, and major commercial centers) tend to exhibit negative mean coefficients, consistent with the expectation that closer proximity to key transport and knowledge hubs generally promotes innovation clustering. The fact that many mean values remain close to zero nevertheless suggests that no single factor exerts a uniformly strong effect citywide, reinforcing the view that the formation of innovation space is shaped by locally contingent combinations of multiple drivers rather than by any single dominant determinant.
3.2.3. Spatial Distribution of Influencing Factors
Based on the results of the MGWR model, the absolute value of regression coefficients was used to measure the strength of factor effects, and the significant coefficient proportion was used to characterize their relative contribution rate. Combining these initial analyses, significant variables with a non-zero significant coefficient proportion and p < 0.05 in the grid units were selected for spatial distribution analysis (Figure 10). According to the previous classification of influencing factors (Table 1), the significant variables were divided into five categories: innovation subject factors, infrastructure support factors, public service support factors, population and market factors, and spatial carrier factors. These categories were then used to construct an analysis system to reveal the spatial differentiation patterns of their impact strength.
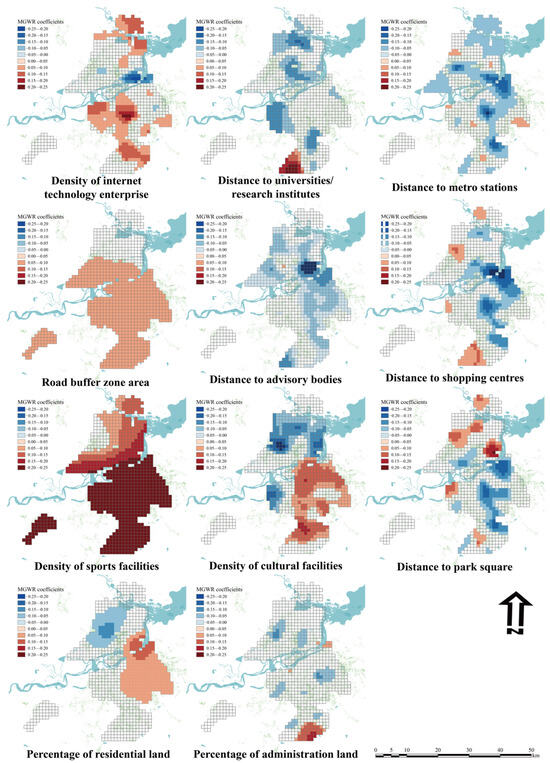
Figure 10.
Spatial distribution of spatial influences on innovation as a result of MGWR analyses.
- ①
- Innovation Subject Factors
The Internet technology enterprise variable exhibits high spatial heterogeneity, with large standard deviation and wide fluctuation in effects. Spatially, strong positive correlations are found in Haxi Subdistrict, the Yingbin Road Concentration Zone, and HETDZ, while strong negative correlation appears in the east riverside area. In Haxi, proximity to Harbin Institute of Technology (HIT) and science parks supports big data enterprise growth, forming a feedback loop with universities via joint labs and talent pipelines. Hulan District, with low-cost land and idle industrial spaces, supports the expansion of e-commerce and light-asset internet firms. The Yingbin Road Concentration Zone, leveraging airport and highway access, supports smart logistics innovations. The HETDZ has repurposed old factories into coworking spaces, attracting SMEs. In contrast, the east riverside area, dominated by heavy industries and aging demographics, lacks innovation synergy with internet technologies.
The variable Distance between nearest universities/research institutes and center point has a high absolute average negative value and a large standard deviation, indicating strong influence. Most areas show a negative correlation, especially near top institutions like the Yingbin Road Concentration Zone, Songbei Science and Technology Innovation City, Jiangbei University Town, and HETDZ, where proximity enhances access to talent and resources. As distance increases, innovation density drops due to reduced collaboration and resource access. However, positive correlations appear in areas like the South New Industrial Area, where national policies have led to independent industry clusters (e.g., biomedicine, high-end equipment). These regions rely less on universities, instead developing in-house R&D systems. Distant zones also serve as R&D or production bases, benefiting from lower costs and abundant land.
- ②
- Infrastructure support factors
- Transport facility factors
The variable Distance between nearest metro stations and center point shows a high standard deviation, negative average, and large absolute correlation coefficient, indicating that proximity to metro stations significantly promotes innovation space density. This is evident in the east riverside area (Line 1 terminal), in central Nangang District (intersection of Lines 1 and 2), in the HETDZ (Line 1 terminal), and near Jiangbei University Town (Line 2 terminal). These locations effectively transform metro passenger flow into innovation momentum, with compatible surrounding land uses. For instance, the east riverside area anchors metro access to revitalized industrial heritage, attracting digital design and cultural tech firms. Central Nangang forms a “10 min professional service circle” around its metro node, serving the legal and financial needs of innovation enterprises. The HETDZ integrates metro, freight rail, and highways into a multimodal hub, while Jiangbei’s station connects multiple campuses to the Science and Technology Innovation City of Songbei.
The Road buffer zone variable (500 m buffer from major roads) shows low heterogeneity and weak but stable positive correlation. Its influence is globally distributed and has a moderate positive impact in areas south of the Songhua River and some developed northern zones. Major roads serve as logistics and commuting backbones, lowering innovation transaction costs (e.g., raw material transport, commuting). However, the effect varies by industry and development intensity. Since Harbin’s road network coverage and supporting infrastructure are relatively consistent along major corridors, the influence remains modest and geographically widespread. In sparsely developed northern Songbei, with fewer roads, the influence on innovation is negligible.
- Innovation support facility factors
The variable Distance between nearest advisory bodies and center point also has a large standard deviation, and its negative correlation indicates that closer proximity to consulting services fosters innovation. The Songpu Group in Songbei District exhibits a strong positive core, where consulting agencies significantly support innovation. As Harbin New District’s core, Songpu hosts biomedicine, digital economy, and aerospace sectors, with strong reliance on services like patent agencies and cross-border auditing, enhanced by spatial closeness. Urban design aligns tightly with agency service coverage through dense street grids, keeping innovation spaces within their service radius. The Songbei International Financial Tower, for example, adopts a vertically integrated model, enabling onsite access to contract notarization and investment services, greatly reducing time costs.
- ③
- Public service support factors
- Catering and shopping facility factors
Large shopping centers, as living circle cores, are vital innovation space support facilities. The variable Distance between nearest shopping centers and center point has high standard deviation and marked heterogeneity. Its impact is generally negative—closer proximity corresponds to higher innovation space density. This is evident near east industrial parks, the Historical Area central science and technology parks, and the northern part of the HETDZ, where co-location of shopping centers and tech parks facilitates commercial–innovation synergy. These centers offer convenience services and business functions (e.g., conference venues), drawing in tech enterprises and talent. However, in areas like the South New Industrial Area, with fewer shopping centers and stronger policy reliance, innovation follows a “low-dependence” model. Here, high land prices may even hinder innovation, inverting the relationship between shopping centers and innovation spaces.
- Cultural and Leisure Facility Factors
Density of sports facilities shows a strong positive effect on central innovation spaces, especially south of the Songhua River, with a gradient decline northwestward. Sports venues are often integrated with commercial and innovation zones and paired with talent apartments, enhancing livability and attracting professionals. They may also support informal cross-industry exchanges, potentially fostering tacit knowledge spillovers. North of the river, sports facility density and impact drop sharply due to geographic separation, forming a rigid “south strong, north weak” boundary.
The Density of cultural facilities variable shows large fluctuations and both strong positive and negative correlations across areas. Positive effects appear in the Historical Area and Pingfang District, where heritage sites like Central Street and St. Sophia Cathedral and reused Soviet factories attract culture–tech hybrid enterprises. These “productive” cultural spaces boost innovation through storytelling and knowledge sharing. In contrast, Songbei District’s and Qunli Subdistrict’s cultural facilities (e.g., Ice and Snow World) function more as tourist attractions. Large commercial uses and parking displace innovation space, while high-end consumption facilities in Qunli raise land costs, suppressing innovation clusters. Thus, cultural spaces reflect sharp spatial heterogeneity—productive ones support innovation, while consumer-oriented ones may hinder it.
The variable Distance between nearest park square and center point shows a relatively uniform scatter pattern in relation to innovation spaces, aligning with Harbin’s “multi-core group” model. Parks like Sun Island, Cultural Park, and Children’s Park act as local innovation growth poles. These areas, with quality landscapes and open spaces, improve livability and attract highly educated talent. As informal public nodes, parks encourage interdisciplinary interaction and tacit knowledge exchange. Their influence radius averages under 3 km, corresponding to the 15 min living circle range; beyond that, use declines. In some zones, underground areas and expressways slightly expand the effective radius but weaken impact strength. In Qunli, green spaces mainly serve residential needs, while in Songbei, greenery is tied to eco-tourism, leading to lower innovation utility due to mismatched functions.
- ④
- Space carrier characterization factors
MGWR results show that while the land use mix ratio has no significant influence on innovation density, the proportion of specific land types does. Residential land shows strong positive effects, notably in the central and eastern Historical Area. Conversely, negative impacts appear near the Li-min Pharmaceutical Core Zone and Jiangbei University Town. Administration land shows mixed effects, suppressing innovation in some areas but supporting it where vocational schools cluster. Harbin’s strict functional zoning limits mixed-use development, keeping mixed-use advantages theoretical. Innovation tends to concentrate in isolated plots, with weak association with adjacent land functions; thus, the land mix ratio variable remains insignificant. However, in the Historical Area, higher residential density supports embedded small and micro innovation firms through integrated communities. These zones also enable informal innovation venues such as shared offices and cafés, fostering cross-industry exchange. In contrast, new districts mainly feature enclosed residential blocks lacking commercial or industrial functions, producing a “sleeping city effect” where innovation firms relocate due to inadequate support services. Administration land, due to its own complex land type, positively contributes in Pingfang District, where vocational schools cluster near aviation and auto industries. Specialized education and surrounding research land cultivate technical talent, promoting workshop-level innovation. Yet, some administrative centers and large hospitals, though occupying prime locations, have limited service radii and constrain space for innovation carriers, generating localized negative impacts.
4. Discussion
4.1. Exploration of the Mechanism of Influencing Factors
The formation of urban innovation space displays significant regional heterogeneity. While commonly influenced by transportation networks and knowledge spillover, it is also closely tied to local industrial bases, policy direction, and spatial carrier attributes. This study builds an influencing factor system based on empirical analysis in Harbin, examining innovation entities, infrastructure, public services, population and market, and spatial carriers. However, insights from a single city cannot fully explain the complexity of innovation space evolution across China. Thus, this paper draws comparative references from cities such as Nanjing and Shenzhen and systematically compares shared influencing factors.
Multicity research consistently confirms transportation networks as critical to innovation space. In Harbin, proximity to metro stations has a strong positive impact on innovation density, while the road buffer zone shows limited coverage. The metro effect is concentrated at the intersection of Line 1 and Line 2 in mature commercial districts; peripheral stations lack influence due to single-function settings. In Nanjing, bus stop density and proximity to main roads significantly drive innovation clustering, demonstrating balanced support through its “multi-center + axial belt” structure [36]. In Shenzhen, the effect of public transport and transport hubs intensifies alongside industrial upgrading, overtaking manufacturing after 2015, reflecting a transition from logistics to talent commuting [52]. Transport accessibility reduces flow costs, enabling knowledge spillover and resource integration, forming fundamental conditions for innovation space. However, its efficacy depends on station density and the surrounding industry mix. Harbin’s sparse network and fragmented functions limit this effect, while Nanjing and Shenzhen realize citywide support through dense infrastructure and integrated transport–industrial development.
The livability factor has gained importance in multi-scale studies. In Harbin, innovation space density increases near large shopping centers, though some areas show a “reduced shopping center dependence” model. Nanjing identifies convenience store density and consumption space as top drivers, suggesting that third spaces foster informal interaction and innovation [36]. Later studies in Shenzhen reveal that medical and sports facilities play a growing role, particularly among younger talent, reflecting rising demands for health and work–life balance [52]. This indicates that innovation spaces must balance basic services with higher-order livability to attract skilled professionals. Harbin’s facilities are improving but lack sufficient coverage. Nanjing achieves widespread access through convenience services, while Shenzhen focuses on meeting generational quality demands.
The proximity of universities and research institutes has varying impacts. In Harbin, innovation density declines with distance from universities, indicating strong spatial relevance. In Nanjing, the effect of university proximity is only moderately significant, with that of proximity to research institutions even less so [36]. In Shenzhen, the number of such institutions strongly correlates with innovation output [52]. These disparities may arise from differences in institutional openness. Harbin benefits from university–enterprise collaborations that harness proximity advantages. In contrast, Nanjing’s institutional systems may limit knowledge spillover. Shenzhen excels through seamless integration of campuses and industrial parks, with numerous joint laboratories converting spatial proximity into innovation outcomes.
Ecological factors have a “double-edged sword” effect. In Harbin, park proximity shows mixed effects across regions. Natural landscapes in Nanjing hinder innovation clustering [36], while in Shenzhen, they promote it [52]. In Harbin’s dense historical areas, parks enhance innovation by supporting the 15 min living circle. In contrast, green spaces in newer zones serve mainly residential or tourism functions, causing resource mismatches and limiting innovation. Nanjing’s ecological zones, located at urban fringes and lacking supportive facilities, isolate innovation enterprises. Shenzhen, as a park city, embeds ecological elements into the dense urban fabric, merging industrial and ecological functions, underscoring how development stages affect the transformation of ecological value.
4.2. Planning Implications Based on Analysis Results
The Historical Area exhibits a dual challenge: the need to redevelop traditional industrial zones and the presence of innovation valleys, where technology transfer chains are long and infrastructure is underdeveloped. Enhancing the innovation capacity in these areas requires the renovation of old factories and the establishment of pilot test bases. Meanwhile, the ongoing role of research-oriented universities in fostering the aggregation and development of innovation activities should be fully leveraged. Considering differences among university types, targeted support should be provided in areas such as tax incentives, research funding, and intellectual property protection.
To address the spatial heterogeneity of the influence of universities and research institutions in New Town Area, an integrated University–Incubator–Industrial Park platform should be established, building on the existing concentration of financial institutions and infrastructure in the Songbei Ice City Science and Technology Corridor. This platform can facilitate the transfer of laboratory outcomes to enterprise R&D. Furthermore, government-guided funds should support characteristic industries such as biomedicine and artificial intelligence. By injecting capital, these measures can drive industrial development and technological innovation, creating an efficient innovation ecosystem primarily fueled by incremental growth.
In the Industrialized Park Area, with low innovation activity density and a greater distance from universities, where enterprises’ independent innovation capabilities are relatively weak—such as the South New Industrial Area—it is essential to strengthen linkages between enterprise-led innovation and external research resources to offset geographic disadvantages. In innovation valleys with unclear functions and lagging infrastructure, such as the Yingbin Road Concentration Zone, a mix of policy instruments—including tax rebates, technology loans, rental subsidies, and talent incentives—can reduce the start-up and operational costs of small- and medium-sized technology enterprises, thereby promoting the agglomeration and development of innovative actors.
5. Conclusions
By applying methods such as KDE, ESDA, and DBSCAN to analyze the spatiotemporal evolution patterns of innovation activities in Harbin using 46,057 patent application data, and constructing a multidimensional influencing factor system through the MGWR model, this study found the following:
The spatial distribution of innovation space in Harbin shows a “one core, four clusters” structure, with the core area of high innovation density located around the Dazhi Street in Nangang District, where Harbin Institute of Technology and Harbin Engineering University are located. The “four clusters” mainly include industrial park carriers such as the Limin Pharmaceutical Core Zone in Hulan District, the Science and Technology Innovation City of Songbei District, the Yingbin Road Concentration Zone, and the Harbin Economic and Technological Development Zone (HETDZ), which exhibit relatively low-density distribution characteristics. Harbin’s innovation space is gradually evolving from a single-center agglomeration to a multi-center cluster model, with industrial park clusters such as the HETDZ forming new innovation growth poles, showing a growth trend that expands from the center to the periphery. Key universities and high-tech enterprises have become the main bodies of innovation activities. The spatial distribution of innovation subjects has gradually expanded from the concentration of key universities in the Historical Area to new innovative spaces in peripheral areas such as the Industrialized Park Area and New Town Area.
The spatial pattern of innovation in Harbin appears to be associated with a nonlinear interaction among innovation entities, infrastructure, public services, and spatial carriers, with significant spatial heterogeneity in the intensity and direction of these factors. Among the innovation subjects, the proximity of internet technology enterprises and universities/research institutes to innovation density shows a polarization effect due to differences in regional industrial foundations and policy orientation. In terms of infrastructure, metro stations and major roads play a global supporting role by reducing element flow costs, but their effects in peripheral areas are weak due to the maturity of supporting facilities. In terms of public service facilities, sports and cultural facilities stimulate innovation vitality through social networks and scenario integration, while factors such as shopping centers and park squares have a bidirectional effect in different regions due to functional mismatches. Compared with cities like Wuhan, Nanjing, and Shenzhen, it was found that transportation networks, convenience of life, and proximity to universities are common driving factors. However, Harbin is still limited by road network density, functional fragmentation, and insufficient industry–academia–research collaboration, and therefore needs to optimize spatial carriers and apply precise policy regulation to improve the efficiency of innovation factor integration.
Urban innovation space is a powerful driving force and efficient engine for urban development. Its pattern is no longer a single structure, but rather a complex structure with highly concentrated and uneven distribution. Analyzing the evolution of the spatial pattern of innovation space and its influencing factors in Harbin, summarizing the development law of innovation activities in time and space, and establishing a system of influencing factors allow for the discovery of potential growth spaces and a clearer understanding of the generation and development mechanisms of innovation space, and provide a reference for the future development of urban innovation space.
This study uses patent application data as a representative of innovation activities, which has certain limitations. The construction of the influencing factor indicator system is mostly based on POI data and land use classification data. Further analysis will require supplementation with global policies and other richer variable data. In addition, when implementing the influencing factors of innovation space in spatial scales, the research range is divided into grid scales. Although existing research has confirmed that a 1 km × 1 km scale is optimal, there is still a boundary uncertainty that affects the accuracy of research results. Therefore, this paper only provides an initial analysis of innovation activity space in Harbin, and future research needs to further refine the data representing urban innovation activities and improve related studies.
Author Contributions
Conceptualization: J.W. and D.X.; methodology: J.W. and D.X.; software: J.W. and R.Z.; formal analysis: J.W. and R.Z.; resources: J.W.; data curation: J.W. and R.Z.; writing—original draft preparation: J.W. and D.X.; writing—review and editing: J.W. and D.X.; visualization: J.W.; supervision: D.X.; project administration: D.X.; funding acquisition: J.W. and D.X. All authors have read and agreed to the published version of the manuscript.
Funding
This research was funded by “Specific subjects on the construction of Innovation and Entrepreneurship Ecosphere around the university, compound and institute in Harbin (Grant No. 2022STQZXKT01)” and the HeiLongJiang Association of Higher Education, “Research on the construction path of Innovation and Entrepreneurship Ecosphere around the university, compound and institute in Heilongjiang province (Grant No. 23GJZD001)”.
Data Availability Statement
The original data presented in the study are openly available at https://www.patsnap.com/.
Conflicts of Interest
The authors declare no conflicts of interest.
Abbreviations
The following abbreviations are used in this manuscript:
| HETDZ | Harbin Economic and Technological Development Zone |
| HIT | Harbin Institute of Technology |
| HEU | Harbin Engineering University |
| KDE | Kernel Density Estimation |
| ESDA | Exploratory Spatial Data Analysis |
| DBSCAN | Density-Based Spatial Clustering of Applications with Noise |
References
- Zou, Z.; Zhou, R.; Jiao, K.; Yang, H.; Wu, T.; Hu, C. Economic Downturn and Climate Change: Mapping Spatial Heterogeneity of Socio-Economic Vulnerability for a Complex Future Scenario. Int. J. Disaster Risk Reduct. 2025, 130, 105875. [Google Scholar] [CrossRef]
- Li, L.; Zhang, X.; Luo, Y. Esearch on the Evolution Characteristics of Innovation Space from an Output Perspective: A Case Study of Shanghai. Urban Dev. Stud. 2019, 26, 87–92+33. [Google Scholar]
- Kerr, W.R.; Robert-Nicoud, F. Tech Clusters. J. Econ. Perspect. 2020, 34, 50–76. [Google Scholar] [CrossRef]
- Kerr, W.R.; Kominers, S.D. Agglomerative Forces and Cluster Shapes. Rev. Econ. Stat. 2015, 97, 877–899. [Google Scholar] [CrossRef]
- Audretsch, D.B.; Feldman, M.P. R&D Spillovers and the Geography of Innovation and Production. Am. Econ. Rev. 1996, 86, 630–640. [Google Scholar]
- Fischer, M.M.; Nijkamp, P. Handbook of Regional Science; SpringerLink: Berlin, Germany, 2021. [Google Scholar]
- Ciccone, A.; Hall, R. Productivity and the Density of Economic Activity; National Bureau of Economic Research: Cambridge, MA, USA, 1993; p. w4313. [Google Scholar]
- Buzard, K.; Carlino, G.A.; Hunt, R.M.; Carr, J.K.; Smith, T.E. Localized Knowledge Spillovers: Evidence from the Spatial Clustering of R&D Labs and Patent Citations. Reg. Sci. Urban Econ. 2020, 81, 103490. [Google Scholar] [CrossRef]
- Moreno, R.; Paci, R.; Usai, S. Geographical and Sectoral Clusters of Innovation in Europe. Ann. Reg. Sci. 2005, 39, 715–739. [Google Scholar] [CrossRef]
- Lim, U. The Spatial Distribution of Innovative Activity in U.S. Metropolitan Areas: Evidence from Patent Data. J. Reg. Anal. 2003, 33, 97–98. [Google Scholar] [CrossRef]
- Fornahl, D.; Brenner, T. Geographic Concentration of Innovative Activities in Germany. Struct. Change Econ. Dyn. 2009, 20, 163–182. [Google Scholar] [CrossRef]
- Figueiredo, O.; Guimarães, P.; Woodward, D. Industry Localization, Distance Decay, and Knowledge Spillovers: Following the Patent Paper Trail. J. Urban Econ. 2015, 89, 21–31. [Google Scholar] [CrossRef]
- Jaffe, A.B.; Trajtenberg, M.; Henderson, R. Geographic Localization of Knowledge Spillovers as Evidenced by Patent Citations. Q. J. Econ. 1993, 108, 577–598. [Google Scholar] [CrossRef]
- Rosenthal, S.S.; Strange, W.C. Geography, Industrial Organization, and Agglomeration. Rev. Econ. Stat. 2003, 85, 377–393. [Google Scholar] [CrossRef]
- Balland, P.-A.; Boschma, R.; Frenken, K. Proximity and Innovation: From Statics to Dynamics. Reg. Stud. 2015, 49, 907–920. [Google Scholar] [CrossRef]
- Carlino, G.; Kerr, W.R. Chapter 6—Agglomeration and Innovation. In Handbook of Regional and Urban Economics; Duranton, G., Henderson, J.V., Strange, W.C., Eds.; Elsevier: Amsterdam, The Netherlands, 2015; Volume 5, pp. 349–404. [Google Scholar]
- Audretsch, D.B. Agglomeration and the Location of Innovative Activity. Oxf. Rev. Econ. Policy 1998, 14, 18–29. [Google Scholar] [CrossRef]
- Glaeser, E.L. Learning in Cities. J. Urban Econ. 1999, 46, 254–277. [Google Scholar] [CrossRef]
- Teece, D.J. Towards an Economic Theory of the Multiproduct Firm. J. Econ. Behav. Organ. 1982, 3, 39–63. [Google Scholar] [CrossRef]
- Bagella, M.; Becchetti, L. The “Geographical Agglomeration-Private R&D Expenditure” Effect: Empirical Evidence on Italian Data. Econ. Innov. New Technol. 2002, 11, 233–247. [Google Scholar] [CrossRef]
- Love, J.H.; Roper, S. Location and Network Effects on Innovation Success: Evidence for UK, German and Irish Manufacturing Plants. Res. Policy 2001, 30, 643–661. [Google Scholar] [CrossRef]
- Berliant, M.; Reed, R.R.; Wang, P. Knowledge Exchange, Matching, and Agglomeration. J. Urban Econ. 2006, 60, 69–95. [Google Scholar] [CrossRef]
- Fallick, B.; Fleischman, C.A.; Rebitzer, J.B. Job-Hopping in Silicon Valley: Some Evidence Concerning the Microfoundations of a High-Technology Cluster. Rev. Econ. Stat. 2006, 88, 472–481. [Google Scholar] [CrossRef]
- Tan, J. Growth of Industry Clusters and Innovation: Lessons from Beijing Zhongguancun Science Park. J. Bus. Ventur. 2006, 21, 827–850. [Google Scholar] [CrossRef]
- Porter, M.E. Harvard Business Review; Harvard Business Publishing: Brighton, MA, USA, 1998. [Google Scholar]
- Boschma, R.; Eriksson, R.H.; Lindgren, U. Labour Market Externalities and Regional Growth in Sweden: The Importance of Labour Mobility between Skill-Related Industries. Reg. Stud. 2014, 48, 1669–1690. [Google Scholar] [CrossRef]
- Duan, J.; Zhu, L. Analysis of Creative Industry Parks’ Spatial Evolution, Its Agglomeration Characteristics and Influence Factors: A Case Study of Shenzhen. Mod. Urban Res. 2015, 76–82. [Google Scholar]
- Meng, G.; Lyu, L.; Huang, R. The Characteristics of Location Selection and Influencing Factors of “Maker-Space” in Beijing. J. Cap. Univ. Econ. Bus. 2016, 18, 89–97. [Google Scholar]
- Luan, F.; He, Y.; Zhang, Y. Spatial Characteristics of Cultural and Creative Industry Agglomerations and the Planning Guidance: Analysis Based on Enterprise Location in the Shanghai Central City. Urban Plan. Forum 2019, 40–49. [Google Scholar]
- Duan, D.; Du, D.; Liu, C. Spatio-Temporal Evolution of Urban Innovation Structure Based on Zip Code Geodatabase: An Empirical Study from Shanghai and Beijing. ACTA Geogr. Sin. 2015, 70, 1911–1925. [Google Scholar] [CrossRef]
- Wang, J.; Sun, Y.; Lin, N. Spatial-Temporal Evolution Characteristics and Countermeasures of Urban Innovation Activities Distribution Pattern: A Case Study of Hangzhou. Urban Dev. Stud. 2020, 27, 12–18+29. [Google Scholar]
- Esmaeilpoorarabi, N.; Yigitcanlar, T.; Guaralda, M. Place Quality in Innovation Clusters: An Empirical Analysis of Global Best Practices from Singapore, Helsinki, New York, and Sydney. Cities 2018, 74, 156–168. [Google Scholar] [CrossRef]
- Esmaeilpoorarabi, N.; Yigitcanlar, T.; Guaralda, M.; Kamruzzaman, M. Does Place Quality Matter for Innovation Districts? Determining the Essential Place Characteristics from Brisbane’s Knowledge Precincts. Land Use Policy 2018, 79, 734–747. [Google Scholar] [CrossRef]
- Esmaeilpoorarabi, N.; Yigitcanlar, T.; Guaralda, M.; Kamruzzaman, M. Evaluating Place Quality in Innovation Districts: A Delphic Hierarchy Process Approach. Land Use Policy 2018, 76, 471–486. [Google Scholar] [CrossRef]
- Yang, C.; Yang, H.; Han, H.; Yang, G. Spatial Distribution Pattern and Influencing Factors of Innovation Andknowledge-Intensive Services Based on POl Data: A Case Study of Hefei, China. Geogr. Res. 2023, 42, 682–698. [Google Scholar]
- Guan, M.; Sun, S. Agglomeration Characteristics and Influencing Factors of Urban Innovation Space: A Case Study of Nanjing Main City. City Plan. Rev. 2023, 47, 21–31. [Google Scholar]
- Zhou, R.; Qiu, Y.; Hu, Y. Characteristics, Evolution and Mechanism of Inter-City Innovation Network in China: From a Perspective of Multi-Dimensional Proximity. Econ. Geogr. 2021, 41, 1–10. [Google Scholar]
- Sun, Y.; Fan, J.; Liu, H.; Zhao, T. Spatial and Temporal Pattern of Digital Technology Innovation and Its Influencing Factors in the Yangtze River Delta. Econ. Geogr. 2022, 42, 124–133. [Google Scholar]
- Wu, K.; Ye, Y.; Zhang, H.; He, Z.; Wang, X.; Zheng, Z. The Geographical Pattern and Diversity of Strategic Industry Technological Innovation in the Guangdong-Hong Kong-Macao Greater Bay Area. Trop. Geogr. 2022, 42, 183–194. [Google Scholar]
- Huang, L.; Huang, J.; Xu, J. Research on the Spatial Evolution and Trend of R&D Innovation in Shanghai from the Perspective of Patent Analysis. Urban Rural Plan. 2020, 4, 70–79. [Google Scholar]
- Ciccone, A. Agglomeration Effects in Europe. Eur. Econ. Rev. 2002, 46, 213–227. [Google Scholar] [CrossRef]
- Yang, X.; Ren, S.; Jin, H. Spatial Differentiation and Spillover Effect of Urban Innovation Space in China: Based on the Panel Data of 287 Prefecture-Level Cities. Econ. Geogr. 2023, 43, 52–61. [Google Scholar]
- Lyu, L.; Zhao, C. Review and Prospect of the Urban Innovation Geography of China. Econ. Geogr. 2021, 41, 16–27. [Google Scholar]
- Sun, Y.; Li, G.; Yuan, W.; Sun, T. The Spatial Concentration of Innovation and Its Mechanisms: A Literature Review and Prospect. Hum. Geogr. 2017, 32, 17–24. [Google Scholar]
- Zhang, X.; Du, L.; Song, X. Identification of Urban Renewal Potential Areas and Analysis of Influential Factors from the Perspective of Vitality Enhancement: A Case Study of Harbin City’s Core Area. Land 2024, 13, 1934. [Google Scholar] [CrossRef]
- Ning, J.; Ma, H.; Sun, Y.; Wang, N.; Wang, M. Research on the Characteristic Identification and Multidimensional Dynamic Evolution of Urban–Rural Fringe in Harbin, China. Land 2025, 14, 359. [Google Scholar] [CrossRef]
- Wang, Y.; Han, Y.; Pu, L.; Jiang, B.; Yuan, S.; Xu, Y. A Novel Model for Detecting Urban Fringe and Its Expanding Patterns: An Application in Harbin City, China. Land 2021, 10, 876. [Google Scholar] [CrossRef]
- Zou, Z.; Zhou, R.; Jiao, K.; Guo, C. Assessment of Socio-Economic Vulnerability to Disaster Risks in Shrinking Cities of Northeast China: A Case Study of Harbin. Trans. Urban Data Sci. Technol. 2025, 4, 157–176. [Google Scholar] [CrossRef]
- Tang, K.; Zhai, G.; He, Z.; Gu, F. The Study on the Spatio-Temporal Distribution Patterns andEvolution Mechanism of Makerspaces in Nanjing. Mod. Urban Res. 2019, 52–59. [Google Scholar]
- Li, Y.; Zhong, J.; Zeng, X. Comparative Analysis of Factors Affecting the Location of Maker Space: A Case Study on Fuzhou and Shenzhen. South Archit. 2020, 49–55. [Google Scholar]
- Liu, J.; Zhen, F.; Zhang, S.; Kong, Y.; Li, Z. Spatial Distribution Characteristics and Influencing Factors of New-Generation Information Technology Companies: A Case of Nanjing Central City. Econ. Geogr. 2022, 42, 114–123+211. [Google Scholar]
- Wang, B.; Xie, J.; Wang, L. Evolution of Urban Innovation Space and Influencing of Innovation Environment Elements on Innovation Outputs: Evidence from Shenzhen. Econ. Geogr. 2024, 44, 84–90. [Google Scholar]
- Zhang, Y.; Liu, J.; Zhou, L.; Wang, Y.; Li, P. Cluster Identification and Spatial Characteristics Analysis of Shunfeng Express Service Facilities Based on the DBSCAN Algorithm in Beijing. J. Geo-Inf. Sci. 2020, 22, 1630–1641. [Google Scholar]
- Shen, L.; Zhang, C.; Li, H.; Wang, Y. Interaction between Commuting Modes and Job-Housing Imbalance in Metropolis: An Empirical Study by Bayesian-Tobit Analysis in Beijing. Prog. Geogr. 2018, 37, 1277–1290. [Google Scholar]
- Wang, R. How Do Patent Subsidies Drive SMEs to Patent? Evidence from China. J. Dev. Eff. 2024, 16, 408–427. [Google Scholar] [CrossRef]
Disclaimer/Publisher’s Note: The statements, opinions and data contained in all publications are solely those of the individual author(s) and contributor(s) and not of MDPI and/or the editor(s). MDPI and/or the editor(s) disclaim responsibility for any injury to people or property resulting from any ideas, methods, instructions or products referred to in the content. |
© 2025 by the authors. Licensee MDPI, Basel, Switzerland. This article is an open access article distributed under the terms and conditions of the Creative Commons Attribution (CC BY) license (https://creativecommons.org/licenses/by/4.0/).