Abstract
As the spatial carrier of urban development, construction land is a fundamental element for achieving high-quality urban development (HQUD). This study examines the impact of construction land supply on HQUD across 285 Chinese cities. A HQUD evaluation model is created to assess each city’s development level. The GTWR model is then applied to explore the dynamic spatial effects of land supply on HQUD level. The results show the following: (1) The construction land supply exhibited a fluctuating trend accompanied by notable spatial disparities, with hotspots concentrated in coastal areas and cold spots in the northwest and northeast. (2) The HQUD levels consistently increased, forming a stepwise spatial pattern—highest in the east, followed by central and western regions—with localized spatial convergence. (3) The factors influencing HQUD are highly volatile. Industrial agglomeration, resource optimization, and land investment returns drive commercial land supply, investment intensity, and land prices, fostering positive development. However, excessive population density and inadequate public service land may impose pressure on resources and strained public services, hindering progress. Industrial land supply has supported industrial upgrading, shifting its impact from negative to positive. Over-reliance on real estate development can cause resource waste, social instability, and hinder sustainability, reversing the positive effects of residential land supply. This paper clarifies the complex relationship between construction land supply and HQUD, providing empirical guidance for region-specific land supply strategies.
1. Introduction
With global urbanization advancing rapidly, over half of the world’s population resided in urban areas by 2018, a figure projected to reach 68% by 2050 [1]. Industrialization and urbanization, as the driving forces of modern civilization, have significantly accelerated global economic progress and social transformation [2]. However, they have also triggered severe negative consequences [3]. The surge in greenhouse gas emissions has intensified global warming, leading to more frequent extreme weather events, sea-level rise, and other environmental crises [4]. Concurrently, air, water, and soil pollution threaten ecosystem stability and human health, while the over-exploitation of resources accelerates the depletion of natural assets [5]. As urbanization progresses, massive population influxes into cities have led to rapid urban expansion, placing immense pressure on infrastructure and public services. Consequently, issues such as urban congestion, housing shortages, and transportation strain have become increasingly prominent [6]. Moreover, the rapid population growth and concentration have exacerbated resource shortages, lowered living standards, widened income inequality, and intensified social disparities [7]. Furthermore, urbanization has accelerated uncontrolled urban expansion, leading to inefficient land use, reduction in arable land, and ecosystem degradation [8,9]. Collectively, these issues underscore the unsustainability of traditional development models, highlighting the urgent need for a more balanced, inclusive, and sustainable development path.
To address these unsustainable development challenges, the United Nations adopted the 17 Sustainable Development Goals (SDGs) in 2015 as a global framework for action. In response, the European Union launched a comprehensive circular economy plan and announced the “European Green Deal” by late 2019, aiming to achieve carbon neutrality by 2050 and establish a competitive modern economy decoupled from resource consumption [5]. In 2006, the United States developed the “U.S. 2050 Strategy,” providing a guiding framework for integrated investment in mobility, environmental protection, and economic development [10]. In October 2017, China articulated a strategic vision for high-quality development, which was subsequently established as a national priority aimed at promoting sustainable development and closely aligning with the global SDGs [11,12]. Currently, China’s economy has transitioned from high-speed growth to a stage focused on high-quality development. This shift emphasizes that development should not come at the expense of excessive resource consumption or environmental sacrifice. High-quality development requires innovation to be the primary driver, coordination to be an intrinsic feature, sustainability to be a universal form, openness to be a necessary path, and shared prosperity to be the ultimate goal [13]. Within the framework of high-quality development, it becomes increasingly urgent to scientifically and rationally allocate production factors such as land, population, and capital.
Land resources, as a fundamental element of urban development, play a pivotal role in determining the quality and sustainability of urban growth [14]. Among these, construction land, serving as a core spatial resource and key production factor, is closely linked to urban development in multiple dimensions. From a spatial perspective, the scale and structure of construction land determine the efficiency of spatial allocation of factors such as population, labor, and capital. From an economic growth standpoint, the supply of construction land serves as a crucial engine driving the urbanization process [15,16]. However, in practice, some local governments, driven by the pursuit of short-term economic growth, have excessively expanded land supply, resulting in low utilization efficiency and diminishing marginal returns, which fails to meet the structural demands of high-quality urban development [17]. Construction land supply, as a central mechanism for urban spatial restructuring and functional optimization, plays a significant role in promoting industrial upgrading, fostering urban–rural coordination, improving environmental quality, and optimizing the allocation of factor markets [18]. Therefore, exploring the differentiated characteristics of regional construction land supply and its heterogeneous impacts on high-quality urban development (HQUD) is crucial for developing an efficient and orderly land resource allocation mechanism, and holds substantial theoretical and practical significance for advancing high-quality urban development.
Extensive research has been conducted on HQUD, construction land supply, and their interrelationships, employing diverse methodologies and scales. While HQUD lacks a universally accepted definition, it generally emphasizes the quality of economic development and urban sustainability [19]. Scholars measure HQUD using indicators of economic growth, innovation, and sustainability, as evidenced by studies like Rodrigues’ [20] analysis of 308 Portuguese cities, which underscores the need for enhanced sustainability actions. The determinants of HQUD are examined across economic, ecological, and social dimensions [21]. For instance, Yuan Xiaoling [22] directly incorporated the five development principles as criteria layers in an HQUD evaluation framework, applying the entropy weight method to analyze the spatiotemporal differentiation and evolution of 284 Chinese cities, along with their driving factors. Construction land, as a fundamental resource and critical production factor, is intrinsically linked to urban development. As such, scholars have extensively explored its relationship with urban factors [23], urbanization [24], and economic growth [25]. Construction land supply is closely associated with urban factors such as population [26], capital [27], housing prices [28], industrial structure [29], and the environment [30]. In urbanization studies, both traditional and spatial econometric methods are employed to assess the impacts of construction land supply [31]. Regarding economic growth, construction land supply is regarded as both a driver of growth [32] and a potential constraint [33], reflecting its complex role in the urban development process. However, existing studies exhibit several notable limitations, which can be summarized as follows: (1) Current research pays limited attention to the quality of construction land supply, with large-scale, long-term studies being notably scarce. (2) Owing to variations in research domains and perspectives, there is a lack of consensus on the concept of high-quality urban development, and a unified research framework has yet to be established. (3) Most existing studies focus on the relationship between construction land supply and individual urban factors (e.g., population, capital, environment) or one-dimensional aspects (e.g., urbanization, economic growth). Research exploring the multi-dimensional impacts of construction land supply on urban development remains relatively under explored.
Therefore, this paper focuses on the supply-side dynamics of construction land, utilizing long-term time series data and focusing on Chinese prefecture-level cities as the research unit. This study aims to investigate the spatiotemporal heterogeneity mechanisms through which construction land supply influences HQUD. The core focus lies in examining how the scale, structure, and quality of construction land supply shape the dynamics of HQUD. Based on theoretical reasoning and empirical observation, three hypotheses are proposed. First, the scale of construction land supply may exert varying impacts on HQUD across different stages of growth. In the early or moderate stages, expansion in supply scale tends to play a positive and driving role in promoting urban development. However, excessive expansion can undermine sustainability by imposing pressure on resources and the environment. Second, the structural bias in construction land supply may generate dual and opposing effects. On the one hand, by concentrating resources to support specific sectors or functions, biased supply can enhance development quality and stimulate urban transformation. On the other hand, it may lead to imbalances in land use structure, which hinder systemic coordination and sustainable growth, thereby producing negative externalities. Finally, the impact of construction land supply on HQUD exhibits non-stationary characteristics across different stages of urbanization and demonstrates spatial heterogeneity in terms of the direction and intensity of its effects among cities in different regions. Based on these assumptions, this study employs the spatiotemporal geographically weighted regression (GTWR) model to explore the spatiotemporal heterogeneous impact of construction land supply on HQUD from three dimensions: supply scale, structure, and quality. By clarifying the mechanisms through which construction land supply influences HQUD, the study proposes strategies for urban construction land supply that align with China’s current development stage and objectives.
The structure of this paper is as follows: Section 2 presents the research data and methodology, including the classification of construction land, the evaluation index system for high-quality urban development, spatial pattern analysis methods, and the GTWR model. Section 3 examines the long-term characteristics of construction land supply in Chinese prefecture-level cities, analyzing the results of high-quality urban development from both temporal and spatial perspectives. This section also presents the estimation results from the GTWR model, exploring the spatiotemporal heterogeneity in the impact of construction land supply on high-quality urban development. Section 4 discusses the mechanisms through which construction land supply influences high-quality urban development, offering recommendations on how construction land supply can facilitate such development. Additionally, the limitations of the study are highlighted. Section 5 concludes with a summary of the main findings.
2. Data and Methods
2.1. Classification of Construction Land
Classifying land based on its intended use is a crucial foundational element in land management. This paper is based on the 2017 version of the current “Classification of Land Use Status” standard and the corresponding classifications in the Land Administration Law to define the scope of construction land. Due to evolving land use classification standards, inconsistencies have arisen in the substantive definitions of certain land use categories. To align the classification system with the analytical framework of this study, methodological adjustments were implemented. Specifically, land supply data from the China Land Market website were reclassified into five primary categories: industrial and warehouse land (hereafter referred to as industrial land, excluding mining sites and salt fields, which were reclassified as other construction land), commercial and service land, residential land, public management and service land (hereafter referred to as public service land), and transportation land. Land use types not included in these categories, such as water bodies, hydraulic facilities, and special-use land, were aggregated under “other construction land.” This study focuses on examining how the supply of industrial land, commercial and service land, residential land, and public service land impacts HQUD.
2.2. Evaluation Index System for HQUD
The core concept of HQUD lies in implementing the New Development Philosophy, achieving synergistic progress across five key dimensions: innovation, coordination, green development, openness, and shared prosperity. Essentially, it requires deep integration and multidimensional coordination among these five aspects [34,35,36]. Guided by principles of innovation, comprehensiveness, and practicality, this study constructs an evaluation framework for HQUD applicable to cities at the prefectural-level and above across China. The framework consists of 5 dimensions, 13 sub-dimensions and 37 indicators, with detailed descriptions provided in Table 1.

Table 1.
System of indicators for evaluating the level of high-quality urban development.
2.2.1. Indicator Selection
Innovation is the fundamental driving force behind urban development. Zhai et al. highlight the dynamic nature of the innovation process, describing it as a progression from inputs to outputs aimed at enhancing productivity [40]. Thus, from a comprehensive input–output cycle perspective, the level of innovation development can be evaluated across three critical dimensions: innovation input, innovation efficiency, and innovation output. Innovation input is evaluated using indicators spanning education, technology, and talent [41]. Innovation efficiency reflects urban innovation development by measuring capital and labor output efficiency [42]. Innovation output is measured by two indicators: the digital economy index and the number of patents granted per 10,000 people. The digital economy index captures the degree of digital development, encompassing dimensions such as the adoption of digital technologies, the advancement of digital infrastructure, and the scale and growth rate of digital industries. It is employed as a proxy variable for technological innovation output.
Coordinated development emphasizes balance across regional, industrial, and financial systems, constituting an essential mechanism for alleviating structural imbalances and strengthening urban resilience. The indicator system is organized into three sub-dimensions: Firstly, urban–rural coordination is measured through the proportion of primary industry value-added in GDP, the urban–rural income ratio, and the resident population urbanization rate, collectively reflecting the balance between urban and rural development. Secondly, financial coordination is assessed using the ratio of financial deposits and loans to GDP, the loan-to-deposit ratio, and fiscal pressure indicators, reflecting the stability of financial operations. Thirdly, industrial coordination is evaluated via indices of industrial structure rationalization and upgrading, which measure the extent of industrial optimization and advancement [39].
The core of green development lies in reducing resource consumption and environmental pollution caused by human activities, while simultaneously enhancing ecological quality [43]. The indicators for this dimension are divided into two categories. The first is environmental pressure, measured by the emission intensity of carbon dioxide, sulfur dioxide, wastewater, and soot, which reflects the environmental burden of economic growth. The second is environmental governance, assessed through per capita green space, annual average PM2.5 concentration, waste disposal rate, and wastewater treatment rate, capturing both ecological improvement and governance effectiveness.
Open development serves as an essential pathway to achieving high-quality development, as it stimulates innovation, drives industrial upgrading, and enhances the efficiency of resource allocation. The indicators selected for this dimension include the ratio of total imports and exports to GDP, which reflects the level of external economic connectivity; the share of foreign direct investment (FDI) in GDP and the proportion of foreign-invested enterprises, which capture the city’s capacity to attract external capital; and the marketization index, which measures the openness of the business environment and the strength of institutional support.
The concept of shared development emphasizes a people-oriented philosophy, reflects the well-being of residents, and represents the ultimate goal of HQUD [44]. It can be measured along two key dimensions: public resource sharing and welfare security. Public resources are assessed through library holdings, medical beds, and doctors per 10,000 people, as well as the pupil–teacher ratio in primary and secondary schools, which capture the adequacy and accessibility of basic educational and healthcare services. Welfare level is measured by employees’ average wage, per capita consumption expenditure, internet coverage, and participation rates in unemployment, pension, and medical insurance, reflecting residents’ income, consumption, social protection, and digital inclusiveness. Collectively, these indicators provide a systematic framework for evaluating the equity and inclusiveness of urban shared development.
2.2.2. Indicator Weighting and Comprehensive Evaluation
In this study, a composite weighting scheme was employed by integrating the entropy weight method with the expert scoring method. The entropy method provides an objective basis for weight determination by measuring the amount of information contained in each indicator, thereby reflecting its degree of variation and dispersion. In contrast, the expert scoring method captures the subjective judgment of indicator importance as evaluated by domain experts. Five experts were invited to rate each indicator on a predefined scale, and the mean scores were standardized to obtain the subjective weights. The final indicator weights for assessing high-quality urban development were derived by taking the arithmetic mean of the objective and subjective weights. Table 1 presents the final average weights.
To ensure comparability among indicators, all data were normalized using the min–max standardization method. The formula is expressed as follows:
This transformation ensures that larger standardized values consistently indicate better performance. After normalization, each indicator was multiplied by its corresponding weight, and the weighted values were aggregated to construct the comprehensive index of high-quality urban development.
2.3. Spatial Analysis
2.3.1. Hot Spot Analysis
Hot spot analysis (Getis-Ord Gi) is a widely used spatial data analysis method designed to identify geographic hotspots and coldspots, which are areas exhibiting significantly higher or lower values of a specific indicator compared to their surroundings [45]. In this study, hotspot analysis was applied to examine the spatial clustering patterns of construction land supply. The Z-scores derived from the analysis represent multiples of standard deviations, reflecting the degree of dispersion within the dataset. A hotspot cluster is defined as a region with high construction land supply surrounded by other high-supply areas, while a coldspot cluster refers to a low-supply area surrounded by similar regions. The methodology for hotspot analysis is described as follows:
In the formula, represents the attribute value of sample , denotes the spatial weight matrix between factors and , and is the sample size. The spatial weight matrix is defined using the inverse distance method. The statistic yields a z-score; if the z-score is positive and the p-value is significant, the area is identified as a hotspot. Conversely, if the z-score is negative and the p-value is significant, the area is identified as a coldspot. Hotspot analysis was performed by ArcGIS 10.8 (Esri, Redlands, CA, USA), and the relevant parameters have been selected from the tool’s default options.
2.3.2. Spatial Autocorrelation Analysis
Spatial autocorrelation measures the degree of spatial correlation in the distribution of study objects, detecting whether the observed values of a variable are independent of those at neighboring locations [46]. The urban data used in this study spans different geographical spaces, and spatial autocorrelation analysis tests whether the data distribution between cities exhibits autocorrelation characteristics. This analysis reveals the spatial distribution and underlying mechanisms of the data, influencing model selection and accuracy, making it a necessary preliminary step. The spatial autocorrelation statistics include both global spatial autocorrelation and local spatial autocorrelation, with their respective formulas as follows:
In these formulas, I represents the global Moran’s I index. If > 0, it indicates that the values near the observation point are similar to the value at the point itself, and the distribution of the elements exhibits a clustering trend. If < 0, it suggests that the values near the observation point are dissimilar to the value at the point, and the distribution of the elements exhibits a dispersive trend. If = 0, it indicates that the attributes of the elements are randomly distributed in space, with no spatial autocorrelation. The formula for the local Moran’s I index is denoted as . If > 0, this indicates that the feature is part of a cluster with neighboring features exhibiting similar high (or low) attribute values. Conversely, if < 0, it suggests that the feature is an outlier, with neighboring features exhibiting different attribute values. Here, represents the number of geographic units, and represent the attribute values of units and , respectively, represents the mean value of the attribute across all geographic units, and is the weight value between units and in the spatial weight matrix . The spatial autocorrelation analysis was conducted by ArcGIS 10.8, and the relevant parameters have been selected from the tool’s default options.
2.4. GTWR Model
The GTWR model is a local weighted regression method that simultaneously considers spatial heterogeneity and temporal non-stationarity, making it suitable for analyzing data with both spatial and temporal variations [47,48]. By incorporating time effects into the Geographically Weighted Regression (GWR) model, the GTWR model extends the traditional GWR framework, effectively addressing the spatiotemporal non-stationarity of the data and capturing both spatial and temporal heterogeneity. The GTWR model provides a regression coefficient for each sample at each time point, enabling the analysis of the spatiotemporal variability in the impact of explanatory variables on the dependent variable. Therefore, in this study, the GTWR model is employed to explore the spatiotemporal heterogeneous impact of construction land supply on HQUD. The basic formula of the GTWR model is as follows [47]:
In the formula, represents the level of HQUD for city, and () are the spatiotemporal coordinates of the city, where and are the projected longitude and latitude coordinates of the city’s centroid, and is the time variable.
is the intercept of the regression, and represents the regression coefficient of the explanatory variable. denotes the number of variables, and is the value of explanatory variable for city . represents the error term for city , which satisfies the basic assumptions of mean and variance.
2.4.1. Dependent Variable
The GTWR model is constructed to examine the effects of construction land supply—specifically its scale, structure, and quality—on the level of HQUD. Accordingly, the dependent variable is operationalized as the HQUD level (Y), measured based on the evaluation of the HQUD index system.
2.4.2. Explanatory and Control Variables
Through a systematic review of existing literature and consideration of the specific characteristics of the research units, nine core indicators were selected from three dimensions of construction land supply scale, structure, and quality as key variables influencing HQUD. Moreover, multi-scale analyses show that urban size and city classification directly affect construction land supply and, to some extent, reflect the level of high-quality urban development. Therefore, urban size and city classification are incorporated as control variables in the model. Ultimately, eleven indicators were identified as key factors influencing high-quality urban development. The specific selection of variables is presented in Table 2.
Table 2.
Definition and measurement of variables.
2.5. Data Sources
This study focuses on Chinese cities, using data from 285 prefecture-level and above cities over a 12-year period from 2009 to 2020. The data are categorized into three main categories (Table 3): (1) Construction Land Supply Data: These data were obtained from the China Land Market website, a dataset widely cited in urban land use studies [54]. It provides detailed records of land transactions for each city, including parcel location, administrative region, area, land-use type, industry classification, transaction price, and contract date, offering a comprehensive overview of land market outcomes. The dataset spans 1 January 2009, to 31 December 2020, covering approximately 2.006 million records from 285 cities. (2) Land Use Survey Data: The national land use survey provides statistics on land use across provinces, cities, and counties and is primarily used to calculate urban and rural construction land areas. The dataset includes data from the second and third national land surveys, as well as subsequent updates. Data for 2017 and 2018 were unavailable and were therefore estimated using linear interpolation based on values from adjacent years. (3) Socioeconomic Data: Socioeconomic data are primarily used to evaluate the level of high-quality urban development. They encompass over thirty indicators, such as regional GDP, fixed asset investment, urban and rural residents’ income, and investment in science, technology, and education. Where necessary, information was supplemented with provincial and municipal statistical yearbooks or official reports, and any remaining missing values were interpolated. Notably, all monetary indicators were deflated to constant 2015 prices using either the GDP deflator or the Consumer Price Index (CPI), depending on the nature of each variable. The missing values in the dataset are obtained through linear interpolation.
Table 3.
Data Sources.
3. Results
3.1. Construct Land Supply from 2009 to 2020
3.1.1. Overall Characteristics
Figure 1a illustrates the total scale of construction land supply across 285 cities in China. Between 2009 and 2013, the supply of construction land experienced a sharp increase, with a slight downturn in 2012. In 2013, a dual-peak phenomenon emerged, with both the number of land plots and the total area of construction land reaching their highest points. This trend was primarily driven by the Chinese government’s 4 trillion RMB economic stimulus plan, which was introduced in response to the 2008 financial crisis. The policy led to relatively relaxed land supply regulations, resulting in a substantial influx of capital into the real estate and land markets, thereby driving up land transaction volumes and prices. Starting in 2014, the macroeconomic environment entered a relatively sluggish phase, which had a noticeable impact on the land market. Additionally, the supply of land for infrastructure projects began to decline. By 2016, the supply had reached its lowest point, after which it began to recover. Following a period of rapid growth, land supply stabilized at a high level, with fluctuations remaining steady between 2018 and 2020. Overall, the trends in both the number of land plots and the total area of construction land supply follow a similar pattern of fluctuation, characterized by an initial phase of growth, followed by a decline, a subsequent growth phase, and then another period of decrease.
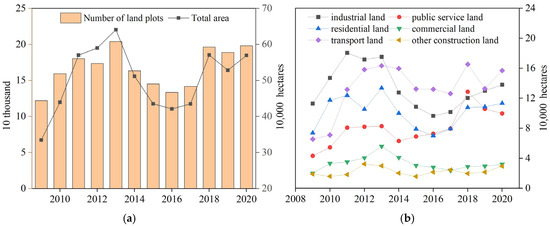
Figure 1.
Dynamics of construction land supply (2009–2020). (a) Total supply area and number of land transactions, (b) composition by land subtype.
Figure 1b depicts the evolution of construction land supply from 2009 to 2020. Industrial land expanded rapidly until peaking in 2014, declined thereafter, and rebounded during 2017–2020, reflecting both infrastructure-driven industrialization and subsequent supply-side reforms. Public service land grew sharply from 2009 to 2011, slowed until 2014, and resumed moderate growth after 2015, driven by urbanization-related demand for education and healthcare. Residential land maintained steady growth, accelerating after 2013 and peaking in 2020 in response to population agglomeration. Commercial land rose rapidly in 2010–2011, but then slowed, with only minor rebounds in 2019 and 2020, reflecting adjustments in the retail sector under e-commerce expansion and shifting consumption patterns. Other land uses exhibited a gradual decline. Overall, these trajectories highlight the combined impacts of economic transformation, urbanization, and policy interventions, with market demand, demographic growth, and technological progress as key driving forces.
3.1.2. Spatial Distribution Characteristics
Figure 2a illustrates the spatial distribution of cumulative construction land supply across Chinese cities from 2009 to 2020. The data reveals significant variation in total supply among cities, spanning 156,567 hectares, underscoring considerable spatial disparity. Overall, the supply generally decreases progressively from the eastern coastal regions to the western inland areas. The spatial pattern of hotspots and coldspots shown in Figure 2b further corroborates this trend: hotspots are highly concentrated in eastern coastal provinces, with Hebei, Shandong, Jiangsu, and Zhejiang being particularly prominent. Conversely, coldspots are predominantly distributed across northwestern and northeastern regions, such as Gansu, Ningxia, and Heilongjiang provinces. This spatial pattern primarily results from the complex interplay of multiple factors, including policy orientation, market dynamics, and resource endowments.
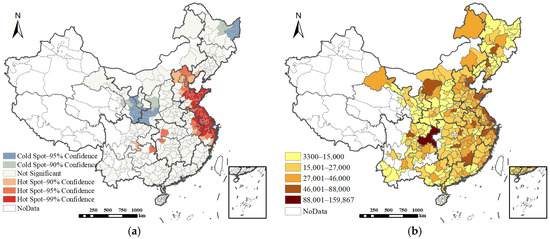
Figure 2.
Cumulative area of construction land supply (ha) and hotspot distribution by city, 2009–2020. (a) Spatial distribution, (b) hotspot distribution.
Figure 3 illustrates the spatial distribution pattern of cumulative construction land supply across various land types during the study period. The range of cumulative land supply for each type of construction land across cities exceeds 10,059 hectares, with the maximum value reaching as high as 50351 hectares, indicating significant spatial disparities. Overall, the supply of various types of construction land generally exhibits a spatial pattern in which the eastern regions have higher supply levels, while the western and northeastern regions have lower supply levels.
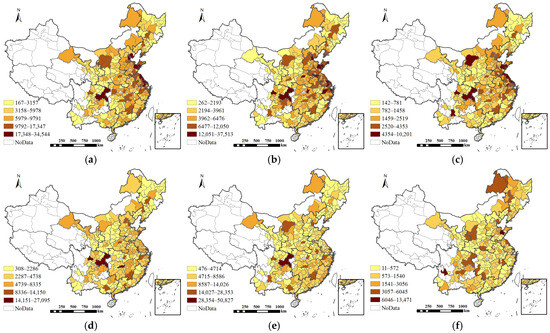
Figure 3.
Cumulative supply of construction land by type, 2009–2020 (ha). (a) Industrial land, (b) residential land, (c) commercial land, (d) public service land, (e) transport land, (f) other construction land.
As shown in Figure 4, hotspots of industrial, residential, and commercial land supply are largely overlapping and concentrated in the eastern coastal provinces, particularly Shandong, Jiangsu, and Zhejiang, characterized by dense populations, developed industries, and strong population attraction. In contrast, cold spots are found in Northeast Heilongjiang and northwestern provinces such as Ningxia and Gansu, which are relatively remote with slower economic growth and lower land demand. Hotspots of public service and transportation land are mainly located in the Yangtze River Delta and other southeastern coastal areas, while cold spots are scattered across the northeast and northwest. For other construction land types, hotspots include Heilongjiang in the northeast and Yunnan in the southwest, likely reflecting water conservancy projects and mineral resource development, with no notable cold spots observed.
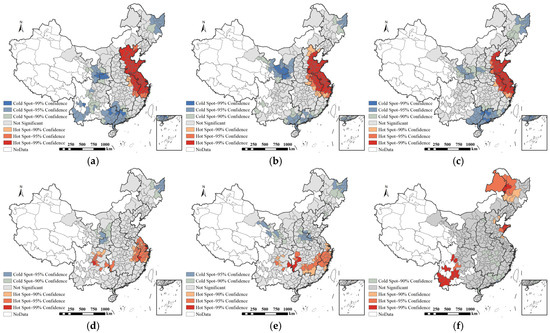
Figure 4.
Hotspot analysis of cumulative supply area of construction land by type, 2009–2020. (a) Industrial land, (b) residential land, (c) commercial land, (d) public service land, (e) transport land, (f) other construction land.
3.2. HQUD Level Estimation Results
3.2.1. Overall Characteristics
From 2009 to 2020, the level of HQUD in Chinese cities showed a clear upward trend. The average level of HQUD increased steadily from 0.1163 to 0.1795, corresponding to an average annual growth rate of 4.03% (Table 4), reflecting significant progress over the decade. The standard deviation also rose from 0.0349 to 0.0528, indicating a growing disparity among cities and a widening development gap, consistent with the findings of Zhang Jingbo et al. [55]. The minimum and maximum values increased from 0.0707 to 0.1241 and from 0.2925 to 0.5092, respectively, confirming the overall upward trend, while highlighting that regional development imbalances have become more pronounced.
Table 4.
Descriptive statistics on the level of high-quality urban development.
3.2.2. Spatial Distribution Characteristics
Figure 5 displays the graded results of the HQUD levels of Chinese cities from 2009 to 2020. Spatially, the HQUD levels across 285 cities exhibit a clear hierarchy, with the eastern region outperforming the central and western regions (East > Central > West). Temporally, HQUD steadily increased from 2009 to 2020, though growth rates varied significantly across regions. Rapid improvements are concentrated in economically advanced cities with strong resource endowments, such as Beijing, Shanghai, and Nanjing, benefiting from high innovation inputs and robust resource aggregation. In contrast, cities like Handan, Yangquan, and Tieling have experienced slower progress despite some advancement. Overall, HQUD in midwestern and northeastern prefecture-level cities lags behind that of eastern coastal and provincial capital cities, reflecting a clear spatial development gap that calls for targeted efforts to accelerate high-quality urban development in these regions.
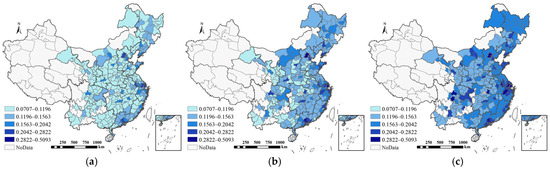
Figure 5.
Spatial distribution of the combined level of high-quality urban development and its changes. (a) 2009, (b) 2015, (c) 2020.
Figure 6 displays the LISA clustering results of the changes in HQUD levels. From 2009 to 2020, China’s HQUD exhibited a coexistence of high–high, low–low, high–low, and low–high spatial clustering patterns. Among these, high–high clusters were mainly concentrated in the eastern coastal regions, characterized by cities with consistently high HQUD levels, whereas low–low clusters were primarily distributed in the central and western regions. The high–low clusters were mainly found in provincial capitals and municipalities, where a significant development gap exists between core cities and their surrounding areas. Although these cities benefit from strong resource agglomeration, their spillover and diffusion effects on neighboring cities remain limited. In contrast, low–high clusters displayed a distinct spatial shift during the study period, gradually moving from northern to southern regions while declining in number. Overall, China’s HQUD is dominated by high–high and low–low clustering, both of which have remained relatively stable over time, reflecting a dual-polarization pattern in spatial development. In other words, rapidly developing cities tend to cluster together and continue to accelerate, whereas slower-developing cities lag further behind—leading to widening regional disparities and a weakening spatial correlation in HQUD across the country.
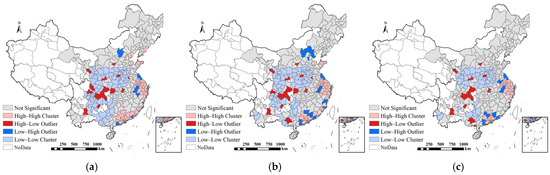
Figure 6.
LISA chart of the combined level of high-quality urban development and its evolution. (a) 2009, (b) 2015, (c) 2020.
3.3. Impact of Construction Land Supply on HQUD
3.3.1. Model Parameters and Precision
An OLS regression was conducted to examine the global effects of construction land supply on high-quality urban development (HQUD). The results indicate that ten variables exert statistically significant influences on HQUD. A multicollinearity diagnosis based on the variance inflation factor (VIF) shows that the mean VIF of the explanatory variables is 3.65 and the maximum VIF is 7.56—both below the conventional threshold of 10—confirming that multicollinearity does not undermine the reliability of the coefficient estimates.
However, due to the neglect of spatiotemporal factors in the OLS model, we further applied the GTWR model to explore the spatiotemporal heterogeneity of the impact of construction land supply on high-quality urban development. Prior to this, we conducted spatial autocorrelation tests on the dependent variable and found that the global Moran’s I value of the dependent variable is positive and statistically significant at the 1% level (Table 5), indicating the presence of spatial autocorrelation. This provides a sound statistical basis for employing the GTWR model in the subsequent analysis.
Table 5.
Global Moran’s Index for level of high-quality urban development, 2009–2020.
The GTWR model was implemented using the GTWR plugin for ArcGIS 10.8 developed by Huang et al. [47,56]. The spatiotemporal distance ratio was determined through automatic optimization, the bandwidth was optimized based on the AICc criterion, and a fixed Gaussian kernel was employed. Table 6 reports the key parameter estimates of the OLS model and the GTWR model. The adjusted R2 value of the GTWR model is 0.8525, indicating a strong explanatory capacity. These results suggest that the selected factors—including the scale, structure, and quality of construction land supply—play a significant role in explaining variations in HQUD. The AICc (Corrected Akaike Information Criterion) results further confirm that the GTWR model provides a better fit than the OLS model and offers more accurate insights into the impact of the explanatory variables on the level of HQUD. Furthermore, considering the potential reverse causality between the scale and price of construction land supply and the level of HQUD, the independent variables X1, X2, X3, X4, and X9 were lagged by one year. The resulting model is denoted as GTWRt-1, and its key regression outputs are reported in Table 6. The adjusted and AICc values demonstrate the robustness and overall reliability of the model.
Table 6.
Comparison of parameters between the OLS model and the GTWR model.
3.3.2. Explanatory Variable Coefficients and Temporal Variations
The box plot in Figure 7 illustrates the temporal evolution of the GTWR-estimated influence coefficients for the explanatory variables on high-quality urban development (HQUD). Overall, the polarity of the coefficients remains relatively stable, whereas their magnitudes exhibit distinct trends over time. From the median of the regression coefficients, the factors that generally exert a positive influence on the comprehensive level of HQUD include commercial land supply scale (X3), public service land supply scale (X4), industrial land allocation ratio (X5), public service land allocation ratio (X6), investment intensity per capita (X7), average construction land price (X9), urban administrative hierarchy (X10), and urban population size (X11). Conversely, the factors that generally have negative impacts on HQUD are residential land supply scale (X2) and population density of urban–rural construction land (X8). The impact of industrial land supply scale (X1) demonstrates a polarized trend. Notably, the interquartile range of the boxes lengthens considerably over the study period, reflecting a growing dispersion in the effects of these variables on HQUD among cities.
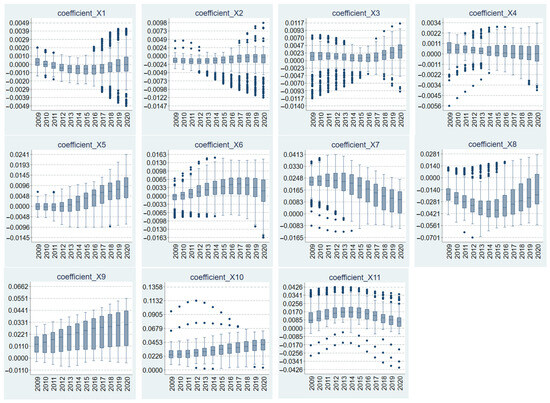
Figure 7.
Temporal variations in local impact coefficients in the GTWR model.
3.3.3. Spatial Heterogeneity of Local Influencing Effects in the GTWR Model
The GTWR model adds an important dimension to relationship identification by revealing the complex spatiotemporal interaction effects between variables. Figure 8 illustrates the spatial distribution of regression coefficients in the GTWR model. Since it is not feasible to present coefficient variations for all years, we interpret the impacts of each explanatory variable on HQUD by combining the spatial patterns in Figure 8 with the boxplots in Figure 7.
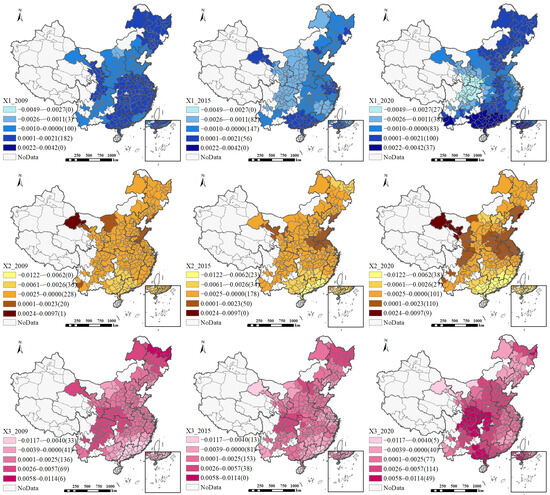
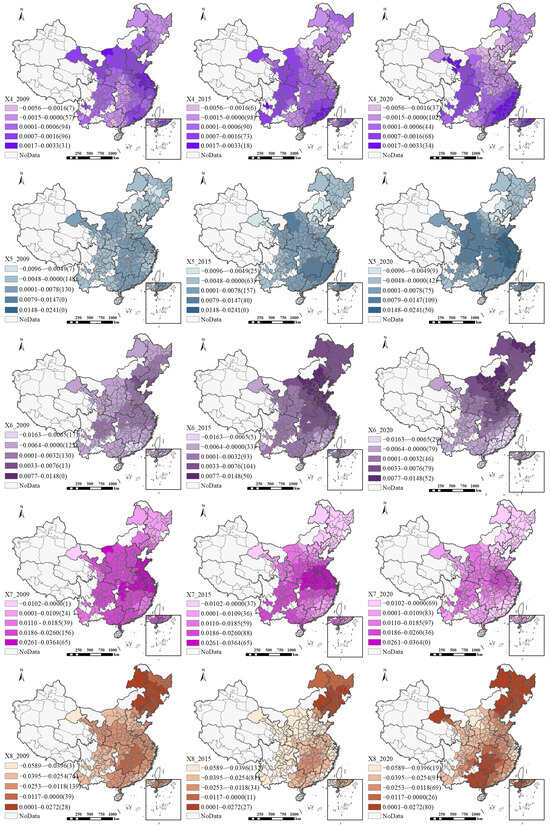
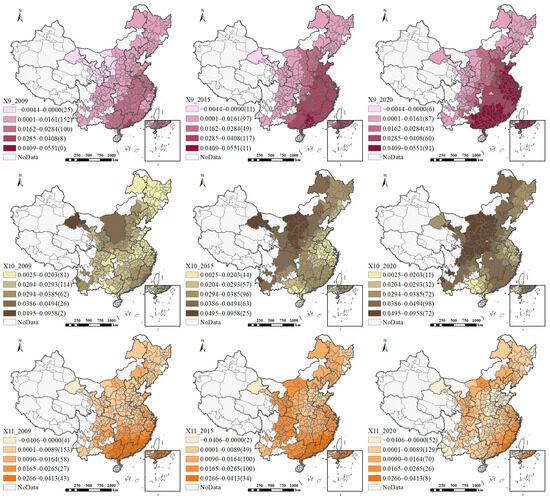
Figure 8.
Spatial heterogeneity of local impact coefficients in the GTWR model.
- The Impact of Construction Land Supply Scale
The impact of industrial land supply scale (X1) varies markedly across regions and over time. Spatially, from 2009 to 2020, some regions—such as southern China—have experienced a strengthening of positive effects, whereas others—such as western China—have seen an intensification of negative effects. These divergent trends are closely tied to regional differences in industrial development stages and their varying capacities to transform land inputs into high-quality urban growth. In more developed regions such as southern China, industrial upgrading and agglomeration economies enable additional land resources to be efficiently transformed into productive outputs, thereby reinforcing their positive contribution to HQUD. In contrast, in less-developed regions such as many parts of western China, the limited industrial base and less favorable location conditions may constrain the scale efficiency of land inputs, leading to inefficient land expansion and, consequently, a negative reinforcement of their impact over time.
The impact coefficient of residential land supply scale (X2) on the level of HQUD is generally negative. Spatially, from 2009 to 2020, this adverse effect intensified in the southeastern region. This phenomenon may be attributed to the crowding-out effect of real estate dependency, which diverts land resources from industrial development and leads to a misallocation of land resources. Such distortions not only weaken the support capacity of the productive sector but also hinder the optimization of the urban economic structure, thereby exerting a sustained suppressing effect on high-quality urban development.
The impact coefficient of commercial land supply scale (X3) on the level of HQUD is predominantly positive, exhibiting a general upward trend. Spatially, its positive effect was initially concentrated in cities in central, western, and southwestern regions in 2009, and gradually expanded to most cities in northern China by 2020. This pattern may reflect that, in these regions, the early expansion of commercial land helped compensate for insufficient market vitality and the underdevelopment of the service sector, thereby stimulating employment, boosting consumption, and facilitating factor agglomeration, ultimately enhancing the quality of urban development. In contrast, in more developed southeastern coastal cities—where service industries and commercial functions are already saturated—the marginal benefits of additional commercial land have diminished substantially and may even turn negative.
The regression coefficient of public service land supply scale (X4) indicates an overall weak positive effect on HQUD, but its impact shows pronounced temporal polarization. In 2009, the positive effects were mainly concentrated in North China and Southeast China. However, by 2015 and 2020, the positive influence had strengthened notably in the southeastern coastal region and the western region. This pattern largely reflects differences in public service development stages. The eastern region had already established a mature system, so additional public service land mainly enhanced livability and the business environment, generating a stronger positive effect. In the western region, ongoing improvements in public service infrastructure increased basic service accessibility and regional attractiveness, leading to a steadily growing positive impact.
In terms of construction land supply scale, the positive impact of X3 and X4 on HQUD is more pronounced, whereas X2 generally shows a negative effect. The impact of X1 varies substantially across regions and over time. These findings indicate that the effects of different types of construction land supply on HQUD differ significantly, suggesting that the scale effect does not always operate effectively across regions or development stages.
- 2.
- Impact of the Structure of Construction Land Supply
The industrial land allocation ratio (X5) predominantly exerts a positive impact on the overall level of high-quality urban development, with this influence progressively increasing over time. This suggests that a higher proportion of industrial land contributes to promoting HQUD. Spatially, cities experiencing positive effects in 2009 were primarily concentrated in the central and eastern coastal region. By 2015 and 2020, the areas exhibiting positive impacts had further expanded, and the magnitude of these positive effects had deepened. The proportion of industrial land in total construction land supply reflects the degree of policy support from local governments toward the industrial sector and the prioritization in resource allocation. By stimulating productive investment, expanding industrial and supply chain networks, and enhancing regional economic vitality, industrial activities have evolved into a crucial driving force in advancing high-quality urban development.
The overall impact of public service land allocation ratio (X6) on the level of high-quality urban development is predominantly positive, and its degree of influence first increases and then decreases. From 2009 to 2020, the region with the most significant positive impact gradually expanded in North China. Meanwhile, some cities in the southeast region have been more significantly negatively affected. This differentiation phenomenon mainly stems from the differences in regional development stages and land resource allocation patterns. During the sample period, the North China region continued to promote equalization of basic public services and effectively improving residents’ well-being and urban livability, thereby strengthening the positive effect of X6 on HQUD. In contrast, some cities in the southeast region have entered a stage of high-density development, and the expansion of public service land is often accompanied by the crowding out effect of commercial and residential land, leading to an imbalance in land structure or a decrease in spatial efficiency.
In terms of the structure of construction land supply, both X5 and X6 exert a positive influence on HQUD. This suggests that increasing the shares of industrial and public service land—while reducing the proportion of commercial–residential land—can foster industrial agglomeration, enhance public service capacity, and thereby promote high-quality urban development.
- 3.
- The Impact of the Quality of Land Supply
The investment intensity per capita (X7) predominantly exerts a positive influence on HQUD, although the magnitude of this effect has gradually diminished since 2014. In 2009, the positive effect was nearly universal across all cities. By 2015 and 2020, its spatial reach gradually narrowed, becoming primarily concentrated in the central and western regions. This shift is largely attributable to the fact that some cities have entered a phase of diminishing marginal returns to investment as their infrastructure has become increasingly mature, thereby reducing the effectiveness of capital investment alone in driving HQUD. In contrast, cities in the central and western regions remain in a critical stage of industrial upgrading and infrastructure development, where per capita investment intensity continues to exert a strong promoting effect.
The influence of population density of urban–rural construction land (X8) on HQUD is predominantly negative and follows a U-shaped temporal trend. Spatially, the number of cities experiencing a positive impact rose from 28 in 2019 to 80 in 2020, primarily concentrated in parts of southwestern and northeastern China. The decreasing trend in urban and rural construction land population density reflects the fact that the pace of construction land supply has outpaced population growth. Higher population densities may indicate a reduced availability of land, which acts as a negative driver for high-quality urban development. However, in regions where population density remains relatively low, a moderate increase in density can still enhance resource allocation efficiency and support high-quality development.
The impact of average construction land price (X9) on the level of HQUD is predominantly positive, with a gradually increasing trend. Spatially, the influence of average land price on HQUD follows a gradient, with its impact decreasing from east to west, which corresponds closely with the spatial distribution of HQUD levels across cities. This spatial pattern can be attributed to the different ways in which land prices influence HQUD in various regions. In eastern cities, higher land prices likely promote industrial upgrading and the intensive use of resources, thereby fostering the development of innovation-driven economies. In contrast, in central and western regions, where attracting capital and talent is relatively more challenging, rising land prices may not effectively drive the optimal allocation of resources.
In terms of construction land supply quality, both X7 and X9 have a positive effect on high-quality urban development, whereas X8 tends to have a negative impact. This is likely because the first two indicators enhance land-use efficiency and support industrial development, while excessively high population density increases pressure on resources and the environment, hindering HQUD.
- 4.
- The Impact of the Control Variables
In the control variables, both urban administrative hierarchy (X10) and urban population size (X11) predominantly exert a positive influence on HQUD, with negative impacts observed only in a few cities. The influence of urban hierarchy on HQUD progressively strengthened, suggesting that cities with higher hierarchical levels may have attracted more development resources or benefited from institutional and policy advantages. In contrast, the impact of city size follows an inverted U-shaped pattern—intensifying initially and then weakening in the later years of the study period—indicating a diminishing marginal effect of city size. Spatially, cities more positively affected by urban hierarchy are primarily located in the North and Northwest regions of China, while those with a stronger influence from city size are mainly found in the Southeastern coastal areas. This regional distribution reflects differing development pathways: cities in the North and Northwest tend to leverage their hierarchical advantages, while cities in the Southeastern coastal areas capitalize on their size advantages.
4. Discussion
4.1. Analysis of Impact Mechanisms
We aimed to clarify the mechanism of influence between the supply of construction land and high-quality urban development in order to provide reference for the reasonable regulation of construction land supply and the optimization of land resource allocation across regions. The scale of urban construction land supply is primarily determined by the land demand generated by population and industrial agglomeration during the processes of urbanization and industrialization [57]. The government addresses the land demands of urban populations and industries through planning and land supply regulation. For instance, the government attracts investment by selling industrial land at low prices and generates fiscal revenue through the sale of commercial and service land at higher prices. Furthermore, by enhancing public services and infrastructure, the government promotes urban development, creates employment opportunities, increases residents’ incomes, and fosters regional economic growth [58,59]. However, excessive expansion may lead to problems such as resource waste, traffic congestion, an inflated industrial structure, and overdependence on land-based finance [57]. Therefore, sustainable HQUD can only be achieved when the scale of land supply is in harmony with the city’s size and development stage.
In terms of land supply structure, agricultural land protection policies compel local governments to adjust land use patterns in order to maximize benefits when transferring land for urban development [60]. As urbanization progresses, the demand for public services such as education, healthcare, and transportation has increased. However, local finances and central government transfers are insufficient to meet the long-term needs for high-quality urban development. Consequently, governments attract investment by offering industrial land at low prices and generate fiscal revenue through the sale of commercial and residential land at higher prices. This practice often crowds out land allocated for public services and management, resulting in a delay in the development of public services relative to economic growth [61]. Nevertheless, an excess of industrial land reduces land use efficiency, while an oversupply of residential and commercial land can lead to rising vacancy rates or inadequate public services [62]. Therefore, the biased supply of single-use land leads to diminishing marginal returns and increased opportunity costs, ultimately hindering the promotion of high-quality urban development.
In terms of supply quality, the quality of construction land supply plays a crucial role in promoting the intensive use of urban land. The government influences investment intensity, population density, and land prices through policies and land-use standards, which subsequently affect HQUD. Investment intensity reflects the capital density in the land development process. Cities with higher investment intensity typically exhibit well-developed infrastructure and an innovative environment, attracting high-quality enterprises and talent, thereby enhancing both livability and economic vitality. However, excessive investment intensity can reduce capital liquidity and increase debt risks. Proper planning of urban and rural population densities can improve land-use efficiency, but overly high densities may lead to rising housing prices and deteriorating living conditions. The government, as the sole supplier of land, regulates land prices through policies such as “auction, listing, and bidding” and benchmark land prices, guiding production factors towards high-efficiency industries, optimizing the industrial structure, and fostering innovation. Therefore, improving the quality of land supply is a critical pathway to promoting HQUD.
4.2. Implications
Based on the conclusions and impact mechanisms outlined above, this study offers the following insights. In terms of the scale of construction land supply, while controlling the overall amount of newly developed land, the land supply should be adjusted in accordance with the functional roles of cities, industrial specialization, population trends, and other socio-economic development needs. Additionally, factors such as urban hierarchy, regional size, and existing land use efficiency must be taken into account when coordinating and allocating land quotas across cities. At the national level, it is recommended that land supply quotas be appropriately directed towards cities in regions with significant development potential, such as the eastern and southwestern economic zones [63].
In terms of land supply structure, optimizing this structure has become a key strategy for regulating land supply. By adjusting the land supply structure to suit local conditions and leveraging tools such as tax incentives, policy guidance, and market-oriented reforms, it is possible to promote industrial upgrading, foster green development, and enhance social welfare, ultimately optimizing the land supply structure and facilitating high-quality urban development. Specifically, in most regions, increasing the proportion of industrial land and public service land in the supply of construction land, while appropriately reducing the proportion of residential and commercial land supply, will contribute to high-quality urban development.
Regarding the quality of construction land supply, it is essential to consider regional development disparities to balance the varying needs of different regions [16]. Enhancing investment efficiency, optimizing the match between population and land, and improving land allocation mechanisms through price instruments are crucial for promoting high-quality urban development. In the eastern regions, price mechanisms can be employed to curb inefficient land use and facilitate industrial upgrading. In contrast, in the central and western regions, land costs can be moderately reduced to attract high-quality enterprises and projects.
4.3. Limitations
This study investigates the spatiotemporal characteristics of construction land supply across 285 cities in China from 2009 to 2020 and analyzes its spatiotemporal heterogeneous impact on HQUD. The findings offer valuable insights into the role of construction land supply in promoting HQUD. However, several limitations should be acknowledged. First, with the rise of big data, the evaluation index system for HQUD still has room for improvement. In addition, variations in statistical standards across cities may affect the generalizability and accuracy of the evaluation framework. Second, although this study conducted robustness checks using one-year lagged variables—which helps mitigate, to some extent, the issue of reverse causality—the underlying mechanisms of mutual influence still require deeper investigation. Finally, this study is based on historical data from 2009 to 2020, while in recent years China’s economic structure and urban development patterns have undergone significant changes, placing new demands on construction land supply. These issues highlight important directions for future research.
5. Conclusions
This study provides a comprehensive evaluation of the spatiotemporal variation in construction land supply using panel data on land transfers from 285 Chinese cities between 2009 and 2020. Using the GTWR model, the study examines the spatiotemporal heterogeneous impact of construction land supply on HQUD. The main findings of this study are as follows: (1) The overall supply of urban construction land followed a fluctuating trajectory—initially rising, then declining, and subsequently increasing again—a pattern also observed for industrial and residential land. Spatial analysis indicates that supply hotspots are concentrated in coastal cities such as those in Shandong and Jiangsu provinces, while cold spots are mainly located in the northwest and northeast, including cities in Ningxia and Gansu. (2) The level of HQUD in China has shown a steady upward trend, exhibiting a distinct spatial gradient of East > Central > West. The spatial spillover effect of HQUD has gradually strengthened, yet the southeastern coastal regions consistently outperform the central and western areas. Spatial clustering analysis reveals a pattern of high–high clusters in the eastern coastal zone, low–low clusters in the central and western regions, and high–low clusters in capital cities and municipalities due to their strong resource agglomeration. Nonetheless, regional disparities in development remain pronounced. (3) The factors influencing HQUD exhibit notable volatility. Industrial agglomeration, resource optimization, and land investment returns effectively promote the expansion of commercial land supply, the industrial land allocation ratio, the public service land allocation ratio, land investment intensity, and the average construction land price, thereby driving HQUD level in a positive direction. However, excessively high population density in urban and rural construction land may lead to increased pressure on resources and the environment, traffic congestion, and strained public services, which in turn negatively impact HQUD. Furthermore, improvements in urban administrative hierarchy and urban population size contribute to overall economic development, positively promoting HQUD.
Author Contributions
Conceptualization, L.Z. and Y.L.; Data curation, L.Z.; Formal analysis, J.L.; Funding acquisition, Y.L.; Investigation, L.Z.; Methodology, L.Z.; Project administration, Y.L.; Resources, Y.L.; Software, L.Z.; Supervision, Y.L. and Y.Z.; Validation, L.Z. and C.Y.; Visualization, L.Z.; Writing—original draft, L.Z. and Y.Z.; Writing—review & editing, J.L. and C.Y. All authors have read and agreed to the published version of the manuscript.
Funding
This research was funded by the National Natural Science Foundation of China (42230107, 42501258).
Data Availability Statement
The raw data supporting the conclusions of this article will be made available by the authors on request.
Conflicts of Interest
The authors declare no conflicts of interest.
References
- Farhan, M.; Wu, T.; Amin, M.; Tariq, A.; Guluzade, R.; Alzahrani, H. Monitoring and prediction of the LULC change dynamics using time series remote sensing data with Google Earth Engine. Phys. Chem. Earth 2024, 136, 103689. [Google Scholar] [CrossRef]
- Ottensmann, J.R. Urban sprawl, land values and the density of development. Land Econ. 1977, 53, 389–400. [Google Scholar] [CrossRef]
- Soergel, B.; Kriegler, E.; Weindl, I.; Rauner, S.; Dirnaichner, A.; Ruhe, C.; Hofmann, M.; Bauer, N.; Bertram, C.; Bodirsky, B.L.; et al. A sustainable development pathway for climate action within the UN 2030 Agenda. Nat. Clim. Change 2021, 11, 656–664. [Google Scholar] [CrossRef]
- Giddings, B.; Hopwood, B.; O’BRien, G. Environment, economy and society: Fitting them together into sustainable development. Sustain. Dev. 2002, 10, 187–196. [Google Scholar] [CrossRef]
- Sany´e-Mengual, E.; Secchi, M.; Corrado, S.; Beylot, A.; Sala, S. Assessing the decoupling of economic growth from environmental impacts in the European union: A consumption-based approach. J. Clean. Prod. 2019, 236, 117535. [Google Scholar] [CrossRef] [PubMed]
- Aref, A.; Fallentine, A.; Zahran, S. The State of Urbanization, Demographic Changes, and Family Dynamics in Africa. J. Comp. Fam. Stud. 2023, 54, 283–297. [Google Scholar] [CrossRef]
- Wise, R.D.; Anguiano, F.C.; Olvera, S.G. Migration and peripheral urbanization: The case of the metropolitan zone of the valley of Mexico. Ethn. Racial Stud. 2023, 46, 2416–2438. [Google Scholar] [CrossRef]
- Liu, L.; Xu, X.; Chen, X. Assessing the impact of urban expansion on potential crop yield in China during1990–2010. Food Secur. 2014, 7, 33–43. [Google Scholar] [CrossRef]
- Wei, Y.P.; Zhang, Z.Y. Assessing the fragmentation of construction land in urban areas: An index method and case study in Shunde, China. Land Use Policy 2012, 29, 417–428. [Google Scholar] [CrossRef]
- Georgeson, L.; Maslin, M. Estimating the scale of the US green economy within the global context. Palgrave Commun. 2019, 5, 121. [Google Scholar] [CrossRef]
- He, L. High-quality development as the primary task in building a modern socialist country in all respects. Macroecon. Manag. 2022, 12, 1–4+8. [Google Scholar] [CrossRef]
- Lu, Y.; Zhang, Y.; Cao, X.; Wang, C.; Wang, Y.; Zhang, M.; Ferrier, R.C.; Jenkins, A.; Yuan, J.; Bailey, M.J.; et al. Forty years of reform and opening up: China’s progress toward a sustainable path. Sci. Adv. 2019, 5, eaau9413. [Google Scholar] [CrossRef]
- Zhang, F.; Tan, H.; Zhao, P.; Gao, L.; Ma, D.; Xiao, Y. What Was the Spatiotemporal Evolution Characteristics of High-Quality Development in China? A Case Study of the Yangtze River Economic Belt Based on the ICGOS-SBM Model. Ecol. Indic. 2022, 145, 109593. [Google Scholar] [CrossRef]
- Seto, K.C.; Fragkias, M.; Güneralp, B.; Reilly, M.K. A Meta-Analysis of Global Urban Land Expansion. PLoS ONE 2011, 6, e23777. [Google Scholar] [CrossRef] [PubMed]
- Yan, H.S.; Sun, J.W.; Zhang, Z.B. Analysis of spatial-temporal evolution of urban construction land supply in China. Urban Dev. Stud. 2021, 28, 42–49. [Google Scholar] [CrossRef]
- Guo, Z.; Hu, Y.; Wang, J.; Bai, Y. Has China completed the supply-side structural reform of construction land supply? Evidence from 335 cities. Habitat Int. 2025, 156, 103271. [Google Scholar] [CrossRef]
- Jiang, G.; Ma, W.; Qu, Y.; Zhang, R.; Zhou, D. How does sprawl differ across urban built-up land types in China? A spatial-temporal analysis of the Beijing metropolitan area using granted land parcel data. Cities 2016, 58, 1–9. [Google Scholar] [CrossRef]
- Yan, H.S.; Sun, J.W.; Su, X.J. Land Element: A Policy Tool with Chinese Characteristics. Economist 2019, 5, 104–112. [Google Scholar] [CrossRef]
- Abdrabo, M.A.; Hassaan, M.A.; Abdelwahab, R.G. A spatial hedonic approach for modeling the relationship between quality of urban life and housing prices, case study: Alexandria city, Egypt. Lett. Spat. Resour. Sci. 2022, 15, 59–77. [Google Scholar] [CrossRef]
- Rodrigues, M.; Franco, M. Measuring the urban sustainable development in cities through a Composite Index: The case of Portugal. Sustain. Dev. 2020, 28, 507–520. [Google Scholar] [CrossRef]
- Yang, G.; Xiang, X.; Deng, F.; Wang, F. Towards high-quality development: How does digital economy impact low-carbon inclusive development?: Mechanism and path. Environ. Sci. Pollut. Res. 2023, 30, 41700–41725. [Google Scholar] [CrossRef]
- Yuan, X.L.; Guo, Y.L.; Wang, H.X. The spatial and temporal differentiation of urban development quality in China and its driving factors. Hum. Geogr. 2022, 37, 129–138+170. [Google Scholar] [CrossRef]
- Du, J.; Peiser, R.B. Land supply, pricing and local governments’ land hoarding in China. Reg. Sci. Urban Econ. 2014, 48, 180–189. [Google Scholar] [CrossRef]
- Zheng, S.; Sun, W.; Wang, R. Land supply and capitalization of public goods in housing prices: Evidence from Beijing. J. Reg. Sci. 2014, 54, 550–568. [Google Scholar] [CrossRef]
- Huang, L.; Yang, L.; Tian, L.; Yu, R.; Wang, D.; Hao, J.; Lu, J. Does the location of construction land supply play a very important role on economic growth? The case study of Tianjin Binhai new area. J. Urban Manag. 2020, 9, 104–114. [Google Scholar] [CrossRef]
- Xiang, S.; Huang, L.; Zhou, M.; Shan, L.; Dong, B.; Wang, K. Dynamic analysis of correlation patterns between urban population and construction land at different administrative levels: The case of Hangzhou megacity. Ecol. Indic. 2023, 154, 110407. [Google Scholar] [CrossRef]
- Cheng, J.; Zhao, J.; Dai, Y.; Li, Y. Land supply patterns and the Chinese low consumption puzzle. Struct. Change Econ. Dyn. 2024, 69, 232–245. [Google Scholar] [CrossRef]
- Fan, J.; Zhou, L.; Yu, X.; Zhang, Y. Impact of land quota and land supply structure on China’s housing prices: Quasi-natural experiment based on land quota policy adjustment. Land Use Policy 2021, 106, 105452. [Google Scholar] [CrossRef]
- Huang, J.S.; Chen, L.G.; Zhang, Y.Y.; Zhao, A. The relationship between industrial land price and industrial structure change. Resour. Sci. 2017, 39, 585–596. [Google Scholar] [CrossRef]
- Li, L.; Liu, L.; Gu, Z.; Sun, Z.; Zhang, Q. Examining the relationships between carbon emissions and land supply in China. Ecol. Inform. 2022, 70, 101744. [Google Scholar] [CrossRef]
- Li, J.; Sun, Z. Does the transfer of state-owned land-use rights promote or restrict urban development? Land Use Policy 2021, 100, 104945. [Google Scholar] [CrossRef]
- Liu, T.; Huang, M. Land supply and money growth in China. Int. Rev. Econ. Financ. 2016, 42, 327–338. [Google Scholar] [CrossRef]
- Mozaffari, M.M.; Azarneshan, S.; Sarmadian, F.; Yazdani, A. Land Evaluation and Ranking with Using an Incorporate Vision of Parametric Method and Analytic Hierarchy Process. Life Sci. J.-Acta Zhengzhou Univ. Overseas Ed. 2012, 9, 1157–1164. [Google Scholar] [CrossRef]
- Li, B.; Wang, H. Comprehensive evaluation of urban high-quality development: A case study of Liaoning province. Environ. Dev. Sustain. 2023, 25, 1809–1831. [Google Scholar] [CrossRef]
- Zhao, J.B.; Shi, D.; Deng, Z. A framework of China’s high-quality economic development. Res. Econ. Manag. 2019, 40, 15–31. [Google Scholar] [CrossRef]
- Liu, B.L.; Wang, X.; Bian, Y. Theoretical analysis and path selection of high quality urban development in China under the new development pattern. Reform 2021, 326, 15–23. [Google Scholar]
- Guo, F.; Wang, J.Y.; Wang, F.; Kong, T.; Zhang, X.; Cheng, Z. Measuring the development of digital inclusive finance in China: Index compilation and spatial characteristics. China Econ. Q. 2020, 19, 1401–1418. [Google Scholar] [CrossRef]
- Gan, C.H.; Zheng, R.G.; Yu, D.F. An empirical study on the effects of industrial structure on economic growth and fluctuaions in China. Econ. Res. J. 2011, 46, 4–16, 31. [Google Scholar]
- Wu, W.Z.; Liu, Y.B.; Xu, L. Industrial structure change and income inequality: Micro-evidence from China. Manag. World 2018, 34, 22–33. [Google Scholar] [CrossRef]
- Zhai, Y.; Zhao, B.; Yang, C.Y.; Sun, X.H. “Black Box” Deconstruction from Innovation Behavior to Productivity Effect. Sci. Sci. Manag. S.T. 2024, 45, 68–87. [Google Scholar]
- Qu, X.; Zhang, H.; Bi, G.; Su, K.; Zhang, Z.; Qian, Y.; Yang, Q. Spatial effects of the land supply scale of different industrial sectors on high-quality development in the Yangtze River economic belt. Land 2022, 11, 1898. [Google Scholar] [CrossRef]
- Pan, W.; Wang, J.; Lu, Z.; Liu, Y.; Li, Y. High-quality development in China: Measurement system, spatial pattern, and improvement paths. Habitat Int. 2021, 118, 102458. [Google Scholar] [CrossRef]
- Wang, H.Q.; Gao, S.J. Germination, starting and policy evolution of green development in China: Observation of some stage characteristics. Reform 2016, 3, 6–26. [Google Scholar]
- Zhang, X.H.; Zhang, X. Requirements of the times, practical principles and promotion paths of shared development. Study Explor. 2023, 11, 1–8+175. [Google Scholar]
- Ord, J.K.; Getis, A. Local spatial autocorrelation statistics: Distributional issues and an application. Geogr. Anal. 1995, 27, 286–306. [Google Scholar] [CrossRef]
- Getis, A.; Cliff, A.D.; Ord, J.K. 1973: Spatial autocorrelation. London: Pion. Prog. Hum. Geogr. 1995, 19, 245–249. [Google Scholar] [CrossRef]
- Huang, B.; Wu, B.; Barry, M. Geographically and temporally weighted regression for modeling spatio-temporal variation in house prices. Int. J. Geogr. Inf. Sci. 2010, 24, 383–401. [Google Scholar] [CrossRef]
- Ma, X.; Zhang, J.; Ding, C.; Wang, Y. A geographically and temporally weighted regression model to explore the spatiotemporal influence of built environment on transit ridership. Comput. Environ. Urban Syst. 2018, 70, 113–124. [Google Scholar] [CrossRef]
- Yoo, C.; Xiao, H.; Zhong, Q.-W.; Weng, Q. Unequal impacts of urban industrial land expansion on economic growth and carbon dioxide emissions. Commun. Earth Environ. 2024, 5, 203. [Google Scholar] [CrossRef]
- Zhang, L.; Lu, M.; Liu, Y.L. Tax Incentives and Supply Structure of Commercial and Residential Land. China Econ. Q. 2022, 22, 1425–1446. [Google Scholar] [CrossRef]
- Kong, W.L.; Wang, X.B.; Zhou, J.H.; Zhang, Z. Impact of land supply behavior on the development of new quality productivity: A three-dimensional empirical analysis based on supply structure, price, and mode. China Land Sci. 2024, 38, 51–62. [Google Scholar] [CrossRef]
- Ma, H.T.; Xu, X.F. High-quality development assessment and spatial heterogeneity of urban agglomeration in the Yellow River Basin. Econ. Geogr. 2020, 40, 11–18. [Google Scholar] [CrossRef]
- Zhu, D.L. Exploring the dialectical relationship between land resource allocation and economic growth. China Land 2023, 5, 22–24. [Google Scholar] [CrossRef]
- Peng, S.G.; Li, M.; Guo, Z.N.; Wang, J.; Zhang, M. Nonlinear effects of local government’s “Dual-Track” land supply strategy on the optimization of industrial structure: An empirical analysis based on the dual perspectives of rationalization and supererogation. China Land Sci. 2023, 37, 48–58. [Google Scholar] [CrossRef]
- Zhang, J.B. Study on Spatial Differences and Convergence of Urban Economy High Quality Development. Ph.D. Thesis, Dongbei University of Finance and Economics, Shenyang, China, 2019. [Google Scholar] [CrossRef]
- Huang, B.; Wang, J. GTWR ADDIN (Updated and Valid till 1 January 2025). 2000. Available online: https://www.researchgate.net/publication/329518786_GTWR_ADDIN_Updated_and_Valid_till_Jan_1_2025 (accessed on 26 November 2025).
- Gao, Y.J. Research on the Impact of Construction Land Supply on the Quality of Urban Development in Yunnan Province. Master’s Thesis, Yunnan University of Finance and Economics, Kunming, China, 2023. [Google Scholar] [CrossRef]
- Liu, X.Z.; Zhou, H.M. How does land resource allocation affect urban economic efficiency: An empirical test based on industrial data of 286 cities above prefecture level in China. China Land Sci. 2022, 36, 49–58. [Google Scholar] [CrossRef]
- Hu, S.J.; Xu, X. Investment competition and land supply behavior: Based on the perspective of urban economic development. Reform 2021, 7, 91–106. [Google Scholar]
- Lei, X.B.; Wang, L.J.; Wu, S.S. Study on the influence of construction land supply scale and structure on urban development quality. China Land Sci. 2020, 34, 75–83. [Google Scholar] [CrossRef]
- Gao, X.L. Comprehensive Evaluation for Wuhan Urban Renewal Based on Multi-Source Data. Master’s Thesis, Wuhan University of Technology, Wuhan, China, 2022. [Google Scholar] [CrossRef]
- Liu, S.Y. Land institutional reform and structural transformation in China: An economic interpretation for China’s 40 years development experience. China Land Sci. 2018, 32, 1–10. [Google Scholar] [CrossRef]
- Zhang, J.; Li, L.; Yu, T.; Gu, J.; Wen, H. Land assets, urban investment bonds, and local governments’ debt risk, China. Int. J. Strat. Prop. Manag. 2021, 25, 65–75. [Google Scholar] [CrossRef]
Disclaimer/Publisher’s Note: The statements, opinions and data contained in all publications are solely those of the individual author(s) and contributor(s) and not of MDPI and/or the editor(s). MDPI and/or the editor(s) disclaim responsibility for any injury to people or property resulting from any ideas, methods, instructions or products referred to in the content. |
© 2025 by the authors. Licensee MDPI, Basel, Switzerland. This article is an open access article distributed under the terms and conditions of the Creative Commons Attribution (CC BY) license (https://creativecommons.org/licenses/by/4.0/).