Abstract
In the context of global climate change and rapid urbanization, the Urban Heat Island (UHI) effect has become a pressing environmental and public health concern, particularly in semiarid regions. This study evaluates the microclimatic performance of various urban design strategies aimed at enhancing thermal comfort along a densely built-up street in Van, a medium-sized city located in Turkey’s semiarid climate zone. Using ENVI-met 5.7.2, nine alternative scenarios were simulated, incorporating different configurations of vegetation cover (0%, 25%, 50%, 75%), ground surface materials, and green roof applications (0%, 25%, 50%, 75%). Physiological Equivalent Temperature (PET) and other thermal comfort indicators were assessed at multiple time intervals on the hottest summer day. Results indicate that increasing vegetation cover substantially reduces PET values, with a maximum reduction of 3.0 °C observed in the 75% vegetation scenario. While the scenario with no vegetation but light-colored pavements achieved a 1.8 °C reduction in air temperature at 2:00 p.m., the maximum PET value remained unchanged. Conversely, using dark-colored asphalt decreased the average air temperature by 1 °C and improved the thermal comfort level by reducing the PET by 0.4 °C compared to a non-vegetated scenario. The scenario with the highest overall greenery led to a 2.9 °C drop in air temperature and a 12.8 °C reduction in average PET at 2:00 p.m. compared to other scenarios. The study provides evidence-based recommendations for human-centered urban planning and advocates for the integration of microclimate simulation tools in the early stages of urban development.
1. Introduction
The increasing impacts of global climate change and the acceleration of urbanization have made cities increasingly vulnerable to environmental stressors, particularly extreme temperatures. This vulnerability is particularly pronounced in semiarid and arid regions, where limited rainfall, low relative humidity, and sparse vegetation intersect with human-induced surface changes, exacerbating urban heat stress. In this context, the Urban Heat Island (UHI) effect stands out as one of the most tangible and detrimental manifestations of urban environmental transformation. UHI refers to the significantly higher temperatures experienced in urbanized areas compared to rural areas, and the primary reasons for this difference include increased surface absorption, decreased evapotranspiration, anthropogenic heat release, and changes in the aerodynamic properties of the urban canopy [,,].
Thermal comfort is defined as “the physical and psychological state in which an individual feels comfortable in the external environmental conditions they find themselves in []. Thermal comfort in outdoor environments is often assessed with composite indices that convert climate data into human-centered metrics. Among these indices, Physiological Equivalent Temperature (PET) developed by [] approximates human thermal perception by combining elements such as air temperature, wind speed, humidity, and short- and long-wave radiation. PET is particularly useful in urban microclimate analyses due to its high level of correlation with subjective thermal perception and its adaptability to different climatic zones and cultural contexts.
Numerous experimental and simulation-based studies have confirmed the role of green infrastructure in regulating the thermal comfort range and reducing urban heat. In a meta-analysis of urban studies, Bowler et al. [] showed that urban green spaces can reduce surface temperatures by 0.94 °C depending on plant density, species diversity and spatial arrangement. Similarly, Gunawardena et al. [] highlighted that the evapotranspiration-induced cooling effect of green and blue spaces is particularly pronounced in urban canopy layer conditions, and that tree-dominated green spaces reduce the UHI effect the most. Zölch et al. [] showed that strategically planted trees in pedestrian areas can reduce PET values by up to 13%. The cooling effect of vegetation is attributed to three primary mechanisms: shading, evapotranspiration, and changes in surface albedo [,]. Shading reduces solar radiation reaching horizontal and vertical surfaces, and evapotranspiration allows plants to release water vapor into the atmosphere, cooling the surrounding air. Additionally, vegetated surfaces generally have higher albedo values compared to dark-colored impermeable materials, thus reflecting more of the solar energy incident on the surface [,,,].
Rapid urbanization over the last two decades, lacking integrated ecological infrastructure, has led to a pronounced UHI effect in the cities, increasing the frequency and severity of heat-related illnesses and health risks. The prevalence of impervious surfaces, limited vegetation, and low urban albedo exacerbate local heat stress in central areas, reduce outdoor livability, and strain energy systems due to increased cooling demand []. Studies aimed at reducing the UHI effect in urban areas with high summer temperatures generally focus on the effects of changes in vegetation [,,,] areas with different characteristics [,], the combined use of blue-green infrastructure [,,], changes in surface materials [,,,,,], or roof gardens on air temperature and PET [,].
ENVI-met, a grid-based climate model designed to simulate ground, building facade, vegetation, and weather relationships in urban areas, is a high-resolution microclimate model. Typical horizontal resolution ranges from 0.5 to 5 m and 90 × 90 × 30, enabling near-accurate modeling of microclimate parameters []. Numerical simulations such as ENVI-met have provided a better understanding of the impact of specific design interventions, such as tree cover, green roofs, permeable soils, and water features, on local thermal conditions. For example, Erten Mutlu and Yılmaz [] simulated the thermal performance of different vegetation ratios in narrow urban canyons and showed that increasing tree cover from 25% to 50% significantly reduced PET values. Similarly, water features such as fountains and shallow pools provide local evaporative cooling, particularly in low-humidity regions. While existing literature focuses on the biophysical effectiveness of green infrastructure, emerging interdisciplinary perspectives argue that thermal comfort should be considered not only as an engineering but also as a multisensory and experiential phenomenon. For example, Heschong [] proposed that carefully designed thermal experiences in open spaces can evoke emotional, aesthetic, and even spiritual responses. This understanding aligns with the principles of biophilic design, which argue that continuous interaction with nature is important for cognitive renewal, stress reduction, and increased psychological resilience []. Furthermore, in contemporary architectural discourse, urban morphology is considered an element that can influence local thermal regimes. Computational morphology is a design approach inspired by adaptive forms found in nature and aims to optimize climate-responsive urban geometry. De Luca [] argue that form-making processes should incorporate climate data from the outset, allowing buildings and public spaces to act as intermediaries between environmental conditions and human comfort. From this perspective, UHI reduction is not merely a technical improvement but also a spatial opportunity driven by design.
Therefore, designing thermally resilient urban streets is not merely an aesthetic or functional choice; it is also a public health imperative and a critical dimension of sustainable urban development. Thermal comfort in open spaces like streets directly impacts urban quality of life through elements such as pedestrian accessibility, social interaction, economic activity, and overall psychosocial well-being [].
Thermal conditions in outdoor environments, in particular, can disproportionately affect vulnerable groups such as children, the elderly, and individuals with chronic conditions, raising urgent issues for environmental justice and inclusive design [,]. To effectively mitigate the impact of UHI and create human-centered microclimates, contemporary urban design approaches are turning to holistic methods that combine passive climate adaptation strategies, nature-based solutions, and high-resolution simulation tools. Among these tools, ENVI-met stands out as a three-dimensional microclimate modeling platform developed to simulate the interactions between urban morphology, vegetation, surface materials, and atmospheric parameters at the pedestrian scale [].
Some of the studies conducted in recent years in micro-scale urban areas using this software are given in Table 1. Fu et al. [], in their study examining the effects of trees on thermal comfort in urban street canyons, revealed that trees significantly alleviate thermal discomfort, particularly by reducing radiative heat transfer. In addition, it was stated that the shading effect varies depending on the street orientation, and more significant improvements were achieved, especially on the north side of east–west-oriented canyons. Similarly, Xiao et al. [], in their study conducted in Wuhan city, showed that selecting tree forms appropriate to the geometry of the street canyon directly affects pedestrian thermal comfort. Both studies emphasize that matching the right tree species with the appropriate canyon structure is of critical importance in combating urban heat stress. On the other hand, Cui et al. [] conducted a study in Shenzhen, where 12 simulations using ENVI-met software determined that street orientation was the most influential factor on the thermal efficiency of vertical greenery. Comparing canyons with the same amount of green space, east–west-oriented street canyons demonstrated more effective cooling, humidification, and thermal comfort improvements at the walking level.

Table 1.
Studies conducted in recent years using the ENVI-met climate simulation model in the outdoor micro-scale.
This study employed a comprehensive, interdisciplinary methodology to assess the thermal performance of an urban street in Van, Turkey, using ENVI-met 5.7.2. The objective was to identify urban design scenarios that enhance pedestrian thermal comfort at street level, particularly in a semi-arid climate. Therefore, nine scenario-based simulations were developed, incorporating variations in vegetation cover, green roof implementation, and surface materials (permeable and reflective), aiming to evaluate which configurations most effectively improve outdoor thermal comfort, optimize PET values, and contribute to long-term thermal resilience. In this research, we aim to identify (1) which scenario most effectively enhances outdoor thermal comfort, (2) determine the time of day most suitable for pedestrian activity in terms of thermal conditions, and (3) statistically assess which microclimatic parameter most significantly influences PET.
2. Materials and Methods
2.1. Study Area and Climatic Context
This study was conducted on Cumhuriyet Street in Van Province, an Eastern Anatolian city located on the eastern shores of Lake Van in eastern Turkey, within a semiarid climate zone (Figure 1). The region is characterized by hot, dry summers, with daily average maximum temperatures frequently exceeding 35.0 °C in July and August, and low annual precipitation [].
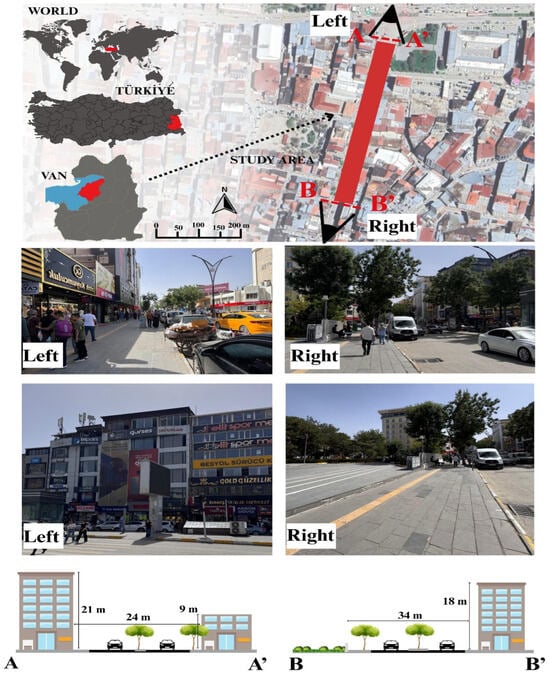
Figure 1.
The location of Cumhuriyet Street, which was determined as the study area, and the view of the pavement on the left side of the street and the view of the pavement on the right side of the street, including representative sections of the general layout of the street.
Cumhuriyet Street, selected as the study area, is used both as a pedestrian and vehicle path and has a total length of 2.80 km. Located in the city center of Van Province and oriented north–south, the study area is surrounded by 3- to 7-story buildings. The meteorological station established in this area is located at latitude 38°30′12.56″ N, longitude 43°23′44.98″ E, and an altitude of 1725 m.
For use in the ENVI-met climate simulation: A 170-m-long and 100-m-wide section of Cumhuriyet Street, starting from the climate station established in the garden of the Van Governor’s Office, was selected as the microclimate study area. This area, delimited for use in the study, includes business buildings, a covered bazaar, two pedestrian paths (the widest part of the left pedestrian path is 7.5 m and the narrowest part is 2.2 m; the widest part of the right pedestrian path is 5.5 m and the narrowest part is 3.3 m); two vehicle paths (the widest part of the left pedestrian path is 8 m and the narrowest part is 4.2 m; the widest part of the right pedestrian path is 10.6 m and the narrowest part is 5.2 m); and one central reservation (the widest part is 10.9 m and the narrowest part is 0.8 m). While there is a 43-m-wide structural area along the left side of the canyon, there is a 39.5-m-wide structural area along the 80-m-long section of the right side of the canyon (Figure 1).
This street was selected from the three most heavily used streets in Van province because the pedestrian paths on both sides are unequal. While the pedestrian path on the right side has some shade-providing trees, the pedestrian path on the left side of the study area lacks trees, resulting in prolonged exposure to sunlight, especially at midday, minimal vegetation, impermeable pavements, and its location in an area with high pedestrian traffic throughout the day. This street section has been identified as a critical area for microclimatic intervention due to prolonged exposure to solar radiation, lack of shade, and thermal discomfort experienced during the summer months.
2.2. Microclimate Data Acquisition and Simulation Inputs
A meteorological station was established in the garden of the Governor’s Office along Cumhuriyet Street, the designated study area, to record microclimate parameters. The station was equipped with a Davis Vantage Pro2, a device capable of measuring indoor and outdoor temperature, wind speed and direction, apparent (perceived) temperature, precipitation, humidity, and barometric pressure (radiation). The device was permanently installed at a height of 1.5 m above ground level. Protective enclosures were used to shield the equipment from potential environmental damage. Microclimatic data were recorded hourly throughout the year 2024, with a particular focus on August, identified as the hottest month based on long-term climate records from the Turkish State Meteorological Service []. Data parameters used in the analysis included air temperature (Ta, °C), relative humidity (RH, %), wind speed (W, m/s), and cloudiness (measured in octas). These measurements formed the basis for simulation calibration and thermal comfort assessment in the study area (Figure 2).
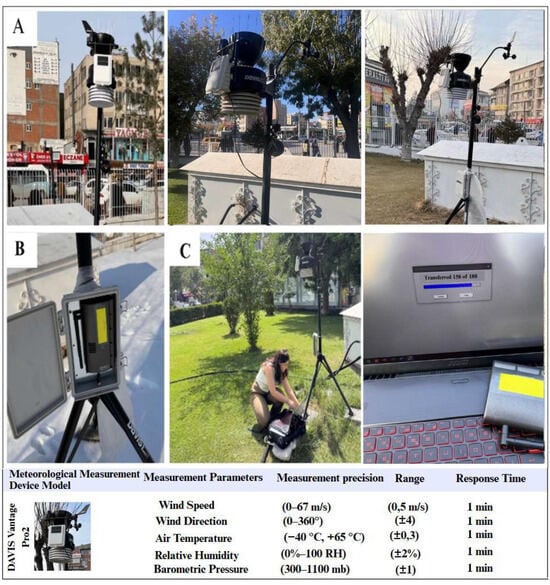
Figure 2.
Climate monitoring equipment and data collection used in the study, (A) Images of the climate station from different directions, (B) data logger for real-time measurements, (C) storage unit for recorded climate data.
The method and workflow used in this study are illustrated in Figure 3.
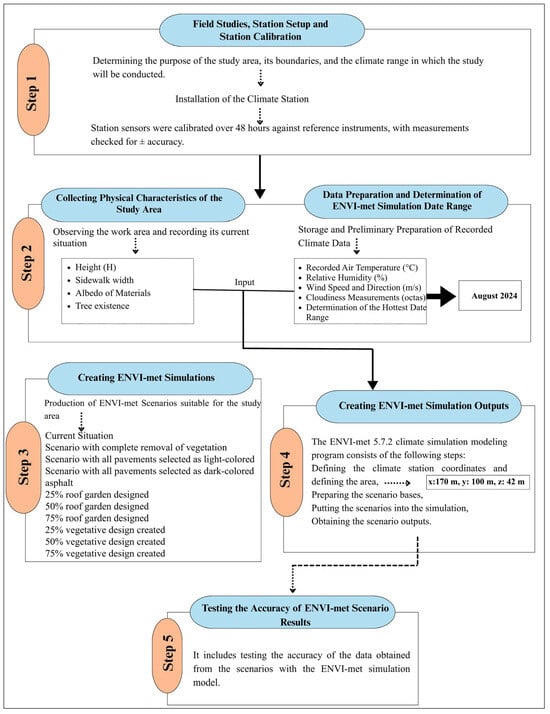
Figure 3.
Workflow diagram of the study.
2.3. Simulating Climate Data Using ENVI-Met BIO + Science Software Version 5.7.2
ENVI-met, which has been used in many studies in recent years to mitigate the negative effects of UHI [,,], is the most widely used urban microclimate simulation tool globally, capable of performing high-resolution 3D simulations in a defined spatial domain including ceiling, floor, and elevation parameters [,].
ENVI-met combines various elements of urban areas and landscape environments in climate modeling, enabling the establishment of interactions between atmospheric conditions, vegetation, architectural structures, and materials [].
In order to evaluate the thermal performance of the proposed urban design alternatives during the hottest hours of the day, a representative 3D model of the subject street was created using ENVI-met 5.7.2, a widely recognized urban microclimate simulation software. ENVI-met’s advantage is its ability to model daily temperature fluctuations, assess radiation balance, and analyze local thermal comfort indicators such as PET, Mean Radiant Temperature (Tmrt), and airflow patterns [,]. It provides dynamic and local outputs under different environmental and morphological conditions, enabling a context-sensitive and data-driven design process.
In this study, the obtained microclimate data were used in the ENVI-met 5.7.2 BIO + Science model. The model domain consisted of 170 × 100 × 42 cells with a horizontal resolution of 1 m, a vertical total height of 42 m, and a uniform distribution of the 42 cells; therefore, the vertical stretching ratio was set to 20%. A one-way nested grid was applied to provide a detailed representation of the surface features around the study area. Initial meteorological conditions were obtained from in situ measurements, and the simulation was run for a period of 48 h; a 2-h return period was defined at the beginning for the model to reach equilibrium. All modeling details are listed in Table 2. Simulation outputs were obtained using the “LEONARDO” and “BIO-met” post-processing modules of ENVI-met. PET values were calculated with the BIO-met plugin, which includes environmental parameters and metabolic constants to evaluate human thermal comfort at the pedestrian level [,,].

Table 2.
Input data used in ENVI-met simulation.
Statistical outputs for each scenario were analyzed across five critical time intervals: 10:00, 12:00, 14:00, 16:00, and 18:00. Visual analysis focused on 14:00, when PET values were highest. Each scenario was simulated for a total of 48 h, including a 24-h preparation period for August’s average values to ensure microclimatic conditions were balanced. Mean, minimum, and maximum values were calculated for all parameters, and visualized with heat maps, comparative graphs, and descriptive tables.
Table 3 presents the measured microclimate parameters for the validation date. The maximum air temperature recorded was 29.6 °C, the minimum was 17.9 °C, and the daily average temperature was 24.5 °C. Relative humidity ranged from a maximum of 62.0% to a minimum of 33%, with an average of 43%. Wind speeds peaked at 6.4 m/s, with an average speed of 2.6 m/s throughout the day.

Table 3.
Hourly air temperature, relative humidity and wind speed values recorded in August 2024.
Validation of ENVI-met simulation outputs using observed climate data from the fixed meteorological station on Cumhuriyet Street was essential to ensure the reliability of the model results. Although hourly measurements of air temperature (°C), relative humidity (%), wind speed (m/s), and wind direction were available for August in the study area, ENVI-met simulations were conducted using the average values of these hourly parameters. As a result, only hourly air temperature and relative humidity data were compared directly with the corresponding ENVI-met simulation results.
ENVI-met, which has recently gained widespread use in climate-related research, has been extensively validated for applications in urban microclimate modelling [,,], thermal comfort simulation [], and in the study of water bodies’ effects on urban thermal conditions [].
A statistical analysis was conducted by comparing climate data measured in August 2024 on Cumhuriyet Street in Van Province with values predicted by ENVI-met simulations. To evaluate the relationship between the measured and simulated data, Kendall’s tau, Spearman’s rho (rank correlation coefficients), and the Pearson correlation test were applied. These statistical methods helped assess both the strength and direction of the association between variables.
In the accuracy analysis, air temperature (°C) and relative humidity (%) are critical variables for verifying the performance of the simulation model. To calibrate the model for August 2024, observed (O) and predicted (P) data were evaluated using the fit index (d), correlation coefficient (R2), root mean square error (RMSE), and mean absolute error (MAE). A model is considered accurate if the MBE/MAE ratio falls between 0 and 1, as suggested by []. The formula and abbreviations of the formula used in the accuracy analysis:
D: fit index (-) = 1;
MAE: Mean absolute error (-);
MBE: Mean bias error (-);
ND: Number of analyzed data (-);
Ố: The mean of the observed variable;
Oj: For each j moment, the variables are;
Pj: Model-estimated variables for each j moment [].
The values between the measured and simulated air temperature and relative humidity in the study area are 0.92, indicating a strong correlation. The RMSE values for air temperature and relative humidity are 3.66, an acceptable value. Similarly, the MBE/MAE values are 0.58, between 0 and 1, further supporting the model’s accuracy (Figure 4).
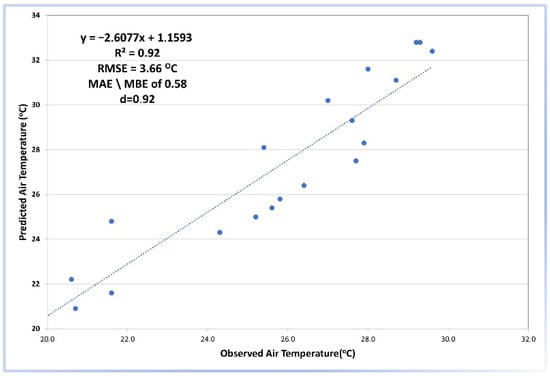
Figure 4.
Correlation between measured and simulated air temperature and relative humidity.
While there are minor discrepancies between the observed and predicted data, the obtained RMSE and MAE values confirm the reliability of the ENVI-met estimates in this study. The obtained results demonstrate that the ENVI-met model can be used to assess urban thermal environments.
The measured and simulated air temperature and relative humidity values for August, along with their correlations, are shown in Figure 4.
2.4. Design Scenarios for Thermal Comfort Enhancement on Cumhuriyet Street
A total of nine design scenarios were developed for Cumhuriyet Street, consisting of one baseline model and eight alternative configurations. These scenarios were designed to represent a comprehensive range of nature-based (green infrastructure) and material-based interventions in urban street design (Figure 5). Given that vegetation within urban canyons significantly contributes to shading and UHI mitigation [], the scenarios incorporated variations such as green roofs, street tree planting, and modified surface materials. These elements were selected based on their known influence on wind flow, thermal regulation, and pedestrian comfort. The detailed characteristics of each landscape design scenario are summarized in Table 4.
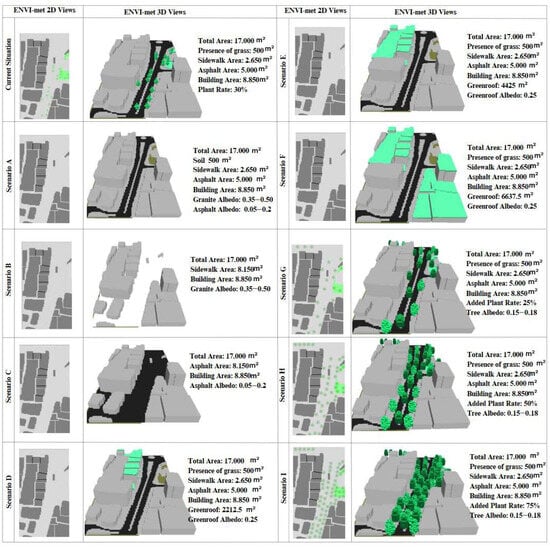
Figure 5.
Scenarios created for the study area.

Table 4.
Summary of urban design scenarios used in the ENVI-met simulation.
Each scenario was assessed based on its influence on five key microclimatic parameters: air temperature (°C), relative humidity (%), mean radiant temperature (Tmrt, °C), wind speed (m/s), and PET—a comprehensive index of human thermal perception.
3. Results and Discussion
3.1. Microclimate Parameters in Different Scenarios
The distribution and intensity of air temperature (°C), relative humidity (%), wind change rate (%), mean radiant temperature (Tmrt, °C), and PET as simulated by ENVI-met for 14:00—the time of peak daytime heat—are presented in Figure 6, Figure 7, Figure 8, Figure 9 and Figure 10. The base scenario, representing current conditions with minimal vegetation and mixed ground surfaces, resulted in the highest level of heat stress, with a PET value of 59.3 °C at 14:00, surpassing the 42.0 °C threshold that indicates extreme heat stress. This value falls within the “very hot” category in thermal comfort classification and poses a serious risk to human health and activity in outdoor urban environments [].
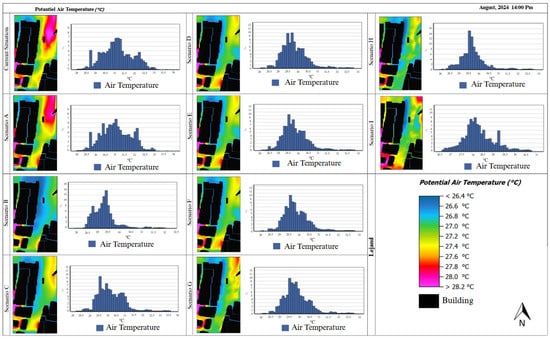
Figure 6.
Temperature analyses and graphs of ENVI-met scenarios.
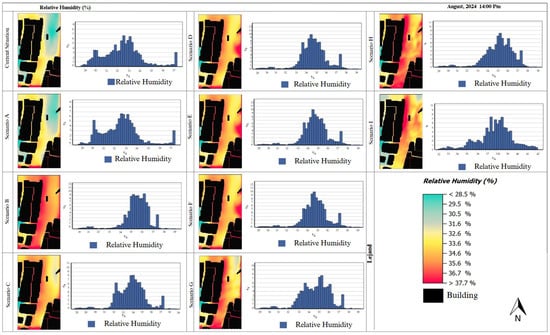
Figure 7.
ENVI-met scenarios humidity analysis and graphs.
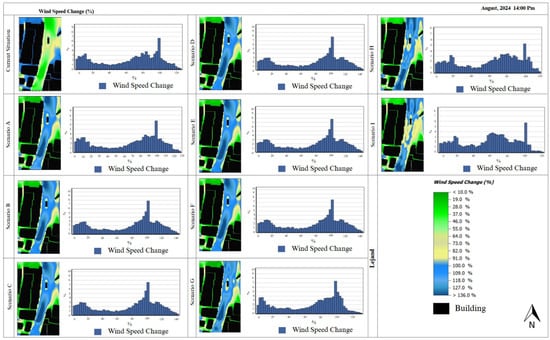
Figure 8.
ENVI-met scenarios wind speed change rate analyses and graphs.
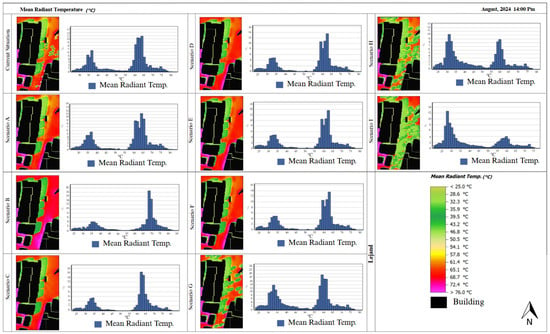
Figure 9.
ENVI-met scenarios Tmrt rate analyses and graphs.
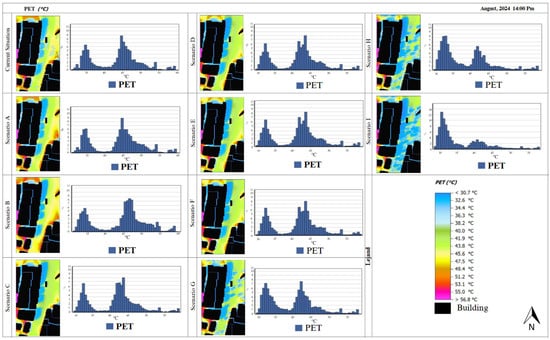
Figure 10.
PET analysis and graphical representation of ENVI-met simulation scenarios.
In contrast, scenarios incorporating vegetation and reflective surface materials led to substantial reductions in both actual and perceived thermal conditions. Notably, Scenario I, which featured 75% street vegetation coverage, demonstrated the most effective cooling performance. In this scenario, the maximum PET value decreased to 58.5 °C, accompanied by a 3.0 °C reduction in air temperature and a 0.8 °C reduction in PET.
These findings are consistent with the conclusions of Bowler et al. [] and Gunawardena et al. [], affirming the critical role of extensive vegetative cover in achieving meaningful cooling effects in hot and arid urban environments.
3.2. Temporal Analysis of Microclimate Parameters in Different Scenarios
ENVI-met simulations conducted to identify pedestrian-friendly thermal comfort criteria produced temporal distribution graphs for air temperature (Figure 6), relative humidity (Figure 7), wind speed variation (Figure 8), mean radiant temperature (Tmrt, Figure 9), and PET, Figure 10. All scenarios followed a similar daily pattern, with PET values peaking between 13:00 and 15:00. However, visualizations were focused on 14:00, the time of day when pedestrian activity is at its highest. Notably, vegetation-based scenarios effectively delayed and moderated the peak PET values, serving as a buffer against rapid heat accumulation. This has significant implications for pedestrian thermal safety and comfort, as it promotes a more gradual rise in heat exposure and reduces the risk of prolonged thermal stress. Furthermore, due to the urban canyon-like morphology of the street, wind speed remained generally low across all scenarios. However, in Scenario G, which featured a scattered, low-percentage vegetation layout, plant-induced turbulence slightly increased local airflow, contributing to convective cooling (Figure 8).
3.3. Surface Material and Impact on Microclimate and Thermal Comfort
In Scenario A, which includes mixed surface materials with no vegetation and unchanged pavements, no significant changes were observed in either the average or maximum air temperature or in PET values at 14:00. In contrast, Scenario B, which incorporates high-albedo materials, resulted in a 1.8 °C reduction in both average and maximum air temperatures at 14:00. Additionally, this scenario led to a 3.1% increase in average humidity, a 15.2% increase in wind speed, a 6.9 °C rise in average Tmrt, and a 0.3 °C increase in PET. Among the surface pavement modification scenarios, only Scenario B—featuring high-albedo surfaces—demonstrated a noticeable cooling effect. However, it was still less effective than vegetation-based scenarios.
This outcome is likely due to the tendency of reflective surfaces to redirect solar radiation onto adjacent buildings and pedestrians, causing both visual and thermal discomfort []. Supporting this, previous studies have shown that cool asphalt and reflective pavement materials can reduce surface temperatures by up to 9.0 °C, and pedestrian-level air temperatures by 0.6 to 1.2 °C [].
Similarly, in Scenario C, where all surface materials were replaced with dark asphalt and there was no vegetation, the average air temperature at 14:00 increased by 1.0 °C, while thermal comfort decreased. Although humidity remained unchanged, wind speed increased by 15.9%, and the average PET value decreased by 2.4 °C. Previous ENVI-met analyses have found that light-colored basalt and concrete pavements can reduce surface temperatures by approximately 3.0 °C [].
The improvement in PET values observed in Scenario C is largely attributed to increased wind flow. Among all the tested configurations, this low-albedo, non-vegetated scenario had the highest wind speed change rate (91.1%). Despite having the highest Tmrt values, likely due to the thermal properties of dark-colored materials—which absorb large amounts of solar radiation during the day and release it as heat during the night—wind circulation helped moderate PET.
The airflow within the street canyon positively influenced PET, though it is widely acknowledged that vegetation reduces wind speed. When trees and shrubs are not strategically arranged, they may obstruct wind circulation, leading to reduced airflow [,]. As tree cover increases, wind speed tends to decrease further—an effect that aligns with the seasonal growth patterns of deciduous trees. Both temperature and wind speed are critical factors in determining urban heating and cooling needs. Data show that increasing tree coverage from 10% to 20% results in further wind speed reductions [].
Numerous studies have used infrared thermometer sensors, typically mounted 1.5–2 m above ground, to evaluate the surface temperatures of various paving materials in different cities and climates. Consistent with this study, global findings show that dark asphalt and treated wood surfaces tend to be the hottest, while light-colored surfaces remain significantly cooler []. Similar study confirmed that hard surface coverings, such as concrete, asphalt, and parquet, tend to reduce overall thermal comfort in outdoor spaces [].
3.4. Roofs and Impact on Microclimate and Thermal Comfort
Analysis of the simulation results for roof garden scenarios at 14:00 indicates that all configurations contributed to a 1.1 °C reduction in maximum air temperature. Specifically, Scenario D (25% roof garden) and Scenario E (50% roof garden) reduced average air temperature by 1.3 °C, while Scenario F (75% roof garden) achieved a slightly greater reduction of 1.4 °C.
In terms of average relative humidity, no significant differences were observed between the scenarios. The most notable change in wind speed occurred in Scenario E, which showed an increase of 15.8%. The mean radiant temperature (Tmrt) decreased uniformly by 1.5 °C across all roof garden scenarios. Regarding PET, each scenario resulted in a 0.5 °C decrease in maximum PET and a 2.3 °C reduction in average PET.
These findings support existing literature suggesting that cool roof technologies, such as green roofs and green walls, provide a viable strategy for mitigating urban heat. Such systems are known to reduce building surface temperatures and improve thermal comfort []. Green roofs on buildings of various heights around the study area were found to have positive effects on pedestrian-level thermal conditions. Jamei et al. [] reported that green roofs increased roof-level air temperature by approximately 1.3 °C and PET by 2.38 °C, contributing to a cumulative cooling effect at the neighborhood scale. This supports Taleghani’s [] position on the neighborhood-wide benefits of green infrastructure. Although this study focuses exclusively on daylight hours, green roofs are also known to reduce nighttime UHI by limiting daytime heat storage. A related study in Australia found that applying cool roof materials to individual buildings could reduce indoor air temperatures by up to 12.0 °C [].
Given the cold-dry climate of Van Province and the limited research on the UHI mitigation potential of green roofs in such regions, this study developed three scenarios to explore their effectiveness. While increasing the proportion of green roof coverage did not significantly affect PET values, the optimal time for PET across all scenarios was identified as 6:00 p.m. The best-performing scenario was Scenario D (25% green roof), which yielded a PET value of 25.3 °C. In a broader review, Jamei et al. [] analyzed green roof studies conducted in various geographic and climatic contexts, concluding that green roof research is relatively scarce in arid and semi-arid climates—further reinforcing the relevance of the present study.
3.5. Vegetation Coverage and Impact on Microclimate and Thermal Comfort
Analysis of the scenarios with increased afforestation rates revealed a consistent decrease in average air temperature, from 31.1 °C in Scenario G to 28.2 °C in Scenario I—a total reduction of 2.9 °C. While there was no significant change in average and maximum humidity values, Scenario I recorded the highest increase in humidity at 5.6%. Scenario I also showed a 9.6% decrease in average wind speed and the most substantial reduction in average mean radiant temperature (Tmrt), dropping from 62 °C to 33.2 °C. In this scenario, 75% of the street was planted and shaded at noon. The average PET also decreased from 44.7 °C in Scenario G to 32.2 °C in Scenario I, with a maximum reduction of 12.5 °C.
When the scenarios were analyzed based on average PET values, a 5.7 °C decrease was observed at 16:00 between the scenario with no vegetation and the one with 75% vegetation cover. Similarly, at 14:00, the PET value decreased from 44.7 °C in the no-vegetation scenario (Scenario A) to 32.2 °C in Scenario I, indicating a difference of 12.5 °C. This significant reduction demonstrates that Scenario I has a highly positive effect on thermal comfort. In other words, the scenarios indicated that the greatest improvement occurred when vegetation cover was maximized.
The analysis also showed that wind speed tended to decrease with increasing vegetation. As noted by Norouzi et al. [], dense vegetation can obstruct air flow, thereby influencing thermal comfort conditions. Qaid et al. [] also emphasized that wind speed is a primary factor in reducing the PET thermal index.
Scenario analysis revealed a strong positive correlation between Tmrt and PET scenarios with higher Tmrt values also showed higher PET values. In the no-vegetation scenario, the peak average Tmrt at 14:00 reached 62.5 °C, while in Scenario I, it was only 33.2 °C at the same hour—a notable difference of 29.3 °C. Similarly, Haeri et al. [] reported that extensive tree foliage helps capture solar radiation, reducing Tmrt and thus improving PET. They also noted that improvements in thermal comfort after 14:00 are linked to the changing angle of solar incidence. Based on these results, deciduous trees suitable for the characteristics of that region should be preferred. Among all scenarios, the greatest reduction in wind speed—an average of 62.9%—was recorded in Scenario I with 75% vegetation. This is generally attributed to the inability of wind to circulate freely in densely vegetated spaces, leading to a reduction in speed [].
The study concluded that the extent of vegetation plays a crucial role in enhancing outdoor thermal comfort. Broad-leaved tree species significantly lower Tmrt by blocking direct sunlight, particularly around noon. The lowest average Tmrt (33.2 °C at 2:00 p.m.) was observed in the scenario with the highest tree density (Scenario I), while the highest (68.9 °C) occurred in Scenario C, which featured dark asphalt pavement. This 35.7 °C difference also impacted PET, thereby influencing pedestrian thermal comfort. These findings align with those of Zölch et al. [], who highlighted the importance of evenly distributed tree cover along pedestrian paths for improving microscale thermal comfort. Furthermore, average PET values fell below 35.0 °C only in Scenario I, marking a transition from the “extremely hot” to the “warm” thermal category. This shift is particularly beneficial for vulnerable populations such as children and the elderly []. According to the World Health Organization, elevated urban temperatures pose serious health risks, contributing to increased hospital admissions and heat-related mortality during extreme heat events.
Vegetation density and spatial arrangement are widely recognized in the literature as the most influential factors in determining microclimatic performance [,,]. However, design practices in semi-arid cities must account for local constraints such as water scarcity, soil structure, and maintenance capacity. Therefore, drought-tolerant and native plant species should be prioritized.
Material strategies, including high-albedo pavements and green roofs, can enhance comfort and energy efficiency but should be integrated within a multi-layered design framework. In fact, the parameters that affect outdoor thermal comfort conditions are more closely related to improper land use practices in urban spaces than to the number of vehicles or the population. Moreover, the failure to consider the natural resources of the area in planning processes further exacerbates these problems []. This study also highlights the essential role of simulation tools like ENVI-met in supporting climate-responsive urban design. Scenario-based modeling helps mitigate risks and enhances design effectiveness by predicting thermal outcomes prior to physical implementation [,,].
The results of this study also revealed that nature-based scenarios were found to be more advantageous. Indeed, in recent years, there has been an increasing tendency toward nature-based solutions, primarily due to their sustainability. This is because nature-based approaches utilize locally available resources within the area, which require minimal maintenance and cost, thus making them economically efficient. In urban environments, the use of water surfaces can be proposed as a system that operates through water recirculation at specific times of the day, ensuring efficient water use. Regarding trees, species that naturally grow in the region and require little maintenance were selected in these scenarios. This approach will provide a significant economic advantage for local administrations.
3.6. Microclimate Parameters and Their Correlation with PET
The scatter plots and regression line analysis in Figure 11 illustrate the correlation between the independent variables of the PET thermal index and various climate variables—specifically air temperature, humidity, wind velocity, and cloud cover. The analysis reveals a strong positive correlation between PET and air temperature (R2 = 0.74), indicating that PET tends to increase significantly with rising temperatures. In contrast, a moderately negative correlation is observed between PET and humidity (R2 = −0.33), suggesting that higher humidity levels are associated with a decrease in PET. Additionally, a weak positive correlation (R2 = 0.12) is found between PET and wind velocity, while a very weak positive correlation (R2 = 0.01) is noted between PET and cloud cover.
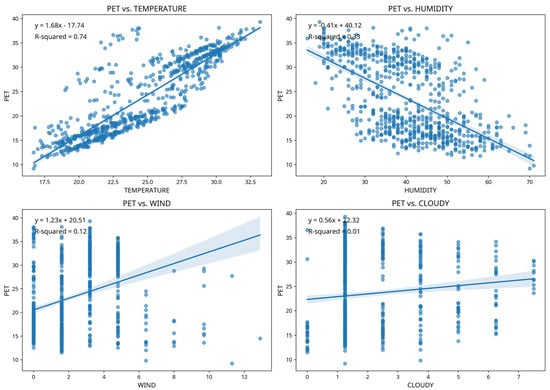
Figure 11.
Regression line correlation between PET and climate variables.
These relationships are further validated by the correlation heatmap matrix presented in Figure 12a–c, which reports coefficients for Pearson (r), Spearman (ρ), and Kendall (τ) correlation analyses. Across all three methods, temperature and PET show the strongest positive correlation: Pearson r = 0.85819, Spearman ρ = 0.87351, and Kendall τ = 0.71446 with the p-value for all measures being highly significant is (p < 0.0001). The next strongest relationship is a highly significant negative correlation between temperature and humidity: Pearson r = −0.7669, Spearman ρ = −0.76151, and Kendall τ = −0.5794, also with the p-value (p < 0.0001) for all. Moderate positive correlations are observed between temperature and wind (Pearson r = 0.49445, Spearman ρ = 0.58737, Kendall τ = 0.45325, where the p-value is consistently highly significant (p < 0.0001). Conversely, the relationship between cloudy and humidity is very weak and statistically insignificant across all measures, as their p-values exceed the standard 0.05 threshold (Pearson r = 0.09744, Spearman ρ = 0.20895, and Kendall τ = 0.20747).
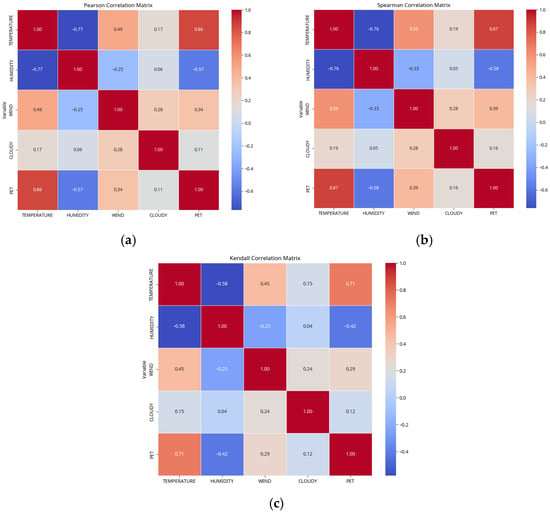
Figure 12.
Heatmap Matrix of (a) Pearson (r), (b) Spearman (ρ), (c) Kendall (τ) Correlations for PET and climate variables.
In conclusion, air temperature is the most influential variable affecting PET and serves as the strongest positive indicator. While other variables—such as humidity, wind velocity, and cloud cover—also have statistically significant impacts, their relationships with PET are considerably weaker.
4. Conclusions
The data from this study indicate that, in semi-arid cities, nature-based interventions—such as strategically placed dense vegetation and complementary roof gardens—are the most effective strategies for mitigating UHI effects and improving outdoor thermal comfort. Specifically, the results demonstrate that a UHI mitigation strategy incorporating green infrastructure elements, such as replacing surface materials with light-colored pavements, implementing roof gardens, and increasing planting rates, can significantly enhance thermal conditions in high-traffic, pedestrian-friendly streets.
Simulation results show that removing vegetation from the current scenario has only a limited impact on the microclimate, yielding similar results to the baseline. Conversely, replacing surface pavements with high-reflectivity (albedo) materials led to a 1.8 °C reduction in both mean and maximum air temperatures, representing the most positive microclimatic effect. In contrast, substituting surface materials with dark asphalt increased thermal discomfort due to solar radiation reflecting off building facades and onto pedestrians, although no significant changes were observed in air temperature or PET values.
Analysis of roof garden scenarios revealed a consistent reduction in air temperature, with a 1.1 °C decrease in maximum air temperature and a 2.3 °C reduction in average PET values. These changes are considered highly beneficial for enhancing thermal comfort.
In scenarios involving different vegetation densities, a notable decrease in average mean radiant temperature (Tmrt) was observed due to the shading effect of leafy trees. Overall, scenarios with 50% or greater vegetation coverage were found to be the most effective in reducing air temperatures by increasing shaded areas during peak summer months. The scenario with the densest vegetation (75% coverage) recorded the lowest average Tmrt value at 28.8 °C. This scenario also showed a 2.9 °C decrease in air temperature and a 12.8 °C reduction in average PET at 14:00, marking the most substantial improvement across all cases.
Future research should explore long-term performance, seasonal variations, and socio-economic factors influencing implementation, particularly in water-scarce regions. Additionally, interdisciplinary studies that integrate urban design, landscape architecture, and environmental engineering will be vital to optimizing these strategies across diverse urban contexts. The outcomes of this research can benefit urban planners, landscape architects, municipal decision-makers, and environmental policymakers aiming to develop resilient, livable, and thermally comfortable urban spaces—especially in rapidly urbanizing semi-arid regions facing the challenges of climate change.
Author Contributions
Conceptualization, N.Y., Ş.A., S.Y. and E.J.; methodology, N.Y., Ş.A., S.Y. and E.J.; software, N.Y. and A.Q.; validation, N.Y., Ş.A., S.Y., A.Q. and E.J.; formal analysis, N.Y., Ş.A., S.Y., A.Q. and E.J.; statistical analysis, A.Q.; investigation, N.Y., Ş.A. and S.Y.; resources, N.Y., Ş.A. and S.Y.; data curation, N.Y.,A.Q. and Ş.A.; writing—original draft preparation, N.Y., Ş.A., S.Y., A.Q. and E.J.; writing—review and editing, N.Y., Ş.A., S.Y. and E.J.; visualization, N.Y., Ş.A., A.Q. and S.Y.; project administration, N.Y. and Ş.A. All authors have read and agreed to the published version of the manuscript.
Funding
This research benefited from the Van Yuzuncu Yil University Scientific Research Project (BAP) (Grant No: FKA-2023-10771) for the acquisition of the meteorological station, and the Van Yuzuncu Yil University Scientific Research Project (BAP) (Grant No: FBA-2025-11499) for the acquisition of the ENVI-met model. The ENVI-met software and microclimate data used in the analyses were obtained from the devices installed within the scope of the project. We would also like to acknowledge that this research work was partially financed by Kingdom University, Bahrain, from the research grant number KU-2025/2026.
Data Availability Statement
The original contributions presented in this study are included in the article. Further inquiries can be directed to the corresponding authors.
Acknowledgments
The authors gratefully acknowledge the financial support provided by this project. This article has been proofread with the help of AI.
Conflicts of Interest
The authors declare that the research was conducted in the absence of any commercial or financial relationships that could be construed as potential conflicts of interest.
References
- Oke, T.R. The energetic basis of the urban heat island. Q. J. R. Meteorol. Soc. 1982, 108, 1–24. [Google Scholar] [CrossRef]
- Santamouris, M. Analyzing the heat island magnitude and characteristics in one hundred Asian and Australian cities and regions. Sci. Total Environ. 2015, 512–513, 582–598. [Google Scholar] [CrossRef]
- Saaroni, H.; Amorim, J.H.; Hiemstra, J.A.; Pearlmutter, D. Urban Green Infrastructure as a tool for urban heat mitigation: Survey of research methodologies and findings across different climatic regions. Urban Clim. 2018, 24, 94–110. [Google Scholar] [CrossRef]
- Matzarakis, A.; Mayer, H.; Iziomon, M.G. Applications of a universal thermal index: Physiological Equivalent Temperature. Int. J. Biometeorol. 1999, 43, 76–84. [Google Scholar] [CrossRef]
- Bowler, D.E.; Buyung-Ali, L.; Knight, T.M.; Pullin, A.S. Urban greening to cool towns and cities: A systematic review of the empirical evidence. Landsc. Urban Plan. 2010, 97, 147–155. [Google Scholar] [CrossRef]
- Gunawardena, K.R.; Wells, M.J.; Kershaw, T. Utilising green and bluespace to mitigate urban heat island intensity. Sci. Total Environ. 2017, 584–585, 1040–1055. [Google Scholar] [CrossRef]
- Zölch, T.; Maderspacher, J.; Wamsler, C.; Pauleit, S. Using green infrastructure for urban climate-proofing: An evaluation of heat mitigation measures at the micro-scale. Urban For. Urban Green. 2016, 20, 305–316. [Google Scholar] [CrossRef]
- Irmak, M.A.; Yilmaz, S.; Yilmaz, H.; Ozer, S.; Toy, S. Evaluation of different thermal conditions based on thi under different kind of tree types-as a specific case in ata botanic garden in eastern Turkey. Glob. Nest J. 2013, 15, 131–139. [Google Scholar]
- Fu, X.; Zhang, T.; Tao, Y. The impact of the three-dimensional greening index on pedestrian thermal comfort in summer street canyons. Build. Simul. 2025, 18, 641–661. [Google Scholar] [CrossRef]
- Perini, K.; Magliocco, A. Effects of vegetation, urban density, building height, and atmospheric conditions on local temperatures and thermal comfort. Urban For. Urban Green. 2014, 13, 495–506. [Google Scholar] [CrossRef]
- Taleghani, M. Outdoor thermal comfort by different heat mitigation strategies: A review. Renew. Sustain. Energy Rev. 2018, 81, 2011–2018. [Google Scholar] [CrossRef]
- Irmak, M.A.; Yilmaz, S.; Mutlu, E.; Yilmaz, H. Assessment of the effects of different tree species on urban microclimate. Environ. Sci. Pollut. Res. 2018, 25, 15802–15822. [Google Scholar] [CrossRef]
- Yilmaz, S.; Mutlu, B.E.; Aksu, A.; Mutlu, E.; Qaid, A. Street design scenarios using vegetation for sustainable thermal comfort in Erzurum, Turkey. Environ. Sci. Pollut. Res. 2021, 28, 3672–3693. [Google Scholar] [CrossRef] [PubMed]
- Ertem Mutlu, B.; Yılmaz, S. Determining the Effect of Different Green Space Ratios on Outdoor Thermal Comfort through ENVI-met Analysis: The Case of Erzurum. J. Adnan Menderes Univ. Agric. Fac. 2024, 21, 17–23. [Google Scholar]
- Sarı, E.N.; Nouri, A.S.; Ekşi, M.; Matzarakis, A. Assessing thermo-physiological effects of different tree species within the inner regions of the urban canyon; confronting in-situ extreme heat stress in Istanbul during the El-Niño summer of 2023. Int. J. Biometeorol. 2025, 69, 1663–1686. [Google Scholar] [CrossRef] [PubMed]
- Li, Y.; Liu, X.; Cheshmehzangi, A.; Zahed, L.M.; He, B.J. Multidimensional factors affecting tree-induced cooling benefits: A comprehensive review. Build. Environ. 2025, 282, 113242. [Google Scholar] [CrossRef]
- Toy, S.; Yilmaz, S. Evaluation of urban-rural bioclimatic comfort differences over a ten-year period in the sample of Erzincan city reconstructed after a heavy earthquake. Atmósfera 2010, 23, 387–402. [Google Scholar]
- Irmak, M.A.; Yilmaz, S.; Mutlu, E.; Yilmaz, H. Analysis of different urban spaces on thermal comfort in cold regions: A case from Erzurum. Theor. Appl. Climatol. 2020, 141, 1593–1609. [Google Scholar] [CrossRef]
- Yang, M.; Ye, P.; He, J. Green and Blue Infrastructure for Urban Cooling: Multi-Scale Mechanisms, Spatial Optimization, and Methodological Integration. Sustain. Cities Soc. 2025, 129, 106501. [Google Scholar] [CrossRef]
- Li, M.; Wang, C.; Wu, Y.; Santamouris, M.; Lu, S. Assessing spatial inequities of thermal environment and blue-green intervention for vulnerable populations in dense urban areas. Urban Clim. 2025, 59, 102328. [Google Scholar] [CrossRef]
- Yilmaz, S.; Menteş, Y.; Jamei, E. Investigating the Effect of Blue–Green Infrastructure on Thermal Condition—Case Study: Elazığ, Turkey. Land 2025, 14, 891. [Google Scholar] [CrossRef]
- Yilmaz, H.; Toy, S.; Irmak, M.A.; Yilmaz, S.; Bulut, Y. Determination of temperature differences between asphalt concrete, soil and grass surfaces of the City of Erzurum, Turkey. Atmósfera 2008, 21, 135–146. [Google Scholar]
- Takebayashi, H.; Moriyama, M. Study on the urban heat island mitigation effect achieved by converting to grass-covered parking. Sol. Energy 2009, 83, 1211–1223. [Google Scholar] [CrossRef]
- Lin, T.P.; Matzarakis, A.; Hwang, R.L.; Huang, Y.C. Effect of pavements albedo on long-term outdoor thermal comfort. Berichte Meteorol. Inst. Albert-Ludwigs-Universität Freiburg 2010, 497, 497–503. [Google Scholar]
- Chen, J.; Wang, H.; Zhu, H. Analytical approach for evaluating temperature field of thermal modified asphalt pavement and urban heat island effect. Appl. Therm. Eng. 2017, 113, 739–748. [Google Scholar] [CrossRef]
- Li, Q.; Zhang, X.; Hang, J. Numerical investigations of cool coatings on building envelopes for urban heat mitigation with various street aspect ratios. Sustain. Cities Soc. 2024, 107, 105410. [Google Scholar] [CrossRef]
- Zeren Cetin, I.; Adiguzel, F.; Sandal, E.K.; Dinc, Y. Enhancing bioclimatic conditions in urban open spaces through surface material selection: The case of Adan). Environ. Dev. Sustain. 2025, 1–16. [Google Scholar] [CrossRef]
- Jamei, E.; Thirunavukkarasu, G.; Chau, H.W.; Seyedmahmoudian, M.; Stojcevski, A.; Mekhilef, S. Investigating the cooling effect of a green roof in Melbourne. Build. Environ. 2023, 246, 110965. [Google Scholar] [CrossRef]
- Wai, C.Y.; Chau, H.W.; Paresi, P.; Muttil, N. Experimental Analysis of Cool Roof Coatings as an Urban Heat Mitigation Strategy to Enhance Thermal Performance. Buildings 2025, 15, 685. [Google Scholar] [CrossRef]
- Heschong, L. Thermal Delight in Architecture, 1st ed.; MIT Press: Cambridge, MA, USA, 1979. [Google Scholar]
- Zhang, X.; Zhang, Y.; Yun, J.; Yao, W. A systematic review of the anxiety-alleviation benefits of exposure to the natural environment. Rev. Environ. Health 2022, 38, 281–293. [Google Scholar] [CrossRef]
- De Luca, F. Advances in climatic form finding in architecture and urban design. Energies 2023, 16, 3935. [Google Scholar] [CrossRef]
- Jamei, E.; Rajagopalan, P. Effect of street design on pedestrian thermal comfort. Archit. Sci. Rev. 2018, 62, 92–111. [Google Scholar] [CrossRef]
- Janeka, P.; Föllmer, J.; Martinez, J.A.; Schrammeijer, E.A.; Hertig, E.; van Rompay, T.J.L.; Cerrone, D.; Sawungrana, A.R.; Anthonj, C. How green and blue spaces promote health among vulnerable urban populations facing climate hazards. A scoping review. Wellbeing Space Soc. 2025, 9, 100304. [Google Scholar] [CrossRef]
- Roy, T.B.; Middey, A.; Krupadam, R.J. Unveiling the microclimate: A comprehensive review of tools, techniques, and future directions for sustainable cities. Build. Environ. 2025, 274, 112726. [Google Scholar] [CrossRef]
- Xiao, Q.; Fan, X.; Guo, Y.; Li, S.; He, W.; Deng, Y.; Xiao, Z.; Wang, P.; Wu, C. Tree form characteristics as criteria for tree species selection to improve pedestrian thermal comfort in street canyons: Case study of a humid subtropical city. Sustain. Cities Soc. 2024, 105, 105339. [Google Scholar] [CrossRef]
- Cui, D.; Chen, Y.; Zhang, Y.; Li, X. A study on the effect of vertical greening on the thermal environment of street canyons based on ENVImet simulation. E3S Web Conf. 2024, 490, 03004. [Google Scholar] [CrossRef]
- Nady Faragallah, R.; Ragheb, R.A. Evaluation of thermal comfort and urban heat island through cool paving materials using ENVI-Met. Ain Shams Eng. J. 2022, 13, 101609. [Google Scholar] [CrossRef]
- Yılmaz, S.; Kurt, A.; Gölcü, M. Effects of Different Landscape Design Scenarios on Pedestrian Thermal Comfort Using ENVI-met Simulations: Haydar Aliyev Street. Yüzüncü Yıl Univ. J. Agric. Sci. 2023, 33, 338–353. [Google Scholar]
- Haeri, T.; Hassan, N.; Ghaffarianhoseini, A. Evaluation of microclimate mitigation strategies in a heterogenous street canyon in Kuala Lumpur from outdoor thermal comfort perspective using Envi-met. Urban Clim. 2023, 52, 101719. [Google Scholar] [CrossRef]
- Cortes, A.; Rejuso, A.J.; Santos, J.A.; Blanco, A. Evaluating mitigation strategies for urban heat island in Mandaue City using ENVI-met. J. Urban Manag. 2022, 11, 97–106. [Google Scholar] [CrossRef]
- Abdulateef, M.F.; Majeed, F.A.; Al-Alwan, H.A.; Qasim, M.B. Assessing canyon geometry effect on the thermal comfort in a hot semi-arid climate: Baghdad city as case study. Ain Shams Eng. J. 2025, 16, 103247. [Google Scholar] [CrossRef]
- Ramdiana, D.N.; Yola, L. The Effect of Vegetation and Water Body on Thermal Comfort in Banteng City Park, Jakarta. Plan. Malays. 2023, 21, 262–273. [Google Scholar] [CrossRef]
- Fahed, J.; Kinab, E.; Ginestet, S.; Adolphe, L. Impact of urban heat island mitigation measures on microclimate and pedestrian comfort in a dense urban district of Lebanon. Sustain. Cities Soc. 2020, 61, 102375. [Google Scholar] [CrossRef]
- Chen, Y.; Deng, S.; Hou, Y.; Yan, Q. Impact of environmental elements in classical Chinese gardens on microclimate and their optimization using ENVI-MET simulations. Energy Build. 2025, 329, 115238. [Google Scholar] [CrossRef]
- Zhang, J.; Li, Z.; Hu, D. Effects of urban morphology on thermal comfort at the micro-scale. Sustain. Cities Soc. 2022, 86, 104150. [Google Scholar] [CrossRef]
- Kamata, Y.; Kang, J.E. Effect of greening vacant houses on improvement in thermal environment using ENVI-met simulation: A case study on Busan metropolitan city. Environ. Plan. B Urban Anal. City Sci. 2024, 51, 1308–1321. [Google Scholar] [CrossRef]
- MGM. Turkish State Meteorological Service. Van Province Climate Data. 2023. Available online: https://mgm.gov.tr (accessed on 4 May 2025).
- Yuca, N. The Impact of Lakes on Urban Thermal Comfort: A Case Study of Lake Van. Ph.D. Thesis, Van Yüzüncü Yıl University, Van, Türkiye, 2025. Available online: https://tez.yok.gov.tr/UlusalTezMerkezi/ (accessed on 10 May 2025).
- Song, D.; Niu, S.; Chen, L.; Wang, A.; Shi, X.; Zhou, X.; Jin, X. Influence of historical city walls on the water cooling effects in summer. Urban Clim. 2025, 59, 102310. [Google Scholar] [CrossRef]
- Elraouf, R.A.; ELMokadem, A.; Megahed, N.; Eleinen, O.A.; Eltarabily, S. Evaluating urban outdoor thermal comfort: A validation of ENVI-met simulation through field measurement. J. Build. Perform. Simul. 2022, 15, 268–286. [Google Scholar] [CrossRef]
- Lin, C.; Yang, J.; Huang, J.; Zhong, R. Examining the Effects of Tree Canopy Coverage on Human Thermal Comfort and Heat Dynamics in Courtyards: A Case Study in Hot-Humid Regions. Atmosphere 2023, 14, 1389. [Google Scholar] [CrossRef]
- Liu, Z.; Cheng, W.; Jim, C.Y.; Morakinyo, T.E.; Shi, Y.; Ng, E. Heat mitigation benefits of urban green and blue infrastructures: Asystematic review of modeling techniques, validation and scenario simulation in ENVI-met V4. Build. Environ. 2021, 200, 107939. [Google Scholar] [CrossRef]
- Qaid, A.; Lamit, H.B.; Ossen, D.R.; Shahminan, R.N.R. Urban heat island and thermal comfort conditions at micro-climate scale in a tropical planned city. Energy Build. 2016, 133, 577–595. [Google Scholar] [CrossRef]
- Alzahrani, A.; Gadi, M. Assessment of Modeled Mean Radiant Temperature in Hot and Dry Environments: A Case Study in Saudi Arabia. Climate 2024, 12, 91. [Google Scholar] [CrossRef]
- Liu, S.; Middel, A.; Fang, X.; Wu, R. ENVI-met model performance evaluation for courtyard simulations in hot-humid climates. Urban Clim. 2024, 55, 101909. [Google Scholar] [CrossRef]
- Yilmaz, S.; Toy, S.; Demircioglu Yildiz, N.; Yilmaz, H. Human population growth and temperature increase along with the increase in urbanisation, motor vehicle numbers and green area amount in the sample of Erzurum city, Turkey. Environ. Monit. Assess. 2009, 148, 205–213. [Google Scholar] [CrossRef] [PubMed]
- Battista, G.; Carnielo, E.; Vollaro, R.D.L. Thermal impact of a redeveloped area on localized urban microclimate: A case study in Rome. Energy Build. 2016, 133, 446–454. [Google Scholar] [CrossRef]
- Li, J.; Liu, N. The perception, optimization strategies and prospects of outdoor thermal comfort in China: A review. Build. Environ. 2020, 170, 106614. [Google Scholar] [CrossRef]
- Chan, S.Y.; Chau, C.K. On the study of the effects of microclimate and park and surrounding building configuration on thermal comfort in urban parks. Sustain. Cities Soc. 2021, 64, 102512. [Google Scholar] [CrossRef]
- Ren, Z.; Nikolopoulou, M.; Mills, G.; Pilla, F. Evaluating the influence of urban trees and microclimate on residential energy consumption in Dublin neighbourhoods. Build. Environ. 2025, 269, 112441. [Google Scholar] [CrossRef]
- Irmak, M.A.; Yilmaz, S.; Dursun, D. Effect of different pavements on human thermal comfort conditions. Atmósfera 2017, 30, 355–366. [Google Scholar] [CrossRef]
- Bozdogan Sert, E.; Kaya, E.; Adiguzel, F.; Cetin, M.; Gungor, S.; Zeren Cetin, I.; Dinc, Y. Effect of the surface temperature of surface materials on thermal comfort: A case study of Iskenderun (Hatay, Turkey). Theor. Appl. Climatol. 2021, 144, 103–113. [Google Scholar] [CrossRef]
- Garshasbi, S.; Feng, J.; Paolini, R.; Duverge, J.J.; Bartesaghi-Koc, C.; Arasteh, S.; Santamouris, M. On the energy impact of cool roofs in Australia. Energy Build. 2023, 278, 112577. [Google Scholar] [CrossRef]
- Jamei, E.; Chau, H.W.; Seyedmahmoudian, M.; Stojcevski, A. Review on the cooling potential of green roofs in different climates. Sci. Total Environ. 2021, 791, 148407. [Google Scholar] [CrossRef]
- Norouzi, M.; Chau, H.W.; Jamei, E. Design and Site-Related Factors Impacting the Cooling Performance of Urban Parks in Different Climate Zones: A Systematic Review. Land 2024, 13, 2175. [Google Scholar] [CrossRef]
- Zhou, K.; Zhong, L.; Liu, J.; Wang, Z.; Liu, J. Unveiling the Role of Western Pacific Subtropical High in Urban Heat Islands Using Local Climate Zones Coupled WRF-BEP/BEM. Earth Syst. Environ. 2025, 1–28. [Google Scholar] [CrossRef]
- Menteş, Y.; Yilmaz, S.; Qaid, A. The cooling effect of different scales of urban parks on land surface temperatures in cold regions. Energy Build. 2024, 308, 113954. [Google Scholar] [CrossRef]
- Qaid, A.; Ossen, D.R. Effect of asymmetrical street aspect ratios on microclimates in hot, humid regions. Int. J. Biometeorol. 2015, 59, 657–677. [Google Scholar] [CrossRef] [PubMed]
- Bruse, M.; Fleer, H. Simulating surface–plant–air interactions inside urban environments with a threedimensional Numerical model. Environ. Model. Softw. 1998, 13, 373–384. [Google Scholar] [CrossRef]
- Krelling, A.F.; Lamberts, R.; Malik, J.; Zhang, W.; Sun, K.; Hong, T. Defining weather scenarios for simulation-based assessment of thermal resilience of buildings under current and future climates: A case study in Brazil. Sustain. Cities Soc. 2024, 107, 105460. [Google Scholar] [CrossRef]
- Wai, C.Y.; Tariq, M.A.U.R.; Chau, H.W.; Muttil, N.; Jamei, E. A Simulation-Based Study on the Impact of Parametric Design on Outdoor Thermal Comfort and Urban Overheating. Land 2024, 13, 829. [Google Scholar] [CrossRef]
Disclaimer/Publisher’s Note: The statements, opinions and data contained in all publications are solely those of the individual author(s) and contributor(s) and not of MDPI and/or the editor(s). MDPI and/or the editor(s) disclaim responsibility for any injury to people or property resulting from any ideas, methods, instructions or products referred to in the content. |
© 2025 by the authors. Licensee MDPI, Basel, Switzerland. This article is an open access article distributed under the terms and conditions of the Creative Commons Attribution (CC BY) license (https://creativecommons.org/licenses/by/4.0/).