Abstract
Salinization in the western Songnen Plain has limited regional ecology and land use for decades, with its primary cause closely tied to sediment transport. To elucidate sediment evolution and its role in soil salinization, a borehole from saline-alkali land in Taonan County, west of the Songnen Plain, was investigated within an AMS14C, OSL, and ESR dating framework. Grain size analysis, end-member modeling, and major-element geochemistry revealed four transport components—fluvial, aeolian, glacio-fluvial, and lacustrine. Five provenance stages from the late Early Pleistocene to the Early Holocene were found: (1) distal weathered volcanic rock transport with minor fluvial–alluvial input; (2) proximal alluvial–proluvial transport; (3) ice meltwater and wind-driven transport; (4) predominantly wind transport; and (5) renewed fluvial–proluvial transport. These shifts correspond to regional paleoclimate fluctuations driven by global ice volume cycles, which control sediment supply, hydrology, and consequently salt accumulation in warm humid periods and upward salt migration in cold dry periods. The findings of this study demonstrate that Pleistocene glacial–interglacial climate cycles are the dominant driver of sediment transport and salinization dynamics on the western Songnen Plain.
1. Introduction
Since the 1930s and 1940s, significant progress has been made in understanding the causes and controlling factors of soil salinization in the Songnen Plain; despite these efforts, the salinization area is still expanding []. The development of soil salinization is related to geological tectonic patterns [,], hydrogeological conditions [,,], climate-related factors [,,], and human activities [,]. The results of preliminary studies on local geological and tectonic cycles suggest that the volcanic rocks of the Greater Hinggan Mountains may provide the initial source of soda salts in the plain, with the tectonic depression area providing a favorable background for water and salt accumulation and the arid climates during the Holocene facilitating the salinization process [,]. In terms of hydrogeological features, the groundwater depth in the soda saline-alkali land of the Songnen Plain ranges from about 1.5 to 3.0 m, with a mineralization level of 2–5 g/L, forming the material basis for salinization []. Driven by global warming, human agricultural activities, animal husbandry, and irrigation, the issue of salinization has been greatly exacerbated []. Whether it is the influence of terrain and structure, hydrological and climatic conditions, or human activities, the fundamental cause of salinization is the physical and chemical characteristics of the sediments themselves, which are directly influenced by sediment transport. In order to control the issue of salinization effectively, it is therefore necessary to strengthen research on the evolution of salinized sediment transport.
The aim of sediment transport analysis is to trace the sediment source and properties and reveal the formation background, transport, and deposition process [,]. A variety of methods are used for modern sediment transport analysis, including analysis of grain size [,,,,], major elements, trace elements, rare earth elements, isotopic compositions [,,], magnetic capacity [], mineralogy [], geochronology [], statistical analysis, etc. Among these, sediment grain size analysis is widely employed because of its convenience and low cost. Through the use of identification formulas and end-member models, great progress has been made in identifying the ways in which sediments are transported [,,,,,,], combined with the elements’ geochemical characteristics [,].
In this paper, we focus on sediment transport processes in salinized regions, taking a drilled core from the salt-alkali lands in Taonan County, western Songnen Plain, as the study object. The purpose of this study is to provide fundamental data to explore the impact of sediment transport on salinization, clarifying the causes and evolution of salinization in this region. The study findings hold significant theoretical and practical importance for fundamentally preventing soil salinization, improving soil quality, and enhancing land productivity.
2. Regional Setting
The western part of the Songnen Plain is located in Northeast China, bordering the eastern foothills of the Greater Hinggan Mountains to the west, the Horqin Sandy Land to the south, and the Lesser Hinggan Mountains to the north (Figure 1). Geomorphological features in this area include piedmont slope plain, low plain, and valley plain. The Quaternary system mainly includes the Lower Pleistocene Baitushan Formation, the Middle Pleistocene Daqinggou Formation, the Upper Pleistocene Guxiangtun Formation, the Holocene Datushan Formation, and the Tantu Formation []. The region has a temperate continental monsoon climate that ranges from semi-arid to semi-humid. In spring, the climate is dry with little rain and strong winds. In summer, rainfall is more concentrated. Autumns are characterized by less rain, and winters are cold. The average annual temperature is between 2 and 5.6 °C, with yearly precipitation of 350 to 400 mm and evaporation ranging from 1200 to 1900 mm [].
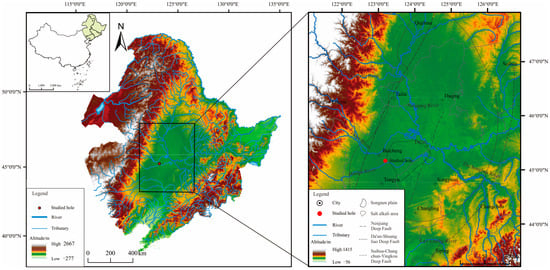
Figure 1.
Location background of the studied core.
3. Samples and Methods
3.1. Sample Description
The studied drilled core, TNZK06, is located in the tail area of the Huolin River, south of the Taoer River []. The terrain is low-lying, with soda saline-alkali soils []. In August 2024, a core of 50.6 m was recovered through continuous drilling with an automotive drilling machine. It was transported to a PVC tube immediately after removal of the core, and on-site description and recording were performed immediately before it was shipped to the laboratory. Sampling was conducted at 20 cm intervals. Before sampling, all knives were wiped clean and were pollution-free. The separated samples were packed into plastic sealed bags for freeze preservation.
The main characteristics of the drill lithology are shown in Figure 2. The 0–4.8 m depth consists of gray-brown, light yellow-brown sand–silt, with rust spots in the middle and lower parts, which are nodular. The 4.8–8.5 m depth features green-gray sand–silt with yellow layers of sand, together with some peat layers. The 8.5–13.4 m depth contains green-grey sand, horizontally bedded with small-angle inclined layers. The 13.4–17.9 m depth is mainly green-gray sand–silt mixed with fine sand. The 17.9–23.3 m depth consists of loose, uniform green-gray sand–silt; from 19.49 to 21.0 m, it appears grayish white. The 23.3–30.8 m depth mainly includes gray-green sand with sand–silt and a thin layer of fine sand, with abundant calcium carbonate powder or nodules (up to 5 mm in diameter). The 30.8–35.6 m depth features dark gray sand–silt and a sand interlayer, with developed horizontal layers. The 35.6–40.8 m depth is gray sand with thin horizontal sand–silt layering. The 40.8–45.5 m depth consists of dark gray fine sand with thin sand–silt, showing small-angle oblique bedding; calcium carbonate powder is developed at 44.7–45.5 m. The 45.5–50.6 m depth mainly contains green-gray sand and silt, with calcium carbonate powder in the lower part; no obvious bedding is present.
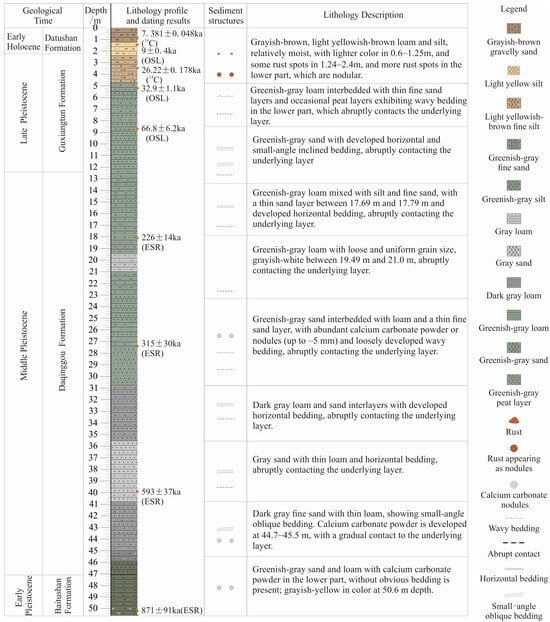
Figure 2.
The stratigraphic age, corresponding formation, depth (meters below surface), lithology profile, dating results, sediment characteristics, and detailed textual lithology description of the studied core, TNZK06.
3.2. Analytical Methods
3.2.1. Dating Methods
The AMS14C, OSL, and ESR dating samples were collected using stainless steel and sealed in black plastic bags to prevent light exposure before being stored at low temperatures. The AMS14C dating was conducted at a 1.5SDH-1 tandem accelerator mass spectrometry radiocarbon measurement system from NEC, USA (Supplementary Materials, Table S1), OSL dating was conducted using the RisoDA-20 from the Technical University of Denmark (Supplementary Materials, Table S2), and the ESR signals were measured using a Bruker EMX-6 X-band ESR spectrometer (Bruker, Germany) (Supplementary Materials, Table S3). The age–depth model was constructed by applying linear regression with natural spline basis functions in the R software environment (4.4.3 version) [,].
3.2.2. Grain Size Analysis
During testing, 1.000 g samples were placed into a 50 mL centrifuge tube; next, 30 mL 10% H2O2 was added to remove the organic matter and stirred until no bubbles appeared. Thereafter, 10% HCl was added to remove carbonates and stirred until no bubbles were generated. Distilled water was repeatedly added 3–5 times to clear the liquid until a neutral pH was achieved. Next, the grain size was determined using a BT-9300Z laser grain size analyzer manufactured by Dandong Bettersize Instruments Ltd. in Liaoning Province, China, with the measuring range of 0.01 μm–3500 μm. The system performs 3 measurements and automatically fits the 3 measurement results. When the residual between each measurement is less than 3%, the data is reliable.
3.2.3. Elemental Analysis
The dried sample was ground to pass through a 200–mesh sieve, before a 4.0 g sample was poured into a low-pressure polyethylene ring. Once flattened, it was pressed, with the pressure increased to 800 kN for 15 s and then tested using an X-ray fluorescence spectrometer (PW4400) manufactured by PANalytical B.V. The contents of SiO2, Al2O3, CaO, Fe2O3, MgO, TiO2, etc., were tested. The standard sample was measured for instrument drift correction before each measurement. Each sample was measured three times before statistical analysis. When the Delta log concentration is <±0.10, the data is reliable.
3.2.4. Total Organic Carbon Analysis
The content of sediment organic carbon was tested using a multiphase infrared carbon and sulfur analyzer manufactured by Deyang Kerui Instrument Equipment Factory in Sichuan Province, China. All study procedures complied with the “Soil Determination of organic carbon—Combustion oxidation nondispersive infrared adsorption method (HJ 695–2014)” []. First, 0.05 g air-dried samples, which were ground and sieved through a 0.097 mm sieve (160 mesh), were weighed into a brown bottle containing some glass wool. Phosphoric acid solution was slowly added to remove carbonates. Thereafter, the samples were heated to above 680 °C in an oxygen-rich carrier gas for non-dispersive infrared detector testing. Simultaneously, the standard sample test results fell within the certified value range, and the deviation between the 10% parallel sample test results was <0.1%.
3.3. Calculation Methods
3.3.1. Grain Size Parameter Calculation
The Krumbein [] value scaling method was used to convert the sediment grain size into the φ value. The conversion formula is as follows: φ = −log2D, where D is the diameter of the grain, in mm. Thereafter, the mean grain size (μm), standard deviation σ1, skewness SK, and kurtosis KG were calculated with reference to the grain size parameter calculation formula of Folk and Wald [,].
3.3.2. Sahu Formula Calculation
The Sahu formula introduces the mean particle size Mz, sorting coefficient σ1, skewness SK, and kurtosis KG into a mathematical discriminant to distinguish sedimentary environments: Y Aeolian: Beach = −3.568 MZ + 3.7016σ12 − 2.0766 SK + 3.1135 KG; Y Aeolian < −2.7411 []. In this study, the above formula was used to calculate the Y-value to assist in the analysis of the sedimentary environment.
3.3.3. Grain Size End-Member Calculation
End-member analysis was used in this study based on the theoretical concepts of Weltje and Prins []. They proposed that sediments consist of various material sources or transport mechanisms with mixed components. Paterson’s grain size end-member model algorithm (EMMA) [,] was implemented by running the end-member calculation program AnalySize in R2023a Matlab. The grain size distribution of each sample is curved through the Weibull function [] and then decomposed into different components, which indicates the transport processes, with a degree of environmental significance according to their characteristics.
During the calculation process, the determination coefficient (R2) and the angular deviation are used to determine the number of end members. The coefficient represents the degree to which the grain size data is fitted, and the angle deviation represents the degree of deviation between the end member and the original grain size curve in shape fitting. The larger the coefficient of determination (R2) (generally greater than 0.9 depending on the sample size), the smaller the angle deviation (generally less than 5), indicating a higher fitting degree and better representativeness. In addition, when the above two conditions are satisfied, the minimum number of end members can be selected.
4. Results
4.1. Dating Results and Age–Depth Model
The AMS14C, OSL, and ESR dating results are shown in Table 1, Table 2 and Table 3. The calculated age–depth model is shown in Figure 3. The dating results show that the sediment was mainly deposited from the late Early Pleistocene to the early Holocene.

Table 1.
AMS14C dating results of the drilled core.
Table 2.
OSL dating results of the drilled core.
Table 3.
ESR dating results of the drilled core.
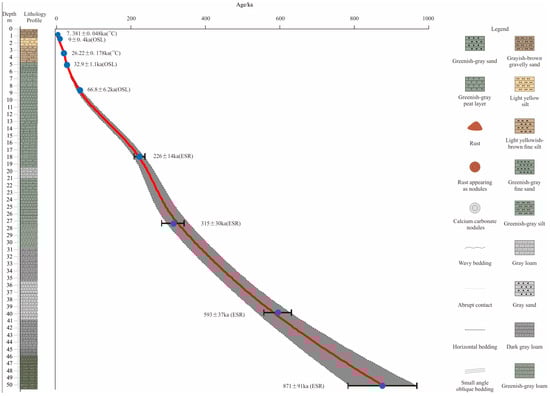
Figure 3.
The age–depth model of the studied core, the dots are dating results, the shadow isthe confidence interval, the red line is the fitted curve and the black lines are error ranges.
The results of previous studies show that since the Quaternary, the area has been in continuous subsidence, the river has been continuously diverted since the Holocene, and the Taoer River has migrated northward, leaving a flood plain between the Taoer River and the Huolin River []. Based on the above findings, Kriging interpolation was used to determine the sedimentary age at different depths.
4.2. Grain Size Composition
The grain size frequency curves of the sediments (Figure 4a) indicate that the entire drilled section is generally coarse-grained, with silt and clay showing repeated increases or decreases. Based on the distribution characteristics divided through clustering calculation along the depth, four sections can be identified along the core profile: 50.6–40.8 m, featuring double-peaked curves with main peak φ values between about 6 and 8 (15.63–3.91 μm); 40.8–23.4 m, showing sharp main peaks with φ values between about 1 and 4 (500–62.5 μm); 23.4–13.4 m, with main peak φ values between about 2 and 4, and secondary peaks between about 5 and 7 (250–7.81 μm); and 13.4–0 m, alternating between wide, gentle main peaks of fine grains and narrow, high main peaks of coarse grains.
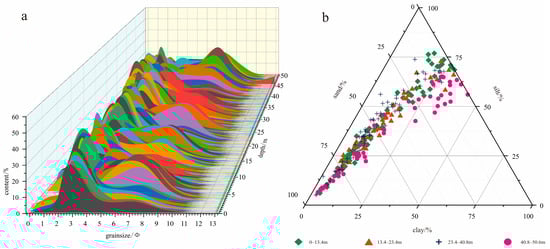
Figure 4.
(a) Three-dimensional frequency distribution of sediment grain size along the core depth, showing variability with depth; (b) triangle diagram of sediment grain size composition, showing the percentage of each grain size component.
As shown in the grain size ternary diagram (Figure 4b), clay accounts for 0.67% to 43.56%, with an average value of 13.24%. Fine silt makes up 2.41% to 53.88%, averaging 17.74%. Medium silt accounts for 1.15% to 25.25%, with an average value of 7.85%. Coarse silt ranges from 1.1% to 34.49%, with an average value of 12.5%. From these results, it can be concluded that the total silt content ranges from 5.08% to 76.9%, with an average value of 38.09%. Sand content varies from 0.02% to 92.68%, with an average value of 48.67%, which is the highest recorded value.
4.3. Grain Size Parameter Analysis
The scatter plot of standard deviation σ1 and the mean grain size MZ (Figure 5) shows that the sediment grain size of 13.4–23.4 m is relatively concentrated at <100 μm, with moderate sorting; however, those of 0–13.4 m, 23.4–40.8 m, and 40.8–50.6 m are relatively dispersed, with no obvious relationship between the grain size and sorting. The scatter plot of standard deviation σ1 and the skewness SK shows that sediments of 40.8–50.6 m have the smallest skewness and the largest sorting difference; the sorting degrees of 23.4–40.8 m, 13.4–23.4 m, and 0–13.4 m are similar, with the skewness falling in and between about 0.13 and 0.40 m, 0.45–0.55 m, and 0.55–0.65 m, respectively. The relationship between the sorting and skewness of 23.4–40.8 m is comparable to that of dunes or wind flats []. The scatter plot of standard deviation σ1 and kurtosis KG, and that of average grain size MZ and kurtosis KG, shows that more efficiently sorted samples generally have higher kurtosis. The relationship between skewness SK, the mean grain size MZ, and kurtosis KG shows significant zone differences; that is, the skewness of each section decreases in turn; in comparison, the mean grain size MZ and kurtosis KG of 13.4–23.4 m are relatively concentrated and small, and 23.4–40.8 m is relatively dispersed.
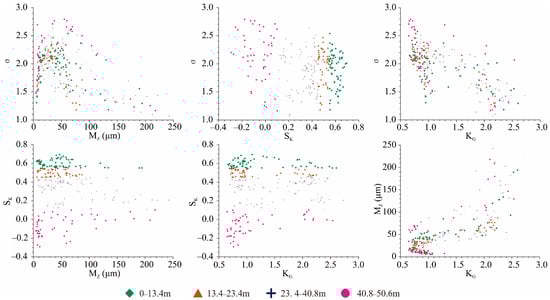
Figure 5.
Scatter plot of sediment grain size parameters in the studied core, showing the relationship between the parameters standard deviation σ1 and the mean grain size MZ, standard deviation σ1 and the skewness SK, standard deviation σ1 and kurtosis KG, the skewness SK and mean grain size MZ, the skewness SK and kurtosis KG, and the kurtosis KG and mean grain size MZ.
To summarize, the mean grain size Mz is between about 50 and 250 μm, indicating very fine to medium sand; the skewness SK varies from −0.4 to 0.8, covering negative to positive values; KG fluctuates between about 0.5 and 3.0, showing both broad and narrow peaks; and the standard deviation ranges from about 1.0 to 2.8, indicating moderate sorting.
4.4. Grain Size End-Member Analysis
The decomposition results obtained using the Gen. Weibull distribution function were implemented in the appropriate software []. The results are shown in Figure 6.
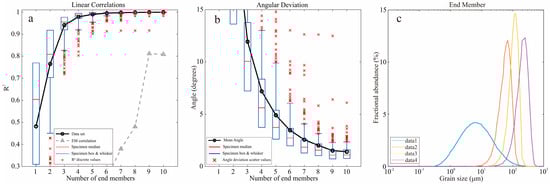
Figure 6.
Grain size end-member analysis results. Four end members were selected, with a determination coefficient greater than 0.9 and an angular deviation less than 5. (a) Coefficient of determination; (b) angle deviation; (c) end-member grain size frequency distribution curve.
Samples of this drilled profile were analyzed and calculated using the grain size end-member model (Figure 6a,b). The separation results showed that when the number of end members was 4, the determination coefficient of the profile samples was greater than 0.9%, and the θ value was 5°, thus better representing the overall characteristics of the data. We therefore used four end members to simulate and analyze the grain size data. The grain size composition characteristics of the end members of the drilled profile are shown in Figure 6c. From the end-member frequency distribution curve of the profile sample, it can be seen that the peak grain size of end member 1 is 6.21 μm, the peak grain size of end member 2 is 68.95 μm, the peak grain size of end member 3 is 125 μm, and the peak grain size of end member 4 is 250 μm.
4.5. Elemental Contents and Ratios
On this profile, the major element content occurs in the order of SiO2 > Al2O3 > Fe2O3 > Cao > MgO > TiO2. SiO2 shows the highest abundance, with an average content of 72.26% (56.87–79.03%). It is relatively low at the base and at several shallower depths, including 45.0 m, 24.8–27.8 m, 20.5 m, 13.8–14.8 m, 7.0 m, and 2.2–3.8 m. TiO2, Al2O3, Fe2O3, CaO, and MgO exhibit average contents of 0.51%, 12.94%, 3.46%, 3.08%, and 1.07%, respectively. These oxides are enriched in the basal section and show relatively high values at 38.4–41.0 m, 31–34 m, 22–23 m, and 2.2–3.8 m. The ratios of SiO2/TiO2, SiO2/Al2O3, and CaO/MgO show four changing sections along the profile depth (Figure 7).
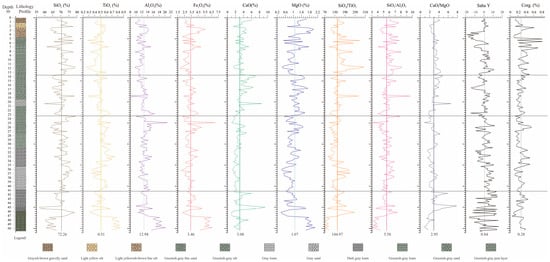
Figure 7.
Curves of SiO2, TiO2, Al2O3, Fe2O3, CaO, and MgO concentration; SiO2/TiO2, SiO2/Al2O3, CaO/MgO, Sahu Y-value, and organic carbon (Corg.) concentration change with depth in the studied profile; vertical lines across each curve are the mean value of that specific index.
4.6. Sahu Y-Value Characteristics
The mean Sahu Y-value on the profile is 0.84, fluctuating between −19.01 and 18.31. Four zones are clearly shown: From 50.6 to 40.8 m, it changed between 18.0 and 16.5, suggesting a relatively stable depositional environment, such as a shallow lake or delta front. From 40.8 to 23.4 m, it changed from −10.0 to 12.0, exhibiting fluctuations between the lake beach and aeolian background. From 23.4 to 13.4 m, it showed a low value with little variation, indicating a greater aeolian origin than the lake beach. From 13.4 m to the surface, it exhibited an obvious increase, suggesting a return to more stable or reducing conditions (Figure 7).
4.7. Organic Carbon Characteristic
The organic carbon records exhibited four distinct stages: From 50.6 to 40.8 m, organic carbon fluctuated between about 0.06% and 0.46%, indicating an initial shallow lake with weak organic matter preservation. From 40.8 to 23.4 m, the organic carbon content fluctuated between about 0.10% and 0.54%, coinciding with enhanced organic matter preservation. From 23.4 to 13.4 m, the organic carbon content declined, highlighting lake regression and intensified oxic degradation. From 13.4 m to the surface, organic carbon fluctuated sharply between 0.10% and 0.84%, reflecting subaerial exposure (Figure 7).
5. Discussion
The weathered rocks of granite, rhyolite, trachyte, phonolite, and clasolite in the hills of the western Songnen Plain are important sediment sources []. The Nenjiang River, Taoer River, Huolin River, and Chuoer River are the main channels for their transport into the Songnen Plain (Figure 1). Alluvial and diluvial sediments are also deposited during transportation []. Impacted by the fluctuation of the Quaternary climate, wind-driven dust deposition, periglacial deposition, and lake deposition are also important components in this region [].
5.1. Interpretation of Grain Size End Members
The results of grain size end-member analysis showed that the grain size was mainly composed of four end members, with peak grain sizes of 6.21 μm, 68.95 μm, 125 μm, and 250 μm, respectively (Figure 6c).
The end member EM1 (6.21 μm) consists predominantly of very fine silt (1.2–28.6%), displaying a single peak, and has the widest range (Figure 6c). Layers dominated by this end member are poorly sorted and fall within the Sahu Y < −2.7411 (Figure 7). In the beach vs. aeolian discriminant, a Y-value below −2.7411 indicates an aeolian depositional environment, whereas values above this threshold point to a beach or lacustrine shore setting []. From these results, it can be concluded that the hydrodynamic characteristics of EM1 are consistent with the eolian or suspended lacustrine components. Aeolian and lacustrine fine muds are often difficult to distinguish; we used geochemical proxies to distinguish them in this study—aeolian deposits typically show a high SiO2/Al2O3 content, whereas lacustrine deposits are enriched in organic carbon [].
The end members EM2 (68.95 μm) and EM3 (125 μm) are fine sands. EM2 mainly comprises very fine sand, with a content range of 0.1–47.9%, a single narrow peak, and a clay tail. EM3 mainly comprises slightly coarser fine sand, with a content range of 20.7–53.2%, a single high and narrow peak, and a silt tail. Fine sands exist in ice–water mixed accumulation, wind-blown, lake, and river deposition. Ice–water deposits are poorly sorted and have a finer grain size than wind-blown sand []. Aeolian sand deposits are generally well sorted, with a single sharp narrow peak and a saltation component with a mode grain size of 100–200 μm []. Lacustrine deposits are generally symmetrical and have high organic matter content []. Fluvial fine sand deposits generally possess a coarse tail []. During the Quaternary, the Songnen Plain and the extensive lowlands were not directly covered by glaciers; instead, they experienced indirect influences through meltwater and periglacial processes []. Therefore, the poor sorting and finer grain size of EM2 are comparable to those observed in meltwater or periglacial sediments []; in comparison, the well-sorted, sharp peak of EM3 is more indicative of the aeolian saltation process [], which might be transported from the local early fluvial–lacustrine deposits.
The end member EM4 (250 μm) is a medium sand, with a grain size range of about 50 μm–800 μm and a content range of 0–62.3%, as well as a single narrow peak and a silt tail, indicating river alluvium. The main peak grain size of the modern river sediment is generally between 0 and 300 μm, with a small peak at one end of the fine particles [,], and varies under different transportation conditions. The end member EM4 described in this study may be related to the alluvium sediments.
From the above results, it can be concluded that there are four types of sediments in this core: suspended clay–fine silt aeolian/lacustrine with a mode grain size of 6.21 μm, meltwater or periglacial sediment with a mode grain size of 68.95 μm, fine medium sand from sandy land with a mode grain size of 125 μm, and medium sand from river alluvial with a mode grain size of 250 μm. It is important to note that grain size end-member analysis primarily reflects the integrated signal of transport dynamics and depositional processes. Thus, sediment transport interpretations based on grain size require additional validation from other proxies, such as geochemistry.
5.2. Transport Tracing of Major Elements
The geochemical composition of siliciclastic sediments is strongly influenced by grain size distribution due to the enrichment of certain minerals in specific grain sizes. Therefore, during transport interpretation using major elements, one should consider the potential overprinting effect of hydrodynamic sorting. To mitigate the grain size effect, element ratios such as SiO2/Al2O3 and SiO2/TiO2 were utilized. Quartz is the primary carrier of SiO2 []; in comparison, Al2O3 is predominantly hosted in clay minerals []. The SiO2/Al2O3 ratio can thus serve as a proxy for the quartz/clay mineral ratio, which is less sensitive to bulk grain size variations and more reflective of transport and weathering intensity []. TiO2 is mainly found in terrigenous clastic sediments and is only partially affected by autogenic deposition []. Thus, the SiO2/TiO2 ratio primarily reflects changes in sand content and is more sensitive to the original dust grain size []. In Figure 7, higher Al2O3 and TiO2 levels, combined with the lower CaO, SiO2/TiO2, SiO2/Al2O3, and CaO/MgO values at the bottom (ca. 885–787.6 ka B.P.), indicate a lake environment. The Al2O3 and TiO2 contents from the 47.0–40.8 m depth decrease rapidly; in comparison, those of SiO2, CaO, SiO2/TiO2, SiO2/Al2O3, and CaO/MgO increased rapidly, indicating the shallow upward trend of the lake. In the 40.8–23.4 m depth, the values of SiO2, TiO2, Al2O3, and SiO2/TiO2 fluctuate within the previous period, indicating a provenance shift after 787.6 ka B.P., which could result from a more quartz-rich source (e.g., recycling of older quartzose sediments) under stronger hydrodynamic conditions, concentrating quartz in the residual deposit. Between ca. 23.4 and 13.4 m, the contents of SiO2, TiO2, Al2O3, and Fe2O3 are below average; in comparison, the contents of CaO, MgO, SiO2/TiO2, SiO2/Al2O3, and CaO/MgO are slightly higher, implying slightly more distant transport than the previous stage. From about 13.4 to 0 m, the sediments show higher SiO2, SiO2/TiO2, and SiO2/Al2O3 ratios than earlier, indicating increasing quartz content in the upper sediments and revealing a resurgence of near transport, combined with an increase in grain size.
Fe, Mg, and Ti are relatively stable and related to volcanic clastics []. In Figure 7, from 50.6 to 40.8 m, the Fe2O3, MgO, TiO2, and Al2O3 content is high, which is likely related to the volcanic rocks. Between 40.8 and 23.4 m, the contents of SiO2 and TiO2 and the SiO2/Al2O3 ratio increased, reflecting a rise in quartz content and dust flux, possibly from local older lacustrine sediment. From 23.4 to 13.4 m, Fe2O3 content decreased slightly, whereas that of CaO, MgO, and CaO/MgO increased slightly, indicating that volcanic debris was added to transport to the core. Between 13.4 and 0 m, Al2O3, TiO2, Fe2O3, CaO, and CaO/MgO content decreased slightly, suggesting a slight reduction in volcanic debris transport. However, the increase at 2.2 to 3.8 m, combined with the high organic carbon level, represents lacustrine suspended components.
The element geochemistry characteristics therefore demonstrate the transport mechanisms of the weathered volcanic rocks and early local fluvial–lacustrine mud and sand: fluvial transport, aeolian transport, glaciofluvial transport, and lacustrine transport.
5.3. Transport Process Since the Late Early Pleistocene
Based on the comprehensive grain size and geochemical indicators, the sediment transport process of the studied area from the late Early Pleistocene can be divided into five stages, among which the first stage belongs to the lower section of 50.6–40.8 m. It is in the same cluster group as that of the Early Middle Pleistocene but dates to the Early Pleistocene. In comparison, the upper 47.0–40.8 m depth belongs to the Middle Pleistocene.
5.3.1. The Late Early Pleistocene (ca. 885.0–787.6 ka B.P.)
The depth of 50.6–47.0 m corresponds to 885.0–787.6 ka B.P., which formed part of the late Early Pleistocene. This stage is characterized by fine-grained, poorly sorted sediments (Figure 5). The high average percentage of EM1 and decreased Sahu Y-value reflected eolian deposits that appeared in the lacustrine suspension materials (Figure 7). The low SiO2, SiO2/TiO2, SiO2/Al2O3, and CaO/MgO content and high Al2O3, Fe2O3, MgO, and TiO2 concentration indicated some volcanic debris transported therein. This process may occur in a wetter climate and is reflected by the higher organic carbon content. Here, the content of EM4 (representing the river alluvium) was second to that of EM1, indicating pulsated river transport at this stage. In such conditions, the weathered granite, andesite, and trachyte debris can provide the salts required for salinization [].
5.3.2. The Early Middle Pleistocene (ca. 787.6–617.7 ka B.P.)
The mean grain size increased significantly, with better sorting. In EM4, the average percentage content of river alluvium is 42.95%, a high value on this profile. In EM3, dust deposition increased from ca. 704 ka B.P. In EM2, periglacial deposition increased slightly at ca. 680 ka B.P. The content of suspended sediment decreased rapidly in EM1. Combined with the sand layers with thin horizontal layering at 35.6–40.8 m (Figure 2), it is known that sediments at this stage were mainly composed of river alluvial deposits, the suspended component of the lake water decreased, and a small amount of an ice–water mixture was added in the later period. The higher SiO2, CaO, SiO2/TiO2, SiO2/Al2O3, and CaO/MgO content and lower Al2O3, Fe2O3, MgO, and TiO2 content signals river-dominated physical erosion and weak chemical weathering, which corresponds to a cold dry climate. The results also indicate reduced transport of volcanic materials. Such a cold dry climate can promote the transport of groundwater to the surface through capillaries, leading to salt accumulation [].
5.3.3. The Mid-Middle Pleistocene (617.7–276.8 ka B.P.)
This period was divided into two phases:
In 617.7–391.2 ka B.P. (40.8–30.8 m) the mean grain size increased rapidly and then decreased slowly, with poor sorting. The content of the suspended component in EM1 and the ice–water mixture in EM2 increased; the content of river alluvium in EM4 and the sand–dust saltation/suspension in EM3 decreased, which corresponds to a colder period between S5–3 and S5–2 in the loess sequence []. The increasing SiO2 and SiO2/TiO2 content and decreasing Al2O3, Fe2O3, CaO, MgO, TiO2, and CaO/MgO content at the lower depth of 40.8–34.0 m indicated a drier climate, which may have caused more salt accumulation. Conversely, the decreased SiO2 and SiO2/TiO2 content and increased Al2O3, Fe2O3, MgO, and TiO2 content at the 34.0–30.8 m depth indicated a wetter climate. The salt component may be provided during the latter stage.
In 391.2–276.8 ka B.P. (30.8–23.4 m) the mean grain size increased slightly, with a stable sorting degree. The suspension component of EM1 is low, with two abrupt high values of 90.95% and 90.63%, corresponding to the valley values of EM2 and EM4 at ca. 310 ka B.P. and 302 ka B.P. In EM3, the saltation/suspension dust is high, indicating an increase in terrigenous clastic. The lower TiO2, MgO, SiO2/TiO2, and SiO2/Al2O3 values and increased SiO2, Al2O3, Fe2O3, and CaO/MgO values show a cool drier climate, which enhanced evaporation and resulted in salt transport upward through capillary action [].
5.3.4. The Late Middle Pleistocene (276.8–147.2 ka B.P.)
During this period, the mean grain size is at its lowest and is poorly sorted. EM1 was relatively low but had a peak (100%) at ca. 202 ka B.P., larger than the average value. In EM2, the mixed ice–water sediments decreased. In EM3, the dust increase/suspension was high. In EM4, the river alluvium was at its lowest. These phenomena, combined with the low organic carbon and Sahu Y-value (<−2.741), indicate an aeolian environment. Compared to the previous period, the relatively low SiO2, TiO2, Al2O3, and Fe2O3 contents and higher CaO, MgO, SiO2/TiO2, SiO2/Al2O3, and CaO/MgO contents indicate stable input of terrigenous detritus and intensified chemical weathering in a warm and humid climate, which promoted the dilution of salt into sediments [].
5.3.5. The Late Pleistocene to Early Holocene (147.2–0.6 ka B.P.)
In 147.2–30.6 ka B.P. (13.4–4.8 m) the mean grain size fluctuated, with the sorting degree fluctuating significantly early on and slowing down later. The content of EM1 increased, with each EM1 peak corresponding to a low Sahu Y-value and organic carbon content, which indicated wind transport. EM2 shows a peak in the early stage and then decreases. EM3 dominated with an average percentage of 25.04%. EM4 abruptly appears in large quantities and then decreases slightly in a variable manner. The increased SiO2, SiO2/TiO2, and SiO/Al2O3 content, the decreased content of TiO2, Al2O3, Fe2O3, CaO, MgO, and CaO/MgO, and the rebounded Sahu Y, combined with the well-developed fluvial sand layers at 9–13.4 m and the peat layer of the stagnant wetland at 8.5–4.8 m, exhibited a drying and cooling climate process, which enhanced physical weathering conditions. From ca. 30.6 to 0.6 ka B.P. (4.8–0 m), the mean grain-size is low and poorly sorted. EM1 decreased from 100% to 83.94% at ca. 22.5 ka B.P. (3.5 m) and was replaced by EM3. The 147.0–31.0 ka B.P. sediments are mainly transported from the aeolian saltation suspension and river alluvium deposits; after 30.6 ka B.P., they were mainly derived from the aeolian saltation suspended sands, which may have been transported by the weathered earlier fluvial–lacustrine deposits.
Overall, the late Early Pleistocene sediments were primarily transported from weathered volcanic rocks, with minor fluvial–alluvial and proluvial materials. The early Middle Pleistocene sediments were transported from weathered local alluvial–proluvial deposits around the plain. During the mid-Middle Pleistocene, the sediment was transported mainly by the nearby meltwater and aeolian dust, with occasional short-term inputs from weathered volcanic rocks. The late Middle Pleistocene sediment was mainly transported by wind. The late Pleistocene sediments were transported in an alluvial–proluvial manner.
5.4. Paleoclimatic Drivers of Transport Process
The sediment profile mainly covers the period from ca. 880 ka B.P. to 0.6 ka B.P. The grain size analysis results show a sedimentary cycle of fan delta front–fan delta plain–fan delta front–fan delta plain []. This cycle corresponds to the paleoclimate process indicated by the element indicators of CaO/MgO and SiO2/TiO2, combined with other elements, grain size end members, and organic carbon analysis of this profile (Figure 8).

Figure 8.
Sedimentary cycles of the studied profile, showing a double cycle of fan delta front–fan delta plain from the late Early Pleistocene to the Early Holocene []. Variation curves of mean grain size MZ (μm) and standard deviation σ1, showing that fine grain components correspond to poor sorting. Variation curves of end-member scores of EM1, EM2, EM3, and EM4, showing the shift in fluvial transport, aeolian transport, glaciofluvial transport, and lacustrine transport along the depth of the profile. Variation curve of the chemical indices of CaO/MgO indicating carbonate accumulation in a salinization tendency. Variation curve of SiO2/TiO2 indicating the siliciclastic and elements input to the Songnen Plain along the profile. The curve of LR04 stacked benthic δ18O (‰) was drawn based on data provided by the authors of [], showing the paleoclimate coincidence of this core.
From ca. 880 ka B.P. to 617.7 ka B.P., the cooling and drying climate process shown on this drilled profile was also recorded in the nearby QAL profile []. The deep-sea oxygen isotopes show that, after ca. 900 ka B.P., the precipitation of the East Asian summer monsoon decreased, and ancient lakes shrank [,]. In such a cooling and drying climate, the increased CaO/MgO and SiO2/TiO2 ratios were also signals of salt accumulation [].
From ca. 617.7 ka B.P. to 276.8 ka B.P., another mild humid to cooling drying cycle occurred on this profile. During the earlier period of 617.7 ka B.P. to 460 ka B.P., the cycle was mild–humid, with high SiO2/TiO2 values denoting more siliciclastic and elements input to this area []. Between 460 and 180 ka B.P., the Songnen Plain lay in a cold, dry regime []. Accordingly, the consistently fine-grained sediments and the slightly high value of CaO/MgO, showing some carbonate precipitation, indicate a salinization tendency [].
Since ca. 276.8 ka B.P., Northeast China has entered a cold and arid period. The studied profile has correspondingly exhibited aeolian transport during the Penultimate Glaciation and the last glacial period, mixed with fluvial transport during the last interglacial period and deglaciation period (Figure 8). Accordingly, the high values of SiO2/TiO2 denote salt input to the Songnen Basin, and the slightly high value of CaO/MgO show some salt accumulation in response to the cool and dry climate.
It can be demonstrated that the transport shift observed in this study occurred within the appropriate paleoclimatic context. The transport mechanisms influenced salt accumulation and migration through the corresponding hydrological condition in the mild humid or cool dry background.
6. Conclusions
- The late Early Pleistocene–early Holocene sediment grain size in the drilled core includes four end members: the EM1 aeolian or lacustrine suspended component, the EM2 meltwater or periglacial sediment component, the EM3 dust saltation suspended component caused by wind disturbance, and the EM4 river alluvial component.
- In the saline western Songnen Basin, there were five sediment transport stages from the late Early Pleistocene to the Early Holocene: the late Early Pleistocene transport from weathered volcanic rocks, with minor fluvial–alluvial and proluvial materials; early Middle Pleistocene alluvial–proluvial transport; mid-Middle Pleistocene transport by meltwater and wind; late Middle Pleistocene transport by wind; and late Pleistocene alluvial–proluvial transport.
- The sediment transport process in the saline western Songnen Basin was driven by the local paleoclimate process, which further influenced salt accumulation in the warm humid climate and upward salt migration through capillary action in the cold dry climate, with all of them being controlled by global ice volume cycles.
Supplementary Materials
The following supporting information can be downloaded at: https://www.mdpi.com/article/10.3390/land14112263/s1.
Author Contributions
Conceptualization, X.Z.; methodology, X.Z.; software, C.A., Y.G. and X.Z.; validation, X.Z.; formal analysis, C.A. and X.Z.; investigation, X.Z.; resources, F.K. and J.Z.; data curation, C.A., X.Z., J.Z., Y.G. and J.H.; writing—original draft preparation, X.Z.; writing—review and editing, X.Z. and C.A.; visualization, X.Z., C.A. and Y.G.; supervision, X.Z.; project administration, F.K.; funding acquisition, Y.P. All authors have read and agreed to the published version of the manuscript.
Funding
This research was supported by the “1:250,000 ground substrate survey of the western Songnen Plain” (grant number DD20242038), and the National Natural Science Foundation of China (grant number 40702027).
Data Availability Statement
The datasets generated and analyzed during the current study are available from the corresponding author upon reasonable request.
Acknowledgments
The authors are grateful to their colleagues who drilled and took the samples during the field work.
Conflicts of Interest
The authors declare that they have no known competing financial interests or personal relationships that could have appeared to have influenced the work reported in this paper.
References
- Yin, X.W.; Liu, W.; Zhu, M.; Zhang, J.T.; Feng, Q.; Xi, H.Y.; Yang, L.S.; Han, T.; Cheng, W.J.; Su, Y.Q. Compounding effects of human activities and climatic changes on coexistence of oasis-desert ecosystems: Prioritizing resilient decision-making for a riskier world. Res. Cold Arid. Reg. 2023, 15, 219–229. [Google Scholar] [CrossRef]
- Bian, J.M.; Tang, J.; Lin, N.F. Relationship between saline–alkali soil formation and neotectonic movement in Songnen Plain, China. Environ. Geol. 2008, 55, 1421–1429. [Google Scholar] [CrossRef]
- Lin, N.F.; Tang, J. Study on the environmental evolution and the analysis of the causes of land salinization and desertification in Songnen plain. Quat. Sci. 2005, 25, 474–483. [Google Scholar]
- Cui, G.; Liu, Y.; Li, X.J.; Wang, S.; Qu, X.G.; Wang, L.; Tong, S.Z.; Zhang, M.Y.; Li, X.F.; Zhang, W.Q. Impacts of groundwater storage variability on soil salinization in a semi-arid agricultural plain. Geoderma 2025, 454, 117162. [Google Scholar] [CrossRef]
- Wang, Q.H.; Wang, J.D.; Li, S.; Li, S.; Li, C.; Gu, C.Y. Experiments to simulate the salinisation process of loess under a dynamic water cycle. Environ. Res. 2025, 268, 120739. [Google Scholar] [CrossRef] [PubMed]
- Gao, H.; Fu, T.G.; Wang, F.; Zhang, M.; Qi, F.; Liu, J.T. Influence of groundwater table depth on the evolution of saline-alkali land in a coastal area. Land Degrad. Dev. 2024, 35, 2857–2866. [Google Scholar] [CrossRef]
- Yang, F.; Zhang, G.X.; Yin, X.R.; Liu, Z.J. Field-scale spatial variation of saline-sodic soil and its relation with environmental factors in Western Songnen Plain of China. Int. J. Environ. Res. Public Health 2011, 8, 374–387. [Google Scholar] [CrossRef] [PubMed]
- Wang, R.J.; Zhang, J.F.; Zhang, D.S.; Dong, L.S.; Qin, G.H.; Wang, S.F. Impacts of climate change on forest growth in the saline-alkali land of the Yellow River Delta, North China. Dendrochronologia 2022, 74, 125975. [Google Scholar] [CrossRef]
- Zhang, D.F.; Wang, S.J. Study on the Ecological Geological Environment of Land Salinization in Western Jilin Province. Chin. J. Soil Sci. 2002, 33, 90–93. [Google Scholar]
- Xu, Z.Q.; Xu, X.H. Research Progress on Causes, Characteristics and Control Measures of Soda Saline-alkali Land in Songnen Plain. Soil Water Conserv. China 2018, 2, 54–59. [Google Scholar]
- Li, J.G.; Pu, L.J.; Zhu, M.; Zhang, R.S. The present situation and hot issues in the salt-affected soil research. Acta Geogr. Sin. 2012, 67, 1233–1245. [Google Scholar]
- Zhao, H.G.; Liu, C.Y. Approaches and prospects of provenance analysis. Acta Sedimentol. Sin. 2003, 21, 409–415. [Google Scholar]
- Feng, Z.Z. Chinese Sedimentology, 2nd ed.; Petroleum Industry Press: Beijing, China, 2013. [Google Scholar]
- Wang, X.M.; Zhang, Z.; Ling, C.H.; Wan, Z.W.; Jia, Y.L.; Wang, Y.Q. Grain-Size Characteristic of the Regional Sand-Dust Accumulation System in the Southwest of Poyang Lake. Arid. Land Geogr. 2019, 42, 29–37. Available online: https://d.wanfangdata.com.cn/periodical/CiFQZXJpb2RpY2FsQ0hJU29scjlTMjAyNTEwMjEwOTUwNDYSDmdocWRsMjAxOTAxMDA0Ggh5bXhsYzZxNQ%3D%3D (accessed on 3 November 2025).
- Wang, Z.D.; Huang, C.C.; Zhou, Y.L.; Cha, X.C.; Pang, J.L.; Shang, R.Q. Provenance Analysis of Sediments in the Upper Reaches of the Yinghe River in the Huaihe River Basin. Earth Environ. 2024, 52, 420–428. [Google Scholar] [CrossRef]
- Fang, H.C.; Huang, P.; Sun, J.W.; Yu, Y.H.; Li, A.C. Provenance and controlling factors of major elements in graded components of sediments from the Yalu River. Mar. Geol. Quat. Geol. 2019, 39, 72–83. [Google Scholar] [CrossRef]
- Zhao, H.M.; Liu, L.J.; Zhao, H.; Bi, Z.W.; Wang, L.K.; Song, L.; Wang, C.M.; Yang, J.S. Grain-size character and sedimentary environment of Hutuo River paleochannel section. Geoscience 2016, 2, 485–492. [Google Scholar]
- Xu, S.J. Analysis of grain-size populations with environmentally sensitive components in aeolian deposits and their implications. J. Arid Land Resour. Environ. 2007, 21, 95–98. [Google Scholar]
- Chen, J.; Li, G.J. Geochemical tracer study of the Asian aeolian dust system. Sci. China Earth Sci. 2011, 41, 1211–1232. [Google Scholar]
- Wang, K.; Zhai, S.K. Geochemical Methods for Identification of Sedimentary Provenance. Mar. Sci. 2020, 44, 132–143. Available online: https://d.wanfangdata.com.cn/periodical/CiFQZXJpb2RpY2FsQ0hJU29scjlTMjAyNTEwMjEwOTUwNDYSDWh5a3gyMDIwMTIwMTUaCHJmYnVyN3R1 (accessed on 3 November 2025).
- Cao, Y.C.; Wang, Y.Z.; Xu, T.Y.; Mi, L.S. Application of the ratio of characteristic elements in provenance analysis: A case study from the upper part of the fourth member of the Shahejie Fm. in the W58 area, Dongying Depression. Acta Sediment. Sin. 2007, 25, 230–238. [Google Scholar]
- Zhao, D.B.; Wan, S.M. Research progress of tracing sediment sources in Okinawa Trough. Mar. Geol. Front. 2015, 31, 32–41. [Google Scholar] [CrossRef]
- Yu, Q.; Gao, S. Study on the end-member characteristics of modern clay minerals in the Yangtze River. In Proceedings of the 3rd National Conference on Sedimentology, Chengdu, China, 22–24 September 2005; p. 1. [Google Scholar]
- Yang, R.C.; Li, J.B.; Fan, A.P.; Zong, M.; Zhang, T. Research progress and development tendency of provenance analysis on terrigenous sedimentary rocks. Acta Sediment. Sin. 2013, 31, 99–107. [Google Scholar]
- Wang, Z.B.; He, Q.X.; Yang, S.Y.; Lan, X.H.; Zhang, Z.X. Comparison and application of Shepard’s and Folk’s classifications to the subsurface mapping in the South Yellow Sea. Mar. Geol. Quat. Geol. 2008, 28, 1–8. [Google Scholar]
- Liang, A.M.; Qu, J.J.; Dong, Z.B.; Su, Z.Z.; Wu, B.; Zhang, Z.C.; Qian, G.Q.; Gao, J.L.; Pang, Y.J.; Zhang, C.X. The Characteristic of Grain-Size end Members in Kumtagh Desert and Its Implication for Sediment Source. J. Desert Res. 2020, 40, 33. Available online: https://d.wanfangdata.com.cn/periodical/CiFQZXJpb2RpY2FsQ0hJU29scjlTMjAyNTEwMjEwOTUwNDYSDXpnc20yMDIwMDIwMDUaCDZqY2xqZ2xj (accessed on 3 November 2025).
- Wang, Z.D.; Huang, C.C.; Zhou, Y.L.; Pang, J.L.; Cha, X.C.; Guo, Y.Q. Environment evolution and provenance characteristics of the loess since the late Pleistocene in Henan Province. Geol. J. China Univ. 2018, 24, 380–389. [Google Scholar] [CrossRef]
- Wang, Z.D.; Huang, C.C.; Yang, H.J.; Pang, J.L.; Cha, X.C.; Zhou, Y.L. Loess Provenance Characteristics and Evolution Indicated by Grain-Size Since the Late Pleistocene at the Eastern Foot of the Liupan Mountains. Sci. Geogr. Sin. 2018, 38, 818–826. Available online: https://d.wanfangdata.com.cn/periodical/CiFQZXJpb2RpY2FsQ0hJU29scjlTMjAyNTEwMjEwOTUwNDYSDWRsa3gyMDE4MDUwMjAaCHJ0eWR3YWYz (accessed on 3 November 2025).
- Yang, Y.M.; Zhang, L.Z.; Shen, R.W.; Chu, H.X.; Jiang, Z.L.; Feng, Y.C.; Jiang, W.Q.; Yin, X.B.; Li, J.L.; Wang, P.F.; et al. Characteristics of grain-size and clay mineral distribution of surface sediments and their provenance implication in Tangshan Harbor, Bohai Bay. Mar. Geol. Quat. Geol. 2023, 43, 136–147. [Google Scholar] [CrossRef]
- Licht, K.J.; Hemming, S.R. Analysis of Antarctic glacigenic sediment provenance through geochemical and petrologic applications. Quat. Sci. Rev. 2017, 164, 1–24. [Google Scholar] [CrossRef]
- Meng, X.W.; Xia, P.; Zhang, J.; Wang, X.Q. Evolution of the East Asian monsoon and its response to uplift of the Tibetan Plateau since 1.8 Ma recorded by major elements in sediments of the South China Sea. Chin. Sci. Bull. 2011, 56, 547–551. [Google Scholar] [CrossRef]
- Lin, N.F.; Bounlon, V.; Tang, J.; Bian, J.M. Study on the relation between the formation of saline-alkali soil and the neotectonic movement. Glob. Geol. 2005, 24, 282–288+311. [Google Scholar]
- Wang, M.J.; Chi, Y.P.; Xie, Y.Y.; Kang, C.G.; Wang, Y.H.; Sun, L.; Wu, P.; Liu, R.N.; Wei, Z.Y.; Liu, H.Q. Variation characteristics and climatic significance of climate proxy indexes of surface sediments in Songnen sandy land. Chin. J. Geol. 2024, 59, 1759–1774. [Google Scholar]
- Li, Q.S.; Deng, W.; Qian, Z.G. Study on the Formation and Changes of Saline-Alkaline Mire in Songnen Plain. Geogr. Sci. 2000, 20, 362–367. [Google Scholar]
- HJ 695-2014; Soil-Determination of Organic Carbon-Combustion Oxidation Nondispersive Infrared Absorption Method. Ministry of Ecology and Environment: Beijing, China, 2014; pp. 1–3.
- Krumbein, W.C. Size frequency distributions of sediments. J. Sediment. Res. 1934, 4, 65–77. [Google Scholar] [CrossRef]
- Chen, Q.; Tang, W.W.; Xue, C.F.; Yang, Y.; Gao, W.H.; Yang, J.Y.; Jia, J.J. The Φ Value Expresses Granularity and the Unit Problem of the Sorting Coefficient. Acta Sedimentol. Sin. 2022, 43, 39–49. [Google Scholar] [CrossRef]
- Folk, R.L.; Ward, W.C. Brazos River bar [Texas]; a study in the significance of grain-size parameters. J. Sediment. Res. 1957, 27, 3–26. [Google Scholar] [CrossRef]
- Sahu, B.K. Depositional mechanisms from the size analysis of clastic sediments. J. Sediment. Res. 1964, 34, 73–83. [Google Scholar] [CrossRef]
- Weltje, G.J. End-member modeling of compositional data: Numerical-statistical algorithms for solving the explicit mixing problem. Math. Geol. 1997, 29, 503–549. [Google Scholar] [CrossRef]
- Sun, D.H.; An, Z.S.; Su, R.X.; Wu, X.H.; Wang, S.M.; Sun, Q.L.; David, R.; Jan, B. Mathematical methods for separation of sediment grain-size components in paleoenvironment and their applications. Prog. Nat. Sci. 2001, 11, 269–276. [Google Scholar]
- Paterson, G.A.; Heslop, D. New methods for unmixing sediment grain-size data. Geochem. Geophys. Geosyst. 2015, 16, 4494–4506. [Google Scholar] [CrossRef]
- Sun, Y.; Xie, J. Application of Singular Point Analytical Element Method in Crack Problem. Key Eng. Mater. 2004, 274, 757–762. Available online: https://webofscience.clarivate.cn/wos/alldb/full-record/WOS:000227161500124 (accessed on 3 November 2025).
- Zhang, D.F.; Lin, N.F. A Preliminary Study on the Neotectonism and Climate Cycle Mechanism of Environment Evolvement in the Songnen Plain Since the Quarternary. Glob. Geol. 2000, 19, 73–77. [Google Scholar]
- Shaanxi-Northern Team of Chengdu Institute of Geology. Sedimentary Rock Particle Size Analysis and Its Applications; Geological Publishing House: Beijing, China, 1978; p. 147. [Google Scholar]
- Chen, H.; Liu, J.; Wang, H.B. Geochemical characteristics and geological significance of major elements in surface sediments in Qiongdongnan area. Mar. Geol. Quat. Geol. 2007, 27, 39–45. [Google Scholar]
- Pan, R.Y.; Li, C.C.; Zhang, M.; Sun, C.Q.; Liu, G.N. Analysis of particle characteristics and differentiation processes of glacial sediment in Tianshan and eolian sediment in the Taklimakan Desert. Acta Sci. Nat. Univ. Pekin. 2012, 48, 744–756. [Google Scholar]
- Chu, N.N.; Pan, B.T.; Wang, J.P.; Hu, Z.B.; Sun, H.; Zhou, T.; Hu, X.F. Grain-size abrupt shift around 0.9 Ma in loess and its environmental effect in Fenwei Basin, China. J. Desert Res. 2008, 28, 50–56. [Google Scholar]
- Li, Y.P.; Hao, Y.C.; Wang, Q.K.; Yan, Y.D. Identifying principle of the subsequences for continental fluvial-lacustrine. Daqing Pet. Geol. Dev. 2013, 32, 7–11. [Google Scholar]
- Remo, J.W.; Heine, R.A.; Ickes, B.S. Particle size distribution of main-channel-bed sediments along the upper Mississippi River, USA. Geomorphology 2016, 264, 118–131. [Google Scholar] [CrossRef]
- Li, J.J.; Kang, J.C. Quaternary glacial periods, geomorphic periods, and loess records in China. Quat. Res. 1989, 9, 269–278. [Google Scholar]
- Li, F.Q.; Gao, H.S.; Zhang, L.K.; Li, Z.M.; Pang, H.L.; Pan, B.T. Grain-size characteristics and evolution of the core sedimentary environment in the Houtao plain reach of the Yellow River. Acta Sedimentol. Sin. 2019, 37, 1234–1243. [Google Scholar] [CrossRef]
- Hu, X.J. A misunderstanding in provenance analysis: Sand changes of mineral, roundness, and size in flowing-water transportation. J. Palaeogeogr. 2017, 19, 175–184. [Google Scholar]
- Li, C.A.; Zhang, Y.F.; Xiong, D.Q.; Zhou, Y.; Guo, J. Geochemical characteristics of major elements in the Wushan Loess. Earth Sci. 2013, 38, 916–922. [Google Scholar]
- Botero, Y.L.; López-Rendón, J.E.; Ramírez, D.; Zapata, D.M.; Jaramillo, F. From clay minerals to Al2O3 nanoparticles: Synthesis and colloidal stabilization for optoelectronic applications. Minerals 2020, 10, 118. [Google Scholar] [CrossRef]
- Xu, Z.K.; Li, T.G.; Yu, X.K.; Li, A.C.; Tang, Z.; CHOI, J.Y.; Nan, Q.Y. Major element records of sediment provenance in the West Philippine Sea and the evolution of the East Asian winter monsoon over the past 700 ka. Sci. Bull. 2013, 58, 1048–1056. [Google Scholar] [CrossRef]
- Li, J.H.; Hou, H.X.; Wang, W.; Ren, B.Z.; Zhang, G.G.; Li, M.; Qi, L.; Du, X.; Shi, L.F.; Zhan, Z.D.; et al. Geochemical Characteristics of the Ground Substrate Layer in the Black Soil Area of the Northern Songnen Plain and Its Implications for the Provenance of Black Soil. Acta Geosci. Sin. 2025, 46, 827–840. [Google Scholar]
- Nesbitt, H.W.; Markovics, G. Weathering of granodioritic crust, long-term storage of elements in weathering profiles, and petrogenesis of siliciclastic sediments. Geochim. Cosmochim. Acta 1997, 61, 1653–1670. [Google Scholar] [CrossRef]
- Mao, H.T.; Huang, Q.H.; Wu, H.B. Soil salinization features in arid areas farmland. Trans. Chin. Soc. Agric. Eng. 2016, 32, 112–117. [Google Scholar]
- Ding, Z.L.; Derbyshire, E.; Yang, S.L.; Yu, Z.W.; Xiong, S.F.; Liu, T.S. Stacked 2.6-Ma grain-size record from the Chinese loess based on five sections and correlation with the deep-sea δ18O record. Paleoceanography 2002, 17, 5-1-5-21. [Google Scholar] [CrossRef]
- Zhang, X.R.; Gong, Y.; Kong, F.P.; Zhao, J.; Ai, C.L.; Pei, Y.D.; He, J.B. Alluvial Plain Evolution and its responds to the paleoclimate indicated by sediment grain-size in the Western Songnen Plain during the Middle–Late Pleistocene. Quaternary, 2025; submitted. [Google Scholar]
- Lisiecki, L.E.; Raymo, M.E. A Pliocene-Pleistocene stack of 57 globally distributed benthic δ18O records. Paleoceanography 2005, 20, 1–17. [Google Scholar] [CrossRef]
- Zhan, T.; Zeng, F.M.; Yang, Y.; Ge, J.Y.; Ma, Y.F.; Zhang, J.; Jiang, X.; Huang, R.F.; Liang, Y.X.; Li, E.; et al. Decreasing summer monsoon precipitation during glacial at ca.900 ka: Evidence from grain-size variation of lacustrine deposits from the Northeast Plain of China. Quat. Sci. 2020, 40, 1431–1440. [Google Scholar]
- Liu, S.; Chi, Y.P.; Hao, D.M.; Xie, Y.Y.; Kang, C.G.; Wu, P. Evolution of summer monsoon in Songnen Plain since Middle Pleistocene: Magnetic susceptibility, geochemistry and total organic carbon records from Harbin loess. Chin. J. Geol. 2021, 56, 1279–1298. [Google Scholar]
- Wei, C.Y.; Xie, Y.Y.; Kang, C.G.; Chi, Y.P.; Sun, L.; Wu, P.; Wei, Z.Y.; Leng, Y.K. Sedimentological, mineralogical, and geochemical characteristics of the Luojiawopeng Fm. in Harbin: Implications for the sedimentary environment. Chin. J. Geol. 2022, 57, 172–189. [Google Scholar]
- Zhan, T.; Yang, Y.; Zeng, F.M.; Liang, Y.X.; Ge, J.Y.; Ma, Y.F.; Kong, X.H.; Zhang, L.; Jiang, X.; Huang, R.F.; et al. Magnetostratigraphy and magnetic susceptibility of the Dumeng borehole sequence from Northeast China Plain and implications for sedimentary evolution of the Songnen paleo-lake. Chin. J. Geophys. 2023, 66, 673–684. [Google Scholar]
- Yang, X.L.; Zhang, R.C.; Zhang, Z.; Liu, L.J.; Wang, R.J.; Gao, S.P. Environmental change since 5000cal. a BP in the Anguli-Nuur Lake area based on palynological and geochemical records. Quat. Sci. 2017, 37, 130–142. [Google Scholar]
Disclaimer/Publisher’s Note: The statements, opinions and data contained in all publications are solely those of the individual author(s) and contributor(s) and not of MDPI and/or the editor(s). MDPI and/or the editor(s) disclaim responsibility for any injury to people or property resulting from any ideas, methods, instructions or products referred to in the content. |
© 2025 by the authors. Licensee MDPI, Basel, Switzerland. This article is an open access article distributed under the terms and conditions of the Creative Commons Attribution (CC BY) license (https://creativecommons.org/licenses/by/4.0/).