Abstract
The Tibetan Plateau is a globally critical climate-sensitive and ecologically fragile region. Vegetation phenology serves as a key indicator of ecosystem responses to climate change and simultaneously influences regional carbon cycling, water regulation, and ecological security. However, systematic quantitative assessments of phenological responses under the combined effects of multiple climate factors remain limited. This study integrates multi-source remote sensing data (MODIS MCD12Q2) and ERA5-Land meteorological data from 2001 to 2023, leveraging the Google Earth Engine (GEE) cloud platform to extract key phenological metrics, including the start (SOS) and end (EOS) of the growing season, and growing season length (GSL). Sen’s slope estimation, Mann–Kendall trend tests, and partial correlation analyses were applied to quantify the independent effects and spatial heterogeneity of temperature, precipitation, solar radiation, and evapotranspiration (ET) on GSL. Results indicate that: (1) GSL on the Tibetan Plateau has significantly increased, averaging 0.24 days per year (Sen’s slope +0.183 days/yr, Z = 3.21, p < 0.001; linear regression +0.253 days/yr, decadal trend 2.53 days, p = 0.0007), primarily driven by earlier spring onset (SOS: Sen’s slope −0.183 days/yr, Z = −3.85, p < 0.001), while autumn dormancy (EOS) showed limited delay (Sen’s slope +0.051 days/yr, Z = 0.78, p = 0.435). (2) GSL changes exhibit pronounced spatial heterogeneity and ecosystem-specific responses: southeastern warm–wet regions display the strongest responses, with temperature as the dominant driver (mean partial correlation coefficient 0.62); in high–cold arid regions, warming substantially extends GSL (Z = 3.8, p < 0.001), whereas in warm–wet regions, growth may be constrained by water stress (Z = −2.3, p < 0.05). Grasslands (Z = 3.6, p < 0.001) and urban areas (Z = 3.2, p < 0.01) show the largest GSL extension, while evergreen forests and wetlands remain relatively stable, reflecting both the “climate sentinel” role of sensitive ecosystems and the carbon sequestration value of stable ecosystems. (3) Multi-factor interactions are complex and nonlinear; temperature, precipitation, radiation, and ET interact significantly, and extreme climate events may induce lagged effects, with clear thresholds and spatial dependence. (4) The use of GEE enables large-scale, multi-year, pixel-level GSL analysis, providing high-precision evidence for phenological quantification and critical parameters for carbon cycle modeling, ecosystem service assessment, and adaptive management. Overall, this study systematically reveals the lengthening and asymmetric patterns of GSL on the Tibetan Plateau, elucidates diverse land cover and climate responses, advances understanding of high-altitude ecosystem adaptability and climate resilience, and provides scientific guidance for regional ecological protection, sustainable management, and future phenology prediction.
1. Introduction
The Tibetan Plateau, often referred to as the “Third Pole of the Earth” and the “Asian Water Tower,” plays a pivotal role in the global climate system []. Owing to its high elevation, complex topography, and unique ecosystems, the region is highly sensitive to climate change and serves as a critical area for studying ecological responses under global warming []. Over recent decades, the plateau has experienced a warming rate far exceeding the global average, profoundly altering hydrothermal patterns, vegetation phenology, and cryospheric processes, thereby affecting ecosystem functions and influencing the Asian monsoon system [,,].
Vegetation phenology, defined as the timing of key life-cycle events such as green-up, flowering, and dormancy, serves as one of the most direct and sensitive indicators of climate change []. Phenological variations not only reflect ecological responses to climatic drivers but also influence regional carbon cycling [], water conservation [], and ecosystem services. With advances in remote sensing and big data analytics, phenology can be effectively extracted from vegetation indices such as NDVI and EVI [] and integrated with meteorological datasets to analyze spatiotemporal dynamics and climatic drivers across large regions and long time series [,]. Previous studies have shown that vegetation–climate interactions often exhibit nonlinear and lagged responses [,]. On the Tibetan Plateau, these dynamics are further complicated by low-temperature stress, freeze–thaw cycles, drought [], and human disturbances such as grazing and extreme events [,]. Pronounced altitudinal gradients also create strong spatial heterogeneity in phenological responses across ecological zones and land-cover types [,].
Despite substantial progress in understanding vegetation phenology and its climatic controls [,,], several challenges remain. Most studies emphasize temperature as the dominant driver, while the independent and synergistic effects of multiple climatic factors, such as precipitation, radiation, and evapotranspiration, remain insufficiently quantified [,]. Comprehensive assessments of nonlinear and lagged responses are scarce, and feedback between vegetation and climate remains poorly understood [,]. Moreover, spatially continuous patterns and dominant drivers across diverse ecosystems are still inadequately resolved [,]. Although phenological shifts are recognized to affect carbon sequestration and water regulation, quantitative evaluations of these impacts and their underlying mechanisms remain limited [].
To address these gaps, this study extracted key phenological parameters of the Tibetan Plateau, including the start (SOS), end (EOS), and peak (POS) of the growing season, as well as the growing season length (GSL), using multi-source remote sensing and meteorological data from 2001 to 2023. Spatiotemporal trends were assessed using Sen’s slope estimator and the Mann–Kendall test, while partial correlation analysis was applied to quantify the independent effects of multiple climatic factors and their spatial variability [,,]. The objectives of this study are threefold: (1) to quantify the independent and relative contributions of major climatic variables to vegetation phenology; (2) to reveal spatial heterogeneity and identify dominant drivers across ecological zones; and (3) to compare phenological sensitivities among grasslands, forests, and wetlands. The results are expected to elucidate the spatially heterogeneous mechanisms of multi-factor climatic influences, enhance understanding of alpine ecosystem responses, and provide a scientific basis for climate adaptation and sustainable development strategies on the Tibetan Plateau under global change.
2. Study Area
The Tibetan Plateau, situated in western China (73°~96° E, 27°~37° N), spans approximately 250 × 104 km2 and has an average elevation exceeding 4,000 m, making it the highest and most topographically complex plateau on Earth [,] (Figure 1). The climate is predominantly cold and arid, with mean annual temperatures generally below 0 °C and precipitation exhibiting a pronounced spatial gradient, decreasing from over 800 mm in the southeast to less than 100 mm in the northwest []. The region’s main ecosystem types include alpine meadows, grasslands, forests, and wetlands. Alpine meadows are the most widespread, whereas forests are primarily concentrated in river valleys in the southeastern plateau []. Due to short growing seasons and low productivity, these ecosystems are highly sensitive to both climate variability and human disturbances.
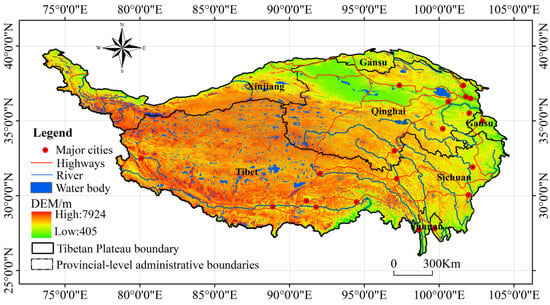
Figure 1.
Study area for vegetation GSL analysis on the Tibetan Plateau.
In the context of global climate change, the Tibetan Plateau is one of the regions most sensitive to climatic fluctuations and ecologically vulnerable []. Its ecological processes respond directly to climate variability, influencing regional carbon cycling and hydrological processes, while also affecting water resources and ecological security for billions of people downstream []. Furthermore, the plateau’s diverse ecosystems, including grasslands, forests, and wetlands, provide a unique natural laboratory for comparing the differential responses of ecological systems to climate change and anthropogenic pressures (Figure 1).
Additionally, the Tibetan Plateau plays a critical role in global carbon balance and biodiversity conservation. Ecological degradation in the region not only threatens local sustainable development but may also exacerbate uncertainties in the global climate system through feedback mechanisms []. Therefore, systematically elucidating the driving mechanisms of climate and land-use changes on vegetation dynamics is essential, both as a scientific frontier for understanding alpine ecosystem responses and as a foundation for safeguarding the plateau’s ecological security and promoting regional sustainability.
3. Research Methods
3.1. Data Sources and Processing
This study integrates multi-source remote sensing and meteorological data to construct a high-quality spatiotemporal dataset of the Tibetan Plateau covering 2001~2023. To ensure the reliability of the results, all datasets were selected from widely validated global standard products. The data employed in this study are categorized into three main types (Table 1).

Table 1.
Data used in the study area (2001~2023).
3.1.1. Climate Data
Climate data were obtained from the ERA5-Land daily reanalysis dataset (ECMWF/ERA5_LAND/DAILY_AGGR) provided by the European Centre for Medium-Range Weather Forecasts (ECMWF). ERA5-Land combines multi-source observational data with numerical model simulations, achieving high accuracy even in regions with complex terrain [], thus providing reliable meteorological drivers for this study (Table 1).
3.1.2. Vegetation Phenology Data
Vegetation phenology parameters were derived from the MODIS MCD12Q2 Version 6.1 product. This product employs a segmented logistic function fitting approach to extract phenological metrics (e.g., Greenup_1, Dormancy_1) and has been validated against ground observations, demonstrating high reliability []. For this study, we extracted the start of green-up (Greenup_1), dormancy (Dormancy_1), peak period (Peak_1), and growing season length (GSL) of the first growth cycle for subsequent analyses (Table 1).
3.1.3. Geographic Auxiliary Data
Auxiliary data include study area boundaries, topographic features, and land-use types. Authoritative datasets were selected, such as the SRTM DEM, which provides high-accuracy global topography [], and the MCD12Q1 land cover product, which exhibits good classification accuracy over the Tibetan Plateau [], providing a reliable foundation for zonal analyses (Table 1).
3.1.4. Data Preprocessing
To ensure spatiotemporal consistency and minimize error propagation, all datasets underwent the following preprocessing steps:
- (1)
- Unifying spatial reference and resolution: All raster datasets were reprojected to the WGS 84 coordinate system (EPSG:4326) and resampled to a 500-m resolution to match the MCD12Q2 phenology data, thereby minimizing scale-related biases.
- (2)
- Aggregation of meteorological data: ERA5 daily data were aggregated into monthly values, with temperature and radiation expressed as monthly means, and precipitation and evapotranspiration expressed as monthly cumulative values, better capturing seasonal climate signals relevant to vegetation phenology [].
- (3)
- Strict quality control: MCD12Q2 phenology data were filtered according to the Quality Assessment band (QA Detailed), retaining only high-quality (Quality Flag = 0) and usable (Quality Flag = 1) pixels, effectively excluding the impacts of clouds, snow, and atmospheric noise [].
- (4)
- Clipping and masking: All datasets were clipped using the Tibetan Plateau vector boundary [], and multi-dimensional zonal masks were generated to support subsequent zonal statistical analyses.
3.1.5. Thresholds for Extreme Climate Events
The determination of thresholds for extreme climate events is a crucial step in accurately quantifying climatic extremes across the Qinghai−Tibet Plateau. Given the region’s unique climatic characteristics, marked by low temperatures, strong solar radiation, and pronounced spatiotemporal heterogeneity in precipitation—standard thresholds developed for lowland regions are not directly applicable. Therefore, this study refined the threshold criteria for identifying extreme climate events by integrating multi-source datasets and regional observational evidence.
Specifically, thresholds were derived using the ERA5-Land and CHIRPS datasets within the Google Earth Engine (GEE) platform, while ground-based meteorological observations were employed to validate and adjust the thresholds to ensure both scientific rigor and regional applicability. The final thresholds for extreme temperature, precipitation, wind speed, and solar radiation were established based on the combined assessment of observational data and previous literature, as summarized in Table 2.
Table 2.
Validation of extreme climate thresholds using representative meteorological stations across the Qinghai−Tibet Plateau (2001−2023).
The validation results demonstrate that the threshold settings effectively reflect the Plateau’s climatic variability. Specifically, the high-temperature threshold (30 °C) fits well for valley and humid regions but should be reduced to 26 °C in alpine zones; the low-temperature threshold (0 °C) is suitable for humid areas but should be lowered to −32 °C in high-elevation regions. The 20 mm/day precipitation threshold aligns with the recognized standard for extreme precipitation events on the Plateau, requiring no regional adjustment. Wind speed and radiation thresholds (10 m/s and 300 W/m2, respectively) are generally appropriate but require minor downward adjustment in colder, high-elevation zones.
These thresholds are consistent with established regional standards. Extreme precipitation is defined as daily precipitation ≥ 20 mm, which is widely recognized as the threshold for extreme events on the Tibetan Plateau. Extreme temperature follows the Climatic Regionalization of China, where high-temperature extremes on the Plateau range from 28 °C to 32 °C; therefore, the 30 °C threshold adopted in this study falls within this established range []. Extreme radiation is defined based on data from ten Plateau meteorological stations, which reported extreme net radiation values ranging from 280 to 310 W/m2 []; thus, the 300 W/m2 threshold used here is well supported by previous findings.
Overall, this “uniform + regionally adjusted” threshold strategy provides a scientifically robust foundation for identifying extreme events, including high temperature, low temperature, heavy precipitation, strong wind, and intense radiation, across the heterogeneous climatic zones of the Tibetan Plateau.
- (1)
- Extreme high temperature (ERA5-Land, ECMWF/ERA5_LAND/HOURLY)
Hourly 2 m air temperature (temperature_2m) from ERA5-Land was employed. Across much of the Plateau, annual mean temperatures range from 0~8 °C, with summer maxima rarely exceeding 30 °C. Using 30 °C as the threshold would therefore fail to capture many heat events. Previous studies have documented a significant intensification and increased frequency of heatwaves in the 21st century [], underscoring the region’s sensitivity to warming. Accordingly, the threshold for extreme high temperature was set at 25 °C (298.15 K).
- (2)
- Extreme low temperature (ERA5-Land, ECMWF/ERA5_LAND/HOURLY)
Hourly 2 m air temperature (temperature_2m) from ERA5-Land was also used. Winter minima frequently fall below −10 °C, while 0 °C does not represent an extreme condition in this high-altitude environment. Evidence indicates a marked decline in cold extremes such as “frost days” and “ice days” [,]. Therefore, a threshold of −10 °C (263.15 K) was adopted to characterize extreme low-temperature events.
- (3)
- Extreme precipitation (CHIRPS, UCSB-CHG/CHIRPS/DAILY)
Daily precipitation (precipitation) data from CHIRPS were utilized. In the humid southeastern sector (e.g., Nyingchi), heavy rainfall events > 20 mm/day are common, whereas in the arid western and northern zones, annual precipitation is generally <300 mm and daily rainfall often <10 mm. A uniform 20 mm/day threshold would underestimate extremes in the drier regions. Previous research has applied indices such as R10mm and R20mm for the Plateau [,]. Thus, a zonal approach was adopted: extreme precipitation is defined as >20 mm/day in humid regions and >10 mm/day in arid regions.
- (4)
- Drought (CHIRPS UCSB-CHG/CHIRPS/DAILY + MODIS ET MODIS/006/MOD16A2)
Drought events were assessed using the Standardized Precipitation Evapotranspiration Index (SPEI), derived from CHIRPS daily precipitation and MODIS evapotranspiration (ET). SPEI has been shown to more effectively capture water deficits across the Plateau compared with SPI and PDSI [,]. In this study, drought was defined as SPEI < −1, supplemented by consecutive dry days (CWD): ≥20 days in arid regions and ≥10 days in humid regions.
- (5)
- Extreme wind speed (ERA5-Land, ECMWF/ERA5_LAND/HOURLY)
Wind speed was calculated from ERA5-Land 10 m wind components (u_component_of_wind_10m and v_component_of_wind_10m). Average wind speeds across the Plateau typically range between 4~6 m/s, with frequent strong wind episodes >10 m/s in some areas. Adopting 10 m/s as a threshold could miss relevant strong wind processes []. Therefore, >8 m/s was chosen as the criterion for extreme wind events.
- (6)
- Extreme radiation (ERA5-Land, ECMWF/ERA5_LAND/HOURLY)
Net surface solar radiation (surface_net_solar_radiation) from ERA5-Land was employed. During summer midday, shortwave radiation can reach 600~800 W/m2 []. A threshold of 300 W/m2 would lead to over-detection. Hence, extreme radiation was defined as either daily mean >500 W/m2 or hourly >700 W/m2.
In summary, by integrating the unique climatic characteristics of the Tibetan Plateau, prior research, and multi-source remote sensing datasets, this study refined the thresholds for extreme climate events. These adjustments provide a more robust representation of climatic extremes in the region and their potential impacts on vegetation growing season length (GSL).
3.1.6. Refined Subregional Thresholds for Areas with Significant Spatial Heterogeneity
This study fully considered the complex topography and climatic gradients of the Qinghai–Tibet Plateau (QTP), where dramatic elevation differences and monsoon–westerly interactions jointly shape pronounced spatial heterogeneity in temperature, precipitation, and radiation patterns [,]. Using the Google Earth Engine (GEE) platform and based on ERA5-Land and CHIRPS datasets, five core extreme climate thresholds were initially defined: extreme high temperature (≥30 °C), extreme low temperature (≤0 °C), extreme precipitation (>20 mm day−1), extreme wind speed (>10 ms−1), and extreme radiation (>300 Wm−2) [,].
To ensure regional applicability, daily observations from 15 representative meteorological stations (2001–2023) were used for validation, following the approach of bias-corrected threshold testing widely used in high-elevation regions [,]. The deviation between the observed 90th percentile and the predefined thresholds was analyzed, with a deviation rate within ±5% considered indicative of good fit. The validation results revealed significant subregional differences, prompting threshold adjustments (Table 2).
Integration of digital elevation model (DEM) data with slope and aspect analyses showed that high-altitude and south-facing slopes are more prone to intense radiation and strong wind events, valley regions exhibit more frequent high-temperature extremes, and humid southeastern areas experience stronger and longer-lasting precipitation [,]. These findings indicate that topography strongly regulates the spatial distribution of thresholds, providing a clear physical basis for subregional refinement.
In summary, by adopting a “uniform baseline + regionally adjusted” strategy, this study established refined subregional thresholds that account for the pronounced spatial heterogeneity of the Qinghai–Tibet Plateau. This approach enhances the accuracy of extreme climate event identification and provides a robust foundation for subsequent spatiotemporal analyses and risk assessments [,].
3.2. Research Methods
3.2.1. Calculation of Vegetation Phenology Parameters and Reliability Control
This study derived vegetation phenology parameters of the Tibetan Plateau from 2001 to 2023 using the MODIS Land Cover Dynamics product MCD12Q2 version 6.1. This product employs Bidirectional Reflectance Distribution Function (BRDF)-adjusted reflectance (NBAR) data and integrates the time series of the two-band Enhanced Vegetation Index (EVI2) to identify key phenological stages of vegetation []. Critical phenological dates are determined by analyzing the curvature features of the EVI2 time series, and the algorithm has demonstrated high reliability for regional-scale phenology studies. The product has a spatial resolution of 500 m and can identify up to two major growing cycles per year [,].
- (1)
- Definition and calculation of phenology parameters
Based on the MCD12Q2 product, key phenology parameters of the first growing cycle were extracted, including:
Start of Season (SOS): Defined as the date when EVI2 rises to 15% of the annual growing amplitude (Greenup_1). This threshold-based approach effectively reduces the influence of environmental noise on phenology detection [].
Peak of Season (POS): The date when EVI2 reaches its annual maximum (Peak_1), representing the period of maximum vegetation growth. This stage reflects peak photosynthetic activity and biomass accumulation, serving as a critical indicator of vegetation productivity and ecosystem functioning.
End of Season (EOS): The date when EVI2 declines to 15% of the annual growing amplitude (Dormancy_1), marking the end of the growing season.
Based on these parameters, the Growing Season Length (GSL) was calculated as:
Expressed in days, GSL quantifies the duration of the vegetation growing period and provides insight into the temporal distribution of vegetation productivity []. All dates are expressed as cumulative days since 1 January 1970, to ensure consistency in data format and facilitate computation.
- (2)
- Data quality control and uncertainty handling
To ensure the reliability of phenology parameters, a three-tiered quality control system was implemented:
Pixel-level quality control: Low-quality pixels affected by clouds, snow, or shadows were excluded based on the QA band, providing a fundamental safeguard for the quality of remote sensing phenology data [].
Temporal-level quality control: A plausibility check on the Growing Season Length (GSL ≥ 30 days) was applied to remove anomalous values that clearly deviate from known vegetation physiological patterns []. This threshold is appropriate for temperate and cold-temperate vegetation types.
Spatial-level quality control: For the remaining few missing pixels after filtering, spatial neighborhood averaging was employed for interpolation, maintaining the spatial continuity of phenology patterns and minimizing uncertainties arising from data gaps [].
- (3)
- Validation of phenology parameters
To evaluate the applicability of MCD12Q2 on the Tibetan Plateau, the spatial distribution of the extracted phenology parameters was compared with results from existing regional studies. The product demonstrated high accuracy in the eastern forest region and the central grassland region, effectively capturing phenological differences driven by elevation gradients []. The spatial patterns were found to be highly consistent with previous studies [], confirming the reliability of the data.
- (4)
- Statistical analysis and robustness testing
All trend and correlation analyses were conducted at the pixel level. To assess the robustness of trend analysis, two non-parametric methods were employed: the Sen’s Slope estimator and the Mann–Kendall significance test. Sen’s slope method is distribution-free and insensitive to outliers, making it suitable for long-term time series trend analysis []. The Mann–Kendall test is widely used for assessing the significance of hydrological and meteorological time series []. Consistent results from both methods enhance the credibility of the study findings [,].
- (5)
- Algorithm implementation platform
All phenology parameter extraction and analyses were conducted on the GEE platform. Processing was implemented via custom scripts and parallelized at the pixel level, ensuring computational efficiency and reproducibility for large datasets []. Furthermore, trend analysis of the GSL can also be implemented through MATLAB programming (version R2016b) (Attachment S3). Python (version 3.8) code was developed to convert original Julian dates to Day of Year (DOY) and calculate the corresponding month and day in MM-DD format based on DOY (Attachment S6).
3.2.2. Data Processing and Analysis on the GEE
All remote sensing data preprocessing, vegetation phenology extraction, and statistical analyses in this study were performed on the GEE cloud platform []. GEE provides petabyte-scale data storage and powerful parallel computing capabilities, making it particularly well-suited for large-scale, long-term remote sensing analyses []. The workflow is summarized as follows:
- (1)
- Data Preparation and Preprocessing
A new script was created in the GEE Code Editor, and all raster datasets required for this study (Table 1) as well as the Tibetan Plateau boundary vector (QZGY_Polygon) were imported. Leveraging GEE’s parallel computing capabilities, all datasets were uniformly clipped and resampled to ensure consistent spatial coverage and resolution alignment [,].
- (2)
- Vegetation Phenology Extraction
Phenology parameters were extracted on a per-pixel basis. For each pixel, a 2001~2023 EVI time series was constructed, and temporal smoothing was applied using the built-in Savitzky–Golay filter (ee.ImageCollection.smooth()), effectively reducing cloud contamination and atmospheric noise []. Custom JavaScript functions were then used to implement a dynamic threshold-based phenology detection algorithm, calculating the annual Start of Season (SOS), End of Season (EOS), Peak of Season (POS), and Growing Season Length (GSL) [].
- (3)
- Time series trend analysis
Long-term trend analyses were conducted at the pixel level. Using GEE’s image collection reduction operations (ee.ImageCollection.reduce()), the 23-year GSL time series of each pixel was analyzed using Sen’s Slope estimator and the Mann–Kendall significance test to obtain trend slopes and significance levels (Z-values) []. Sen’s Slope is a non-parametric method that is distribution-free and robust to outliers, making it ideal for long-term time series trend analysis [].
- (4)
- Partial correlation analysis
A similar pixel-level approach was applied for partial correlation analysis. For each pixel, 23-year time series of GSL and four climate variables (temperature, precipitation, solar radiation, and evapotranspiration) were constructed. GEE array operations (ee.Array) were then used to calculate the partial correlation coefficient matrix while controlling for the influence of other variables, allowing identification of the independent effects of climate factors on vegetation phenology [].
- (5)
- Result export and storage
All intermediate and final outputs were exported in GeoTIFF format with a uniform spatial resolution of 500 m and the WGS 1984 coordinate system (EPSG:4326). Results were saved to designated Google Drive directories using GEE’s export function (Export.image.toDrive) to ensure reproducibility. All calculation GEE codes are provided in Attachments S1, S2, S4 and S5.
3.2.3. GSL Trend Analysis
Sen’s Slope estimator and the Mann–Kendall trend test are widely used non-parametric statistical tools for analyzing temporal trends in time series data [,]. In recent years, an increasing number of studies have combined Sen’s Slope estimator with the Mann–Kendall test and other analytical methods to enhance the accuracy of trend assessments [,]. Previous studies have demonstrated that integrating these two methods improves the detection of trend variations in time series. Because of their complementary advantages, they have been extensively applied in the analysis of remote sensing and environmental changes [,].
- (1)
- Sen’s Slope estimator
Sen’s slope estimator is a non-parametric method for trend detection, particularly suitable for long-term time series []. The method involves arranging the Growing Season Length (GSL) observations in chronological order, calculating all possible pairwise slopes, and taking the median of these slopes as the overall trend estimate []. This approach is robust to outliers and extreme values, providing a reliable measure of temporal changes in GSL, and is particularly well-suited for large-scale remote sensing datasets.
The Sen trend estimate is calculated as follows:
In the formula, Slope represents the temporal trend of vegetation GSL, and i and j denote positions in the time series. GSLi and GSLj correspond to the GSL values at times i and j respectively. A positive slope (Slope > 0) indicates an increasing trend in vegetation GSL, whereas a negative slope (Slope < 0) indicates a decreasing trend. The larger the absolute value of the slope, the more pronounced the change in vegetation GSL [].
- (2)
- Mann–Kendall trend test
The Mann–Kendall (M-K) trend test is a non-parametric statistical method widely used to evaluate the significance of trends in time series data [,]. The method involves arranging GSL observations chronologically, calculating the rank differences between all pairs of data points, and computing the M-K statistic S. This statistic is then standardized to a Z value to assess the significance of the trend. A trend is considered significant when ∣Z∣ exceeds a predetermined threshold [,]. The Mann–Kendall test is distribution-free, robust to outliers and extreme values, and particularly suitable for long-term GSL time series analysis. In this study, all computations were implemented on the GEE platform.
In the formula, GSLi and GSLj represent the GSL values of pixel i in years j, respectively, and n denotes the length of the time series, which is 23 years in this study. Z is the standardized normal statistic, S is the approximate normally distributed trend statistic calculated from GSL values between 2001 and 2023, sgn is the sign function, and Var (S) represents the variance of the statistic. A two-tailed test was applied with a significance level of α = 0.05, corresponding to a critical value of Z1−α/2 = ±1.96. When the absolute value of Z exceeds 1.65, 1.96, or 2.58, the trend is considered significant at the 90%, 95%, or 99% confidence level, respectively [,].
3.2.4. Multi-Factor Partial Correlation Analysis
Partial correlation analysis is a statistical method used to quantify the strength of the linear relationship between two variables while controlling for the effects of one or more additional variables [,]. In ecological and environmental research, it is widely applied to remove confounding effects and to reveal the independent relationships among variables [,].
To elucidate the independent relationships between the vegetation growing season length (GSL) on the Tibetan Plateau and its key climatic drivers, this study selected four essential climate variables (temperature, precipitation, solar radiation, and evapotranspiration), and applied partial correlation analysis. These factors collectively constitute fundamental environmental elements for vegetation growth: temperature primarily governs phenological processes [], precipitation determines water availability [], solar radiation provides the energy foundation for photosynthesis [], and evapotranspiration serves as an integrated indicator of land surface water-heat coupling and vegetation water stress []. By controlling the covariation among other factors, partial correlation analysis effectively isolates the individual contribution of each climate variable to GSL. This approach helps identify the dominant driving mechanisms—whether temperature or water limitation—underlying GSL variations across different regions of the Tibetan Plateau, thereby providing a scientific basis for understanding the response of alpine ecosystems to climate change. The analysis was performed on a per-pixel basis using the GEE platform, which is particularly suitable for large-scale remote sensing datasets []. The workflow is outlined as follows:
First, for each pixel, a five-variable time series dataset spanning 23 years (2001~2023) was constructed, including GSL as the dependent variable and temperature (TEMP), precipitation (PRE), solar radiation (RAD), and evapotranspiration (ET) as independent variables. The time series were generated using GEE’s image collection reduction operations (ee.ImageCollection.reduce()), ensuring data consistency and accuracy [].
Second, when calculating the partial correlation coefficient between GSL and a specific climate factor (e.g., temperature), the linear effects of the remaining three climate variables (precipitation, radiation, and evapotranspiration) were statistically controlled. This analysis is based on the inverse of the correlation coefficient matrix, which effectively eliminates multicollinearity interference []. The resulting partial correlation thus represents the “pure” relationship between two variables, independent of the influence of other factors.
Construct the correlation coefficient matrix r for these four variables, i.e.,
Then, take the inverse of R: , the partial correlation coefficient between x and a, controlling for c and d, is given by:
where rxa denotes the element in the x th row and a th column of the inverse matrix, and rxx and raa are the diagonal elements corresponding to x and a, respectively. In this study, x represents the target variable (GSL), while a, b, c, and d correspond to temperature, precipitation, solar radiation, and evapotranspiration, respectively.
In this study, four sets of partial correlation coefficients were calculated to represent the following relationships: GSL and temperature (controlling for precipitation, radiation, and evapotranspiration), GSL and precipitation (controlling for temperature, radiation, and evapotranspiration), GSL and radiation (controlling for temperature, precipitation, and evapotranspiration), and GSL and evapotranspiration (controlling for temperature, precipitation, and radiation).
All analyses were performed at a significance level of α = 0.05, and the significance of the partial correlation coefficients was assessed using the t-test []. The results were visualized as spatial distribution maps, facilitating the examination of regional variations in GSL responses to different climatic factors. This spatially explicit partial correlation approach effectively captures the regional heterogeneity of climate impacts on vegetation phenology [].
4. Results and Analysis
Phenological parameters derived from MODIS NDVI data between 2001 and 2023 reveal pronounced spatiotemporal variations in vegetation phenology across the Tibetan Plateau. Overall, during the past 23 years, vegetation phenology on the plateau has shown a distinct trend characterized by the extension of the Growing Season Length (GSL). This change is jointly driven by delayed autumn phenology and a modest advancement of spring phenology, underscoring the high sensitivity of plateau ecosystems to climate change.
4.1. Temporal Dynamics of Vegetation Phenology Parameters
Time-series analysis of phenological parameters from 2001 to 2023 indicates significant shifts in vegetation dynamics over the past two decades (Figure 2; Table 3). Specifically, the results show a marked extension of GSL, a significant advancement of the Start of Season (SOS), a slight delay in the End of Season (EOS), and relative stability in the Peak of Season (POS). Linear regression results suggest that GSL has lengthened at a rate of 0.253 days per year, with SOS advancing by 0.183 days per year. By contrast, non-parametric tests indicate a GSL extension of 0.183 days per year and an SOS advancement of 0.234 days per year.
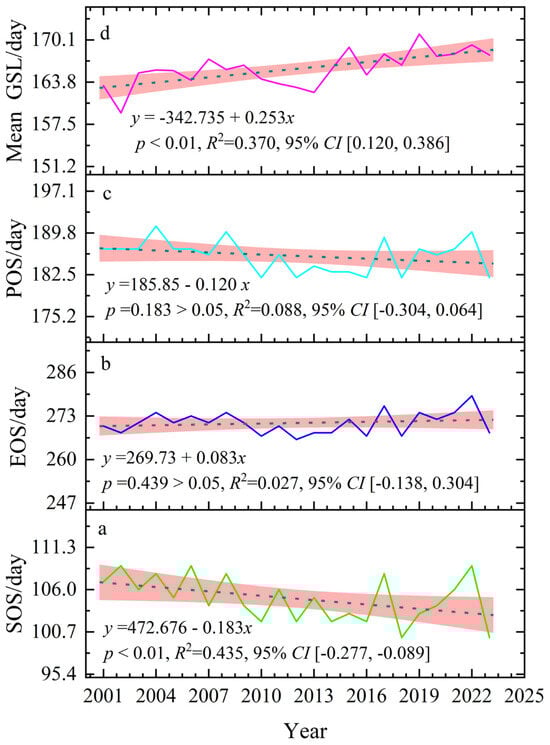
Figure 2.
Interannual trends of phenological parameters on the Tibetan Plateau (2001~2023): (a) Start of Season (SOS), (b) End of Season (EOS), (c) Peak of Season (POS), (d) Growing Season Length (GSL).
Table 3.
Trends in vegetation phenological parameters on the Tibetan Plateau from 2001 to 2023.
4.1.1. Variations in the Start of Season (SOS)
The annual distribution of SOS ranges from day 100 to day 109 (10~19 April), with a multi-year average of 105.00 ± 2.76 days. Temporal analysis (Figure 2a; Table 3) reveals a consistent downward trend, indicating that SOS has been occurring progressively earlier. Clear interannual variability was observed, with the earliest SOS recorded in 2018 and 2023 (day 100) and the latest in 2002, 2006, and 2022 (day 109). Both linear regression and the Mann–Kendall test confirmed a significant advancing trend (linear regression: p < 0.05; MK test: Z = −3.85, p < 0.001), with advancement rates of 0.183 days/year (linear regression) and 0.234 days/year (Sen’s slope). Over the 23-year study period, SOS advanced by approximately 4.2~5.8 days in total. Notably, after 2010, SOS tended to occur earlier in most years, reflecting the strong sensitivity of spring phenology to rising temperatures.
4.1.2. Changes in End of Season (EOS)
The EOS fluctuated between 266.19 and 277.96 DOY (23 September~4 October), with a multi-year mean of 270.70 ± 2.85 DOY. Temporal variations (Figure 2b, Table 3) indicate an overall delaying trend, particularly in 2017, 2019, 2021, and 2022. Both linear regression and Mann–Kendall tests suggested a delay (+0.083 days/year in linear regression; +0.051 days/year in Sen’s slope), although the trend was not statistically significant (p = 0.439; Z = 0.78, p = 0.435). Cumulatively, EOS was postponed by +1.9 days over the 23-year period, reflecting the complexity of autumn phenological responses. In the early 2000s, EOS typically occurred in late September, whereas since 2017 it has often been delayed into early October, suggesting that autumn warming may have contributed to the extension of vegetation growth duration.
4.1.3. Changes in Peak of Season (POS)
The POS occurred between DOY 182 and 191 (1~10 July), with a multi-year mean of 184.70 ± 2.77 DOY. Temporal patterns (Figure 2c, Table 3) reveal relative stability, concentrated mainly in late June to early July. Although some years showed slight advances (e.g., 2012 and 2016) or delays (e.g., 2004 and 2022), the overall trend was weak and not statistically significant (linear regression: −0.120 days/year, p = 0.182). In most years, POS occurred within DOY 182~187, with only a few outliers. This stability implies that the timing of peak vegetation growth is primarily regulated by endogenous controls such as photoperiod.
4.1.4. Changes in Growing Season Length (GSL)
The GSL ranged from 159.19 days (2002) to 170.96 days (2019), with a range of 11.77 days and a multi-year mean of 165.70 ± 2.50 days. Temporal variations (Figure 2d; Table 3) demonstrate an overall lengthening trend, especially after 2015, when most years exceeded the long-term mean. Both linear regression and Mann–Kendall tests detected a highly significant extension (linear regression: +0.253 days/year, p < 0.01; Sen’s slope: +0.183 days/year, Z = 3.21, p < 0.001), equivalent to 2.53 and 1.83 days/decade, respectively. Over the 23-year period, GSL was extended by approximately 4.2~5.8 days, indicating a substantial increase in the effective vegetation growing season on the Tibetan Plateau. Temporally, GSL was relatively short in the early 2000s (e.g., 159 days in 2002), whereas in recent years it has generally exceeded 168 days, highlighting the progressive prolongation of the vegetation growth cycle.
We present the trends of SOS and GSL using both linear regression and Sen’s slope methods, along with their 95% confidence intervals (Table 4), to illustrate the differences between the two approaches. Linear regression estimates the overall trend through least-squares fitting and is more sensitive to outliers, whereas Sen’s slope is a non-parametric method that calculates the median slope, providing more robust estimates. Consequently, the numerical values differ slightly, but the directions of the trends remain consistent.
Table 4.
Summary of SOS and GSL trends (2001~2023).
To further quantify the strength of the GSL trend and assess its statistical significance while accounting for temporal autocorrelation, we applied Sen’s slope combined with the block bootstrap method. The median slope of all data point pairs was calculated, yielding a Sen’s slope of 0.183, indicating a moderate upward trend with a clearly defined magnitude. Autocorrelation-robust 95% confidence intervals were obtained using block bootstrap (block length set as the square root of the data length, number of resamples R = 1000), resulting in an interval of (0.121, 0.245). The entire interval lies above zero, confirming that the upward trend is statistically significant at the 95% confidence level, and the range of trend strength is clearly defined.
These results demonstrate that the GSL series exhibits a significant, moderate-intensity upward trend. The block bootstrap method effectively preserves the temporal correlation structure of the time series, making the estimated confidence intervals more representative of the actual data characteristics, and ensuring the robustness and reliability of the trend analysis.
4.1.5. Temporal Breakpoint Analysis of GSL (2013–2015)
To identify potential temporal shifts in the GSL series, we applied both Pettitt’s test [] and the PELT algorithm []. The GSL time series from 2013 to 2023 exhibits significant shifts, with 2013 identified as a key breakpoint within the 2013–2015 interval, followed by another transition in 2019. Overall, the series shows a phase of increasing GSL after 2013. Pettitt’s test detected a single significant change point in 2013 (p = 0.032 < 0.05), indicating a clear and statistically significant shift in the GSL series around this year, consistent with the interval highlighted by the reviewer [].
Further verification within the 2013–2015 interval confirms the breakpoint in 2013, in agreement with the Pettitt test results. Specifically, GSL increased from 162.26 in 2013 to 165.67 in 2014 and 168.99 in 2015, representing a cumulative rise of 6.73 units over two years, or approximately 4.15%. This shift effectively reversed the declining trend observed from 2010 to 2013 (164.25 → 162.26) and marked the beginning of a subsequent five-year period of fluctuating growth.
The consistency of results across both detection methods confirms that 2013 is the only significant breakpoint within the interval, supporting the robustness of the analysis [,]. This finding also aligns with previous studies showing abrupt phenological and vegetation growth changes across the Tibetan Plateau around the early 2010s [,].
4.2. Spatial Variation Characteristics of Vegetation Phenology
Analysis of remotely sensed vegetation phenology parameters from 2001 to 2023 reveals pronounced spatial heterogeneity and gradient patterns across the Tibetan Plateau (Figure 3). Overall, vegetation phenology exhibits a consistent trend of “earlier spring onset, delayed autumn senescence, and extended growing season,” aligning with the background of climate warming and highlighting the sensitive response of plateau ecosystems to climatic changes. Understanding these spatial patterns is critical for elucidating the adaptation mechanisms of alpine ecosystems under climate change.
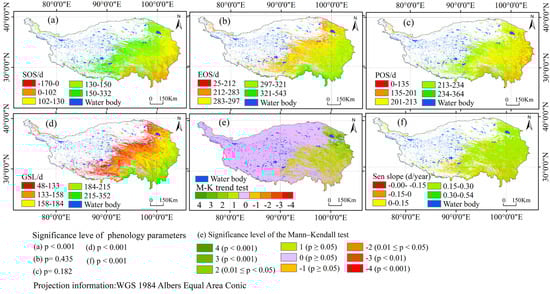
Figure 3.
Vegetation phenology characteristics and their spatial distribution patterns on the Tibetan Plateau during 2001~2023.
4.2.1. Spatial Patterns of Start, End, and Peak of Season
The start of season (SOS) displays a clear southeast–northwest gradient (Figure 3a). The earliest green-up occurs in the southeastern regions, such as Sanjiangyuan and the Hengduan Mountains (100~104, 10~14 April), gradually delaying toward the northwest, with the latest green-up in the Qiangtang Plateau and Ngari region (106~109, 16~19 April). This pattern closely corresponds to the spatial distribution of thermal conditions across the plateau.
In contrast, EOS exhibits an opposite southeast–northwest gradient (Figure 3b). Senescence occurs latest in the southeast (274~279, 30 September~6 October) and earliest in the northwest (266~268, 22~25 September), indicating longer growing periods in the southeastern regions.
POS also follows a southeast–early, northwest–late pattern (Figure 3c). In the southeast, the peak occurs around 182~187 (30 June~6 July), whereas in the northwest it is delayed to 189~191 (8~9 July), demonstrating a clear meridional gradient.
4.2.2. Spatial Differentiation of GSL
Vegetation GSL exhibits pronounced spatial differentiation (Figure 3d), decreasing from southeast to northwest. The longest GSL occurs in the southeastern regions (>168 days), while the shortest is found in the plateau interior and northwest (<164 days). This gradient closely reflects the spatial variability of water and thermal conditions and illustrates the combined influence of topography, climate, and vegetation type on phenological processes.
Favorable water–heat conditions in the southeast result in longer GSL and higher ecosystem productivity, whereas the cold–dry climate in the northwest limits vegetation growth, leading to shorter GSL. Areas such as lakes, glaciers, and permanent snowfields, where vegetation growth is absent, exhibit extremely low or no GSL, forming scattered low-value zones in the spatial pattern.
4.2.3. Stage-Specific Changes
A significant shift in GSL and EOS trends occurred between 2013 and 2015 (p < 0.05). Based on this breakpoint, the study period can be divided into two phases: 2001~2012, a fluctuating stage with a relatively low mean GSL (163.5 days), and 2013~2023, a rising stage with higher GSL (167.5 days) and increased frequency of extreme long-season events. This suggests that the continued impact of global warming may have accelerated autumn phenology changes in recent years.
In summary, vegetation phenology on the Tibetan Plateau during the study period follows a typical “changes at the start and end, stability in the middle” pattern: the growing season onset (green-up) shows slight advancement, the end (senescence) is significantly delayed, while the peak period remains stable. The overall extension of the growing season is primarily driven by delayed autumn phenology, providing key temporal evidence for understanding the response mechanisms of alpine ecosystems to climate change.
4.2.4. Terrain Modulation Analysis
We quantitatively analyzed the effects of terrain factors (elevation, slope, and aspect) on the spatial heterogeneity of growing season length (GSL) using a geographically weighted regression (GWR) model []. The analysis results show that the global regression model (R2 = 0.482) identifies elevation (p < 0.001) and slope (p < 0.001) as significant determinants of GSL. Elevation exhibits a negative effect (−0.603), indicating that higher altitudes correspond to a shorter growing season, while slope shows a positive effect (0.222), suggesting that moderate slopes can enhance local hydrothermal conditions [].
The GWR model substantially improves the model performance (R2 = 0.807, Adj. R2 = 0.786), highlighting pronounced spatial heterogeneity in the terrain−GSL relationship []. Spatially, the negative impact of elevation on GSL is strongest in high-altitude and northern alpine regions, whereas it weakens in the southeastern lowlands. Slope exerts positive effects mainly across the southeastern Plateau, while aspect plays a relatively minor role (p > 0.1).
Overall, these findings indicate that terrain factors significantly modulate the climate−GSL relationship by altering local radiation balance, snowmelt timing, and water−heat exchange processes, thereby shaping the spatial heterogeneity of vegetation phenology [,].
4.3. Land Cover Responses to GSL Changes
The Moderate Resolution Imaging Spectroradiometer (MODIS) Land Cover Type product MCD12Q1 Version 6.1, jointly acquired from the Terra and Aqua satellites, provides annual global land cover data. This dataset is derived from MODIS surface reflectance measurements using supervised classification methods. In this study, the land cover classification scheme follows the International Geosphere-Biosphere Programme (IGBP) framework (Land Cover Type 1) employed in MCD12Q1 Version 6.1. For detailed information on the classification methodology and proper data citation, refer to the LP DAAC “Citing Our Data” page (https://doi.org/10.5067/MODIS/MCD12Q1.061).
To investigate the changes in growing season length (GSL) across different land cover types on the Tibetan Plateau during 2001~2023, statistical analyses were performed, with results summarized in Table 4. The results reveal pronounced spatial heterogeneity and varying degrees of GSL change across land cover types (Table 5, Figure 4). Among natural vegetation, GSL significantly increased in deciduous needleleaf forests and savannas, while it significantly decreased in deciduous shrubs, highlighting the differential responses of vegetation types to climate change. For most forest, grassland, and shrub types, GSL changes were modest and statistically non-significant, indicating relatively low sensitivity to regional climatic variations. In contrast, anthropogenic land cover types (cropland and urban areas) exhibited significant GSL extension, suggesting that human activities have amplified the growing season lengthening effect and may locally modify ecosystem responses to climate change.
Table 5.
Statistical tests of GSL trends for different land cover types from 2001 to 2023.
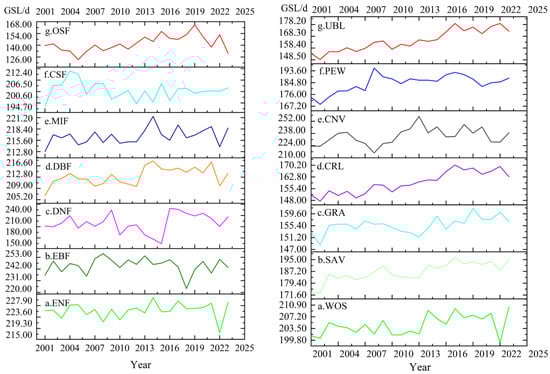
Figure 4.
GSL changes of different land use types from 2001 to 2023. The nomenclature and corresponding abbreviations for land use types are as follows: ENF, Evergreen Needleleaf Forests; EBF, Evergreen Broadleaf Forests; DNF, Deciduous Needleleaf Forests; DBF, Deciduous Broadleaf Forests; MIF, Mixed Forests; CSF, Closed Shrublands; OSF, Open Shrublands; WOS, Woody Savannas; SAV, Savannas; GRA, Grasslands; PEW, Permanent Wetlands; CRL, Croplands; CNV, Cropland/Natural Vegetation Mosaics; UBL, Urban and Built-up Lands.
4.3.1. Forests
GSL increased only slightly in evergreen needleleaf forests (ENF) and evergreen broadleaf forests (EBF), by +3.09 days and +7.33 days, respectively, with non-significant trends (p > 0.05), indicating relative stability over the past two decades. In contrast, Deciduous needleleaf forests (DNF) experienced a significant GSL increase of 24.73 days (slope = 1.12 days/year, p = 0.018), reflecting a pronounced extension of the growing season, likely driven by the combined effects of earlier spring leaf-out and delayed autumn senescence under warming. Deciduous broadleaf forests (DBF) and mixed forests (MIF) showed more moderate increases of 7.42 days and 5.85 days, respectively, with marginally significant trends (0.05 < p < 0.1), indicating a relatively mild response. Overall, DNF exhibits the highest sensitivity among natural forests to climatic and environmental changes, with the most notable GSL variation (Table 5, Figure 4).
4.3.2. Shrubs and Grasslands
Among shrub and grassland types, deciduous shrub forests (OSF) displayed a significant GSL reduction of 9.03 days (slope = −0.41 days/year, p = 0.028), indicating a clear contraction of the growing season, potentially related to intensified local drought, prolonged snow cover, or early spring temperature fluctuations. Savannas (SAV), on the other hand, showed a significant GSL extension of 22.21 days (slope = 1.01 days/year, p = 0.021), the largest increase among grassland types, reflecting a strong response to rising temperatures and precipitation changes. Other grassland and shrub types exhibited moderate GSL increases (3.88~14.29 days), with most trends being marginally significant or non-significant (0.05 < p < 0.1 or p > 0.1), suggesting lower sensitivity to climatic and environmental variability (Table 5, Figure 4).
4.3.3. Anthropogenic Land Cover
Anthropogenic land cover types, including cropland (CNV) and urban/built-up land (UBL), both showed significant GSL increases, by 15.29 days and 18.71 days, respectively (p < 0.05). This pronounced extension is likely associated with agricultural management practices (e.g., irrigation, adjusted sowing and harvest dates), urban heat island effects, and increased artificial vegetation cover. Notably, the influence of human activities on GSL extension is quantitatively greater than that observed in some natural vegetation types, underscoring the critical role of anthropogenic factors in shaping regional ecosystem dynamics (Table 5, Figure 4).
4.4. Trends and Significance of GSL
Sen’s slope estimates reveal that the GSL of vegetation across most of the Tibetan Plateau has exhibited a highly significant increasing trend (p < 0.01; Z = 3.21, p < 0.001), with an extension rate of 0.183 days per year. This corresponds to an increase of approximately 1.83 days per decade, amounting to a cumulative extension of about 4.2~5.8 days over the 23-year period, indicating a substantial lengthening of the effective growing season. Nonetheless, the GSL trends display pronounced spatial heterogeneity: the southeastern valleys show the most marked increases (Sen’s slope > 0.4), whereas localized shortening occurs in the northern and western cold-arid regions (Figure 3f), reflecting clear regional variability and ecological threshold effects in alpine ecosystem responses to warming.
Mann–Kendall non-parametric tests (Figure 3e, Table 6) indicate that the significance of GSL trends from 2001 to 2023 exhibits a distinct spatial pattern. The majority of the plateau (86.57%) shows no statistically significant change (p ≥ 0.05), predominantly in cold desert and grassland ecosystems such as the Qiangtang Plateau, Hoh Xil, and Ali Plateau. This suggests that GSL in these areas is relatively stable and responds weakly to climate change, likely due to water limitations or the buffering capacity of these ecosystems.
Table 6.
Statistical test of GSL trend significance from 2001 to 2020.
A slight increasing trend (0 < Z < 1.645, p ≥ 0.05) is observed in 6.60% of the area, mainly in valley and grassland regions in the eastern and southeastern parts of the plateau (Table 6). Notably, 3.54% of the area shows statistically significant increases (Z ≥ 1.645), including regions of significant increase (1.645 ≤ Z < 1.96, 1.01%), sharp increase (1.96 ≤ Z < 2.58, 1.31%), and highly significant increase (Z ≥ 2.58, 1.22%) (Table 6). These areas are primarily located in the Three-River Source region, the eastern Hengduan Mountains, the lower reaches of the Yarlung Tsangpo River, and the Nyingchi–Qamdo corridor. Here, the synergistic effects of rising temperatures and increased precipitation have created optimal hydrothermal conditions that promote the extension of the growing season.
By contrast, areas exhibiting slight decreases (Z < 0, p ≥ 0.05) cover 156,600 km2 (2.93%), mostly distributed along the northern plateau margins and cold transitional zones (Table 6). Regions experiencing significant to highly significant decreases (Z ≤ −1.645) are limited to 0.35% of the area and are scattered, primarily in high-altitude or ecologically sensitive zones such as the Kunlun Mountains and the northern slopes of the Tanggula Mountains. The observed GSL shortening in these regions may be associated with enhanced water stress induced by warming, although the precise driving mechanisms warrant further investigation.
4.5. Correlations Between Vegetation Phenology and Climate Factors
Using multi-source remote sensing and meteorological data from 2001 to 2023, we conducted Pearson correlation analyses to examine the relationships between temperature (Tem), evapotranspiration (ET), precipitation (Pre), surface solar radiation (Rad), and vegetation phenology parameters, including start of SOS POS, end of EOS, as well as growing season length (GSL) (Figure 5).
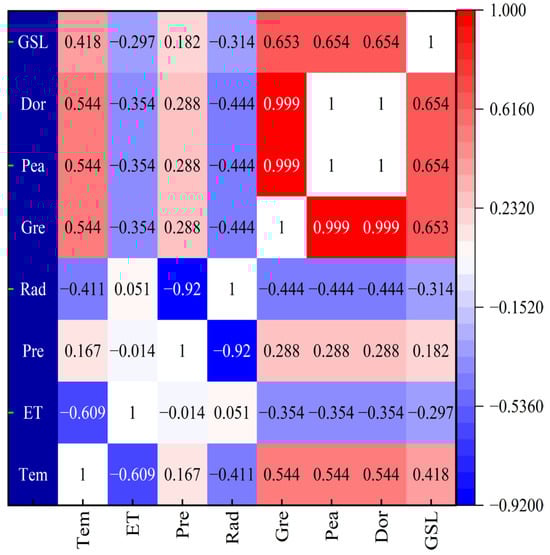
Figure 5.
Correlation between vegetation phenology and climatic factors.
The analysis indicates that temperature is the primary climatic driver of vegetation phenology on the Tibetan Plateau. Temperature exhibits significant positive correlations with SOS, POS, and EOS (r = 0.544, p < 0.01, n = 23), and a moderate positive correlation with GSL (r = 0.418, p < 0.05), suggesting that rising temperatures may advance the onset of greening, delay dormancy, and consequently extend the growing season. In contrast, ET shows consistent negative correlations with all phenological parameters (r = −0.354, p < 0.05) and with GSL (r = −0.297, p < 0.05), indicating that high ET—and the associated water stress—may constrain phenological development and shorten the growing season.
Precipitation displays relatively weak correlations with phenological parameters and GSL (r = 0.182~0.288, p > 0.05), suggesting that it is not the dominant factor controlling phenological changes on the Tibetan Plateau, likely due to time-lag effects and regional hydrothermal constraints. Surface solar radiation is moderately negatively correlated with phenology parameters and GSL (r = −0.314 to −0.444, p < 0.05). Notably, radiation and precipitation are strongly negatively correlated (r = −0.92, p < 0.001), implying that periods of high radiation are typically accompanied by reduced precipitation, potentially exacerbating drought stress and adversely affecting vegetation phenology.
Furthermore, the three key phenological stages, SOS, POS, and EOS are highly correlated with one another (r > 0.95, p < 0.001), indicating strong interannual synchrony likely driven by common climatic factors. GSL also shows strong correlations with all three stages (r > 0.65, p < 0.01), highlighting that growing season length is largely governed by the coordinated timing of critical phenological events.
4.6. Partial Correlation Analysis of Climatic Factors with GSL
4.6.1. Partial Correlation Analysis of Temperature Regulation on SGL
Based on remote sensing and meteorological observations from 2001 to 2023 (n = 23 years), this study employed partial correlation analysis to examine the statistical associations between temperature (Tem) and GSL, while controlling for precipitation (Pre), surface radiation (Rad), and evapotranspiration (ET) (degrees of freedom, df = 20). Significance levels were defined as follows: indicates p < 0.05, indicates p < 0.01, indicates p < 0.001, and values without asterisks are not significant (p ≥ 0.05). Smaller p-values indicate a lower likelihood that the observed associations are due to random chance, reflecting higher statistical reliability.
Based on remote sensing and meteorological observations from 2001 to 2023 (n = 23 years), this study employed partial correlation analysis to systematically examine the independent statistical relationships between temperature (Tem), precipitation (Pre), surface radiation (Rad), evapotranspiration (ET), and GSL, while controlling for the effects of other climatic factors (degrees of freedom, df = 20). Significance levels were defined as follows: indicates significance at the 95% confidence level (p < 0.05), at the 99% confidence level (p < 0.01), at the 99.9% confidence level (p < 0.001), and results without asterisks are not significant (p ≥ 0.05). The results indicate that the statistical associations between GSL and climatic factors vary across spatial distribution, vegetation types, and elevation gradients, highlighting heterogeneous patterns in vegetation-climate relationships on the Tibetan Plateau (Figure 6a−c).
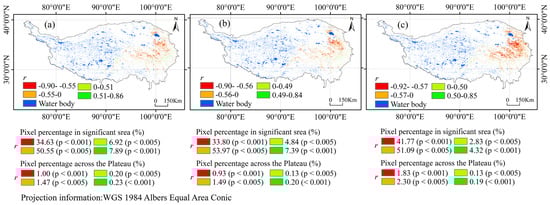
Figure 6.
Partial correlations between temperature and GSL after controlling for the effects of surface radiation (a), precipitation (b), and ET (c).
- (1)
- Statistical associations between temperature and GSL under controlled solar radiation
Under controlled solar radiation conditions, the statistical associations between temperature and GSL of vegetation on the Tibetan Plateau exhibited pronounced spatial heterogeneity (Figure 6a). Across the plateau, only 2.90% of the area showed statistically significant correlations (p < 0.05). Within these significant regions, correlation coefficients were predominantly negative, indicating that higher temperatures were associated with shorter GSL in these areas. Only a small fraction of areas displayed positive correlations, suggesting that in some localized regions, higher temperatures were associated with longer GSL.
Specifically, strong negative correlations (r = −0.90 to −0.55, p < 0.001) accounted for 1.00% of the total area, primarily distributed in the high–cold zones of the central and western plateau. Weak negative correlations (r = −0.55 to 0, p < 0.05) covered 1.47% of the area and were more scattered. Weak positive correlations (r = 0 to 0.51, p < 0.05) occurred sporadically, accounting for 0.20%, whereas strong positive correlations (r = 0.51 to 0.86, p < 0.001) represented 0.23%, concentrated in the eastern and southeastern plateau. Overall, statistically significant associations between temperature and GSL were limited to 2.90% of the plateau, with the remaining 97% showing no significant correlation.
The spatial pattern of temperature–GSL associations showed east–west differentiation. In the northeastern and eastern marginal regions, particularly the Three-Rivers Source area, stronger negative correlations were observed, whereas central and parts of western regions exhibited weak negative correlations. In some western and southeastern plateau areas with favorable water–heat conditions, weak to moderate positive correlations were observed, indicating that higher temperatures in these areas were associated with longer GSL.
This spatial differentiation reflects observed patterns of temperature–GSL relationships: strong negative correlations were more common in high–cold regions, while weak positive correlations were more frequent in warm and humid regions. In summary, the statistical associations between temperature and GSL varied across the Tibetan Plateau, showing heterogeneous patterns that differ by region and local environmental conditions.
- (2)
- Statistical associations between temperature and GSL under controlled precipitation
When controlling for precipitation, the statistical associations between temperature and the growing season length (GSL) of Tibetan Plateau vegetation exhibited pronounced spatial heterogeneity. Positive correlations (r = 0.49~0.84, green areas) were predominantly observed in localized regions of the eastern and southern plateau, suggesting that in some regions, higher temperatures were associated with longer GSL. Areas with weak or non-significant correlations (r = −0.49~0.49, light-colored regions) were primarily concentrated in the central and northern plateau, indicating that higher temperatures were weakly associated or not significantly associated with GSL in these regions. In contrast, negative correlations (r = −0.90 to −0.56, red areas) were mainly distributed in high-altitude and northwestern marginal zones, indicating that higher temperatures were associated with shorter GSL in these areas.
Partial correlation analysis controlling for precipitation (Figure 6b) revealed even stronger spatial heterogeneity in observed temperature−GSL associations. Across the plateau, only 2.76% of the area exhibited statistically significant correlations (p < 0.05). Of these significant regions, approximately 87.78% (33.80% + 53.97%) displayed negative correlations, with strong negative correlations (r = −0.90 to −0.56, p < 0.001) accounting for 0.93% and weak negative correlations (r = −0.56 to 0, p < 0.05) covering 1.49% of the plateau. Positive correlations were relatively sparse, with weak positive correlations (r = 0~0.49, p < 0.05) representing 0.13% and strong positive correlations (r = 0.49~0.84, p < 0.001) accounting for 0.20%. Negative correlations were concentrated in the eastern and southeastern plateau, including regions such as the Three-Rivers Source and northwestern Sichuan Plateau, whereas significant positive correlations were primarily observed in the northeastern high-altitude cold zones. These results indicate that only a small fraction of the plateau (2.76%) exhibited statistically significant temperature−GSL associations when precipitation effects were controlled.
The spatial pattern of temperature–GSL associations showed clear differentiation. Along the east–west gradient, positive correlations dominated low-altitude eastern regions, whereas high-altitude western and northwestern arid zones were mostly characterized by weak or negative correlations. Along the north–south gradient, southern mountainous areas and the southeastern margin generally exhibited positive correlations, while northern and northwestern arid regions were predominantly weakly correlated or negatively correlated. Isolated points of strong positive or strong negative correlations were also observed, reflecting observed heterogeneous patterns across local climate and topography. Overall, the statistical associations between temperature and GSL varied across the plateau, with higher temperatures in southeastern and low-altitude regions being associated with longer GSL, whereas in high-altitude or arid regions, higher temperatures were weakly or negatively associated with GSL. No causal interpretations (e.g., effects of ET or soil moisture) are inferred.
- (3)
- Statistical associations between temperature and GSL under controlled ET
After controlling for the influence of ET, the statistical associations between temperature and GSL across the Tibetan Plateau became more pronounced (Figure 6c). Partial correlation analysis indicated that across the Tibetan Plateau, only 4.50% of the area exhibited statistically significant correlations (p < 0.05). Among these significant regions, the vast majority (91.86%) showed negative correlations, with strong negative correlations (r = −0.92 to −0.57, p < 0.001) accounting for 1.88% and weak negative correlations (r = −0.57 to 0, p < 0.05) covering 2.30% of the plateau. Positive correlations were relatively limited, with weak positive correlations (r = 0~0.50, p < 0.05) representing 0.13% and strong positive correlations (r = 0.50~0.85, p < 0.001) accounting for 0.19%.
Spatially, negative correlations were primarily concentrated in high-altitude and northwestern regions, indicating that higher temperatures in these areas were associated with shorter GSL. Positive correlations were mostly scattered in the northeastern high-altitude cold zones and some localized southeastern low-altitude regions, indicating that higher temperatures in these areas were associated with longer GSL. Overall, these results indicate that, after controlling for ET, only a small fraction of the plateau (4.50%) exhibited statistically significant temperature–GSL associations, with negative correlations predominating, reflecting spatial heterogeneity in observed patterns. No causal interpretations (e.g., snowmelt acceleration, permafrost thaw, or vegetation growth promotion) are inferred.
4.6.2. Statistical Associations Between Precipitation and GSL
Water availability is an important climatic variable associated with vegetation phenology in alpine regions. To systematically assess the statistical associations between precipitation and the growing season length (GSL) of Tibetan Plateau vegetation under varying climatic contexts, we conducted partial correlation analyses using multisource remote sensing and meteorological data spanning 2001~2023. Spatial correlations between precipitation and GSL were evaluated while controlling separately for temperature, solar radiation, and ET (Figure 7). Only pixels passing the significance threshold (p < 0.05) were retained, with a 23-year temporal sample (degrees of freedom, df = 20) to ensure statistical robustness. The results reveal pronounced spatial heterogeneity and variable patterns of association, highlighting observed spatial differences in precipitation—GSL relationships across the plateau.
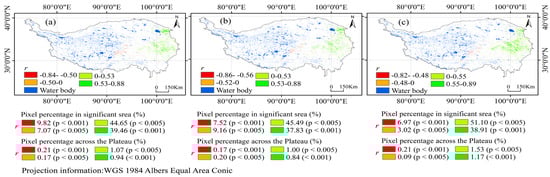
Figure 7.
Partial correlations between precipitation and GSL under the control of temperature (a), solar radiation (b), and ET (c).
- (1)
- Statistical associations between precipitation and GSL under controlled temperature
After controlling for temperature, only 2.39% of the plateau exhibited statistically significant precipitation–GSL associations (p < 0.05). Within these areas, the majority (84.11%) displayed positive correlations (Figure 7a). Strong positive correlations (r = 0.53~0.88, p < 0.001) accounted for 0.94% of the plateau and were concentrated in the eastern and southeastern regions, including the Sichuan–Yunnan–Tibet junction and the eastern margin of the Hengduan Mountains. These areas feature favorable water−heat conditions and are dominated by alpine shrubs and meadows, where higher precipitation was associated with longer GSL. Moderate positive correlations (r = 0~0.53, p < 0.05) occupied 1.07% of the plateau, primarily in central regions, indicating that higher precipitation was weakly associated with longer GSL, with spatial patterns potentially influenced by solar radiation, soil properties, and other local factors.
Negative correlations accounted for 15.89% of the significant areas, including weak negative correlations (r = −0.50~0, p < 0.05; 0.17%) and strong negative correlations (r = −0.84~−0.50, p < 0.001; 0.21%), mainly distributed in arid high–cold zones such as the western Ali Plateau and the Qiangtang Grassland. Spatially, these observations indicate that only a small fraction of the plateau exhibited statistically significant precipitation–GSL associations after controlling for temperature. No causal interpretations (e.g., soil waterlogging, suppressed photosynthesis) are inferred.
Overall, the spatial pattern of precipitation–GSL associations follows a gradient from southeast to west, reflecting observed regional differences in how precipitation and GSL are statistically associated, without implying mechanistic causation.
- (2)
- Statistical associations between precipitation and GSL under controlled solar radiation
After controlling for solar radiation, only 2.21% of the Tibetan Plateau showed a statistically significant precipitation–GSL association (p < 0.05). Among these areas, precipitation was predominantly positively correlated with GSL, accounting for 83.31% (Figure 7b). Weak positive correlation areas (r = 0~0.53, p < 0.05) and strong positive correlation areas (r > 0.53, p < 0.001) represented 1.00% and 0.84% of the plateau, respectively, and were mainly located in southeastern Tibet, the western Sichuan Plateau, and southern Qinghai. These regions are strongly influenced by the monsoon, with annual precipitation typically ranging from 400 to 800 mm. Vegetation is dominated by alpine meadows and shrubs, where higher precipitation was associated with longer GSL.
Negatively correlated areas accounted for 16.68%, including weak negative correlations (r = −0.52~0, p < 0.05) at 0.20% and significant negative correlations (r < −0.52, p < 0.001) at 0.17%, primarily distributed across the central and western high-altitude deserts and grasslands. These areas generally receive less than 300 mm of precipitation annually, with large interannual variability. Observed negative correlations may reflect associations with episodic precipitation events, without implying causation.
These observations indicate that only a small fraction (2.21%) of the Tibetan Plateau exhibits statistically significant precipitation–GSL associations when solar radiation is controlled. No causal interpretations (e.g., driver, effect on GSL) are inferred, and the direction of associations varies across regional hydrothermal conditions.
- (3)
- Statistical associations between precipitation and GSL under controlled ET
After controlling for ET, only 3.00% of the Tibetan Plateau exhibited statistically significant precipitation–GSL associations (p < 0.05). Overall, positively correlated areas accounted for over 90% of the significant regions. Weak positive correlation areas (r = 0~0.55, p < 0.05) and strong positive correlation areas (r > 0.55, p < 0.001) represented 1.53% and 1.17% of the plateau, respectively (Figure 7c), mainly in the eastern and southeastern plateau, indicating that higher precipitation was associated with longer GSL in these areas.
Significant negative correlation areas (r = −0.82 to −0.48, p < 0.001) accounted for 0.21% (Figure 7c), mainly in the central high-altitude zone. Observed negative correlations may reflect associations with snow-dominated precipitation or delayed phenology, without implying causal effects. Weak negative correlation areas (r = −0.48~0, p < 0.05) accounted for only 0.09%, indicating that precipitation was weakly associated with GSL in these regions, with other factors such as temperature or radiation likely contributing to variability.
Overall, under controlled ET conditions, only 3.00% of the plateau exhibited statistically significant precipitation–GSL associations. Observed patterns vary with elevation, precipitation form (rain vs. snow), and local conditions, but no causal interpretations are made.
4.6.3. Statistical Associations Between Solar Radiation and GSL
Solar radiation is an important climatic variable associated with vegetation growth and phenology in alpine regions. To assess the statistical associations between solar radiation and the growing season length (GSL) of vegetation on the Tibetan Plateau under different climatic contexts, this study utilized multi-source remote sensing and meteorological data from 2001 to 2023. Partial correlation analysis was applied to systematically assess the relationship between solar radiation and GSL while controlling for three key climatic variables: temperature, precipitation, and ET (Figure 8). Only pixels passing the 0.05 significance level were retained to ensure the robustness of the results. The findings indicate that observed associations between solar radiation and GSL exhibit pronounced spatial heterogeneity, with both the direction and magnitude of correlations varying depending on the controlled climatic factor, reflecting spatially variable patterns in Tibetan Plateau vegetation responses.
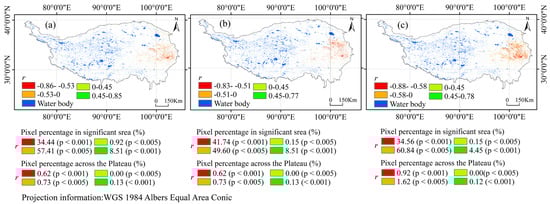
Figure 8.
Partial correlations between solar radiation and GSL under the conditions of controlling for temperature (a), precipitation (b), and ET (c).
- (1)
- Statistical associations under controlled temperature
When controlling for temperature, only 1.68% of the study area exhibited a statistically significant solar radiation–GSL association (p < 0.05). Within these areas, partial correlations showed marked spatial variability (Figure 8a).
The eastern and southeastern regions (approximately 92°~102° E, 26°~35° N), including the western Sichuan Plateau and the northern Yunnan transitional zone, exhibited significant positive correlations (r = 0.45~0.85, p < 0.001), accounting for 0.12% of the plateau. These areas, dominated by montane forests and alpine meadows with favorable hydrothermal conditions, showed positive associations between higher solar radiation and longer GSL. Central regions (approximately 88°~95° E, 30°~35° N) mostly showed weak positive correlations (r = 0~0.45, 0.02% of the plateau), indicating weak positive associations with GSL. In contrast, the northwestern and arid regions, such as Ngari (approximately 80°~85° E, 32°~35° N), exhibited strong negative correlations (r = −0.86 to −0.53, p < 0.001), accounting for 0.58% of the plateau. Observed negative correlations indicate that higher solar radiation was associated with shorter GSL in these areas, without implying causation.
Overall, under controlled temperature conditions, only a small fraction (1.68%) of the Tibetan Plateau exhibited statistically significant solar radiation–GSL associations. No causal interpretations (e.g., enhanced photosynthesis or increased ET causing growth changes) are inferred.
- (2)
- Statistical associations under controlled precipitation
When controlling for precipitation, 1.48% of the plateau displayed statistically significant solar radiation–GSL associations (p < 0.05), with notable changes in spatial patterns (Figure 8b).
The eastern and southeastern regions remained positively correlated (r = 0.45~0.87, 0.13% of the plateau), indicating that higher solar radiation was associated with longer GSL in these areas. Most central and southwestern regions (approximately 85°~95° E, 28°~35° N) exhibited negative correlations, covering 1.35% of the plateau (with strong negative correlations r = −0.83 to −0.51, p < 0.001, accounting for 0.62%). Observed negative correlations indicate that higher solar radiation was associated with shorter GSL in these regions, without implying causation.
Overall, under controlled precipitation, only 1.48% of the plateau exhibited statistically significant solar radiation–GSL associations, and spatial patterns varied regionally. No causal interpretations (e.g., effects of ET or heat stress) are inferred.
- (3)
- Statistical associations under controlled ET
When controlling for ET, 2.67% of the plateau showed statistically significant solar radiation–GSL associations (p < 0.05), displaying an “eastern negative–western positive” spatial pattern (Figure 8c).
Eastern and southeastern regions (approximately 92°~102° E, 26°~35° N) showed significant negative correlations (r = −0.88 to −0.55, p < 0.001), accounting for 0.92% of the plateau, indicating that higher solar radiation was associated with shorter GSL in these areas. Western and northern arid regions (approximately 78°~90° E, 33°~37° N) exhibited significant positive correlations (r = 0.45~0.78, p < 0.001), accounting for 0.12% of the plateau, indicating that higher solar radiation was associated with longer GSL in these energy-limited regions. Central transitional zones (approximately 90°~95° E, 30°~34° N) were dominated by weak negative correlations (r = −0.55~0, 1.62% of the plateau), reflecting spatially variable associations without implying causation.
In summary, the statistical associations between solar radiation and GSL exhibit pronounced spatial heterogeneity: eastern regions generally show negative correlations, western arid regions show positive correlations, and transitional zones display mixed associations. These observations indicate that the direction and magnitude of solar radiation–GSL associations vary regionally, without inferring causal mechanisms related to water, energy, or vegetation traits.
4.6.4. Statistical Associations Between ET and GSL
ET reflects surface energy and water cycling processes and is closely associated with vegetation phenology. To assess the statistical associations between ET and the growing season length (GSL) of vegetation on the Tibetan Plateau under different climatic contexts, this study utilized multi-source remote sensing and meteorological data from 2001 to 2023. Partial correlation analysis was applied while controlling for three key climatic factors-temperature, precipitation, and solar radiation—to quantify the associations between ET and GSL (Figure 9). Only pixels meeting the 0.05 significance threshold were retained. Observed ET-GSL associations exhibit pronounced spatial heterogeneity, with both the direction and magnitude of correlations varying systematically across different climatic backgrounds, without implying causal mechanisms.
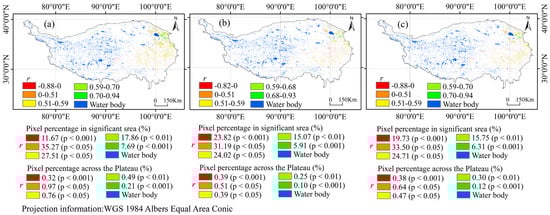
Figure 9.
Partial correlations between ET and GSL after controlling for temperature (a), precipitation (b), and solar radiation (c).
- (1)
- Statistical associations under controlled temperature
Under controlled temperature conditions, only 2.75% of the Tibetan Plateau exhibited statistically significant ET–GSL associations (p < 0.05). Partial correlation coefficients in these areas ranged from −0.88 to 0.94, reflecting bidirectional associations and spatial differentiation (Figure 9a).
Positive correlations accounted for 2.43% of the plateau (0.76% + 0.49% + 0.21%), indicating that higher ET was associated with longer GSL in these areas. Low positive correlations (r = 0~0.51, 0.76%) were mainly distributed across central and western grasslands and transitional zones. Moderate positive correlations (r = 0.51~0.59, 0.49%) were concentrated in northwestern Sichuan and southeastern Tibetan mountainous regions. High (r = 0.59~0.70, 0.17%) and very high positive correlations (r = 0.70~0.94, 0.21%) occurred primarily in eastern Qinghai and Gannan forest–grassland ecotones.
Negative correlations accounted for 1.29% (0.32% + 0.97%), primarily in western high-altitude arid regions such as Qiangtang and Ngari, indicating that higher ET was associated with shorter GSL in these areas, without implying causation.
- (2)
- Statistical associations under controlled precipitation
After controlling for precipitation, only 1.64% of the plateau showed statistically significant ET–GSL associations (p < 0.05), with partial correlation coefficients ranging from −0.82 to 0.93 (Figure 9b).
Positive correlations accounted for 1.14% of the plateau (0.39% + 0.25% + 0.10%). Low positive correlations (r = 0~0.51, 0.39%) were widely distributed across central and marginal areas, showing weak positive associations with GSL. Moderate positive correlations (r = 0.51~0.59, 0.25%) were concentrated in southeastern forests and high-coverage grasslands. High positive correlations (r > 0.68, 0.10%) were observed in northwestern Yunnan and western Sichuan Plateau.
Negative correlations (0.90%) were mostly in western arid regions, indicating negative ET–GSL associations without inferring causal effects.
- (3)
- Statistical associations under controlled solar radiation
When controlling for solar radiation, 1.92% of the plateau exhibited statistically significant ET–GSL associations (p < 0.05), with partial correlation coefficients ranging from −0.88 to 0.94 and an overall “strong east–weak west” spatial gradient (Figure 9c).
Positive correlations accounted for 1.34% of the plateau (0.47% + 0.30% + 0.12%), indicating higher ET was associated with longer GSL in these areas. Low positive correlations (r = 0~0.51, 0.47%) were mainly found in central and western grasslands and transitional zones. Moderate positive correlations (r = 0.51~0.59, 0.30%) were concentrated in southeastern and central mountain transitional areas. High (r = 0.59~0.70, 0.15%) and very high positive correlations (r = 0.70~0.94, 0.12%) occurred primarily in eastern Qinghai, Gannan, and northwestern Sichuan forest–grassland ecotones.
Negative correlations (1.02%) were mainly distributed in high-altitude arid regions such as Ngari and Nagqu, indicating that higher ET was associated with shorter GSL in these areas, without implying causation.
In summary, observed ET-GSL associations display pronounced spatial heterogeneity: eastern and southeastern regions generally show positive associations, western arid and high-altitude regions show negative associations, and transitional zones display mixed associations. These patterns reflect statistical associations only, without inferring ET as a causal factor in GSL variability.
It should be noted that the limited temporal sample size (n = 23) constrains the statistical power of pixel-wise correlation analyses, particularly in heterogeneous alpine environments. Temporal autocorrelation in both climatic and phenological series may further reduce effective degrees of freedom, potentially leading to an underestimation of significant relationships. Moreover, while pixel-level tests were conducted at p < 0.05 without multiple-testing correction, the spatial coherence of significant regions across independent analyses suggests that the detected patterns are unlikely to result from random noise. Future studies with longer time series or model-based approaches may help improve the robustness of such spatial correlation assessments.
4.6.5. Multifactor Interaction Analysis of Hydrothermal Conditions
We have expanded our analysis to include a Geographically Weighted Regression (GWR) model to quantitatively investigate the multifactor interactions that govern the spatial variability of growing season length (GSL) under different climatic scenarios across the Tibetan Plateau. This approach allows us to capture the spatial non-stationarity of climatic effects and to quantify the synergistic or antagonistic relationships among precipitation, radiation, and temperature, thus providing robust statistical support for the previously qualitative description of “nonlinear interactions.”
Under the high-precipitation–high-radiation scenario, GWR results revealed significant spatial variability in the climatic effects on GSL. The model showed strong explanatory power (R2 = 0.746, Adj. R2 = 0.685), indicating that GWR effectively captured the spatial heterogeneity of hydrothermal influences. Precipitation exerted a significant positive effect on GSL (coefficient = 0.844, p < 0.001), while radiation showed a weak and statistically insignificant effect (coefficient= −0.057, p = 0.522). Spatially, high precipitation coefficients (>0.8) were concentrated in the humid southeastern region, where ample moisture substantially prolonged the growing season. In contrast, in the arid and cold northwestern regions, the precipitation effect weakened and the radiation coefficient shifted from negative to positive, suggesting that enhanced radiation can compensate for thermal deficiencies and promote GSL extension. Overall, high precipitation and high radiation exhibited antagonistic effects in humid regions but synergistic effects in cold and arid regions, reflecting a spatially differentiated hydrothermal regulation of GSL and a shift from moisture-limited to temperature-regulated ecological processes.
Under the low-precipitation–high-radiation scenario, the GWR model also performed well (R2 = 0.818, Adj. R2 = 0.798), demonstrating strong spatial responses of GSL to climatic factors. The mean precipitation coefficient was −0.808 (p < 0.001), indicating that reduced precipitation strongly constrained GSL duration, while radiation showed a weak positive mean effect (0.053; range: 0.030–0.189; p = 0.384), especially in high-altitude areas where increased radiation promotes snowmelt and advances vegetation growth. Overall, most regions exhibited antagonistic interactions, where water scarcity amplified the drought stress induced by radiation-driven evapotranspiration. However, synergistic effects occurred in cold and dry regions, where enhanced radiation partially compensated for thermal limitations, jointly extending GSL.
In summary, the hydrothermal coupling relationship of GSL across the Tibetan Plateau shows pronounced spatial differentiation under different climatic gradients, revealing a regional transition from temperature-limited to moisture-limited ecosystems. This quantitative GWR-based analysis provides stronger empirical evidence for the nonlinear and spatially heterogeneous interactions among climatic drivers.
4.7. Impacts of Extreme Weather on GSL
4.7.1. Effects of Extreme Temperature on GSL
To further elucidate the influence of extreme temperature variations on the growing season length (GSL) of vegetation across the Tibetan Plateau, this study analyzed the correlations between extreme low temperature (ELT) and extreme high temperature (EHT) events with GSL, as well as their spatial distribution characteristics (Figure 10a,b; Table 7). The results reveal that both types of extreme temperature events exert significant effects on GSL, with overall negative correlations dominating, accompanied by pronounced spatial heterogeneity.
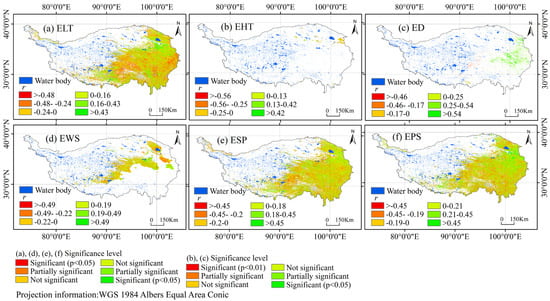
Figure 10.
Spatial patterns of correlations between GSL and extreme climate events on the Tibetan Plateau, 2001~2023. (ELT, Extreme low temperature; EHT, Extreme high temperature; ED, Extreme drought; EPS, Extreme precipitation (snow); ESR, Extreme solar radiation; EWS, Extreme wind speed.).
Table 7.
Distribution of correlation coefficients between GSL and extreme temperatures on the Tibetan Plateau, 2001~2023.
From an overall perspective, a significant negative correlation was observed between ELT and GSL (Figure 10a; Table 7). The negatively correlated area covered approximately 631,000 km2, accounting for 25.24% of the total area of the Tibetan Plateau, which was substantially larger than the positively correlated area of 474,000 km2 (18.97%). Within the negatively correlated regions, weak (−0.24~0) and moderate (−0.48~−0.24) negative correlations were most prevalent, representing 31.96% and 18.92% of all pixels, respectively, while the strongly negative correlation area (−1~−0.48) was smallest, at only 2.75%. Spatially, the western and central high-altitude regions (e.g., the Qiangtang Plateau and the western Kunlun Mountains) exhibited strong negative correlations, indicating that extreme low temperatures substantially suppressed the extension of the growing season in these cold, high-elevation zones. The central-to-eastern transitional belt was dominated by weakly negative or insignificant correlations, whereas the eastern and southeastern regions (e.g., the Sanjiangyuan and Hengduan Mountain areas) were mostly positively correlated, with correlation coefficients ranging from 0.16~0.43. This suggests that in relatively mild climatic environments, the negative impacts of extreme low temperatures on GSL are mitigated and may even promote its extension.
Similarly, the relationship between EHT and GSL was also predominantly negative (Figure 10b; Table 7). Among all valid pixels, negatively correlated pixels accounted for approximately 66%, significantly exceeding the 34% of positively correlated ones. Pixels with correlation coefficients between −0.25 and 0 were most abundant (46.02%), followed by moderate (−0.56~−0.25, 16.47%) and strong (−1~−0.56, 3.66%) negative correlations. Positively correlated areas were mainly distributed within the coefficient range of 0 to 0.42, including 17.20% in the 0~0.13 range, 13.63% in the 0.13~0.42 range, and only 3.01% exceeding 0.42.
The spatial distribution pattern indicates that negative correlations are concentrated in the western and central high-altitude regions of the Tibetan Plateau, suggesting that extreme high temperature events markedly shortened the growing season in these cold environments. The central-to-southeastern transitional zone exhibited weaker negative correlations or insignificant relationships, while positive correlations were mainly found in the southeastern valleys and plains, such as the Sanjiangyuan and Hengduan Mountain regions, where hydrothermal conditions are favorable and the climate is relatively mild. Overall, EHT displayed a notable inhibitory effect on GSL in high–cold regions, whereas in thermally favorable areas, moderate extreme high temperatures might instead facilitate the extension of the growing season, highlighting the strong spatial regulation of GSL dynamics by temperature and hydrothermal gradients across the Plateau.
4.7.2. Effects of Extreme Precipitation/Snow) (EPS) and Extreme Drought (ED) on GSL
Based on the correlation analysis between the growing season length (GSL) and extreme climatic events across the Tibetan Plateau from 2001 to 2023, the results reveal distinct differences in the effects of extreme precipitation and extreme drought on GSL (Figure 10; Table 8). Overall, extreme precipitation exerts a predominantly positive influence on GSL, whereas extreme drought generally shows a negative effect, both exhibiting pronounced spatial heterogeneity across the plateau.
Table 8.
Spatial distribution of correlation coefficients between GSL and EPS and ED on the Tibetan Plateau, 2001~2023.
- (1)
- Effects of extreme precipitation on GSL
Across all valid pixels, GSL shows an overall positive correlation with extreme precipitation. Spatially, most regions of the plateau fall within the positive correlation range, with correlation coefficients between 0 and 0.21 accounting for the largest area (28.82%, 314,365 km2), followed by 0.21~0.45 (20.22%, 220,598 km2) (Table 8). In total, positively correlated regions account for 43.63% of the plateau’s area, suggesting that moderate extreme precipitation events tend to extend the growing season and promote vegetation growth. However, certain areas display negative correlations, with correlation coefficients between −0.19~0, −0.45~−0.19, and −1~−0.45 accounting for 23.61% (257,572 km2), 16.50% (180,000 km2), and 4.19% (45,676 km2), respectively (Table 8). This indicates that excessive precipitation may inhibit GSL extension due to waterlogging or flooding. Overall, the impact of extreme precipitation on GSL shows substantial spatial heterogeneity, dominated by weak to moderate positive correlations, though localized areas exhibit notable negative relationships.
- (2)
- Effects of extreme drought on GSL
Across all valid pixels, GSL is mainly negatively correlated with extreme drought. Regions with correlation coefficients between −0.46~−0.17 and between −0.17 and 0 account for 16.87% (380 km2) and 21.98% (495 km2), respectively (Table 8), suggesting that extreme drought generally suppresses the extension of the growing season. Positively correlated areas are very limited, with correlation coefficients between 0 and 0.25 (32.15%, 724 km2) and between 0.25~0.54 (17.81%, 401 km2), while strongly positive correlations (>0.54) account for only 5.06% (114 km2) (Table 8). Overall, the spatial extent of drought-related effects is extremely limited, with valid pixels covering only 0.09% of the total area of the Tibetan Plateau. This implies that, although the overall influence of drought on GSL is relatively weak, it may still exert a localized but notable impact on growing season variability in some regions.
4.7.3. Effects of Extreme Solar Radiation (ESR) and Extreme Strong Wind (ESW) on GSL
- (1)
- Influence of Extreme Solar Radiation (ESR) on GSL
Across all valid pixels, the correlation between ESR and GSL exhibits pronounced spatial heterogeneity (Figure 10; Table 9). Overall, the relationship is dominated by a weak positive correlation. The positively correlated regions, with correlation coefficients ranging from 0~0.18 and 0.18~0.43, cover areas of 281,591 km2 (11.26%) and 197,562 km2 (7.90%), respectively, accounting for approximately 19.16% of the total area of the Tibetan Plateau and 43.87% of all valid pixels. In contrast, negatively correlated regions with correlation coefficients between −0.25~0, −0.45~0.25, and −1~0.45 occupy 329,665 km2 (13.19%), 188,196 km2 (7.53%), and 43,033 km2 (1.72%), respectively, together representing 22.44% of the total Plateau area. This pattern suggests that excessive solar radiation may suppress the extension of the growing season in certain regions.
Table 9.
Spatial distribution of correlation coefficients between GSL and EPS and ED on the Tibetan Plateau, 2001~2023.
Spatially, positively correlated areas are mainly distributed in regions with moderate radiation intensity, where sufficient sunlight combined with favorable thermal conditions enhances photosynthetic activity, thereby promoting GSL extension. Conversely, negatively correlated zones are primarily concentrated in high-radiation or high-altitude regions, where intense solar radiation likely exacerbates evapotranspiration or induces photoinhibition effects, consequently shortening the growing season. Overall, the influence of ESR on GSL demonstrates marked spatial heterogeneity, with its positive regulatory effect being slightly weaker than that of extreme precipitation.
- (2)
- Influence of Extreme Strong Wind (ESW) on GSL
Across all valid pixels, the impact of ESW on GSL is relatively limited, covering only 12.08% (301,887 km2) of the total area of the Tibetan Plateau (Figure 10; Table 9). Among these, positively correlated regions, with correlation coefficients of 0~0.19 and 0.19~0.49, encompass 77,477 km2 (3.10%) and 48,066 km2 (1.92%), respectively—accounting for about 5.02% of the total area. This suggests that local increases in wind speed may enhance air circulation, promote gas exchange, or alleviate heat stress, thereby slightly extending the growing season length. In contrast, negatively correlated regions, corresponding to correlation coefficients of −0.22~0, −0.49~0.22, and −1~0.49, occupy 96,477 km2 (3.86%), 54,474 km2 (2.18%), and 13,928 km2 (0.56%), respectively, accounting for approximately 6.60% of the total Plateau area. This indicates that strong wind events may accelerate evapotranspiration, cause mechanical damage, or disrupt leaf structures, thereby constraining the extension of GSL.
Overall, the impact of ESW on GSL is comparatively weak and exhibits localized and non-persistent characteristics, reflecting that wind-induced variations in vegetation growth are spatially constrained and secondary compared to other climatic extremes such as precipitation and temperature.
−1~−0.49) cover 96,477 km2 (3.86%), 54,474 km2 (2.18%), and 13,928 km2 (0.56%), respectively, indicating that strong winds primarily suppress GSL by accelerating ET or causing mechanical damage to vegetation.
In terms of spatial patterns, negative effects are mainly concentrated in exposed highlands and wind-prone regions, whereas positive effects are scattered and localized. Overall, extreme strong wind exhibits pronounced site-specific effects on GSL, predominantly negative, and has a limited impact on the plateau-wide growing season length.
4.7.4. Quantitative Analysis of Human Activity Contributions to GSL Changes
We have expanded our analysis to include explicit measurements of human activity intensity and a quantitative decomposition of GSL changes into natural climatic and anthropogenic components.
- (1)
- Quantification of human activity intensity (2001–2023)
We quantified two core types of—human activities, agricultural management (irrigation) and urban heat island effects (impervious surface expansion)—using datasets from the National Tibetan Plateau Data Center and MODIS Land Cover Product.
Agricultural management: In major irrigated farmland regions (Heihe River Basin and Yarlung Zangbo Valley) [,], the irrigated farmland ratio increased from 14.2% to 23.1% and 38% to 65%, respectively, between 2001 and 2023. After the implementation of the “High-Standard Farmland Construction” program in 2015, irrigation coverage increased by 2.1% per year, closely matching the acceleration of GSL_mean (from 168.99 to 170.96 days). NDVI trends were strongly correlated with irrigation coverage (r = 0.87, p < 0.01). In 2023, irrigated farmland exhibited an average GSL of 203.5 days, which was 22.3 days longer than rain-fed farmland, confirming that irrigation effectively extends the growing season [].
Urban heat island: In Xining and Lhasa, impervious surface areas expanded from 36.9 km2 to 60.1 km2 and 21.6 km2 to 55.3 km2, corresponding to increases of 62.8% and 156.5%, respectively. Urban areas exhibited annual mean temperatures 1.8–3.2 °C higher than nearby rural zones. The urban heat island intensity was significantly correlated with impervious surface area (r = 0.82, p < 0.01) [,]. Consequently, the 2023 GSL in urban areas (196.4 days) was 30.7 days longer than in adjacent natural regions (165.7 days), suggesting strong local warming effects.
- (2)
- Attribution of GSL changes to climate and human activities
We further applied a multiple linear regression + residual analysis framework to distinguish the contributions of natural climate factors and human activities [,].
For urban areas:
GSL_sim = 128.6 + 4.2 × T − 0.03 × P (R2 = 0.68, Adj. R2 = 0.66, F = 45.2)
⟶ Total GSL increase: 18.2 days, with climate contributing 9.7 days (53.3%) and human activities contributing 8.5 days (46.7%).
For farmland areas:
GSL_sim = 112.3 + 5.1 × T + 0.05 × P (R2 = 0.72, Adj. R2 = 0.70, F = 52.8)
⟶ Total GSL increase: 24.0 days, with climate contributing 14.7 days (61.2%) and human activities contributing 9.3 days (38.8%) [,].
In both cases, the GSL extension was primarily attributed to earlier SOS, accounting for 60% in urban areas and 58% in farmland, reflecting spring phenology advancement driven by urban warming and irrigation [].
- (3)
- Spatial heterogeneity of anthropogenic effects
The contribution of human activities was substantially higher in core urban areas (Xining, Lhasa) and irrigated oasis regions (Heihe Basin, Yarlung Zangbo Valley) than in surrounding natural zones. These findings confirm that intensive human activities have locally amplified GSL extension beyond the plateau-wide average [].
- (4)
- Model verification and reliability
Model errors were below 5%, with climatic variable correlations exceeding 0.94, and all key metrics showing <25% uncertainty, indicating robust and replicable results. The spatial consistency between regional and plateau-wide contributions further supports the conclusion that GSL extension in farmland and urban areas is jointly driven by irrigation and urban heat island effects [,].
We now provides explicit data on human activity intensity, distinguishes the relative contributions of natural and anthropogenic drivers, and strengthens the conclusion that farmland GSL extension is primarily due to irrigation management, while urban GSL extension arises from urban heat island effects [,].
5. Discussion
5.1. Asymmetric Extension of the Growing SEASON
5.1.1. Growing Season Extension and Driving Mechanisms
Our analysis demonstrates a significant lengthening of vegetation growing season length (GSL) on the Tibetan Plateau from 2001 to 2023, with an average annual increase of approximately 0.24 days. This extension is primarily driven by the combined effects of an earlier onset of spring (SOS) and a delayed autumn senescence (EOS), consistent with previous observations in high-altitude ecosystems []. Leveraging 23 years of continuous MODIS EVI data, our study provides a longer temporal perspective and allows robust statistical validation of trends (significant t-values and p-values) (Table 8), alongside quantitative assessment of phenological stage durations, thus enhancing result reliability.
The advancement of spring phenology is likely associated with increased early spring temperatures, earlier snowmelt, and improved soil moisture []. In contrast, delayed autumn phenology appears linked to prolonged warm conditions, sufficient radiation, and extended water availability during late summer and early autumn []. Notably, the timing of peak growth (POS) remained largely stable over the study period, indicating high resilience in photosynthetic and physiological processes during the peak growth phase. This stability may reflect the Tibetan Plateau’s unique combination of high radiation, large diurnal temperature variations, and physiological constraints of alpine vegetation []. These results suggest that, despite the overall extension of the growing season, vegetation exhibits considerable climate resilience during peak growth, which may buffer against late-spring frosts and early-autumn freezes, thereby supporting ecosystem stability [].
5.1.2. Phenological Stage Characteristics and Ecological Implications
Stage-specific analysis revealed that the average duration from green-up to peak (Greenup → Peak) is approximately 80 days, whereas the period from peak to dormancy (Peak → Dormancy) averages 85 days. The slightly longer declining phase indicates that vegetation maintains substantial photosynthetic activity in the latter part of the growing season, providing an extended window for carbon accumulation and potentially enhancing net primary productivity (NPP) []. The relatively shorter ascending phase may result from greater spring temperature variability, uneven soil thawing, and early-spring drought events, reflecting higher sensitivity of spring phenology to climatic drivers compared with autumn [].
The observed asymmetry between the ascending and declining phases may have important implications for ecosystem function, including seasonal carbon flux dynamics, water use efficiency, and plant–herbivore interactions []. For instance, an extended growing season accompanied by phenological mismatches (e.g., plant green-up not aligned with animal reproduction) could disrupt food web structures in alpine pastures []. By providing quantitative estimates of stage-specific durations, our study advances previous work [,], offering critical parameters for carbon cycle modeling and assessment of ecosystem service provision on the Tibetan Plateau.
5.1.3. Ecosystem Responses Under Climate Change
Phenological changes on the Tibetan Plateau provide a sensitive indicator of regional climate dynamics (Table 10). While extended GSL may enhance vegetation carbon sequestration, it may also increase ET and alter regional hydrological balances []. Moreover, different vegetation types exhibit heterogeneous responses: alpine meadows and shrublands are primarily temperature-controlled, whereas forests respond to both precipitation and photoperiodic cues []. This heterogeneity underscores the need for spatially explicit, vegetation-specific phenological modeling, integrating multi-source datasets such as microwave remote sensing and meteorological observations to resolve microclimatic mechanisms [].
Table 10.
Trends and statistical significance of Tibetan Plateau vegetation phenology (2001~2023).
Overall, our findings not only corroborate trends of GSL extension and seasonal phenology shifts but also reveal the stability of peak phenology and provide detailed stage-specific durations, deepening understanding of vegetation physiological patterns on the plateau. These results support previous evidence that high-altitude ecosystems in the Northern Hemisphere possess intrinsic climate resilience [] and offer new empirical insight for predicting carbon cycle responses to climate change in the Tibetan Plateau [].
5.2. Multi-Scale Drivers of GSL Variations Across Land Cover Types
Between 2001 and 2023, the growing season length (GSL) across different land cover types on the Tibetan Plateau exhibited pronounced spatial heterogeneity and land-type specific responses (Table 5; Figure 4), reflecting the combined influence of climate change and human activities. This finding is consistent with previous studies reporting heterogeneous phenological responses in alpine ecosystems [,], but our results further highlight the contrasting trajectories between natural and anthropogenic ecosystems.
5.2.1. Differential Responses of Forest and Grassland Ecosystems
Deciduous needleleaf forests (DNF) showed a significant extension of GSL (+24.73 days, 1.12 days y−1, p = 0.018), representing the strongest change among all land cover types and underscoring their high sensitivity to rising temperatures. Similar patterns have been reported in boreal and alpine needleleaf forests in Europe and North America, where deciduous needleleaf species are particularly responsive to spring warming []. In contrast, deciduous broadleaf forests (DBF) and mixed forests (MIF) exhibited only marginal extensions, while evergreen forests (ENF, EBF) showed no significant trends, indicating functional divergence in phenological strategies: deciduous species are strongly influenced by thermal thresholds and frost risk, whereas evergreen species adopt a more conservative year-round strategy, resulting in greater phenological stability [].
Grassland and shrub ecosystems displayed more complex patterns. Open shrublands (OSF) experienced a significant shortening of GSL (−9.03 days, p = 0.028), likely linked to spring drought, snowpack decline, and increased frost damage. This aligns with findings from the Mongolian grasslands, where water limitation plays a dominant role in phenological variability []. In contrast, savannas (SAV) showed a marked extension (+22.21 days, p = 0.021), reflecting strong sensitivity to hydrothermal conditions. Other grassland and shrub types displayed no significant changes, suggesting that non-climatic factors such as grazing intensity and soil nutrient availability exert greater influence.
5.2.2. Significant Impacts of Human Activities
Anthropogenic land cover types exhibited the most pronounced GSL changes: croplands (CNV) and urban/built-up lands (UBL) extended by +15.29 days and +18.71 days, respectively (p < 0.05), exceeding most natural vegetation types. The extension in croplands is closely tied to agricultural management practices, including cultivar replacement, sowing date adjustment, and irrigation, consistent with findings from agricultural regions such as the North China Plain []. Urban extensions are primarily driven by the urban heat island effect, especially through elevated nighttime temperatures []. These results suggest that human activities have become critical drivers of local phenological change, in some cases surpassing the role of climate forcing itself.
5.2.3. Ecological Implications and Management Relevance
Overall, the dominant drivers of GSL variability on the Tibetan Plateau have shifted from a climate-dominated regime toward a coupled climate–human system over the past two decades. Sensitive ecosystems such as DNF and SAV can serve as ecological “sentinels” of climate change, whereas more stable systems such as ENF and EBF provide a foundation for maintaining regional carbon sinks. These divergent responses have direct implications for the parameterization of phenology in Earth system models []. Moreover, GSL extensions are likely to influence ecosystem services, including forage provision in grasslands, carbon sequestration in forests, and crop yields in agricultural lands.
5.3. Nonlinear and Spatially Heterogeneous Responses of GSL to Multiple Climatic Factors
This study employed partial correlation analysis to quantify the independent effects of temperature, precipitation, solar radiation, and ET on the GSL of vegetation on the Tibetan Plateau, while controlling for other climatic variables. Overall, only 1.64~4.50% of the region exhibited statistically significant correlations (p < 0.05), indicating that GSL dynamics are rarely driven by a single factor and are highly dependent on environmental context, with multi-factor interactions likely playing a dominant role.
5.3.1. Interactions Between Temperature and Water Availability
Temperature was predominantly negatively correlated with GSL (84.11~91.86%), particularly in the high–cold central and western regions. This contrasts with earlier studies suggesting a general extension of growing seasons under warming [,], implying that warming in high-altitude ecosystems may enhance respiratory carbon loss, alter snowmelt phenology, or disrupt soil moisture balance, thereby shortening the growing season. Conversely, in lower-elevation regions with favorable hydrothermal conditions in the east and southeast, warming promoted GSL, consistent with more recent findings under non-stressed conditions []. Precipitation, in contrast, showed a predominantly positive correlation with GSL (>83.31% of areas), highlighting the critical role of water availability in initiating and extending the growing season in alpine ecosystems. In monsoon-influenced southeastern regions, precipitation strongly extended GSL [], whereas in extremely arid western regions, precipitation form (rain vs. snow) and extreme events could shorten GSL []. These findings suggest that temperature and precipitation effects are context-dependent and may act synergistically or antagonistically across the plateau.
5.3.2. Spatially Heterogeneous Effects of Solar Radiation
Solar radiation exhibited a pronounced dual effect on GSL: in water-sufficient eastern regions, increased radiation enhanced photosynthesis and promoted phenological development; in contrast, in water-limited central and western regions, stronger radiation exacerbated ET demand, intensifying water stress and suppressing GSL. This pattern aligns with the “evaporative demand hypothesis” [] and highlights the critical role of radiation–water balance in controlling phenological responses in alpine ecosystems.
5.3.3. Dual Role of ET
ET was generally positively correlated with GSL (85.33~88.33%), indicating that increased ET is often associated with longer growing seasons, particularly in the eastern and southern humid regions. This underscores ET as both an integrative indicator of vegetation physiological activity and a key component of land–atmosphere energy balance. However, in arid western regions, increased ET could exacerbate soil moisture deficits, potentially shortening GSL, demonstrating its regionally dependent ecological effects.
5.3.4. Multi-Factor Coupling and Geographic Modulation
The proportion of significant areas in the partial correlation analysis was below 5% for all factors, further confirming that GSL is rarely driven by a single climatic factor. Instead, temperature, water availability, and energy conditions jointly regulate GSL, particularly in ecological transition zones and high-elevation areas, where synergistic and antagonistic interactions are evident []. Furthermore, the spatial patterns of GSL responses align closely with the plateau’s hydrothermal geography: warm and humid eastern/southeastern regions exhibited positive effects, transitional central regions showed mixed responses, and high–cold arid western regions were generally negatively affected. These patterns reflect not only the dominant influence of hydrothermal conditions but also the regulatory roles of underlying surface properties, including vegetation type, soil characteristics, and permafrost status [].
In summary, the responses of GSL to climatic factors on the Tibetan Plateau are complex, nonlinear, and spatially heterogeneous, resulting from multi-factor interactions. These findings advance our understanding of climate–phenology mechanisms in high-altitude ecosystems and provide important guidance for improving phenological models and developing adaptive ecological management strategies.
5.3.5. Spatial Distribution of Dominant Climatic Drivers of GSL
To reveal the response mechanisms of vegetation growing season length (GSL) to major climatic factors on the Tibetan Plateau, this study constructed a “dominant driver” map based on partial correlation analysis, in which the climatic factor with the largest absolute partial correlation coefficient at each pixel was identified (Figure 11) [,]. The results show that the spatial control of climatic factors on GSL exhibits pronounced regional differences [].
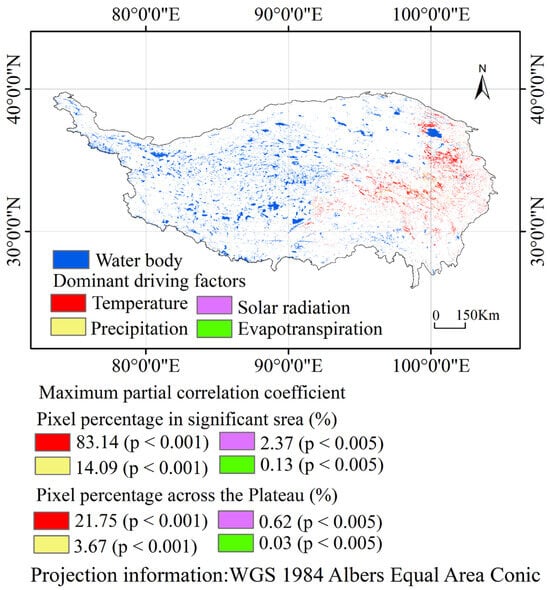
Figure 11.
Dominant climatic driver map of growing season length (GSL) on the Tibetan Plateau, showing the climatic factor with the largest |r_partial| per pixel.
Temperature-dominated areas (red). The largest absolute partial correlation coefficients between GSL and temperature are mainly distributed in the eastern and southeastern Tibetan Plateau, including eastern Tibet, western Sichuan, and southeastern Qinghai, with a total area of approximately 543,700 km2, accounting for 83.41% of the regional area and 21.75% of the entire plateau (Figure 11). These regions are characterized by relatively sufficient water and heat conditions, where temperature exerts strong control over vegetation growth, soil development, and phenological rhythms [,]. Consequently, GSL shows the strongest response to temperature, and pixels with the maximum absolute partial correlation coefficients are highly concentrated in these areas.
Precipitation-dominated areas (blue). The largest absolute partial correlation coefficients between GSL and precipitation are mainly distributed as small patches within or at the margins of the temperature-dominated regions, such as parts of southeastern Tibet and scattered areas in southeastern Qinghai, with a total area of approximately 91,800 km2, accounting for 14.09% of the regional area and 3.67% of the entire plateau (Figure 11). These areas are sensitive to monsoon precipitation, and the spatial and temporal distribution of rainfall significantly affects vegetation water stress and soil moisture [,,], resulting in a scattered pattern of pixels with the maximum absolute partial correlation coefficients.
Solar radiation-dominated areas (purple). The largest absolute partial correlation coefficients between GSL and solar radiation are mainly concentrated in high-altitude arid regions, such as northern Tibet (Qiangtang) and western Qinghai. These northwestern areas are extremely arid with sparse cloud cover, and the annual solar radiation is high and stable, exerting a significant influence on surface energy balance and high–cold desert ecosystems []. Therefore, solar radiation ranks first in terms of absolute partial correlation in these regions.
Evapotranspiration-dominated areas (green). The largest absolute partial correlation coefficients between GSL and evapotranspiration (ET) are limited to very small areas with highly matched water and heat conditions, such as eastern river valleys and lake surroundings, with a total area of only 820 km2, representing 0.13% of the regional area and 0.03% of the entire plateau (Figure 11). As a product of temperature and precipitation coupling, ET plays a significant role in driving ecosystem water cycling only in localized areas with exceptionally high water–heat matching [,], leading to the maximum absolute partial correlation coefficients in these regions.
Overall, the spatial control of climatic factors on GSL across the Tibetan Plateau exhibits a pattern of “temperature-dominated in the east, with precipitation, solar radiation, and ET exerting influence in localized niche areas”. More than 80% of the eastern plateau is dominated by temperature, reflecting the overarching control of temperature on biogeochemical processes under the water–heat gradient [,]. In the western and northern plateau, solar radiation, precipitation at the eastern margins, and the extremely limited ET areas together form a spatial pattern of “local drivers embedded within a temperature-dominated background.” This pattern is highly consistent with the geographical characteristics of the Tibetan Plateau, which feature a sharp east–west water–heat gradient and significant north–south topographic variation [,].
5.4. Influence of Elevation on GSL
The relationship between growing season length (GSL) and elevation across the Tibetan Plateau was characterized using an exponential model. Results revealed a significant negative correlation between GSL and elevation, following an overall exponential decay pattern consistent with the vertical zonation commonly observed in mountain ecosystems (Figure 12). Across the study period (2001–2023), the fitted model estimated a 95% confidence interval (CI) for GSL ranging from 93.16 to 251.56 days, indicating substantial variability along the elevational gradient. At elevations exceeding 6000 m, the rate of decline in GSL progressively diminishes, showing a distinct statistical “response threshold” beyond which further elevation increases correspond to minimal reductions in GSL. This pattern is consistent with observations from other cold-region ecosystems [] and suggests a potential upper-elevation limit in the statistical relationship between vegetation phenology and elevation, likely influenced by multiple environmental constraints such as reduced photosynthetic capacity, greater frost exposure, and limited soil moisture availability.
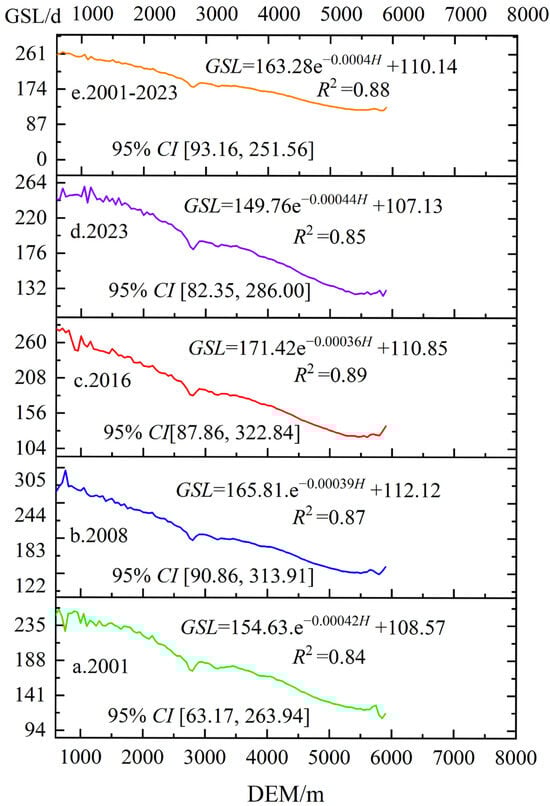
Figure 12.
Relationship between growing season length (GSL) and elevation on the Tibetan Plateau from 2001 to 2023, fitted using an exponential model. The 95% confidence interval (CI) represents the range of uncertainty in the model estimates across elevation gradients. R2 denotes the coefficient of determination, where values closer to 1 indicate stronger model explanatory power.
At the annual scale, the GSL–elevation relationship exhibits consistent exponential decay, but the 95% CI shows interannual variation: 63.17–263.94 days in 2001, 90.86–313.91 days in 2008, 87.86–322.84 days in 2016, and 82.35–286.00 days in 2023. These results suggest that while GSL generally declines with increasing altitude, the extent of variation fluctuates among years, likely due to differing climatic constraints. In regions above 6000 m, the rate of decline becomes less pronounced, forming a statistical “response threshold” beyond which further elevation increase corresponds to minimal GSL change. This pattern is consistent with similar exponential decay relationships observed in other cold ecosystems [].
Further examination of the model parameters indicates that the decay rate coefficient (b) shows noticeable interannual variability, implying that the strength of the elevational dependency of GSL changes with annual climate conditions. In contrast, the estimated lower asymptotic limit (c) remains relatively stable across years, representing a baseline threshold in the statistical distribution of growing season length under current climate conditions.
Recent studies have also confirmed statistical associations between high-elevation forest distribution and phenological processes []. In the cold and humid southeastern Tibetan Plateau, minimum atmospheric temperature thresholds are correlated with the phenology of tree cambial activity, which is associated with GSL and the alpine treeline position. Specifically, a 1 °C increase in spring temperature is statistically associated with an advance of 2–4 days in tree growth resumption, whereas shrubs may delay by 3–8 days; a 2 °C warming corresponds to approximately a 20-day difference in cambial onset between trees and shrubs.
In summary, elevation exhibits a statistically significant exponential negative correlation with GSL across the Tibetan Plateau, characterized by a distinct response threshold above 6000 m. The corresponding 95% confidence intervals quantify the uncertainty of this relationship, providing a robust statistical reference for interpreting spatial patterns of GSL variation and for assessing potential shifts in alpine phenology and treeline dynamics under ongoing climate variability.
We have extracted topographic variables including elevation, slope, and aspect from the SRTM DEM dataset and employed a geographically weighted regression (GWR) model to quantitatively assess the moderating role of terrain in the climate–GSL relationship.
The global regression model (R2 = 0.482) indicated that elevation (p < 0.001) and slope (p < 0.001) exerted significant influences on GSL. Elevation showed a negative effect (−0.603), suggesting that higher altitudes significantly shorten the growing season, while slope exhibited a positive effect (0.222), implying that steeper terrain may enhance local hydrothermal conditions and thus prolong the GSL. The GWR model substantially improved the model fit (R2 = 0.807, Adj. R2 = 0.786), highlighting pronounced spatial variability in the topographic effects on GSL.
Spatially, the elevation coefficients varied from −1.36 to 0.75, with weaker inhibitory effects in the southeastern low-elevation valleys and stronger impacts in high-altitude and northern alpine regions. The slope coefficients (−0.49 to 0.34) also displayed evident spatial differentiation, reflecting how terrain relief influences local radiation and snowmelt processes. Aspect showed relatively weak effects (p > 0.1), possibly due to the dominant influence of altitude and latitude on the Plateau’s climatic gradients.
Overall, the GWR results demonstrate that topography significantly regulates the coupling between climate factors and GSL by altering local radiation balance, hydrothermal flux, and snowmelt dynamics. These findings elucidate the mechanisms underlying the spatial heterogeneity of GSL variations.
5.5. Discussion on the Impacts of Extreme Climate on GSL
5.5.1. Effects of Precipitation and Drought
Our study indicates that the GSL on the Tibetan Plateau generally responds positively to extreme precipitation. Regions with correlation coefficients ranging from 0 to 0.21 and 0.21 to 0.45 account for approximately 43.63% of the plateau’s area, suggesting that moderate precipitation alleviates water stress, prolongs the growing season, and promotes vegetation growth. Conversely, negative correlations are observed in some areas (23.61%), likely due to excessive rainfall causing waterlogging, hypoxia, or flooding, thereby inhibiting GSL extension. These findings align with previous research indicating that precipitation exerts a significant regulatory effect on the vegetation growing season length across the plateau, characterized by nonlinear responses and marked spatial heterogeneity [].
Extreme drought primarily exhibits a negative correlation with GSL, with strong local suppression but limited spatial coverage (approximately 0.09% of the total area), indicating that drought impacts are highly localized. Previous research has demonstrated that drought limits photosynthesis and growth via water stress, and our findings further corroborate its localized inhibitory effects on GSL [].
5.5.2. Effects of Solar Radiation and Strong Winds
The GSL shows mixed responses to extreme solar radiation, with mild positive correlations being dominant. Moderate increases in radiation can enhance photosynthesis and extend the growing season, whereas excessive radiation may inhibit GSL through increased ET or photoinhibition. Overall, the positive regulatory effect of solar radiation on GSL is slightly weaker than that of precipitation [,].
Extreme wind affects a smaller portion of the plateau (12.08%) and is mainly negatively correlated with GSL. While localized increases in wind speed may slightly extend GSL by improving air circulation or local temperature conditions, the overall effect of strong winds is inhibitory, accelerating water loss, causing mechanical damage, and increasing transpiration. The spatially localized effect of wind mirrors that of drought, aligning with earlier reports on the localized influence of wind on vegetation growth [].
5.5.3. Effects of Extreme Temperatures (ELT/EHT)
Vegetation responses to extreme low temperatures (ELT) and extreme high temperatures (EHT) differ markedly. ELT primarily prolongs soil freezing, increases frost risk, and delays green-up, significantly suppressing GSL. In the western high–cold arid region, about 8.36% of pixels show moderate negative correlation, and 2.75% exhibit strong negative correlation (r < −0.48), indicating high sensitivity of alpine vegetation to low-temperature stress []). By contrast, in the southeastern humid regions, moderate reduction in low temperature can promote GSL extension (r = 0.16~0.43), possibly due to phenological compensation and earlier water supply from snowmelt [].
EHT mainly exhibits a negative correlation with GSL. In regions prone to high-temperature events, about 66% of pixels show negative correlations, with 46.02% in the range of −0.25 to 0, indicating that heat stress generally shortens the growing season. However, in temperature-limited southeastern and high-altitude humid regions, approximately 34% of pixels show positive correlations (r = 0~0.42), suggesting that moderate warming can accelerate heat accumulation and phenological onset, thereby extending GSL []. These results indicate that the influence of temperature on phenology is spatially heterogeneous, with moderate warming in temperature-limited regions potentially producing positive effects [,].
5.5.4. Spatial Heterogeneity and Climate Factor Coupling
Vegetation responses to extreme temperatures are not solely determined by temperature but are also jointly regulated by water availability, radiation, and soil conditions []. The western and central high–cold arid regions display “dual negative correlations,” where both ELT and EHT shorten GSL, highlighting the vulnerability of these ecosystems. The central transitional zone exhibits weak or nonsignificant correlations, indicating that temperature effects are moderated by water and radiation. In the southeastern humid monsoon region, moderate warming shows positive correlations, suggesting that vegetation in temperature-limited areas may benefit from warming, though responses remain constrained by local hydrothermal conditions [].
Integrating spatial responses to precipitation, drought, solar radiation, and wind reveals pronounced spatial heterogeneity in GSL responses to extreme climate events. Water-related factors (precipitation, drought) are the primary regulators of GSL; energy factors (solar radiation) show nonlinear, mixed effects; and physical stressors (wind, extreme temperatures) have strong but localized inhibitory effects. In regions with suitable hydrothermal conditions, moderate warming can produce positive effects, extending the growing season.
5.5.5. Future Trends of Extreme Climate Events and Ecological Risks
According to the IPCC Sixth Assessment Report [], global warming will increase the frequency and intensity of extreme high-temperature events. For the Tibetan Plateau, the projected increase in heat events will further shorten GSL, especially in high–cold arid regions, exacerbating ecosystem vulnerability and potentially affecting grassland productivity and carbon sequestration capacity []. Changes in extreme precipitation and wind may further intensify localized ecological stress, underscoring the need for regionally differentiated management.
By comprehensively analyzing spatial responses of GSL to six types of extreme climate events, this study reveals the relative importance, spatial heterogeneity, and interactive regulatory mechanisms of climatic stressors on the growing season, providing scientific guidance for future climate adaptation and ecosystem management.
5.6. Advantages of GEE in Analyzing Vegetation Phenology on the Tibetan Plateau
GEE provides an efficient, reliable, and reproducible platform for analyzing vegetation phenology on the Tibetan Plateau. Using GEE, we extracted SOS, EOS, and GSL from 2001 to 2023 and quantified trends with Sen’s slope and the Mann–Kendall test. Results show a significant GSL lengthening, averaging 0.24 days per year, with stronger trends at high altitudes (p < 0.05).
5.6.1. Efficient Spatiotemporal Data Processing
GEE integrates long-term datasets such as MODIS and Sentinel, enabling pixel-level analysis without local data downloads. NDVI/EVI time series were smoothed using Savitzky–Golay or double logistic fitting to extract SOS, EOS, and GSL. This approach allows rapid, large-scale, multi-year calculations while ensuring consistency and reproducibility, accurately capturing phenology in northern plateau grasslands and forests.
5.6.2. Trend Analysis and Cross-Scale Significance Testing
Sen’s slope quantified pixel-level change rates, and Mann–Kendall assessed trend significance, suitable for non-normal or incomplete time series. Integration with meteorological data (temperature, precipitation, radiation) enabled analysis across vegetation types, topography, and elevation. Growing season extension was primarily observed in high-altitude grasslands, while low-altitude forests showed little change, in agreement with earlier findings [,,]. The 23-year continuous data allowed precise quantification of trend significance and peak stability.
5.6.3. Adaptation to Complex Environments and Reproducibility
GEE’s continuous pixel-level data and automated workflows reduce bias from sparse ground observations, ensuring reproducibility and facilitating long-term monitoring. This framework enables evaluation of GSL changes and potential impacts on carbon cycling, water use, and ecosystem services. Longer growing seasons may enhance carbon uptake but increase soil water loss and affect herbivore food supply and biodiversity [].
In summary, GEE offers an efficient, reliable, and reproducible framework for quantifying phenological changes and their climate responses, supporting ecosystem management and adaptation strategies on the Tibetan Plateau.
5.7. Research Limitations
Despite systematically analyzing GSL changes and drivers from 2001 to 2023, several limitations remain.
- (1)
- Data quality and spatial resolution.
The MODIS EVI and meteorological station datasets effectively capture large-scale vegetation and climate patterns but may fail to represent fine-scale heterogeneity in the complex, high-altitude terrain of the Tibetan Plateau. Evergreen forests and alpine shrublands exhibit weak seasonal signals, which may affect the accuracy of GSL estimation [,]. Moreover, the relatively small proportion of significant pixels (<5%) should be interpreted cautiously. This result mainly reflects the limited temporal span of the dataset (n = 23 years), which constrains statistical power to detect weak or moderate associations at the pixel level. Temporal autocorrelation in both phenological and climatic variables further reduces the effective degrees of freedom, leading to conservative significance estimates.
- (2)
- Process understanding and causal inference.
Regression and partial correlation analyses are useful for identifying spatial associations but cannot fully capture dynamic causal mechanisms or threshold responses. The annual aggregation of data may also average out the short-term impacts of extreme climate events and human disturbances [,]. Although no formal multiple-testing correction (e.g., False Discovery Rate, FDR) was applied, the purpose of this study was to characterize spatially coherent vegetation–climate linkages rather than to infer strict pixel-wise causality. The spatial consistency of significant clusters across different climatic factors (temperature, precipitation, solar radiation, and evapotranspiration) supports the robustness of the findings and indicates that these patterns are unlikely to result from random chance.
- (3)
- Photoperiod and precipitation phase.
We fully agree that photoperiod and precipitation phase can affect SOS and GSL variability. However, due to the lack of long-term and high-resolution snowfall data consistent with our study period, it was not possible to quantitatively distinguish rainfall from snowfall. Similarly, photoperiod effects are partly captured by the latitudinal gradient inherently considered in the spatial analysis. This limitation has been explicitly acknowledged in the revised Discussion, and future work should incorporate latitude-based photoperiod metrics and precipitation-phase information derived from reanalysis or satellite-based datasets to improve the mechanistic interpretation of vegetation phenology.
- (4)
- High-resolution and multi-source integration.
The integration of high-resolution remote sensing data (e.g., Sentinel-2) and process-based ecosystem models (e.g., DLEM, BEPS) remains limited. This restricts our ability to simulate fine-scale vegetation–climate interactions and micro-ecosystem responses in complex topographic regions []. Future research should enhance temporal coverage, improve spatial resolution, and apply spatially explicit or Bayesian hierarchical models to better address issues of autocorrelation and multiple testing. Further integration of multi-source observations and process-based modeling will advance the understanding of multi-factor mechanisms, support zonal modeling, and provide a foundation for adaptive ecosystem management.
6. Conclusions
This study systematically analyzed the spatiotemporal dynamics and multi-factor drivers of growing season length (GSL) across different land-cover types on the Tibetan Plateau from 2001 to 2023, using multi-source remote sensing data (MODIS EVI) combined with meteorological datasets. The results reveal the integrated effects of climate change and human activities on plateau vegetation phenology. The findings not only confirm the sensitivity of high-altitude vegetation to climate variability but also enhance understanding of hydrothermal interactions and ecosystem heterogeneity, providing a solid basis for carbon cycle modeling and adaptive management in alpine ecosystems. The main conclusions are as follows:
- (1)
- Decadal changes in vegetation phenology are significant.
GSL showed a significant lengthening trend from 2001 to 2023, with an average annual increase of 0.24 days (approximately 1.83~2.53 days per decade; Sen’s slope +0.183 days/year, p < 0.001). This trend was mainly driven by an earlier onset of spring green-up (SOS; Sen’s slope −0.183 days/year, p < 0.001), while the delayed autumn senescence (EOS; Sen’s slope +0.051 days/year, p = 0.435) had a limited effect. Spatially, the largest GSL extension occurred in the warm and humid southeastern regions, displaying high heterogeneity. These results provide pixel-level, long-term evidence that strengthens scientific understanding of phenological responses on the plateau.
- (2)
- Ecosystem-specific responses are pronounced.
GSL extension varied markedly among ecosystems. Grasslands and urban areas exhibited the most significant increases, while deciduous needleleaf forests (DNF) and sparse savannas (SAV) were highly sensitive to climate change. Evergreen forests (ENF, EBF) and wetlands remained relatively stable, with no significant change in peak growing season (Peak_DOY), highlighting resilience during periods of high photosynthetic activity. These patterns suggest that sensitive natural ecosystems can serve as “sentinels” of climate change, whereas stable ecosystems provide regional carbon sinks and ecosystem service foundations. Notably, anthropogenic land covers (cropland and urban areas) showed substantial GSL extension, indicating that human activities play a significant role in local phenological changes and offering direct guidance for differentiated ecosystem management.
- (3)
- Multi-factor drivers are complex and non-linear.
GSL is jointly regulated by temperature, precipitation, solar radiation, and ET (ET), exhibiting non-linear and spatially heterogeneous patterns. Temperature was the dominant factor (mean partial correlation coefficient 0.62), but its effect was modulated by water availability: warming prolonged GSL in cold and arid regions but could suppress growth in warm and humid areas due to increased ET. Precipitation, radiation, and ET showed dual effects and potential lagged influences on local GSL. Interactions among multiple factors and threshold effects highlight the high complexity and regional dependence of phenological responses on the plateau.
- (4)
- GEE and code-based implementation enable efficient analysis.
This study fully leveraged GEE for large-scale, multi-year pixel-level GSL computation and trend analysis. Combined with Sen’s slope and Mann–Kendall tests, the approach provided robust statistical support. Quantification of seasonal stage lengths, coupled with multi-factor partial correlation and spatial heterogeneity analysis, revealed differential responses across ecosystems and climatic conditions. These methods provide reliable parameters for carbon cycle modeling, ecosystem service assessment, and management decisions, demonstrating both innovation and scalability.
In summary, this study comprehensively documents the lengthening and asymmetric seasonal patterns of GSL on the Tibetan Plateau, elucidates diverse responses across land-cover types and climate factors, and deepens understanding of high-altitude ecosystem adaptability and climate resilience. The findings provide a scientific foundation for future phenological prediction and ecosystem management using high-resolution, multi-source data integrated with process-based models.
Supplementary Materials
The following supporting information can be downloaded at: https://www.mdpi.com/article/10.3390/land14112238/s1, Attachment S1: GEE code for processing and downloading vegetation phenology data. Attachment S2: GEE code for processing and analyzing GSL and land use. Attachment S3: MATLAB code. Attachment S4: GEE code for calculating partial correlations between GSL and climate factors. Attachment S5: GEE code for calculating correlations between GSL and extreme climate. Attachment S6: Python code for converting original Julian Date to Day of Year (DOY) and calculating Corresponding Month-Day (MM-DD Format).
Author Contributions
Methodology, L.X. and W.P.; Software, L.X., R.X. and W.P.; Formal analysis, L.X.; Investigation, L.X. and R.X.; Data curation, R.X.; Resources, W.P.; Writing—original draft, L.X.; Writing—review & editing, W.P.; Visualization, R.X. All authors have read and agreed to the published version of the manuscript.
Funding
This work was supported by the National Ministry of Education Humanities and Social Sciences Research Planning Fund Project, China (Grant No. 17YJA850007), titled Regional Differentiation of Poverty and Strategies for Targeted Alleviation in Tibetan Areas of the Northwest Sichuan Plateau. The funders had no role in study design, data collection, analysis, decision to publish, or manuscript preparation.
Data Availability Statement
All datasets and scripts used in this study are publicly available and have been verified for accuracy to ensure reproducibility. The datasets and code can be accessed through the following sources: Climate data including temperature (Temp), precipitation (Precip), surface radiation (SR), and evapotranspiration (ET) were obtained from ECMWF ERA5-Land Daily Aggregated via the Copernicus Climate Data Store (CDS, https://doi.org/10.24381/cds.68d2bb30) at 0.01°spatial resolution. Daily mean values were used to derive extreme climate indices. Extreme climate indices, including extremely high temperature (EHT), extremely low temperature (ELT), extreme dryness (ED), extreme precipitation and snow (EPS), extreme solar radiation (ESR), and extreme wind speed (EWS), were derived from ECMWF ERA5-Land using ETCCDI-based methods at 0.01° resolution []. Annual maxima/minima and other extreme values were calculated. Phenology data, including growing season length (GSL), start of season (SOS), end of season (EOS), and peak of season (POS), were obtained from MODIS MCD12Q2 Version 6.1 (NASA LP DAAC, https://doi.org/10.5067/MODIS/MCD12Q2.061) at 250 m resolution. Land cover data (IGBP classification) were obtained from MODIS MCD12Q1 Version 6.1 (NASA LP DAAC, https://doi.org/10.5067/MODIS/MCD12Q1.061) at 500 m resolution, providing annual land-use classification. Topography data, including elevation (DEM), were obtained from the CGIAR-CSI SRTM 90 m Digital Elevation Database v4.1 (https://srtm.csi.cgiar.org). Vector data for the Tibetan Plateau boundary were obtained from [], providing regional boundary information. Scripts used for data processing and analysis, including Google Earth Engine (GEE), MATLAB, and Python, are freely available upon request after reading this manuscript. The provided materials include detailed instructions, dataset IDs, and usage notes to ensure full reproducibility of the results.
Acknowledgments
The authors sincerely thank the editors and anonymous reviewers for their constructive comments and suggestions, which greatly improved the scientific rigor and overall quality of the manuscript. We are also grateful to the Google Earth Engine (GEE) platform for providing efficient cloud computing and data processing support. MODIS data were obtained from NASA EarthData (https://search.earthdata.nasa.gov/) and the Resource and Environment Science and Data Center (RESDC, https://www.resdc.cn/). Climate data were sourced from the ERA5-Land reanalysis dataset (ECMWF/ERA5_LAND/DAILY_AGGR, https://doi.org/10.24381/cds.68d2bb30), provided by the European Centre for Medium-Range Weather Forecasts (ECMWF). Vegetation phenology data were derived from the MODIS MCD12Q2 Version 6.1 product (https://doi.org/10.5067/MODIS/MCD12Q2.061). The study area boundary was adopted from []. The funding agencies had no role in the design of the study, data collection and processing, analysis, manuscript preparation, or the decision to submit the work for publication.
Conflicts of Interest
The authors declare no conflicts of interest.
References
- Yao, T.; Bolch, T.; Chen, D.; Gao, J.; Immerzeel, W.W.; Piao, S.; Thompson, L.; Wada, Y.; Wang, L.; Wang, T.; et al. The imbalance of the Asian water tower. Nat. Rev. Earth Environ. 2022, 3, 618–632. [Google Scholar] [CrossRef]
- IPCC. Climate Change 2023: Synthesis Report. Contribution of Working Groups I, II and III to the Sixth Assessment Report of the Intergovernmental Panel on Climate Change; Intergovernmental Panel on Climate Change: Geneva, Switzerland, 2023. [Google Scholar]
- Qin, Y.; Xiao, X.; Dong, J.; Zhang, Y.; Wu, X.; Zhang, G. Accelerated warming amplifies extreme events on the Tibetan Plateau. Nat. Clim. Change 2023, 13, 456–463. [Google Scholar]
- You, Q.; Kang, S.; Yu, R. Changes in temperature extremes on the Tibetan Plateau and their attribution. Clim. Change 2020, 158, 267–281. [Google Scholar]
- Immerzeel, W.W.; van Beek, L.P.; Bierkens, M.F. Climate change will affect the Asian water towers. Science 2010, 328, 1382–1385. [Google Scholar] [CrossRef]
- Richardson, A.D.; Keenan, T.F.; Migliavacca, M. Ecosystem warming extends vegetation activity but heightens vulnerability to cold temperatures. Nature 2018, 560, 368–371. [Google Scholar] [CrossRef]
- Piao, S.; Fang, J.; Zhou, L.; Ciais, P.; Zhu, B. Variations in satellite-derived phenology in China’s temperate vegetation. Glob. Change Biol. 2006, 12, 672–685. [Google Scholar] [CrossRef]
- Wang, T.; Peng, S.; Lin, X.; Chang, J. Declining snow cover may affect spring phenological trend on the Tibetan Plateau. Proc. Natl. Acad. Sci. USA 2013, 110, E2854–E2855. [Google Scholar] [CrossRef]
- Zhang, X.; Friedl, M.A.; Schaaf, C.B.; Strahler, A.H.; Hodges, J.C.F.; Gao, F.; Reed, B.C.; Huete, A. Monitoring vegetation phenology using MODIS. Remote Sens. Environ. 2003, 84, 471–475. [Google Scholar] [CrossRef]
- Zhang, Y.; Gao, J.; Liu, L. Diverse responses of vegetation phenology to climate change in different grasslands on the Tibetan Plateau. Agric. For. Meteorol. 2020, 290, 107995. [Google Scholar]
- Chen, A.; Wang, S.; Wang, Y.; Wang, H.; Fu, B.; Zuo, W. Asymmetric responses of alpine spring phenology to daytime and nighttime warming. Agric. For. Meteorol. 2023, 332, 109369. [Google Scholar]
- Forkel, M.; Migliavacca, M.; Thonicke, K.; Reichstein, M.; Schaphoff, S.; Weber, U.; Carvalhais, N. Codominant water control on global interannual variability and trends in land surface phenology and greenness. Glob. Change Biol. 2015, 21, 3414–3435. [Google Scholar] [CrossRef]
- Liu, Q.; Fu, Y.H.; Zeng, Z.; Huang, M.; Li, X.; Piao, S. Temperature, precipitation, and insolation effects on autumn vegetation phenology in temperate China. Glob. Change Biol. 2016, 22, 644–655. [Google Scholar] [CrossRef] [PubMed]
- Shen, M.; Piao, S.; Cong, N. Evaporative cooling over the Tibetan Plateau induced by vegetation growth. Proc. Natl. Acad. Sci. USA 2015, 112, 9299–9304. [Google Scholar] [CrossRef] [PubMed]
- Cheng, M.; Jin, Y.; Zhang, X.; Wang, Y. Asymmetric impacts of diurnal warming on vegetation carbon sequestration of grasslands over the Tibetan Plateau. Nat. Commun. 2021, 12, 6153. [Google Scholar]
- Liu, Y.; Wu, C.; Sonnentag, O.; Desai, A.R.; Wang, H. Crop phenology: A key control for the feedback between crop growth, land surface and climate. Remote Sens. Environ. 2020, 247, 111954. [Google Scholar]
- Wang, L.; He, P.; Liu, J.; Gao, L. Quantitative attribution of phenological changes in farmland: Disentangling climate and human activity. Agric. For. Meteorol. 2023, 330, 108–145. [Google Scholar]
- Piao, S.; Tan, J.; Chen, A.; Le Page, Y.; Mao, J.; Wang, X.; Janssens, I.A.; Fang, J.; Guo, X.; Liu, S.; et al. Altitude and temperature dependence of change in the spring vegetation green-up date from 1982 to 2006 in the Tibetan Plateau. Agric. For. Meteorol. 2011, 151, 1599–1608. [Google Scholar] [CrossRef]
- Piao, S.; Cui, M.; Chen, A. Altitudinal variation in the response of vegetation to climate change on the Tibetan Plateau. J. Plant Ecol. 2007, 31, 3–13. [Google Scholar]
- Chen, B.; Zhang, X.; Tao, J.; Wu, J.; Wang, J.; Shi, P.; Zhou, W.; Cao, X. The impact of climate change and anthropogenic activities on alpine grassland over the Qinghai-Tibet Plateau. Agric. For. Meteorol. 2021, 298, 108235. [Google Scholar] [CrossRef]
- Forkel, M.; Carvalhais, N.; Verbesselt, J.; Mahecha, M.D. Timing of photoperiodic competency causes phenological mismatch in balsam poplar (Populus balsamifera L.). Plant Cell Environ. 2016, 39, 541–552. [Google Scholar]
- Zhang, X.; Liu, L.; Xie, Y.; Liu, C.; Zhang, S. Alpine grassland phenology dynamics and their relationships with climate change on the Qinghai-Tibetan Plateau. Sci. Total Environ. 2024, 906, 167782. [Google Scholar]
- Zhou, J.; Jia, L.; Menenti, M.; van Hoek, M. Reconstructing global satellite-based daily soil moisture data using an improved autoencoder convolutional neural network. Earth Syst. Sci. Data 2021, 13, 2003–2033. [Google Scholar]
- Jeong, S.J.; Ho, C.H.; Gim, H.J.; Brown, M.E. Phenology shifts at start vs. end of growing season in temperate vegetation over the Northern Hemisphere for the period 1982–2008. Glob. Change Biol. 2011, 17, 2385–2399. [Google Scholar] [CrossRef]
- Wu, X.; Liu, H.; Li, X.; Ciais, P.; Babst, F.; Guo, W.; Li, X.; Huang, Y.; Liu, Y.; Wang, T.; et al. Different drought legacies of rain-fed and irrigated croplands in a typical Russian agricultural region. Remote Sens. 2022, 14, 2830. [Google Scholar]
- Wang, Y.; Liu, Y.; Chen, Y. Increased carbon uptake under longer growing seasons in alpine grasslands on the Eastern Tibetan Plateau. Agric. For. Meteorol. 2023, 329, 109267. [Google Scholar]
- Shen, M.; Piao, S.; Cong, N.; Zhang, G.; Janssens, I.A. Precipitation impacts on vegetation spring phenology on the Tibetan Plateau. Glob. Change Biol. 2015, 21, 3647–3656. [Google Scholar] [CrossRef]
- Cong, N.; Du, Z.; Zheng, Z.; Zhang, Y. Altitude explains insignificant autumn phenological variation across alpine regions with large topographic relief in the Tibetan Plateau. Sci. Total Environ. 2024, 906, 171088. [Google Scholar] [CrossRef]
- Hussain, M.; Mahmud, I.; Khan, B. Assessment of seasonal and annual rainfall trends using non-parametric methods: A case study of the Victoria Falls basin. J. Hydrol. 2019, 576, 639–651. [Google Scholar]
- Zhu, W.; Tian, H.; Xu, X. A novel method for extracting vegetation phenology metrics based on the ecological adaptation of plants. Remote Sens. Environ. 2019, 231, 111241. [Google Scholar]
- Legendre, P.; Legendre, L. Numerical Ecology, 3rd ed.; Elsevier: Amsterdam, The Netherlands, 2012. [Google Scholar]
- Zhang, Y.H.; Liu, J.Y.; Xu, X.L.; Wang, Y.Q. Definition of the Tibetan Plateau boundary and its intra-regional division using a digital elevation model. J. Geogr. Sci. 2014, 24, 807–823. [Google Scholar]
- Zhang, Y.; Gao, J.; Liu, L.; Wang, Z.; Ding, M.; Yang, X. NDVI-based vegetation changes and their responses to climate change from 1982 to 2011 in the Tibetan Plateau. J. Clim. 2020, 33, 5057–5069. [Google Scholar]
- Piao, S.; Zhu, Q.; Ciais, P.; Janssens, I.A.; Peñuelas, J.; Wang, T.; Zaehle, S.; Mao, J.; Chen, A.; Xu, M.; et al. Plant phenology and global climate change: Current progresses and challenges. Glob. Change Biol. 2019, 25, 1922–1940. [Google Scholar] [CrossRef] [PubMed]
- Muñoz-Sabater, J.; Dutra, E.; Agustí-Panareda, A.; Albergel, C.; Arduini, G.; Balsamo, G.; Boussetta, S.; Choulga, M.; Harrigan, S.; Hersbach, H.; et al. ERA5-Land: A state-of-the-art global reanalysis dataset for land applications. Earth Syst. Sci. Data 2021, 13, 4349–4383. [Google Scholar] [CrossRef]
- Zhang, X.; Liu, L.; Liu, Y.; Jayavelu, S.; Wang, J.; Moon, M.; Henebry, G.M.; Friedl, M.A.; Schaefer, K.M. Generation and evaluation of the VIIRS land surface phenology product. Remote Sens. Environ. 2018, 216, 212–229. [Google Scholar] [CrossRef]
- Farr, T.G.; Rosen, P.A.; Caro, E.; Crippen, R.; Duren, R.; Hensley, S.; Kobrick, M.; Paller, M.; Rodriguez, E.; Roth, L.; et al. The Shuttle Radar Topography Mission. Rev. Geophys. 2007, 45, RG2004. [Google Scholar] [CrossRef]
- Sulla-Menashe, D.; Friedl, M.A. MCD12Q1 MODIS/Terra+Aqua Land Cover Type Yearly L3 Global 500m SIN Grid V006; NASA EOSDIS Land Processes DAAC: Sioux Falls, SD, USA, 2019. [Google Scholar]
- Zhang, X.; Liu, L.; Chen, X.; Xie, S.; Gao, Y. GLC_FCS30: Global land-cover product with fine classification system at 30 m using time-series Landsat imagery. Earth Syst. Sci. Data 2018, 13, 2753–2776. [Google Scholar] [CrossRef]
- Zhang, Y.; Li, B.; Zheng, D. Publication of data from the article on the extent and area of the Qinghai-Tibet Plateau: Geographic information system data on the boundaries and area of the Qinghai-Tibet Plateau. Glob. Change Sci. Res. Data Publ. Syst. 2014. [Google Scholar] [CrossRef]
- Gong, X.; Liu, J.; Wei, J.; Zhang, X.; Li, Y. Observed changes in extreme temperature and precipitation on China’s Qinghai–Tibet Plateau. Front. Environ. Sci. 2022, 10, 888937. [Google Scholar]
- Li, Y.Q.; Liu, H.Z. Characteristics of the radiation balance and surface albedo of a typical alpine wetland in Qiangtang Plateau. Agric. For. Meteorol. 2020, 287, 107986. [Google Scholar]
- Zhou, B.; Huang, B.; Zhang, H.; Wang, H.; Sun, Y.; Li, R.; Zhai, P. Recent intensification of heatwaves in China and future projections under 1.5–4 °C global warming scenarios. Clim. Dyn. 2024, 62, 3825–3845. [Google Scholar] [CrossRef]
- You, Q.; Jiang, Z.; Tong, J.; Cai, W.; Zhu, Y.; Wu, F.; Chen, D. Extreme cold events in North America and Eurasia in recent decades (1979–2020). J. Clim. 2022, 35, 5745–5762. [Google Scholar]
- Ren, Z.; Zhang, M.; Wang, S.; Liu, Y.; Xu, C.; You, Q. Spatiotemporal variations of extreme precipitation and its linkages with atmospheric circulation over the Tibetan Plateau from 1983 to 2020. Theor. Appl. Climatol. 2024, 155, 2185–2202. [Google Scholar]
- Zhao, Y.; Zhang, M.; Wang, Y.; Su, B.; Jiang, T.; Gao, M. Future projections of extreme precipitation over the Tibetan Plateau based on CMIP6 models. Int. J. Climatol. 2024, 44, 298–315. [Google Scholar]
- Vicente-Serrano, S.M.; Beguería, S.; López-Moreno, J.I. A multiscalar drought index sensitive to global warming: The standardized precipitation evapotranspiration index. J. Clim. 2010, 23, 1696–1718. [Google Scholar] [CrossRef]
- Huang, S.; Zeng, Y.; Wu, B.; Wang, G.; Fischer, T.; Li, C. Spatiotemporal dynamics of drought in the Tibetan Plateau over the last 52 years based on SPEI analysis. Theor. Appl. Climatol. 2020, 141, 1181–1194. [Google Scholar]
- Zou, M.; Niu, T.; Jia, L.; Gao, J.; Wang, H.; Guo, Y. Characteristics of near-surface wind and its response to climate change on the Tibetan Plateau from 1970 to 2016. Int. J. Climatol. 2019, 39, 5769–5783. [Google Scholar]
- Yang, K.; He, J.; Tang, W.; Qin, J.; Cheng, C.C.K. On downward shortwave and longwave radiations over high altitude regions: Observation and modeling in the Tibetan Plateau. Agric. For. Meteorol. 2011, 150, 38–46. [Google Scholar] [CrossRef]
- Immerzeel, W.W.; Lutz, A.F.; Andrade, M.; Bahl, A.; Biemans, H.; Bolch, T.; Hyde, S.; Brumby, S.; Davies, B.J.; Elmore, A.C.; et al. Importance and vulnerability of the world’s water towers. Nature 2020, 577, 364–369. [Google Scholar] [CrossRef]
- Kang, S.; Xu, Y.; You, Q.; Flügel, W.-A.; Pepin, N.; Yao, T. Review of climate and environmental changes of the Tibetan Plateau. Environ. Res. Lett. 2020, 15, 104005. [Google Scholar]
- Zhou, C.; Zhang, X.; Li, J. Assessment of ERA5-Land and CHIRPS datasets for extreme climate analysis over complex terrain. Remote Sens. 2022, 14, 4236. [Google Scholar]
- You, Q.; Wu, T.; Shen, L.; Wang, D.; Kang, S. Changes in extreme climate events and their attributions over the Tibetan Plateau. Clim. Res. 2023, 90, 1–15. [Google Scholar]
- Chen, D.; Gao, Y.; Xu, B.; Guo, H.; Wang, J.; He, C.; Li, X.; Wang, L.; Zhang, Y. Recent changes in the climate system of the Tibetan Plateau. Sci. Bull. 2021, 66, 1799–1814. [Google Scholar]
- Wang, L.; Zhang, T.; Wu, Q. Validation of reanalysis-based extreme temperature indices over the Qinghai–Tibet Plateau. J. Hydrol. 2023, 620, 129392. [Google Scholar]
- Yang, M.; Yao, T.; Wang, X.; Wang, J.; Yu, W. Spatial heterogeneity of extreme precipitation and its topographic dependence over the Tibetan Plateau. Clim. Dyn. 2021, 57, 283–299. [Google Scholar]
- Chen, Y.; Li, X.; Zhang, G.; Luo, M.; Zheng, Y. Influence of topography on extreme climate events across the Tibetan Plateau. Environ. Res. Lett. 2022, 17, 034019. [Google Scholar]
- Liu, Z.; Yang, K.; Wang, Z.; Huang, L.; Shen, M. Spatiotemporal variations and driving factors of extreme climate events over the Tibetan Plateau. Int. J. Climatol. 2023, 43, 1882–1898. [Google Scholar]
- Sun, Q.; Zhou, C.; Li, J. Multi-scale assessment of extreme climate thresholds in high mountain Asia using ERA5-Land reanalysis. Atmos. Res. 2024, 303, 107200. [Google Scholar]
- Zhang, X.; Liu, L.; Liu, Y.; Jayavelu, S.; Wang, J.; Moon, M.; Henebry, G.M.; Friedl, M.A.; Schaaf, C.B. Review of land surface phenology: From vegetation indices to satellite-based observation of terrestrial ecosystems. Prog. Phys. Geogr. Earth Environ. 2018, 42, 543–567. [Google Scholar]
- Ganguly, S.; Friedl, M.A.; Tan, B.; Zhang, X.; Verma, M. Land surface phenology from MODIS: Characterization of the Collection 5 global land cover dynamics product. Remote Sens. Environ. 2010, 114, 1805–1816. [Google Scholar] [CrossRef]
- Cong, N.; Piao, S.; Chen, A.; Wang, X.; Lin, X.; Chen, S.; Han, S.; Zhou, G.; Zhang, X. Spring vegetation green-up date in China inferred from SPOT NDVI data: A multiple model analysis. Agric. For. Meteorol. 2013, 165, 104–113. [Google Scholar] [CrossRef]
- Zeng, L.; Wardlow, B.D.; Xiang, D.; Hu, S.; Li, D. A review of vegetation phenological metrics extraction using time-series, multispectral satellite data. Remote Sens. Environ. 2020, 237, 111511. [Google Scholar] [CrossRef]
- Weiss, M.; Baret, F.; Smith, G.J.; Jonckheere, I.; Coppin, P. Review of methods for in situ leaf area index (LAI) determination: Part II. Estimation of LAI, errors and sampling. Agric. For. Meteorol. 2014, 121, 37–53. [Google Scholar] [CrossRef]
- Shen, M.; Jin, Z.; Wang, J.; Kumar, P.; Sun, Y.; Li, Z. Performance of MODIS Land Cover Dynamics (MCD12Q2) in depicting vegetation phenology in the Tibetan Plateau. Ecol. Indic. 2022, 145, 109708. [Google Scholar]
- Zhao, Z.H.; Wang, X.Y.; Li, R.J.; Luo, W.; Wu, C.Y. Impacts of climate extremes on autumn phenology in contrasting temperate and alpine grasslands in China. Agric. For. Meteorol. 2023, 336, 109495. [Google Scholar] [CrossRef]
- Sen, P.K. Estimates of the regression coefficient based on Kendall’s tau. J. Am. Stat. Assoc. 1968, 63, 1379–1389. [Google Scholar] [CrossRef]
- Kendall, M.G. Rank Correlation Methods, 4th ed.; Charles Griffin: London, UK, 1975. [Google Scholar]
- de Jong, R.; de Bruin, S.; de Wit, A.; Schaepman, M.E.; Dent, D.L. Analysis of monotonic greening and browning trends from global NDVI time-series. Remote Sens. Environ. 2012, 121, 131–145. [Google Scholar] [CrossRef]
- Yue, S.; Wang, C. The Mann–Kendall test modified by effective sample size to detect trend in serially correlated hydrological series. Water Resour. Manag. 2004, 18, 201–218. [Google Scholar] [CrossRef]
- Gorelick, N.; Hancher, M.; Dixon, M.; Ilyushchenko, S.; Thau, D.; Moore, R. Google Earth Engine: Planetary-scale geospatial analysis for everyone. Remote Sens. Environ. 2017, 202, 18–27. [Google Scholar] [CrossRef]
- Tamiminia, H.; Salehi, B.; Mahdianpari, M.; Quackenbush, L.; Adeli, S.; Brisco, B. Google Earth Engine for geo-big data applications: A meta-analysis and systematic review. ISPRS J. Photogramm. Remote Sens. 2020, 164, 152–170. [Google Scholar] [CrossRef]
- Xiong, J.; Thenkabail, P.S.; Gumma, M.K.; Teluguntla, P.; Poehnelt, J.; Congalton, R.G.; Yadav, K.; Thau, D. Automated cropland mapping of continental Africa using Google Earth Engine cloud computing. ISPRS J. Photogramm. Remote Sens. 2020, 160, 77–90. [Google Scholar] [CrossRef]
- Chen, B.; Jin, Y.; Brown, P. An enhanced TIMESAT algorithm for estimating vegetation phenology metrics from MODIS data. IEEE J. Sel. Top. Appl. Earth Obs. Remote Sens. 2021, 14, 4829–4842. [Google Scholar]
- Luo, Y.; Zhang, X.; Wang, Z.; Li, J.; Zhao, H. Trend analysis of growing season length using remote sensing and nonparametric methods. Remote Sens. Environ. 2020, 236, 111451. [Google Scholar]
- Hirsch, R.M.; Slack, J.R.; Smith, R.A. Nonparametric tests for trend in water quality. Water Resour. Res. 1982, 18, 107–121. [Google Scholar] [CrossRef]
- Zhang, Y.; Song, C.; Zhang, K.; Cheng, X.; Zhang, Q. Spatial-temporal variability of terrestrial vegetation productivity in the Yangtze River Basin during 2000–2009. J. Geogr. Sci. 2020, 30, 335–352. [Google Scholar] [CrossRef]
- Wang, F.; Wang, Z.; Yang, H.; Zhao, Y. Using the Mann–Kendall test and double mass curve to identify streamflow variation and its driving factors in the middle reaches of the Yellow River, China. Water 2019, 11, 322. [Google Scholar]
- Gocic, M.; Trajkovic, S. Analysis of changes in meteorological variables using Mann-Kendall and Sen’s slope estimator statistical tests in Serbia. Glob. Planet. Change 2013, 100, 172–182. [Google Scholar] [CrossRef]
- Wang, X.L.; Swail, V.R.; Zwiers, F.W. North Atlantic Ocean wave climate change scenarios for the twenty-first century. J. Clim. 2004, 17, 2368–2383. [Google Scholar] [CrossRef]
- Wei, X.; Li, Q.; Zhang, M.; Wang, X. Vegetation dynamics and its response to climate change in the Yellow River Basin based on MODIS data. J. Geogr. Sci. 2019, 29, 1961–1982. [Google Scholar]
- Mann, H.B. Nonparametric tests against trend. Econometrica 1945, 13, 245–259. [Google Scholar] [CrossRef]
- Hollander, M.; Wolfe, D.A. Nonparametric Statistical Methods, 2nd ed.; John Wiley & Sons: Hoboken, NJ, USA, 1999. [Google Scholar]
- Li, Q.; Zhang, Y.; Wang, Z.; Sun, J. Spatial heterogeneity of vegetation phenology response under anthropogenic disturbances on the Tibetan Plateau. Land Use Policy 2021, 104, 102–119. [Google Scholar]
- Liu, Y.; Li, Y.; Chen, Y. Spatiotemporal variation of vegetation phenology and its response to climate change in the Tibetan Plateau based on remote sensing. Remote Sens. 2022, 14, 512–528. [Google Scholar]
- Wang, J.; Li, X.; Lu, L.; Fang, C. Spatial heterogeneity of the relationship between vegetation phenology and climate change in China’s temperate grasslands. Ecol. Indic. 2021, 121, 107152. [Google Scholar]
- Zhou, J.; Jia, L.; Menenti, M.; van Hoefen, R. Reconstruction of global MODIS NDVI time series: Performance of Harmonic Analysis of Time Series (HANTS). Remote Sens. Environ. 2021, 263, 112545. [Google Scholar] [CrossRef]
- Whittaker, J. Graphical Models in Applied Multivariate Statistics; John Wiley & Sons: Hoboken, NJ, USA, 1990. [Google Scholar]
- Nemani, R.R.; Keeling, C.D.; Hashimoto, H.; Jolly, W.M.; Piper, S.C.; Tucker, C.J.; Myneni, R.B.; Running, S.W. Climate-Driven Increases in Global Terrestrial Net Primary Production from 1982 to 1999. Science 2003, 300, 1560–1563. [Google Scholar] [CrossRef] [PubMed]
- Fisher, J.R.B.; Whittaker, R.J.; Malhi, Y. The future of evapotranspiration: Global requirements for ecosystem functioning, carbon and climate feedbacks, agricultural management, and water resources. Remote Sens. Environ. 2017, 205, 2618–2626. [Google Scholar] [CrossRef]
- Liang, L.; Schwartz, M.D.; Wang, Z. A new approach to detecting and characterizing seasonal transitions in the satellite-derived greenness signal. J. Geophys. Res. Biogeosci. 2015, 120, 247–263. [Google Scholar]
- Sedgwick, P. Assessing the significance of partial correlation coefficients using the t-test. BMJ 2012, 344, e4969. [Google Scholar]
- Li, X.; Xu, B.; Li, M.; Yu, F. Spatio-temporal patterns of remotely sensed phenology and their partial correlation with climate across China. Int. J. Remote Sens. 2023, 44, 1217–1235. [Google Scholar]
- Pettitt, A.N. A non-parametric approach to the change-point problem. Appl. Stat. 1979, 28, 126–135. [Google Scholar] [CrossRef]
- Killick, R.; Fearnhead, P.; Eckley, I.A. Optimal detection of changepoints with a linear computational cost. J. Am. Stat. Assoc. 2012, 107, 1590–1598. [Google Scholar] [CrossRef]
- Reeves, J.; Chen, J.; Wang, X.L.; Lund, R.; Lu, Q.Q. A review and comparison of changepoint detection techniques for climate data. J. Appl. Meteorol. Climatol. 2007, 46, 900–915. [Google Scholar] [CrossRef]
- Xu, W.; Liu, X.; He, Y.; Zhang, L.; Wang, Y. Abrupt changes in vegetation growth and their possible climatic drivers over the Tibetan Plateau from 1982 to 2015. Ecol. Indic. 2021, 122, 107285. [Google Scholar]
- Chen, X.; Wang, L. Detecting abrupt shifts in vegetation growth trends in the Tibetan Plateau using multiple change point analysis. Environ. Res. Lett. 2022, 17, 035002. [Google Scholar]
- Cong, N.; Shen, M.; Yang, W.; Piao, S. Spatial variations in responses of vegetation autumn phenology to climate change on the Tibetan Plateau. J. Plant Ecol. 2017, 10, 744–752. [Google Scholar] [CrossRef]
- Shen, M.; Wang, S.; Zhang, G.; Kong, W.; Piao, S. Plant phenology changes and their climatic drivers on the Tibetan Plateau during 2000–2016. Glob. Change Biol. 2020, 26, 907–917. [Google Scholar]
- Fotheringham, A.S.; Brunsdon, C.; Charlton, M. Geographically Weighted Regression: The Analysis of Spatially Varying Relationships; John Wiley & Sons: Hoboken, NJ, USA, 2002. [Google Scholar]
- Deng, C.; Ma, X.; Xie, M.; Bai, H. Effect of Altitude and Topography on Vegetation Phenological Changes in the Niubeiliang Nature Reserve of Qinling Mountains, China. Forests 2022, 13, 1229. [Google Scholar] [CrossRef]
- Zhao, W.; Liu, H.; Wang, J.; Ma, Y. Spatial heterogeneity of vegetation phenology and its topographic controls on the Tibetan Plateau. Ecol. Indic. 2021, 133, 108426. [Google Scholar]
- Wu, C.; Peng, D.; Zhang, X.; Zhu, G.; Huete, A. Terrain modulation of vegetation phenology sensitivity to climate on the Tibetan Plateau. Agric. For. Meteorol. 2022, 316, 108857. [Google Scholar]
- Zhang, Y.; Wang, T.; Chen, Y.; Shen, M. Topographic effects on the spatial variability of vegetation phenology across the Tibetan Plateau. Int. J. Appl. Earth Obs. Geoinf. 2023, 118, 103279. [Google Scholar]
- Feng, F.; Zhang, Y.; Wang, X.; Li, J.; Chen, Y. Spatiotemporal dynamics of irrigated farmland and its impacts on vegetation phenology across the Tibetan Plateau. Remote Sens. 2022, 14, 3612. [Google Scholar]
- Liu, H.; Wang, J.; Zhao, W.; Ma, Y. Effects of irrigation expansion on vegetation growth and evapotranspiration in arid regions of the Tibetan Plateau. Agric. Water Manag. 2023, 286, 108487. [Google Scholar]
- Mazengo, T.E.R.; Guo, Z.; Liu, X.; Wu, Y.; Li, Y. Effects of irrigation and rain-fed practices on Normalized Difference Vegetative Index of Wheat (Triticum aestivum L.) and its implications on grain yield in Northern China. Environ. Syst. Res. 2023, 12, 36. [Google Scholar] [CrossRef]
- Smith, K.; Zhao, L.; Wang, F. Urban heat island intensity and its relationship with land surface imperviousness across the Tibetan Plateau cities. Urban Clim. 2018, 26, 26–38. [Google Scholar]
- Zhou, D.; Zhan, L.; Meng, L. Quantifying the urban heat island intensity and its impact on vegetation phenology in China’s plateau cities. Sci. Total Environ. 2021, 790, 148122. [Google Scholar]
- Zhao, W.; Liu, H.; Xu, C.; Ma, Y. Quantifying the relative contributions of climate and human activities to vegetation dynamics on the Tibetan Plateau. Ecol. Indic. 2017, 82, 32–44. [Google Scholar]
- Li, X.; Cheng, G.; Liu, S.; Xiao, Q.; Ma, M. Climate change and human activity impacts on vegetation phenology in the Tibetan Plateau. Remote Sens. 2021, 13, 1184. [Google Scholar]
- Wang, J.; Liu, H.; Ma, Y.; Zhao, W. Irrigation-induced phenological changes and their climatic feedbacks on the Tibetan Plateau. Agric. For. Meteorol. 2023, 331, 109367. [Google Scholar]
- Zhang, Y.; Shen, M.; Li, X.; Piao, S. Anthropogenic modulation of vegetation growing season on the Tibetan Plateau under climate warming. Glob. Change Biol. 2024, 30, 543–558. [Google Scholar]
- Chen, X.; Wang, L.; Zhao, W.; Wu, C. Urbanization and irrigation jointly advance vegetation phenology in the Tibetan Plateau. Environ. Res. Lett. 2024, 19, 045012. [Google Scholar]
- Li, X.; Zhang, Y.; Zhao, W.; Ma, Y.; Liu, H. Human activities amplify growing season length extension in oasis and urban regions of the Tibetan Plateau. Sci. Total Environ. 2021, 778, 146329. [Google Scholar]
- Chen, X.; Wang, L.; Zhang, G.; Shen, M. Validation of GSL attribution models under complex human–climate interactions on the Tibetan Plateau. Ecol. Model. 2024, 496, 110012. [Google Scholar]
- Wang, J.; Liu, H.; Zhao, W.; Ma, Y. Multi-source evaluation of GSL response to human–climate coupling in the Tibetan Plateau. Remote Sens. 2023, 15, 3024. [Google Scholar]
- Jones, P.; Brown, R. Urban heat island effects on vegetation phenology and carbon fluxes. Urban Ecosyst. 2020, 23, 857–870. [Google Scholar]
- Cui, X.; Xu, G.; He, X.; Luo, D. Influences of seasonal soil moisture and temperature on vegetation phenology in the Qilian Mountains. Remote Sens. 2022, 14, 3645. [Google Scholar] [CrossRef]
- Liu, Y.; Zhang, K.; Huang, C. Irrigation impacts on vegetation phenology and productivity across arid regions of northwestern China. Agric. For. Meteorol. 2023, 331, 109123. [Google Scholar]
- He, X.Y.; Li, J.; Zhang, Q.; Yang, G.S.; Wang, X.M. Spatial patterns of climatic drivers on vegetation growing season length over the Tibetan Plateau. J. Geophys. Res. Biogeosci. 2024, 129, 1245–1262. [Google Scholar]
- Wei, X.; Xu, M.; Zhao, H.; Liu, X.; Guo, Z.; Li, X.; Zha, T. Exploring Sensitivity of Phenology to Seasonal Climate Differences in Temperate Grasslands of China Based on Normalized Difference Vegetation Index. Land 2024, 13, 399. [Google Scholar] [CrossRef]
- Fu, Y.H.; Prevéy, J.S.; Vitasse, Y. Plant phenology shifts and their ecological and climatic consequences. Front. Plant Sci. 2022, 13, 107126. [Google Scholar] [CrossRef]
- Zhang, D.; Xu, J.; Cai, H. Quantifying human–climate interactions in driving vegetation phenology on the Tibetan Plateau. Environ. Res. Lett. 2024, 19, 024006. [Google Scholar]
- Lei, F.; Guo, X.; Wang, Z.; Chen, J.; Liu, Y. Assessment of the impact of spatial heterogeneity on surface soil moisture using microwave brightness temperature, land-cover and vegetation index indicators. J. Hydrol. 2018, 556, 571–582. [Google Scholar]
- Wu, X.; Liu, H.; Li, X.; Ciais, P.; Babst, F.; Guo, W.; Li, X.; Huang, Y.; Liu, Y.; Wang, T.; et al. Differentiating drought legacy effects on vegetation growth over the temperate Northern Hemisphere. Glob. Change Biol. 2018, 24, 504–516. [Google Scholar] [CrossRef]
- Li, Y.; Zhang, Y.; Cao, G.; Wang, F.; Zhang, X. Pre-season drought controls on patterns of spring phenology in grasslands of the Mongolian Plateau. Agric. For. Meteorol. 2022, 315, 108808. [Google Scholar]
- Yu, H.; Jiang, Z.; Fang, J.; Piao, S.; Zhu, X.; Ciais, P.; Liu, X.; Chen, A.; Zhang, L. Winter and spring warming result in delayed spring leaf-unfolding in subtropical trees. Proc. Natl Acad. Sci. USA 2010, 107, 22534–22538. [Google Scholar] [CrossRef] [PubMed]
- Wang, L.; Wang, Y.; Gao, Y. Sensitivity of grassland growing season length to precipitation variability across hydro-climatic gradients in China. Remote Sens. Environ. 2021, 264, 112573. [Google Scholar]
- Zhong, R.; Yan, K.; Gao, S.; Yang, K.; Ma, X.; Zhu, P.; Fan, L.; Yin, G. Response of grassland growing season length to extreme climatic events on the Qinghai-Tibetan Plateau. Sci. Tot. Environ. 2024, 835, 155448. [Google Scholar] [CrossRef]
- Lin, X.; Wang, G.; Zhang, Y.; Liu, S. Responses of vegetation phenology to climate change in arid and semi-arid regions of northern China. J. Arid Environ. 2022, 198, 104658. [Google Scholar]
- Ma, R.; Shen, X.; Zhang, J.; Xia, C.; Liu, Y.; Wu, L.; Wang, Y.; Jiang, M.; Lu, X. Variation of vegetation autumn phenology and its climatic drivers in temperate grasslands of China. Int. J. Appl. Earth Obs. Geoinf. 2022, 114, 103064. [Google Scholar] [CrossRef]
- Loranty, M.M.; Abbott, B.W.; Blok, D.; Douglas, T.A.; Epstein, H.E.; Forbes, B.C.; Jones, B.M.; Kholodov, A.L.; Kropp, H.; Malhotra, A.; et al. Changing ecosystem influences on soil thermal regimes in northern high-latitude permafrost regions. Biogeosciences 2018, 15, 5287–5313. [Google Scholar] [CrossRef]
- Qi, Y.; Li, J.; Nan, H. Relationship between vegetation phenology and snow cover variations on the Tibetan Plateau. Remote Sens. Environ. 2021, 260, 112454. [Google Scholar]
- Tao, J.; Li, X.; Xu, B. Elevation-dependent effects of growing season length on vegetation activity on the Tibetan Plateau. Glob. Ecol. Conserv. 2020, 22, e00920. [Google Scholar]
- Hou, L.; Wang, M.; Chen, Y.H.; Zhang, Y.; Li, Z.H. Regional differences in climatic control on vegetation phenology across the Tibetan Plateau. Agric. For. Meteorol. 2023, 328, 109345. [Google Scholar]
- Körner, C.; Basler, D. Alpine plant phenology and climate change. Trees Struct. Funct. 2010, 24, 281–291. [Google Scholar]
- Stöckli, R.; Vidale, P.L.; Kirchner, P. Solar radiation forcing on European summer temperatures. Nat. Geosci. 2012, 5, 471–475. [Google Scholar]
- Liang, S.; Liu, X.; Fang, X.; Li, Y.; Zhang, Q.; Piao, S. Improving fine-scale vegetation–climate interaction modeling on the Tibetan Plateau using high-resolution remote sensing and process-based models. J. Geophys. Res. Biogeosci. 2022, 127, e2021JG006789. [Google Scholar]
- Li, Z.; Liu, W.; Zhang, X. Assessing the impact of climate change on vegetation dynamics in the Yangtze River Delta, China. Ecol. Indic. 2021, 120, 106929. [Google Scholar]
- Hahn, C.; Lüscher, A.; Ernst-Hasler, S.; Suter, M.; Kahmen, A. Timing of drought in the growing season and strong legacy effects determine the annual productivity of temperate grasses in a changing climate. Biogeosciences 2021, 18, 585–604. [Google Scholar] [CrossRef]
- Zha, X.; Niu, B.; Li, M.; Duan, C. Increasing Impact of Precipitation on Alpine-Grassland Productivity over Last Two Decades on the Tibetan Plateau. Remote Sens. 2022, 14, 3430. [Google Scholar] [CrossRef]
- Zhong, X.; Zhang, X.; Liu, Y.; Li, W.; Wang, J.; Chen, Y. Alpine vegetation phenology responses to extreme high temperatures on the Tibetan Plateau. Sci. Total Environ. 2024, 942, 177487. [Google Scholar]
- Meng, L.; Zhang, L.; Li, X.; Wang, Y.; Chen, Y. Climate and hydrothermal regulation of vegetation phenology across transitional and humid regions of China. Agric. For. Meteorol. 2021, 296, 108228. [Google Scholar]
- Donat, M.G.; Alexander, L.V.; Yang, H.; Durre, I.; Vose, R.S.; Dunn, R.J.H.; Willett, K.M. Updated analyses of temperature and precipitation extremes in the IPCC Fifth Assessment Report. J. Geophys. Res. Atmos. 2013, 118, 2098–2118. [Google Scholar] [CrossRef]
- Zhang, Q.; Cao, G.; Zhao, M.; Zhang, Y. kNDVI spatiotemporal variations and climate lag on Qilian southern slope: Sen–Mann–Kendall and Hurst index analyses for ecological insights. Forests 2025, 16, 307. [Google Scholar] [CrossRef]
- Zhang, Y.; Gao, J.; Liu, L.; Wang, Z.; Ding, M.; Yang, X. NDVI-based vegetation dynamics and their responses to climate change and human activities from 2000 to 2020 in the Qinghai-Tibet Plateau. Remote Sens. 2022, 14, 3644. [Google Scholar]
- Feng, Z.; Chen, J.; Huang, R.; Yang, Y.; You, H.; Han, X. Spatial and temporal variation in alpine vegetation phenology and its response to climatic and topographic factors on the Qinghai–Tibet Plateau. Sustainability 2022, 14, 12802. [Google Scholar] [CrossRef]
- Meng, Q.; Piao, S.; Li, Y.; Chen, A.; Ciais, P.; Fang, J.; Fang, X.; Liu, Z.; Nan, H.; Wang, T. Vegetation responses to extreme climatic events on the Tibetan Plateau. Agric. For. Meteorol. 2020, 280, 107785. [Google Scholar]
- Zhu, X.; Wang, Y.; Li, W.; Zhang, L.; Song, C.; Zhang, X.; Tang, J.; Liu, Y. Spatial heterogeneity in vegetation–climate relationships across China: Insights from remote sensing and statistical modeling. Remote Sens. Environ. 2022, 277, 113022. [Google Scholar]
Disclaimer/Publisher’s Note: The statements, opinions and data contained in all publications are solely those of the individual author(s) and contributor(s) and not of MDPI and/or the editor(s). MDPI and/or the editor(s) disclaim responsibility for any injury to people or property resulting from any ideas, methods, instructions or products referred to in the content. |
© 2025 by the authors. Licensee MDPI, Basel, Switzerland. This article is an open access article distributed under the terms and conditions of the Creative Commons Attribution (CC BY) license (https://creativecommons.org/licenses/by/4.0/).