Abstract
The soil condition of Norilsk, a large industrial city located in the Arctic zone of Russia, was assessed for the first time using pollution indices calculated based on the gross content of Pb, Zn, Co, Cd, Cu, Ni, Cr, Mn, As, and petroleum products. The Nemerov Pollution Index (NPI) classifies all Norilsk soil samples as polluted. According to the PLI index, 86% of the soil samples were characterized as polluted, and according to the total pollution index (Zc), 56% of the soil samples were classified as moderately hazardous and hazardous polluted. All soil samples had a medium, high, or very high environmental risk. The high level of soil pollution in Norilsk and the crucial role of nonferrous metallurgy as the primary source of these metals are confirmed. Pollutant content in the soil varied in different districts of Norilsk, with Mn and petroleum products being significant. The maximum heavy metal pollution occurred in the soils of the enterprise protection zones and in the soil of the industrial zones. Airborne pollutants from industrial enterprises are the main cause of heavy metal soil pollution in the Norilsk agglomeration. The contribution of other sources of pollution, typical for various functional areas of the city (e.g., motor transport and waste), is not expressed. Simultaneously, the hydrocarbon content is determined by the location of areas near roads, which is typical for districts with a high population and intensive traffic. Using the example of the Central District of Norilsk, the landscaping of the territory was shown to play a role in reducing the total content of heavy metals. Based on the physicochemical properties of Norilsk’s urban soils, the following key measures are proposed to improve soil quality: increasing organic matter content; ensuring a neutral pH and a high cation exchange capacity; and reducing soil density, which will reduce the toxic load on plants and negative impact on human health.
1. Introduction
According to UN forecasts, the urban population will increase to 68.4% by 2050 [1], so the quality of the urban environment will be crucial in ensuring sustainable development. This will largely be determined by the state of urban soils, which implement the main ecological functions of ensuring optimal growth of vegetation, maintaining the activity of soil organisms, absorbing pollutants, and maintaining biodiversity in the city. In urban areas, soils are formed under the influence of natural (climate, relief, and vegetation) and anthropogenic factors. However, because of anthropogenic and technogenic impacts, the quality of urban soils will deteriorate. The most common factors of anthropogenic impact on soil are chemical pollution, littering, and soil compaction. The degree of manifestation of this impact depends on the character and intensity of economic activity. Under a strong anthropogenic impact (pollution or sealing), the main ecological functions are lost. Therefore, the rational use of soil resources, based on an assessment of the degree of soil pollution, the ecological functions performed, and the ecosystem services provided, is an important element of a modern approach to planning sustainable green urban infrastructure [2,3].
Urban soils accumulate pollutants from industrial enterprises, transportation, agriculture, and waste. Most often, urban soils contain high concentrations of heavy metals, which are a threat not only to the sustainable development of urban green infrastructure [4,5] but also to public health [6,7,8], and are a source of aquatic ecosystem pollution, characterized by low self-purification rates in the Arctic [9,10]. Anthropogenic activities in cities change the biological productivity of the soil [11], extending the growing season for plants due to an increase in the average annual temperature and the supply of additional moisture to the soil. In this regard, additional organic carbon accumulation in urban soils is possible [12], as well as increased greenhouse gas emissions and nutrient imbalances [13].
Pollution indices are widely used to assess metal accumulation in urban soils [14,15,16,17,18,19] and to assess the state of the environment [20]. Pollution indices make it possible to choose the direction of reclamation and develop an action plan to improve the soil quality and the environmental rating of cities and reduce the negative impact on the urban population [21].
Industrial cities are of great interest for an integrated assessment of the degree of heavy metal pollution, but only a few studies have examined urban soils near mining and processing areas [21]. The rational use of soils in urban ecosystems is especially relevant in the Arctic, where landscapes are highly vulnerable to anthropogenic loads due to climatic factors and the low rate of substance turnover. Both factors (the serious long-term technogenic impact and the location in the Arctic zone) are most expressed in Norilsk (Russia). Furthermore, Norilsk is a permanent residence for over 170,000 people, making research into Norilsk’s urban soils crucial.
Therefore, the aim of this study was to assess the degree of pollution of urban soils in the Arctic industrial city of Norilsk using pollution indices, as well as the features of the spatial distribution of pollution depending on the city districts and urban functional zones.
2. Materials and Methods
2.1. Study Area
Norilsk is located in the north of the Krasnoyarsk region of Russia, south of the Taimyr Peninsula, approximately 300 km north of the Arctic Circle. The climate corresponds to the subarctic type (by the Köppen classification—transitional from subarctic (Dfc) to arctic (ET)). The average annual air temperature is −9.6 °C (the average temperature in January is −27 °C, in July +14 °C), and the relative air humidity is 76%. In Norilsk, negative temperatures are observed about 240 days a year, and the snow cover lasts from seven to nine months. The location beyond the Arctic Circle determines the presence of periods of polar day (from 20 May to 24 July) and polar night (from 30 November to 13 January).
The population of Norilsk is 175,773 people (2025), which makes it the second most populous city in the world beyond the Arctic Circle (after Murmansk), and the second largest city built on permafrost (after Yakutsk). Since 2005, Norilsk has consisted of three administrative districts: Central, Talnakh, and Kayerkan. The last two were formed by annexing satellite towns of the same name. Another settlement, Oganer, became part (microdistrict) of the Central District of the city. The districts are territorially isolated from each other and are at a distance of 5–20 km (Figure 1). The characteristics of the districts of Norilsk are presented in Table S1.
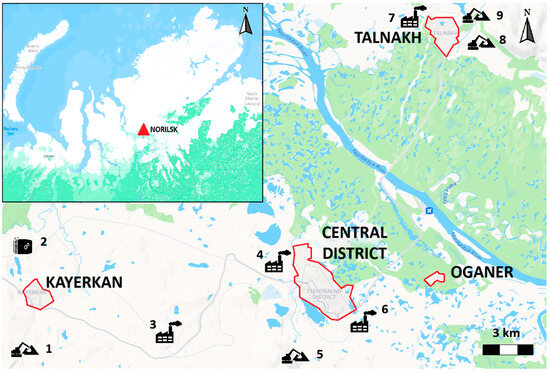
Figure 1.
Geographical location of Norilsk agglomeration and main industrial sources of pollution: 1—coal quarry, 2—oil products depot, 3—Nadezhdinsky metallurgical plant, 4—copper plant, 5—Medvezhy Ruchey quarry, 6—thermal power plant, 7—thermal power plant, ore enrichment plant and Oktyabrsky mine, 8—Mayak mine, and 9—Komsomolsky mine.
The Norilsk industrial region contains deposits of sulfide copper–nickel ores and other minerals. Most of the large deposits are located along the deep Norilsk–Khatanga fault, forming the Norilsk and Talnakh ore clusters. Ore bodies (large layers, lenses and veins of rich sulfide ores, and deposits of disseminated ores) are typically located at a depth of 150 to 1500 m from the surface. The main ore minerals are pentlandite, pyrrhotite, chalcopyrite, and cubanite [22].
The main industries are mining and smelting of ore to produce Ni, Cu, Co, Pt, Pd, and other rare earth metals, and coal mining. Airborne emissions include Ni, Cu, Co, Pb, Se, NOx, COx, SO2, H2S, phenol, and the radioisotopes Sr-90 and Cs-137. The main source of pollution is Norilsk Nickel’s enterprises, including the Nadezhdinsky metallurgical plant, copper plant, and Talnakh ore enrichment plant.
In the west of the Central District, the copper plant is located; the distance from the border of the enterprise to the residential area is about 550 m. Then, 700 m to the south of the residential area, there is a thermal power plant; 2 km away—a cement plant; and 7 km away—the Medvezhy Ruchey quarry for the extraction of copper–nickel ore. The Nadezhdinsky metallurgical plant is located 8.5 km to the west of the Central District and 8 km to the east of Kayerkan. There is also a large oil products depot 2 km north of Kayerkan. In the immediate vicinity of Talnakh in the northern and northwestern direction, there is the Komsomolsky mine (300 m from the residential area), the ore enrichment plant (600 m), the thermal power plant (2 km), and the Oktyabrsky mine (3.1 km).
Soil pollution in Norilsk is one of the most acute environmental problems caused by the intensive industrial activity of the mining and metallurgical complex. Urban soils are polluted by heavy metals (Ni, Cu, Co, and Pb), SO2, and oil products. The constant load on the soil changes in almost all components, from agrochemical and physical properties to microbiological and biochemical indicators. The analysis of the ecosystem state and its individual components in the Norilsk industrial region was carried out earlier [23,24,25,26], but the current data on the level of pollution of the urban soils of Norilsk are insufficient.
2.2. Sampling
In total, 78 soil samples were taken from the surface horizon of 0–10 cm in Norilsk (38 in the Central District, 15 in Talnakh, 14 in Oganer, and 11 in Kayerkan). The number of samples depended on the different areas and the population density of the Norilsk districts. When selecting sampling sites, we considered the functional zones, the most representative areas of urban development, and the location of the main source of pollution.
2.3. Functional Zones
The sampling points were located within the city boundaries and included public (commercial), residential, recreational, industrial, and protection zones. A protection zone is an area around industrial objects that may have a negative impact on the environment and human health. The main objective of the protection area is to create a buffer between the source of danger (pollution) and residential, public, or natural areas, minimizing harmful impacts. The functional zones were identified from the National Spatial Data System portal (https://nspd.gov.ru/map?zoom=12.927042077188121&coordinate_x=9821880.277871035&coordinate_y=10859193.455237981&baseLayerId=235&theme_id=1&is_copy_url=true&active_layers=36315 (accessed on 3 November 2025)). For the Central District, 4 functional zones were identified—recreational (Rec), residential (Res), public (Pub), and industrial (Ind); for Talnakh, 4 zones were identified—recreational (Rec), residential (Res), protection (Prt), and industrial (Ind); and for Kayerkan and Oganer, 2 zones were identified—recreational (Rec) and residential (Rec).
In the Central District for the residential zones, sample plots located in the yard (Res (yard)) and roadside (Res (road)) were identified. In the recreational and public zones of the Central District, plots were located both in areas with (Rec.1; Pub.1) and without (Rec.0; Pub.0) landscaping.
2.4. Chemical Analysis
Chemical analyses were performed at the RUDN University Soil and Ecology Laboratory. The laboratory’s unique number in the Russian register of accredited entities is RA.RU.2OE55. The laboratory performs all necessary procedures to provide quality control (QA/QC) of the chemical analyses. The laboratory quality control of the measurements was carried out in full compliance with the requirements of the Laboratory Quality Manual, including the use of standard samples for accuracy control, comparison tests, and encoded samples. Analysis was performed using verified and certified equipment.
In the laboratory, the total content of heavy metals (Pb, Zn, Co, Cd, Cu, Ni, Cr, Mn, and Fe), As and oil products, total organic matter and nitrogen, mobile phosphates and potassium, and pH values were determined in soil samples.
The total content of heavy metals and As was determined via atomic absorption spectrometry after microwave decomposition of the soil sample in a mixture of concentrated hydrochloric acid, nitric acid, and hydrofluoric acid (MVI 80-2008).
The total petroleum hydrocarbons (TPHs) in the soil was determined using the fluorimetric method for the purified extract of the Fluorat-02 liquid analyzer after extracting oil products from the soil sample with hexane and purifying the extract via column chromatography with aluminum oxide (PND F 16.1:2.21-98).
The content of organic matter in mineral and organomineral soils was determined using the photometric method based on the oxidation of soil organic matter with a solution of potassium dichromate in sulfuric acid and the subsequent determination of the content of trivalent chromium, equivalent to the content of organic matter in the soil, on a spectrophotometer at a wavelength of 590 nm (GOST 26213-2021). The organic matter content in the peat soils was analyzed using the gravimetric method, which determines the mass of the ash residue after burning the sample at a temperature of 525 °C. The mass loss upon burning was taken as the mass of organic matter (GOST 26213-2021).
The total nitrogen content was determined using the Kjeldahl method, based on the mineralization of the sample by heating with concentrated sulfuric acid in the presence of hydrogen peroxide, followed by the distillation of ammonia into a boric acid solution and determination of the ammonium ion content via titration with a sulfuric acid solution in the presence of an indicator (PND F 16.1:2:2.3.82-2013).
The content of mobile phosphorus (P2O5) and potassium (K2O) in the acidic soils was determined using the Kirsanov method based on the extraction of phosphorus and potassium with a hydrochloric acid solution and its quantitative determination using a spectrofotometer (P2O5) and a flame photometer (K2O) (GOST R 54650-2011). For carbonate (alkaline) soils, the Machigin method was used, based on the extraction of mobile phosphorus and potassium from the soil with a solution of ammonium carbonate and the determination of phosphorus in the form of a blue phosphorus–molybdenum complex on a spectrofotometer (P2O5) and on a flame photometer (K2O) (GOST 26205-91).
The soil pH value was determined using a pH meter in a suspension of soil with distilled water (pHH2O) or a solution of KCl (pHKCl) at a ratio of 1:5.
2.5. Pollution Indices
One of the obstacles to using pollution indices for urban soils may be the difficulty in determining the geochemical background [27,28]. A study of tundra landscapes in Northeastern European Russia showed that in the upper soil horizons of the Arctic and Subarctic, background concentrations of heavy metals and arsenic vary widely depending on the soil type, and their average content is as follows (mg/kg): Pb—10.4; Zn—47.6; Co—6.7; Cd—0.4; Cu—7.0; Ni—12.9; Cr—13.0; Mn—1126.6; Fe—12747; As—3.0 [29]. When assessing soil pollution in the area of Norilsk, the background content of heavy metals at a distance of 50 km from Norilsk was determined, which was as follows (mg/kg): Ni—28; Cu—30; Cr—92; Mn—797 [23]. However, ore deposits in the west of Taimyr formed a natural geochemical anomaly with a high level of element content; therefore, the following values were proposed for the environmental assessment of the soil state in the Norilsk industrial region: Cu—79.8; Ni—63.8; Co—10.8; Pb—12.8 [30]. Later, slightly different values were proposed as a regional standard for assessing soil pollution in the Norilsk industrial region (mg/kg): Cu—75, Ni—90, Co—40, Cr—170, oil products—40 [31]. In this study, we used the following values as background concentrations to calculate the pollution indices (mg/kg): Pb—12.8; Zn—47.6; Co—40; Cd—0.4; Cu—75; Ni—90; Cr—170; Mn—797; As—3.0; oil products—40, which were defined as background values for Yamal [29], Taimyr [23], and the Norilsk industrial region itself [30,31].
We also compared the content of heavy metals in soils with the approximately permissible concentrations (APCs). This is the maximum content of pollutant that will not cause negative changes in the soil during long-term exposure and will not lead to the accumulation of toxic elements in plants. APCs are designed for soils with different properties (acidity and particle size distribution). In Russia, the APC of heavy metals for soils of populated areas is established by sanitary rules and regulations: “Hygienic standards and requirements for ensuring the safety and (or) harmlessness of environmental factors for humans” (SanPiN 1.2.3685-21).
The individual element danger was assessed using the Single Pollution Index (PI):
where Ci is the element content in the soil of the study area, and Cb is the background element content.
The following classes were used: PI < 1—no soil pollution; 1 < PI < 2—low pollution; 2 < PI < 3—moderate pollution; 3 < PI < 5—high pollution; PI > 5—very high pollution.
The negative impact of several elements was assessed using the total pollution index (Zc) with the following formula:
where PI is the pollution index for a single element with PI > 1; n is the number of elements with PI > 1.
Soils are classified into different pollution levels: Zc < 16—acceptable; 16 < Zc <32—moderately hazardous; 32 < Zc < 128—hazardous; Zc > 128—extremely hazardous pollution level.
Complex pollution was assessed using the Pollution Load Index (PLI):
where PI is the pollution index for a single element, and n is the number of determined elements.
If PLI < 1, the soil is classified as unpolluted; PLI = 1, the degree of pollution is insignificant; and PLI > 1, the soil is polluted.
To assess the pollution and quality of the soil, the Nemerow Pollution Index (NPI) was used:
where PImax is the maximum PI value, and n is the number of determined elements.
There are five pollution classes: NPI ≤ 0.7—no pollution; 0.7 < NPI ≤ 1—not significant pollution; 1 < NPI ≤ 2—slight pollution; 2 < NPI ≤ 3—moderate pollution; 3 > NPI—high pollution.
The Potential Ecological Risk Index (PERI) was calculated using the following formula:
where Er is the potential environmental risk of the individual elements, which was determined using the following formula:
where Tr is the toxicity factor for living organisms has the following values for the studied elements: Cr = 2, Ni = 5, Zn = 1, Cu = 5, Pb = 5, Cd = 30, As = 10, and Mn = 1. The PERI index is ranked into the following classes: PERI < 90—low risk, 90 ≤ PERI < 180—moderate risk, 180 ≤ PERI < 360—high risk, 360 ≤ PERI < 720—very high risk, and PERI ≥ 720—extremely high risk.
In Russia, there is no approved standard for the content of petroleum products in soil, so the Pollution Index of Total Petroleum Hydrocarbons (PITPH) previously proposed to assess the pollution of soils in Murmansk [32] was used to assess the level of pollution in Norilsk:
where C is the content of petroleum products in the soil, and OM is the content of organic matter.
For background soils, PITPH is <0.15; for slightly polluted soils, 0.15 < PITPH < 1; for polluted soils, 1 < PITPH < 3; for highly polluted soils, PITPH > 3.
TPH is defined as a complex mixture comprising chain and cyclic hydrocarbons, heteroatomic compounds, resins, and asphaltenes. Besides hydrocarbons typical for petroleum products, the extract contains components from the soil humus and plant residues [33]. In addition, the assimilative potential (the actual ability of landscapes and environmental components to self-purify) is greater in soils with a high organic matter content and a neutral pH [34]. Therefore, to assess the effect of biogenic hydrocarbons on the content of TPH and the self-purification capacity of soils, it is necessary to consider the content of organic matter in the soil. This approach allows us to consider the influence of biogenic organic compounds, defined as hydrocarbons, on the content of oil products and to interpret the results more objectively.
2.6. Statistical Processing
Data on the content of elements were processed in accordance with standard procedures of descriptive statistics. The results are presented as the mean value and standard error, median, and variation coefficient. To compare the content of elements in urban soils and pollution indices in different areas and functional zones, post hoc Tukey and Games–Howell tests with a significance level of 0.05 were used. The relationships between element concentrations were analyzed using Spearman correlation. Data analysis and visualization were performed using Microsoft Excel (Microsoft 365, version 2508), JASP 0.95.2, and QGIS 3.40.
3. Results
3.1. Characteristics of Urban Soils
The soils of the Norilsk industrial region are classified as tundra soils and are mainly represented by cryozems, as well as podburs, peat-cryozems, granuzems, and lithozems [13,30]. The soils of the Norilsk agglomeration are characterized by high heterogeneity: from natural and quasi-natural soils at the border of residential areas to soil-like formations from technogenic deposits (sludge, gravel, and construction waste) covered by imported soils of various origins, properties, and environmental quality [6]. The profiles of typical urban soils of Norilsk are shown in Figure 2. The average values of agrochemical indicators of Norilsk urban soils are provided in Table S2.
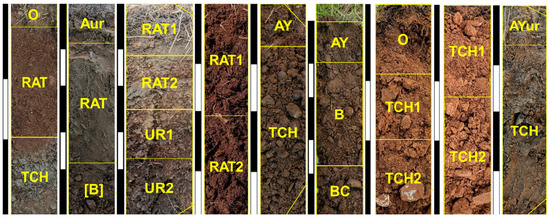
Figure 2.
Examples of typical urban soil profiles in Norilsk. O—topsoil organogenic horizon; Aur—topsoil organogenic horizon with urbopedogenesis; AY—topsoil organogenic sod soil horizon; UR—topsoil organogenic horizon with construction and household waste (>10%); RAT—recultivation organomineral horizon; AYur—topsoil organogenic sod soil horizon with construction and household waste (>10%); TCH—technogenic horizon without soil formation; B—mineral subsoil horizon; BC—mineral transition subsoil horizon.
Norilsk soils are heterogeneous in granulometric and agrochemical composition. Sands, sandy loams, and loams are the most common, and peat in the 0–10 cm layer was found in only 15% of samples. Most soils have a low water-holding capacity. Hydromorphic processes associated with waterlogging occur only with a low soil profile thickness and in the presence of waterproofing (for example, concrete utility covers). In some roadside areas and in yards, the soil is overconsolidated (density up to 1.6 g/cm).
The soil pH varies from slightly acidic to alkaline, with a predominance of neutral pH. In urban soils, both insufficient (<4%) and excessive (>10%) organic matter content are noted. The content of organic matter < 4% is mainly characteristic of yards and roadside areas. The content of organic matter > 10% is more often noted for recreational areas. Norilsk soils are poor in nitrogen: in a third of the samples, C/N > 25, and in some areas, the C/N values exceed 100. The potassium and phosphorus content is sufficient and often excessive.
3.2. Urban Soil Pollution in the Norilsk Agglomeration
The total content of heavy metals, arsenic, and petroleum products is presented in Table 1. The values were higher than background in most of the samples: Co—68%, Zn—82%, Ni—85%, Cu, Cd, and As—99–100%. To a lesser extent, urban soils are polluted with Mn, Cr, and Pb—in 3/4 of the samples, the content of these elements was below background values. Also, the TPH content exceeded background concentrations in 99% of the samples.

Table 1.
Total content of heavy metals, arsenic, and petroleum products in the upper horizon of Norilsk urban soils (mg/kg).
The Pb and Mn content in the upper soil layer was below the approximately permissible concentrations (APC) in all samples. However, in 9% of samples, the APC was exceeded for Zn; in 27%, it was exceeded for Cd; in 76%, it was exceeded for Ni; in 91%, it was exceeded for Cu; and in 99%, it was exceeded for As. There are no APC standards for the total soil content of Co, Cr, or petroleum products. Cd, As, and Zn are elements of hazard class 1, and Cu and Ni are elements of hazard class 2, so they can have an adverse effect on the health of the city’s population in accordance with hygienic standards.
The total pollution index (Zc) for soils in Norilsk ranged from 4 to 81 (44% of urban soil samples in Norilsk were classified as acceptable, 29% as moderately hazardous, and 27% as hazardous pollution).
The PLI, which indicates the total accumulation of heavy metals and is used to assess the complex pollution, characterized 14% of soil samples as unpolluted (PLI < 1) and 86% as polluted (PLI > 1).
The Nemerov Pollution Index (NPI), which takes into account the contribution of each heavy metal and the potential hazard of the pollutant with the highest content, ranged from 1.0 to 19.9 and classified all Norilsk soil samples as polluted (13% slightly, 35% moderately, and 52% highly polluted).
The Potential Ecological Risk Index (PERI), which takes into account the total heavy metal content and toxicity factors for each heavy metal, varied widely, from 91 to 573. Of all the soil samples, 29% corresponded to a medium level of ecological hazard, 58% to a high level, and 13% to a very high level.
The average content of petroleum products in urban soils of Norilsk was 502.2 ± 59.9 mg/kg, which exceeded the background value by 12.5 times. Most soil samples can be classified as slightly polluted and polluted (PITPH = 0.01–5.89 mg/kg).
Correlation analysis showed a strong positive relationship between the content of Ni and Cu (r = 0.933), Fe and Co (r = 0.847), Zn and Pb (r = 0.780), Zn and Co (r = 0.763), Ni and Pb (r = 0.727), as well as a medium positive relationship between the content of other heavy metals (Table S3). Correlation between the content of heavy metals may indicate their joint entry and accumulation in the soil. This is especially pronounced for the priority pollutants—Cu and Ni. Positive significant correlations between the content of heavy metals (e.g., for Zn and Cu, Cu and Cd, and Ni and Cd) were previously noted for Moscow’s urban soils [14]. A significant correlation was also found between the content of petroleum products with heavy metals.
Organic matter and clay minerals can be carriers of heavy metals, which is typical, for example, in Salekhard, but in Norilsk soils, no reliable relationship was found between the metal content, the amount of organic matter, the pH value, and the granulometric composition [35]. Previously, it was shown that the total content of heavy metals does not depend on the amount of clay, organic matter, and the pH in the soils of natural and technogenic landscapes of Taimyr [31]. In addition to organic matter, under automorphic conditions, Ni and Co can be included in the structure of manganese oxides, and cationogenic heavy metals (Mn, Ti, Ni, V, Zn, and Cu) can be sorbed on the surface of iron (hydr)oxides, especially when urban soils are enriched with technogenic iron [36]. Pb can be present in the phosphates, and in this form, it is found near roads and in soils of urban lawns [37]. A common feature of soils of humid landscapes under abundant precipitation, low evaporation, and the presence of periods of freezing and thawing is the formation of ferromanganese nodules [38]. These formations actively accumulate Mn, Co, Pb, Cr, Cu, and Cd [39].
A negative reliable correlation (r = −0.500–0.861) was found between the As content and the amount of organic matter in the upper soil layer for the Central District and Talnakh. Iron, aluminum, and manganese (hydro)oxides can be carriers of As in soil [40]. In our study, this is confirmed by the reliable correlation (r = 0.603) between the As and Mn content in the soils.
The coefficient of variation of the heavy metals and oil products content in Norilsk urban soils is very high, which indicates strong heterogeneity in the distribution of metals and determines the need to analyze the heavy metal content in different districts and functional zones of the city.
3.3. Urban Soil Pollution in Different Districts of Norilsk
The districts of Norilsk differed in the content of heavy metals, As, and TPH in the soil (Table 1).
Talnakh soils had a high content of Pb, Zn, Co, As, Mn, Cr, and Fe; the Central District had a high content of Cu, Ni, and TPH; and Kayerkan had Cd. However, the ANOVA test showed significant differences between districts only in the content of Mn (p < 0.001–0.007) and TPH (p = 0.006) (Figure 3). The soils of Oganer were the least polluted with TPH and only slightly exceeded the background. No significant differences in pollution indices were found between Norilsk districts.
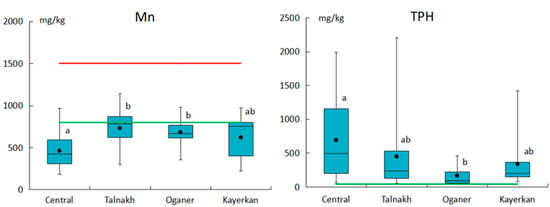
Figure 3.
Content of Mn and TPH in urban soils of Norilsk (different letters indicate significant differences (p < 0.01) between districts). The red line shows the APC, and the green line shows the background.
In accordance with the pollution indices, the districts of Norilsk can be ranked in the following order of decreasing pollution levels: Central District, Talnakh → Kayerkan, Oganer (Table 2). In the soils of the Central District, the maximum values of pollution indices were noted, but at the same time, maximum variability of the values of pollution indices was also observed.
Table 2.
Pollution indices (Zc, PLI, NPI, and PITPH) and ecological risk (PERI) of urban soils in Norilsk.
3.4. Urban Soil Pollution in Different Functional Zones of Norilsk
Functional zones differed in pollution levels only in the largest districts of Norilsk—the Central District and Talnakh (Figures S1 and S2). In the Central District, the ANOVA test revealed significantly higher Pb levels in the soils of public zones without landscaping than in recreational zones after landscaping (soil replacement and planting) (p = 0.024) and public zones after landscaping (p = 0.050) (Figure 4).
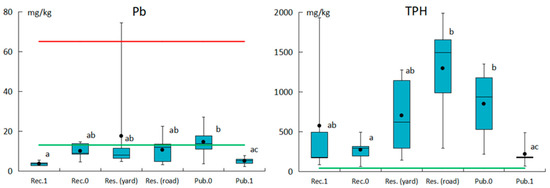
Figure 4.
Content of Pb and TPH in urban soils of the Central District (different letters indicate significant differences (p < 0.05) between functional zones). Rec.0—recreational without landscaping; Rec.1—recreational after landscaping; Res. (yard)—residential (yard); Res. (road)—residential (roadside); Pub.0—public without landscaping; Pub.1—public after landscaping. The red line shows the APC; the green line shows background.
The ANOVA test revealed differences between districts only for the Potential Ecological Risk Index, but the results of a post hoc test were not significant. At the same time, the lowest values for all pollution indices were observed in recreational zones after landscaping (Figure 5). These zones correspond to the acceptable level for the total pollution index (Zc), moderate pollution according to the Nemerov index (NPI), and moderate potential ecological risk (PERI). Soils of residential zones, regardless of their location in the yard or on the roadside, as well as soils of public zones without landscaping (Pub 0), are characterized by higher pollution indices. The maximum pollution was for soils of recreational zones without landscaping (Rec 0) and industrial zones (Ind), located near the copper plant.
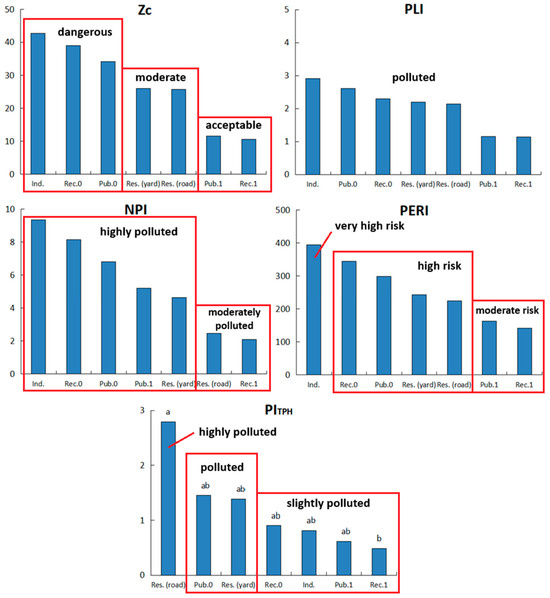
Figure 5.
The pollution indices (Zc, PLI, NPI, and PITPH) and ecological risk index (PERI) for different functional zones of the Central District (different letters indicate significant differences (p < 0.05) between functional zones): Rec.0—recreational without landscaping; Rec.1—recreational after landscaping; Res. (yard)—residential (yard); Res. (road)—residential (roadside); Pub.0—public without landscaping; Pub.1—public after landscaping; Ind.—industrial.
The content of TPH in the soils of recreational zones without landscaping was significantly lower than in the soils of residential zones near the road and public zones without landscaping (p = 0.022–0.044). At the same time, the TPH content in soils of public zones after landscaping was significantly lower than in residential zones near the road and public zones without landscaping (p = 0.017–0.027) (Figure 4). The maximum values of the PITPH in the Central District were observed near roads, which were twice as high as the indicators for yard areas of the residential zones and 4.5–5.8 times higher than for urban areas after landscaping (Figure 5). The PITPH was significantly lower in recreational areas after landscaping than in residential areas near the road (p = 0.046).
In Talnakh, the maximum heavy metal pollution was in the protection zone of enterprises (Prt), and the minimum was in recreational (Rec) and residential (Res) zones. The results of the ANOVA test showed a significantly higher Zn content in the soil of the protection zone compared to residential and recreational zones (p = 0.040), as well as a higher Ni content compared to the residential zone (p = 0.030) (Figure 6).
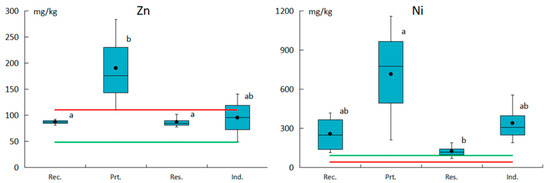
Figure 6.
Content of Zn and Ni in urban soils of Talnakh district (different letters indicate significant differences (p < 0.05) between functional zones). Rec—recreational, Res—residential, Ind—industrial, Prt—protection. The red line shows the APC; the green line shows background.
The ANOVA test revealed differences between the functional zones only for the Pollution Load Index, which was significantly higher in the protection zone of enterprises than in residential areas (p = 0.036). The PITPH in the Talnakh was the highest in the soil of the protection zone of enterprises (polluted) and the lowest in the soils of recreational and residential zones (slightly polluted). In general, the maximum pollution indices in the Talnakh were in the protection zone of enterprises (Figure 7).
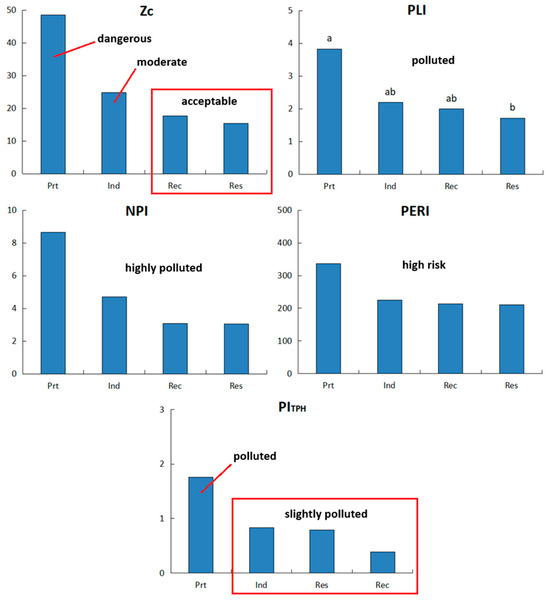
Figure 7.
The pollution indices (Zc, PLI, NPI, and PITPH) and ecological risk index (PERI) for different functional zones of Talnakh. Rec—recreational, Res—residential, Ind—industrial, and Prt—protection.
In Kayerkan and Oganer, no significant difference in the soil pollution with heavy metals in functional zones was found, which can be explained by the small area of the districts and the uniform distribution of pollution due to aerotechnogenic transfer.
4. Discussion
The Nemerov Pollution Index (NPI) classifies all Norilsk soil samples as polluted. According to the PLI index, 86% of the soil samples are characterized as polluted, and according to the total pollution index (Zc), 56% of the soil samples are classified as moderately hazardous and hazardous pollution. All soil samples had a medium, high, or very high level of environmental risk.
One previous study identified three zones of pollution in the Norilsk industrial region: (1) the urban zone, where the soils are polluted with slags; (2) the suburban zone at a distance of up to 15 km, where pollution occurs due to aerosols; and (3) the background zone up to 100 km from the city. The largest area of pollution was in the 30 km zone from the pollution sources, and the highest concentrations of pollutants were observed along the wind direction from the emission sources [23]. The results of observations by the Federal Service for Hydrometeorology and Environmental Monitoring from 2014 to 2023 showed that Norilsk soils belong to the hazardous category of metal pollution (Zc = 123) [24]. Technogenic soils of Norilsk contain the following levels of pollutants (mg/kg): Cu—513–3893, Ni—733–5867, Co—64–157, and Cr—378–1200 [25]. Our study revealed wider concentration ranges for Cu (68–4426 mg/kg) and Co (15–664 mg/kg), and the lower limits for Ni, Cu, and Co concentrations were significantly lower than in the previous study. The total pollution index (Zc) for the urban areas of Norilsk did not exceed 81. This difference may be due to the use of different background element concentrations. We used values that account for the high geochemical background of the Norilsk industrial region, which we believe is more accurate.
However, the urban soil pollution indices in Norilsk were higher than those in many other urbanized areas. For example, for the soils of Petropavlovsk-Kamchatsky, the average Zc was 13.1 ± 3.0, the PERI was 63 ± 15 [41], and the soils of Vladimir were characterized by an acceptable total pollution index (Zc < 5) [42]. Urban soils of Vladivostok districts corresponded to the acceptable pollution level by the total pollution index Zc, and the potential environmental risk was low [43]. The average values of the PERI, NPI, and Zc for Moscow soils showed moderate risks and low pollution [14]. In Northwest China cities, the level of comprehensive ecological risk of heavy metals was low, but there were moderate and above risks at individual sites. The heavy metals were from natural and anthropogenic sources: Cu and Ni were attributed to industrial sources, mainly from local mining and metal processing; Cr was mainly due to industrial production such as coal combustion; Pb and Zn were mainly due to transportation sources; and Ti, V, Mn, Fe, and As were from natural and agricultural sources [44]. Heavy metal concentrations in soil in Harbin, a major industrial center in Northwest China, were primarily determined by industry, road traffic, and coal heating. Mn (432–534 mg/kg) and Zn (97–107 mg/kg) contents were comparable to those found in Norilsk, while Cu, Ni, Cd, Co, and Fe contents were significantly lower [45]. This further confirms the high level of soil pollution in Norilsk and the crucial role of non-ferrous metallurgy as the primary source of these metals.
Urbanized areas of the Arctic are characterized by different anthropogenic and technogenic loads, which are determined by the population size, the level of industrialization, and the time of impact. The PLI calculated for the soils of the abandoned Russian mining village of Pyramiden (Svalbard archipelago) ranged from 0.49 to 1.01, which characterizes them as unpolluted or slightly polluted [46]. Murmansk soils are classified as unpolluted with a total pollution index Zc = 1–8 [12]. For urban soils in the City of St. John’s, Newfoundland and Labrador (Canada), the four metals had the highest pollution factor, with particularly notable pollution indices (PI) for Cd—5, Cu—3, Pb—8.6, and Zn—3.7. The clusters of metals and their spatial concentration patterns indicated that weathered paint, traffic emissions, and coal burning were important sources of metals in sampled soils [47]. But urban soils in the Arctic can have a high metal content. In Monchegorsk (Murmansk region, Russia), which is also impacted by the copper–nickel smelter, soils contain 640–1364 mg/kg of Ni, up to 474 mg/kg of Cu, 35 mg/kg of Co, 31 mg/kg of Pb, and 345 mg/kg of Mn, with the highest concentrations in the recreation zones. The total pollution index (Zc) for Monchegorsk was 17–37 [48]. The level of soil pollution in Salekhard, also located in the Arctic zone, is comparable to the Central District of Norilsk and Talnakh (PLI = 1.83–3.80) [35].
Now, for many Arctic regions, there are still insufficient data on the heavy metal content of urban soils. But urban soil pollution in the Arctic can impact more than just the quality of life and human health. The behavior of heavy metals under permafrost thawing conditions also remains undetermined. In Arctic soils, As, Cr, Hg, Ni, and Pb prevail in the discontinuous and sporadic permafrost zone, emphasizing the need for a better understanding of how permafrost thaw alters the mobility and cycling of heavy metals near human settlements [49].
Among the districts of Norilsk, the most polluted, both in terms of the average content of heavy metals and of the pollution indices, were the Central District and Talnakh, while Kayerkan and Oganer were less polluted. Previously, a zone of maximum pollution included Oganer, and a zone of moderate pollution included Talnakh [30]. In another study, the highest level of Ni and Cu (priority soil pollutants) was found in Oganer and Talnakh—more than 200 mg/kg [50], which differs from our result, where Oganer was characterized by lower pollution among other districts of Norilsk. Our data reflect the actual state of urban soil quality. Oganer’s low soil pollution is explained by its distance from the main sources of pollution and the prevailing wind direction (southeastern and south winds) [51,52], which reduces the aerotechnogenic impact of industries located west and northwest of Oganer. The low level of hydrocarbon soil pollution is due to the low traffic within the settlement.
The spatial distribution of heavy metals in different functional zones has been shown for many cities [15,53]. Significant differences were observed in Zc between residential, undeveloped, and industrial zones in Murmansk [12]. However, under large industrial pollutant emissions, which extend over tens of kilometers, the difference between functional zones is not obvious. The absence of significant statistical differences between soils of functional zones was shown in a study of urbanized areas of Yamal [35]. In that condition, to a greater extent, the level of soil pollution is determined by the distance from industrial sources of pollution and the time of technogenic impact, which we observed in Norilsk.
The maximum heavy metal pollution was in the soils of the protection zone of enterprises in Talnakh and in the soil of the industrial zones in the Central District due to both the proximity to the industrial sources of pollution and the absence of any landscaping in these areas. Using the example of the Central District of Norilsk, it was shown that landscaping of the territory plays a role in reducing the total content of heavy metals. However, without proper soil design, optimized soil physical and chemical properties, and planting of resistant species, such improvements will be temporary.
The main source of soil pollution with oil products in the Central District, with a high population and intense vehicle traffic, is apparently vehicles, as is typical in many cities [54,55,56]. In the smaller districts of Norilsk (Talnakh and Kayerkan), the impact of transport infrastructure is less. The soils of Oganer are practically not polluted with oil products due to the remoteness from industrial enterprises, low population density, and the age of the settlement.
The main negative soil factors in the Central District are the low root zone thickness, high rock content, construction and household waste, low water retention capacity, and nitrogen deficiency. The risks caused by high concentrations of heavy metals in the soils of the Central District can be compensated for by the physicochemical properties of the soils (organic matter content, soil acidity, oxidation-reduction conditions, and soil density), which prevent the metals from being available. Soils with higher organic matter content generally promote the redistribution of heavy metals from more available (e.g., exchangeable and acid-soluble) to less available fractions (notably the organic matter-bound fraction), which reduces their potential uptake by plants and associated risks to human health. Lower pH tends to keep metals in more available forms, whereas higher pH promotes metal immobilization. Fine-textured (clayey) soils and those with high CEC bind metals more tightly, reducing availability [57,58,59]. Organic carbon and nitrogen play a significant role in the fixing of Ni, Co, and Pb [48]. The district is dominated by soils with a neutral and slightly alkaline environment and a loamy granulometric composition. These soils have a high potential to accumulate heavy metals. For sandy loam soils, acidic soils, and soils with a low content of organic matter, high concentrations of heavy metals are associated with risks for both plants and human health. Although our study did not establish a correlation between organic matter content and heavy metals, soils in the Central District may be more resistant to pollution by both heavy metals and petroleum products.
Just as in the Central District, the main soil-limiting factors in Oganer are unfavorable physical properties (high density, high rock content, and low water-holding capacity), nitrogen deficiency, and acidic reactions. However, the high content of organic matter also makes the soils in this district more stable and favorable for plants.
The soils of Talnakh have more favorable characteristics. Due to the high content of organic matter and the neutral pH, the existing level of pollution does not pose a risk to the plants despite the high content of heavy metals.
Kayerkan has the poorest soil resources of the studied areas. The area is dominated by sandy and sandy loam soils with low organic matter and nitrogen and high anthropogenic load (littering and compaction). The soils of Kayerkan may be more toxic, despite the lower concentration of heavy metals than in the Central District and Talnakh. Kayerkan’s soils are potentially more vulnerable to pollution, requiring increased attention to preserving the quality of urban soils in this area.
Since the limiting effect of pollution on plants depends on the capacity of soils to accumulate metals and retain them in inaccessible forms, the main measures to improve soil quality should be aimed at increasing the organic matter content, providing a neutral pH, high cation exchange capacity, and decreasing density, which will reduce the toxic load on plants.
Existing green infrastructure requires renovation, including mandatory soil improvement and the planting of resistant species. In highly toxic conditions, the topsoil must be replaced, following the recommendations below.
To improve soil properties in Norilsk, it is recommended to remove stones and debris from the surface; add peat, hydrogels, and other materials with high water-holding capacity to a depth of 10–15 cm; add organic substrates with a balanced carbon–nitrogen ratio (e.g., a mixture of peat, sand, loam, and sawdust); and use nitrogen fertilizers. For new or reconstructed objects, it is recommended to create soil structures with a thickness of at least 50 cm, consisting of the following layers: (1) a layer of neutral multicomponent soil with a balanced carbon–nitrogen ratio to provide nutrients; (2) a layer of finely dispersed material (peat and hydrogel) to retain available moisture; and (3) a layer of coarsely dispersed material (sand and gravel mixture) to interrupt capillary transport. Such structures will ensure a sufficient amount of nutrients and available moisture in the root zone and will also act as geochemical barriers for pollutants.
To reduce hydrocarbon content in the soil, it is advisable to stimulate the local microbiota by adding nutrients (primarily nitrogen) and improving aeration conditions (reducing soil density). These measures are consistent with general recommendations for improving the quality of urban soils in Norilsk and do not require additional actions.
In general, for the rational use of soil resources in the region, a system of management, monitoring, and control of soil quality is needed. The creation of a soil bank, including a regional register of soil resources, will ensure long-term planning for their use.
5. Conclusions
The assessment of the urban soil pollution in Norilsk using pollution indices has, for the first time, allowed us to spatially characterize the pollution of the urban agglomeration of a large industrial center in the Arctic zone. In general, all urban soils in Norilsk had a medium, high, or very high environmental risk and are classified as polluted. Norilsk districts are characterized by different levels of pollution, which are determined by their geographical location relative to the main industrial sources of pollution, as well as historical features of the development of the territory. Soils are polluted to a greater extent in the Central District and Talnakh.
Airborne pollutants from large industrial enterprises are the main cause of heavy metal soil pollution in the Norilsk agglomeration. The contribution of other sources of pollution, typical of various functional areas of the city (motor transport, waste, etc.), is not accounted for. At the same time, the PITPH is determined by the location of areas near roads, which is typical for the Central District with a high population and intensive traffic.
The indices of heavy metal pollution in the recreational and residential areas of the Central District and Talnakh were a little lower than in other functional zones, which created more favorable conditions for residents amid the high level of pollution. Soil pollution levels are also affected by landscaping, including replacing the topsoil and planting, which can reduce the content of heavy metals in the soil. However, without correct soil design, optimizing the soil’s physical and chemical properties, and planting resistant species, such improvements will be temporary. Therefore, along with the efforts taken by Norilsk Nickel to modernize production and reduce emissions, it is necessary to improve the quality of urban soils.
The soils of Talnakh and Oganer have more favorable physical and chemical properties and stability. This allows for reducing the toxic impact on plants in these areas. The soils of the Central District and Kayerkan are more vulnerable to pollution and require increased attention.
Despite all the difficulties of such works (arctic conditions, permafrost soils, high pollution levels, and a deficit of clean soils), it is necessary to develop methods of creating soil structures and select plants for the formation of sustainable urban green infrastructure, which will reduce the negative impact on residents and improve the environmental rating of Norilsk. The results of this study can also be used to create a city development strategy and choose locations for future residential areas and the direction of remediation and landscaping to improve soil quality in the polluted areas, taking into account the pollution level and the assimilation potential of the soils.
Supplementary Materials
The following supporting information can be downloaded at: https://www.mdpi.com/article/10.3390/land14112199/s1, Figure S1: Content of Pb (A), TPH (B), and PITPH pollution index (C) in urban soils of Central District; Figure S2: Content of Zn (A), Ni (B), and PLI pollution index (C) in urban soils of Talnakh. Table S1: Characteristics of Norilsk districts; Table S2: Agrochemical characteristics of urban soils; Table S3: Spearman’s correlations between soil physicochemical properties and pollutant contents of Norilsk soils.
Author Contributions
Conceptualization, V.M., V.V. and N.K.; methodology, V.M., V.V., N.K. and Y.S.; validation, V.M. and Y.S.; formal analysis, V.M. and Y.S.; investigation, V.V. and M.K.; resources, V.V. and M.K.; data curation, V.M. and Y.S.; writing—original draft preparation, V.M.; writing—review and editing, V.M., V.V. and M.K.; visualization, V.M. and V.V.; supervision, V.V. and M.K.; project administration, V.V. and M.K.; funding acquisition, V.V. and M.K. All authors have read and agreed to the published version of the manuscript.
Funding
The fieldwork was supported by the Ministry of Science and Higher Education of the Russian Federation, project FSSF-2024-0023; the analysis of soil samples, processing, and interpretation of the results were supported by the RUDN University Scientific Projects Grant System (Project 202414-2-000).
Data Availability Statement
The original contributions presented in this study are included in the article/Supplementary Material. Further inquiries can be directed to the corresponding author.
Acknowledgments
The authors thank the staff of the soil-ecological laboratory at RUDN University and the Center for Smart Technologies for Sustainable Development of the Urban Environment in the Global Changes RUDN University.
Conflicts of Interest
The authors declare no conflicts of interest.
References
- World Urbanization Prospects 2018; Highlights; United Nations: New York, NY, USA, 2019; Available online: https://www.un.org/development/desa/pd/sites/www.un.org.development.desa.pd/files/files/documents/2020/Feb/un_2018_wup_highlights.pdf (accessed on 30 October 2025).
- Vasenev, V.I.; Romzaykina, O.N.; Hajiaghaeva, R.A.; Van Oudenhoven, A.P.E. The Ecological Functions and Ecosystem Services of Urban and Technogenic Soils: From Theory to Practice (A Review). Eurasian Soil Sci. 2018, 51, 1119–1132. [Google Scholar] [CrossRef]
- Blanchart, A.; Séré, G.; Cherel, J.; Warot, G.; Stas, M.; Noël, C.J.; Morel, J.-L.; Schwartz, C. Towards an operational methodology to optimize ecosystem services provided by urban soils. Landsc. Urban Plan. 2018, 176, 1–9. [Google Scholar] [CrossRef]
- Suleymanov, A.; Nizamutdinov, T.; Morgun, E.; Abakumov, E. Assessing and geostatistical mapping of metal contamination in the polar arable plot (Yamal-Nenets Autonomous District, Russia). Int. J. Environ. Sci. Technol. 2024, 21, 2575–2584. [Google Scholar] [CrossRef]
- Dvornikov, Y.; Slukovskaya, M.; Gurinov, A.; Vasenev, V. Soil type and content of macro-elements determine hotspots of Cu and Ni accumulation in soils of subarctic industrial barren: Inference from a cascade machine learning. Environ. Pollut. 2025, 377, 126457. [Google Scholar] [CrossRef]
- Korneykova, M.V.; Saltan, N.V.; Kozlova, E.V.; Vasileva, M.N.; Davydova, P.D.; Berezhnoi, E.D. Microbial communities of urban soils in the Norilsk agglomeration. Rudn. J. Agron. Anim. Ind. 2024, 19, 431–446. [Google Scholar] [CrossRef]
- Li, G.; Sun, G.X.; Ren, Y.; Luo, X.S.; Zhu, Y.G. Urban soil and human health: A review. Eur. J. Soil Sci. 2018, 69, 196–215. [Google Scholar] [CrossRef]
- Jan, A.T.; Azam, M.; Siddiqui, K.; Ali, A.; Choi, I.; Haq, Q.M. Heavy Metals and Human Health: Mechanistic Insight into Toxicity and Counter Defense System of Antioxidants. Int. J. Mol. Sci. 2015, 16, 29592–29630. [Google Scholar] [CrossRef]
- Slukovskii, Z.I.; Guzeva, A.V.; Dauvalter, V.A. Rare earth elements in surface lake sediments of Russian arctic: Natural and potential anthropogenic impact to their accumulation. Appl. Geochem. 2022, 142, 105325. [Google Scholar] [CrossRef]
- Shestakova, E.; Fedorova, I.; Loktev, R.; Kolesnikov, R.; Alexeeva, N. Urban water use in the arctic and its effects on freshwater resources. In Proceedings of the International Multidisciplinary Scientific GeoConference SGEM, Vienna, Austria, 3–6 December 2018; pp. 517–524. [Google Scholar]
- Korneykova, M.; Vasenev, V.; Kozlova, E.; Soshina, A.; Nikitin, D.; Dolgikh, A.; Saltan, N. Microbial communities of urban and industrial polluted soils in the Russian Arctic. Geoderma Reg. 2024, 39, e00890. [Google Scholar] [CrossRef]
- Polyakov, V.; Petrova, A.; Kozlov, A.; Abakumov, E. Toxicological state and chemical properties of soils in urbanized ecosystems of Murmansk. Czech Polar Rep. 2018, 8, 230–242. [Google Scholar] [CrossRef]
- Bogorodskaya, A.V.; Ponomareva, T.V.; Shapchenkova, O.A.; Shishikin, A.S. Assessment of the state of soil microbial cenoses in the forest-tundra zone under conditions of airborne industrial pollution. Eurasian Soil Sci. 2012, 45, 521–531. [Google Scholar] [CrossRef]
- Romzaykina, O.N.; Vasenev, V.I.; Paltseva, A.; Kuzyakov, Y.V.; Neaman, A.; Dovletyarova, E.A. Assessing and mapping urban soils as geochemical barriers for contamination by heavy metal(loid)s in Moscow megapolis. J. Environ. Qual. 2020, 50, 22–37. [Google Scholar] [CrossRef]
- Alharbi, B.H.; Pasha, M.J.; Al-Shamsi, M.A.S. Influence of Different Urban Structures on Metal Contamination in Two Metropolitan Cities. Sci. Rep. 2019, 9, 4920. [Google Scholar] [CrossRef]
- Ikpe, N.C.; Kenechukwu, E.C.; Ikechukwu, E.C. Use of integrated pollution indices in assessing heavy metals pollution in soils of three auto mechanic villages in Abuja. Afr. J. Environ. Sci. Technol. 2018, 12, 370–376. [Google Scholar] [CrossRef]
- Gąsiorek, M.; Kowalska, J.; Mazurek, R.; Pająk, M. Comprehensive assessment of heavy metal pollution in topsoil of historical urban park on an example of the Planty Park in Krakow (Poland). Chemosphere 2017, 179, 148–158. [Google Scholar] [CrossRef] [PubMed]
- Karim, Z.; Qureshi, B.A.; Mumtaz, M. Geochemical baseline determination and pollution assessment of heavy metals in urban soils of Karachi, Pakistan. Ecol. Indic. 2015, 48, 358–364. [Google Scholar] [CrossRef]
- Gong, Q.; Deng, J.; Xiang, Y.; Wang, Q.; Yang, L. Calculating pollution indices by heavy metals in ecological geochemistry assessment and a case study in parks of Beijing. J. China Univ. Geosci. 2008, 19, 230–241. [Google Scholar] [CrossRef]
- Cai, L.; Yan, L.; Ni, J.; Wang, C. Assessment of Ecological Vulnerability under Oil Spill Stress. Sustainability 2015, 7, 13073–13084. [Google Scholar] [CrossRef]
- Vega, A.S.; Arce, G.; Rivera, J.I.; Acevedo, S.E.; Reyes-Paecke, S.; Bonilla, C.A.; Pastén, P. A comparative study of soil metal concentrations in Chilean urban parks using four pollution indexes. Appl. Geochem. 2022, 141, 105230. [Google Scholar] [CrossRef]
- Paderin, P.G.; Demenyuk, A.F.; Nazarov, D.V.; Chekanov, V.I.; Smelova, L.V.; Petrov, V.V.; Ladygina, M.Y.; Sergeeva, A.A. State Geological Map of the Russian Federation. Scale 1:1,000,000 Norilsk Series. Sheet R-45, 3rd ed.; VSEGEI Map Factory: St. Petersburg, Russia, 2016; 366p. [Google Scholar]
- Vodyanitskii, Y.N.; Plekhanova, I.O.; Prokopovich, E.V.; Savichev, A.T. Soil contamination with emissions of non-ferrous metallurgical plants. Eurasian Soil Sci. 2011, 44, 217–226. [Google Scholar] [CrossRef]
- Pollution of Soils of the Russian Federation with Industrial Toxicants in 2023; Yearbook; FGBU NPO Typhoon: Obninsk, Russia, 2024; Available online: https://www.rpatyphoon.ru/upload/medialibrary/ezhegodniki/tpp/tpp_2023.pdf (accessed on 25 August 2025).
- Tirskikh, S.A.; Vashestyuk, Y.G.; Shtelmakh, S.I.; Ryashchenko, T.G. Comprehensive studies of technogenic soils of a construction site in the Norilsk region (experience of integrating production and scientific results). Bull. IrSTU 2014, 2, 80–85. Available online: https://journals.istu.edu/vestnik_irgtu/journals/2014/02/articles/12?view=0 (accessed on 25 August 2025).
- Yurkevich, N.V.; Eltsov, I.G.; Gureev, V.N.; Mazov, N.A.; Yurkevich, N.V.; Edelev, A.V. Technogenic effect on the environment in the Russian Arctic by the example of the Norilsk industrial area. Bull. Tomsk. Polytech. Univ. Geo Assets Eng. 2021, 332, 230–249. [Google Scholar] [CrossRef]
- Albanese, S.; Cicchella, D.; Lima, A.; De Vivo, B. Urban geochemical mapping. In Environmental Geochemistry; De Vivo, B., Belkin, H.E., Lima, A., Eds.; Elsevier: Amsterdam, The Netherlands, 2008; pp. 153–174. [Google Scholar]
- Wong, C.S.C.; Li, X.; Thornton, I. Urban environmental geochemistry of trace metals. Environ. Pollut. 2006, 142, 1–16. [Google Scholar] [CrossRef] [PubMed]
- Lapteva, E.M.; Kaverin, D.A.; Pastukhov, A.V.; Shamrikova, E.V.; Kholopov, Y.V. Landscape-biogeographical aspects of heavy metals accumulation and migration in Arctic and Subarctic soils of the European Northeast. Bull. Komi Sci. Cent. RAS 2015, 3, 47–60. [Google Scholar]
- Ponomareva, T.V.; Trefilova, O.V.; Bogorodskaya, A.V.; Shapchenkova, O.A. Ecological and functional estimation of soil condition within the zone of technogenic impact of Norilsk industrial complex. Contemp. Probl. Ecol. 2014, 7, 694–700. [Google Scholar] [CrossRef]
- Syso, A.I.; Sokolov, D.A.; Siromlya, T.I.; Ermolov, Y.V.; Makhatkov, I.D. Anthropogenic Transformation of Soil Properties in Taimyr Landscapes. Eurasian Soil Sci. 2022, 55, 541–555. [Google Scholar] [CrossRef]
- Myazin, V. Hydrocarbon Content and Enzymatic Activity of Urban Soils in Kola Subarctic. In Proceedings of the Smart and Sustainable Cities 2022. Smart and Sustainable Urban Ecosystems: Challenges and Solutions; Springer: Cham, Switzerland, 2022. [Google Scholar] [CrossRef]
- Gennadiev, A.N.; Pikovskii, Y.I.; Tsibart, A.S.; Smirnova, M.A. Hydrocarbons in soils: Origin, composition, and behavior (Review). Eurasian Soil Sci. 2015, 48, 1076–1089. [Google Scholar] [CrossRef]
- Babaev, M.P.; Ismailov, N.M.; Nadzhafova, S.I.; Keiserukhskaya, F.S.; Orudzheva, N.I. Approaches to Determining Maximum Permissible Concentrations of Oil and Oil Products for Different Soil Types on the Basis of the Assimilation Potential (by the Example of Azerbaijan Soils). Eurasian Soil Sci. 2020, 53, 1629–1634. [Google Scholar] [CrossRef]
- Nizamutdinov, T.I.; Morgun, E.; Pechkin, A.S.; Kostecki, J.; Greinert, A.; Abakumov, E. Differentiation of Trace Metal Contamination Level between Different Urban Functional Zones in Permafrost Affected Soils (the Example of Several Cities in the Yamal Region, Russian Arctic). Minerals 2021, 11, 668. [Google Scholar] [CrossRef]
- Vodyanitskii, Y.N. Natural and technogenic compounds of heavy metals in soils. Eurasian Soil Sci. 2014, 47, 255–265. [Google Scholar] [CrossRef]
- Cotter-Howells, J.D.; Caporn, S. Remediation of contaminated soils by formation of heavy metal phosphates. Appl. Geochem. 1996, 11, 335–342. [Google Scholar] [CrossRef]
- Gorokhova, S.M.; Vasiliev, A.A. Ecological and geochemical assessment of the chemical elements content and features of their spatial distribution in ferruginous nodules of soils of the Middle Urals. AgroEcoInfo 2022, 1, 14. [Google Scholar] [CrossRef]
- Timofeeva, Y.O. The role of iron-manganese nodules in the accumulation of heavy metals in soils of areas adjacent to the highway. Bull. Irkutsk. State Univ. Ser. Biology. Ecol. 2013, 3, 95–99. [Google Scholar]
- Bhattacharya, S.; Guha, G.; Chattopadhyay, D.; Mukhopadhyay, A.; Dasgupta, P.K.; Sengupta, M.S.; Ghosh, U.C. Co-deposition and distribution of arsenic and oxidizable organic carbon in the sedimentary basin of West Bengal, India. J. Anal. Sci. Technol. 2013, 4, 11. [Google Scholar] [CrossRef]
- Avdoshchenko, V.G.; Klimova, A.V. Assessment of soil heavy metal pollution in Petropavlovsk-Kamchatsky (Kamchatka territory). Bull. KamchatSTU 2022, 61, 65–81. [Google Scholar] [CrossRef]
- Chugay, N.V.; Kurochkin, I.N.; Kulagina, E.Y. Pollution Assessment of Urban Land by Heavy Metals in the City of Vladimir. Ecol. Ind. Russ. 2022, 26, 67–71. [Google Scholar] [CrossRef]
- Zharikova, E.A.; Klyshevskaya, S.V.; Popova, A.D. Features of the Chemical Composition of Soils and Bottom Sediments of Valley of the Vtoraya Rechka River (Vladivostok, Russia). Bull. Irkutsk. State University. Ser. Earth Sci. 2024, 50, 48–62. [Google Scholar] [CrossRef]
- Luo, H.; Wang, Q.; Guan, Q.; Ma, Y.; Ni, F.; Yang, E.; Zhang, J. Heavy metal pollution levels, source apportionment and risk assessment in dust storms in key cities in Northwest China. J. Hazard. Mater. 2022, 422, 126878. [Google Scholar] [CrossRef]
- Zhang, Y.; Meng, S.D.; Wang, J.X.; Hu, J.; Wu, H.; Kolodeznikov, V.E.; Zakharov, E.S.; Danilova, S.N.; Tang, Z.-H.; Zhang, Z.-F. Assessment of heavy metal contamination and health risks in urban road dust and green belt soil: A case study in Harbin City, China. Environ. Geochem. Health 2025, 47, 302. [Google Scholar] [CrossRef]
- Krajcarová, L.; Novotný, K.; Chattová, B.; Elster, J. Elemental analysis of soils and Salix polaris in the town of Pyramiden and its surroundings (Svalbard). Environ. Sci. Pollut. Res. 2016, 23, 10124–10137. [Google Scholar] [CrossRef]
- Foley, R.; Bell, T.; Liverman, D.G. Urban Geochemical Hazard Mapping of St. John’s, Newfoundland, Canada. Atl. Geol. 2011, 47, 138–157. [Google Scholar] [CrossRef]
- Saltan, N.; Slukovskaya, M.; Mikhaylova, I.; Zarov, E.; Skripnikov, P.; Gorbov, S.; Khvostova, A.; Drogobuzhskaya, S.; Shirokaya, A.; Kremenetskaya, I. Assessment of Soil Heavy Metal Pollution by Land Use Zones in Small Towns of the Industrialized Arctic Region, Russia. In Advanced Technologies for Sustainable Development of Urban Green Infrastructure. SSC 2020; Vasenev, V., Ed.; Springer Geography; Springer: Cham, Switzerland, 2021. [Google Scholar] [CrossRef]
- Perryman, C.R.; Wirsing, J.; Bennett, K.A.; Brennick, O.; Perry, A.L.; Williamson, N.; Ernakovich, J.G. Heavy metals in the Arctic: Distribution and enrichment of five metals in Alaskan soils. PLoS ONE 2020, 15, e0233297. [Google Scholar] [CrossRef] [PubMed]
- Efremova, T.T.; Efremov, S.P. Ecological and geochemical assessment of heavy metals and sulfur of hilly peatbogs in southern Taimyr. Sib. Ecol. J. 2014, 6, 965–974. [Google Scholar] [CrossRef]
- Wind Speed and Statistics (1966–2025), Taimyr (Dolgano-Nenets) Autonomous Okrug, Norilsk. Available online: https://world-weather.ru/archive/russia/norilsk (accessed on 30 October 2025).
- Modeled Historical Climate and Weather Data for Norilsk. Available online: https://www.meteoblue.com/ru/пoгoда/historyclimate/climatemodelled/Нoрильск_Рoссия_1497337 (accessed on 21 October 2025).
- Wan, D.; Han, Z.; Yang, J.; Yang, G.; Liu, X. Heavy Metal Pollution in Settled Dust Associated with Different Urban Functional Areas in a Heavily Air-Polluted City in North China. Int. J. Environ. Res. Public Health 2016, 13, 1119. [Google Scholar] [CrossRef] [PubMed]
- Khalilzade, V.J.; Bayram, K.K.; Bagirova, C.Z. Assessment of urban soil pollution by biomonitoring methods (by the example of Sumgayit city). Geogr. Environ. Living Syst. 2020, 3, 142–153. [Google Scholar] [CrossRef]
- Adeniyi, A.A.; Owoade, O.J. Total petroleum hydrocarbons and trace heavy metals in roadside soils along the Lagos-Badagry expressway, Nigeria. Environ. Monit. Assess. 2010, 167, 625–630. [Google Scholar] [CrossRef]
- Quiñonez-Plaza, A.; Wakida, F.T.; Temores-Peña, J.; Rodriguez-Mendivil, D.D.; Garcia-Flores, E.; Pastrana-Corral, M.A.; Melendez-Lopez, S.G. Total petroleum hydrocarbons and heavy metals in road-deposited sediments in Tijuana, Mexico. J. Soils Sediments 2017, 17, 2873–2886. [Google Scholar] [CrossRef]
- Lu, A.; Zhang, S.; Shan, X.-Q. Time effect on the fractionation of heavy metals in soils. Geoderma 2005, 125, 225–234. [Google Scholar] [CrossRef]
- Awad, M.; Liu, Z.; Skalicky, M.; Dessoky, E.S.; Brestic, M.; Mbarki, S.; Rastogi, A.; El Sabagh, A. Fractionation of Heavy Metals in Multi-Contaminated Soil Treated with Biochar Using the Sequential Extraction Procedure. Biomolecules 2021, 11, 448. [Google Scholar] [CrossRef]
- Clemente, R.; Escolar, A.; Bernal, M.P. Heavy metals fractionation and organic matter mineralisation in contaminated calcareous soil amended with organic materials. Bioresour. Technol. 2006, 97, 1894–1901. [Google Scholar] [CrossRef]
Disclaimer/Publisher’s Note: The statements, opinions and data contained in all publications are solely those of the individual author(s) and contributor(s) and not of MDPI and/or the editor(s). MDPI and/or the editor(s) disclaim responsibility for any injury to people or property resulting from any ideas, methods, instructions or products referred to in the content. |
© 2025 by the authors. Licensee MDPI, Basel, Switzerland. This article is an open access article distributed under the terms and conditions of the Creative Commons Attribution (CC BY) license (https://creativecommons.org/licenses/by/4.0/).