Abstract
The interactive coupling mechanism between ecosystem service value (ESV) and urbanization has emerged as a critical research focus in ecological security and sustainable development. This study quantifies the ESV of prefecture-level cities by leveraging remote sensing data and socioeconomic statistics from the Yangtze River Delta (YRD) region spanning 2006—2020. It constructs a multidimensional evaluation index system for urbanization. We systematically assess both systems’ spatiotemporal evolution and interactions by employing entropy weighting, comprehensive indexing, and coupling coordination models. Furthermore, Geo-detectors and Geographical and Temporal Weighted Regression (GTWR) models are applied to identify driving factors influencing their coordinated development. Key findings include (1) the total amount of ESV in the YRD exhibits a fluctuating decline, primarily due to a steady increase in urbanization levels; (2) the coordination degree between ESV and urbanization demonstrates phased growth, transitioning to a “basic coordination” stage post-2009; (3) spatially, coordination patterns follow a “core–periphery” hierarchy, marked by radial diffusion and gradient disparities, with most cities being of the ESV-guidance type; (4) GTWR analysis reveals spatiotemporal heterogeneity in driving factors, ranked by intensity as Normalized Difference Vegetation Index (NDVI) > Economic density (ECON) > Degree of openness (OPEN) > Scientific and technological level (TECH) > Industrial structure upgrading index (ISUI) > Government investment efforts (GOV). This study advances methodological frameworks for analyzing ecosystem–urbanization interactions in metropolitan regions, while offering empirical support for ecological planning, dynamic redline adjustments, and territorial spatial optimization in the YRD, particularly within the Ecological Green Integrated Development Demonstration Zone.
1. Introduction
Ecosystem service value (ESV) is conceptualized as all the benefits that natural ecosystems provide for human well-being [1]. As a core indicator for measuring ecosystem services and ecological security, ESV can be quantitatively assessed through the economic value of various environmental services, such as food production, water purification, climate regulation, and cultural recreation [2,3]. The relationship between ESV and human activities, particularly urbanization, is dynamic and interdependent. On one hand, urbanization relies on ecosystem services to support its development, consuming resources and land, which can weaken ecosystem functions. On the other hand, the degradation of these services may trigger ecological problems, thereby forcing the urbanization system to adjust its development mode through environmental restoration and policy regulation [4,5].
Over the long term, developing countries, represented by China, have undergone unprecedented rapid urbanization. The Yangtze River Delta Urban Agglomeration (YRDUA), one of China’s most dynamic regions, exemplifies the tension between economic agglomeration and ecological stress. High-intensity land development has led to a substantial reduction in ecological space, while industrial convergence has exacerbated environmental pollution and ecosystem fragmentation [2,6]. According to the Millennium Ecosystem Assessment, approximately 60% of global ecosystems are consistently damaged [7], underscoring the global significance of clarifying the dynamic coupling mechanism between ESV and urbanization for regional sustainable development, especially under the “dual-carbon” strategy and high-quality development goals [8,9].
The Intergovernmental Platform on Biodiversity and Ecosystem Services (IPBES)points out that the contradiction between the urbanization process and ecosystem services has become a significant issue affecting ecological security worldwide [10]. Currently, relevant studies at home and abroad primarily focus on assessing ESV in a single city or region [4], and there is a lack of research on the multi-scale spatial and temporal synergistic evolution patterns of megacity clusters such as the Yangtze River Delta (YRD). Regarding the mutual coupling between ESV and urbanization levels, most previous studies have primarily focused on the impact of urbanization on ESV [11]. However, there is still a lack of systematic research on the spatiotemporal dynamic evolution and driving factors of the coupling and coordination mechanism between the two. Especially in the context of a “dual-carbon” strategy and high-quality development, clarifying the interaction mechanism between ESV and urbanization is of great practical significance in solving the bottleneck of regional ecological–urban synergistic development.
The relationship between ecosystems and urbanization is intricate, and scholars both at home and abroad have gradually incorporated the interactive effects of ESV and the urbanization process into their research scope. Early studies used the equivalent factor method [4,12] to assess ESV. They analyzed its correlation with a single urbanization rate through linear regression, in addition to the binary Moran index [9] and the value gain/loss method [13]. With the progress of spatial analysis technology, scholars began to focus on the spatial heterogeneity characteristics of the two. For example, the spatial autocorrelation model was introduced in the study of the Yellow River Basin [11], which revealed the spatial agglomeration law of ESV and urbanization. The sustainable development of urban agglomerations of forest land includes economic, social, and ecological systems [14]. At the same time, scholars have proposed and applied an indicator system to assess the quality of development in urban agglomerations [15]. Coupled coordination has become a focal point of global change research, which can be used to analyze the impacts of human activities on ecosystems by quantifying the coordination trend in measuring interactions between systems [16].
Scholars have recently researched the coupled coordination mechanism of urbanization and ecosystem services. At present, in terms of research scale, it has developed from individual city cases, including watersheds [13,17] and cities [12,18], to the study of urban agglomeration systems [19,20,21]. Secondly, spatiotemporal dynamic analysis has become mainstream. Wang Xia et al. revealed the path of Beijing–Tianjin–Hebei collaborative development through a three-stage division [22], and Huang Lingling used nighttime lighting data to construct an analytical framework of the Yangtze River Economic Belt in a long time series [23]. Following this, there were some remarkable innovations in research methods. Using the coupling coordination degree model as a fundamental tool [22,24] as well as the introduction of various models, such as geo-probe [25,26], the PVAR model [27], and the GWR model [28,29], deepens the study of influencing factors. The latest progress is reflected in the composite application of spatial measurement models [30] and barrier degree models [31]. Finally, in terms of the identification of influencing factors, previous research focused on single factors, such as land urbanization [32], with a recent shift toward the perspective of multi-factor system integration, including the following: (1) the natural–economic dual-factor drive [26]; (2) policy response mechanisms [33]; and (3) the technology transfer mediation effect [31]. However, the time-lag effect of policy intervention and the behavioral feedback of market players require further exploration.
Existing studies mainly focus on a single dimension, such as the impact of land use change on ecological services or the measurement of urbanization level, and the coupled and coordinated evolution of the “urbanization–ecosystem” composite system is not sufficiently characterized, which is manifested in the following specific features: (1) weak temporal and spatial dynamic analysis: most studies are based on static cross-sectional data [34], which makes it challenging to reveal the long-term evolution trend of the coupling coordination degree and spatial heterogeneity; (2) inadequate analysis of the influencing mechanism: there is a lack of quantitative discussion on how the interaction between natural and socio-economic factors influences the degree of coupling coordination; and (3) insufficient policy articulation [35]: the existing results are challenging with regard to supporting the formulation of the strategy of regional differentiation of ecological compensation and spatial optimization of the national territory.
To address these gaps, this study takes 26 cities in the YRD, using data spanning 2006 to 2020. Our research objectives are threefold: (1) to quantify the ESV and construct a multidimensional urbanization index system for the region; (2) to analyze the spatiotemporal evolution of the coupling coordination degree (CCD) between ESV and urbanization; and (3) to identify the key driving factors and their spatiotemporal heterogeneity using the Geographically and Temporally Weighted Regression (GTWR) model. Theoretically, this study integrates landscape ecology and spatial econometrics to open up new ideas for urban agglomeration sustainability research. Practically, the findings are expected to provide a scientific basis for ecological planning, dynamic redline adjustments, and territorial spatial optimization in the YRD, thereby contributing to the achievement of Sustainable Development Goals (SDGs), particularly Goal 11 (Sustainable Cities and Communities).
2. Materials and Methods
2.1. Study Area
The YRDUA, spanning 30°20′ N–32°30′ N and 119°24′ E–122°30′ E at the Yangtze River estuary, represents one of China’s most dynamic and rapidly urbanizing regions. Formally designated in the Yangtze River Delta City Cluster Development Plan (State Council, 2016), the agglomeration comprises 26 core cities (Figure 1), with Shanghai as its hub, nine cities in Jiangsu Province, eight cities in Zhejiang Province, and eight cities in Anhui Province. Encompassing 211,700 km2, the region is characterized by a mosaic of forest and aquatic ecosystems, reflecting the intricate ecological interplay typical of estuarine delta systems.
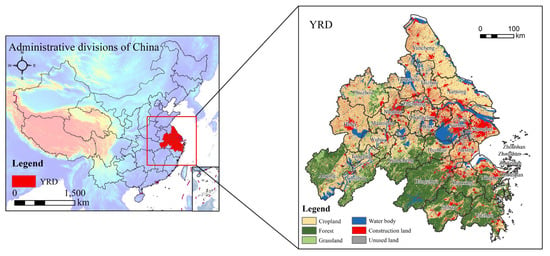
Figure 1.
Location map of the Yangtze River Delta Urban Agglomeration.
By 2020, the region had attained an urbanization rate of 75.01%, with its urban built-up area expanding at an annual rate of 2.3% over the preceding decade [36]. This rapid urban growth resulted in a 15% reduction in wetland coverage between 2000 and 2020 [37], alongside marked declines in biodiversity and heightened ecological degradation. As an important intersection of the “Belt and Road” initiative and the Yangtze River Economic Belt development strategy, the contradiction between expanding construction land and protecting the ecological environment is becoming increasingly apparent in the context of accelerated urbanization. Addressing this imbalance requires urgent research into strategies that harmonize urban development with environmental sustainability. This study aims to advance such efforts by examining the coupling mechanisms between ESV and urbanization dynamics, providing a theoretical and practical framework for promoting sustainable development in estuarine delta urban agglomerations.
2.2. Data Sources
The land use data for 2006–2020 were obtained from the China Land Cover Dataset (CLCD, created by Yang, J. and Huang, X., Wuhan University, Wuhan, China; https://zenodo.org/records/8176941 [accessed on 2 October 2023]). This dataset was derived from Landsat imagery with a spatial resolution of 30 m, and its overall accuracy and Kappa coefficient were validated as 80% and 0.75, respectively, through random sampling. To align with the Chinese Land Use Classification Standard (GB/T21010–2017), we reclassified the original CLCD subcategories into six major types, cropland, forest, grassland, water, built-up land, and unused land, using ArcGIS 10.8 spatial analysis tools. The Digital Elevation Model (DEM) data were acquired from the European Space Agency (ESA, Paris, France) via the Copernicus Data Space Ecosystem (https://dataspace.copernicus.eu/ [accessed on 4 October 2023]) with a spatial resolution of 30 m × 30 m, supporting terrain-related analyses.
Data on urban nighttime light and the Normalized Difference Vegetation Index (NDVI) were obtained using methods described in the relevant literature [24].
Urban agglomeration socioeconomic and food production data were obtained from the China Urban Statistical Yearbook (2021) [38] and municipal statistical bulletins published by the 26 constituent cities. To address inconsistencies in data availability, missing values were compensated for through linear interpolation, ensuring temporal continuity and dataset integrity.
2.3. Research Methodology
In the context of rapid urbanization, the ecological environment serves as the core foundation supporting the realization of high-quality development in cities while also delimiting the spatial constraints that shape the boundaries of resource development and utilization. This bidirectional relationship—marked by interdependence, with both mutual benefits and conflicts [39,40]—reflects the dynamic interdependence between urban expansion and ecological integrity. To elucidate these complex coupling mechanisms, this study systematically delineates their interactions (Figure 2), offering insights into how urbanization trajectories can align with ecosystem resilience.
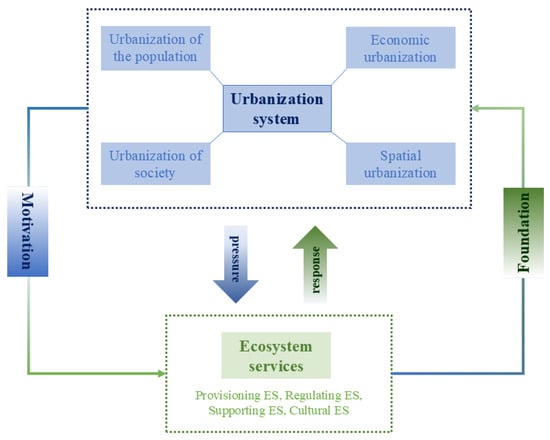
Figure 2.
Coupled ecosystem services and urbanization system interaction map.
Firstly, the demand for and impacts of urbanization on ecosystems mean that the agglomeration of the population will intensify the consumption of resources and directly rely on and affect supply services such as water resources and food as well as regulation services such as climate regulation and pollution purification [41]. The demand for and impact of economic urbanization also lies in the intensification of the demand for resources through the development of industries, which may weaken the ecosystem’s support services and at the same time relies on the landscape value and other cultural system services to promote the diversification of the urban economy; at the spatial level, the acceleration of urbanization and the expansion of land development area have compressed the natural ecological space and reduced the overall service capacity of the ecosystem. Secondly, ecosystem services have a constraining and feedback effect on urbanization, and the degradation of these services may trigger a series of ecological problems, such as natural disasters and resource shortages, thereby forcing the urbanization system to respond and adjust its urban development mode, including environmental restoration and policy regulation. The value of ecosystem services can be quantified through an assessment mechanism that guides urbanization, enabling the balance between efficiency and sustainability in spatial planning and resource utilization, thereby forming a dynamic feedback loop. In summary, urbanization relies on ecosystem services to support its development and, at the same time, changes the type and intensity of services through regulation and intervention; ecosystem services limit or promote the urbanization process through the maximum thresholds of each function, and the two form a dynamic coupling and interaction of “demand–supply–feedback–regulation”.
2.3.1. Valuation of Ecosystem Services
According to the land resource characteristics and research objectives of the YRDUA, the land ecosystems were classified based on the six reclassified land use types (Section 2.2) into six categories: cropland, grassland, forestland, water bodies, unutilized land, and built-up land. While the ESV equivalent factor method of Costanza was utilized [2,3], this method does not apply to the actual situation in China; on this basis, the correction factor was finally obtained by combining the ESV equivalent factor table specified by Costanza and the region of China, as modified according to Xie et al.
(i) In this paper, we refer to the method of Xie et al. [42,43,44] and take one-seventh of the average economic value of grain production in the YRDUA as the equivalent coefficient of ESV. The calculation formula is
where is the economic value of grain per unit of farmland (CNY/hm2); P is the average purchase price of grain (CNY); Q is the grain output (kilograms); and S is the sown area of grain (hm2). According to the weekly national grain variety purchase price data, the average value of grain was calculated to be 2.62 CNY/kg, and the economic value of cropland per unit area was estimated to be 2187.22 CNY/ha.
(ii) The ecosystem service value coefficient (VC) was determined by integrating land use data with regionally calibrated unit area values [45], where the economic value of cropland per unit area served as the baseline reference. While traditional methodologies often assigned a null ESV coefficient to built-up land, contemporary studies recognize that urbanized areas retain partial ecological functions, including cultural and recreational services [45]. The VC for each land use category was computed using the following formula:
where represents the ESV per unit equivalent for land use type i and service category j, and Ea denotes the economic value per unit area of cropland.
(iii) Annual ESVs for the YRD were computed by integrating land use data with the derived unit area VC coefficients:
Here, corresponds to the value coefficient for land use type i, and denotes the spatial extent (area) of that land type.
2.3.2. Methodology for Evaluating the Level of Comprehensive Urbanization Development
This study constructed an urbanization development index system for the YRDUA (Table 1). The indicator system reflects the comprehensive urban development level of the YRDUA across the four dimensions of population, economy, society, and spatial urbanization utilizing 20 fundamental indicators [46,47,48,49]. The specific calculation steps of each indicator refer to the existing studies [50,51], and the exact steps are as follows:

Table 1.
Comprehensive evaluation index system for urbanization.
The entropy value method is an objective weighting technique grounded in information theory, where entropy quantifies the disorder or uncertainty inherent in data. This approach assigns weights to indicators based on their relative information content: higher entropy values correspond to greater informational utility and thus larger weights, signifying a disproportionate influence of the indicator on the system. By analyzing the variability of observed indicator values, the method minimizes subjectivity in weight determination, ensuring robustness in multi-indicator assessments. For computational details, refer to the methodology outlined in [52,53].
2.3.3. Coupled Coordination Degree (CCD) Models
To assess the coupling and coordination dynamics between ESV and urbanization in the YRD, this study employs a physics-derived coupling coefficient model [54] in conjunction with a complementary coordination degree framework [55]. The coupling coefficient quantifies the interaction intensity between ESV (f(x)) and urbanization (g(x)) as follows:
where C (ranging 0–1) represents the coupling degree; higher values indicate stronger interdependence. However, there are limitations to relying only on the coupling coefficient to judge the level of development of the two couplings, e.g., the coupling judgement is skewed due to the differences between ESV and the level of urbanization itself. To address this, the coordination degree (D) was calculated as the geometric mean of C and T:
where T denotes the comprehensive coordination index, with f(x) and g(x) representing ESV and urbanization scores, respectively. D (coupling coordination degree) increases with improved alignment between ecological and urban systems. Weights λ and μ reflect the relative contributions of ESV and urbanization; this study assigns equal weights (λ = μ = 0.5) based on the following:
(1) The United Nations Sustainable Development Goals (SDGs) advocate balanced ecological–economic development;
(2) The YRD’s ecological sensitivity necessitates synergy between conservation and growth;
(3) Prior evidence [48] suggests the minimal impact of weight variability on coordination trends.
There is no uniform specification for the classification of coupling coordination degree. The classification of coupling coordination degree in this study is determined based on relevant research results [53]. The interval between each coordination degree is 0.2 (Table 2 and Table 3).

Table 2.
Division of coupling between ESV and urbanization level.

Table 3.
Intervals for dividing the degree of coupling coordination.
2.3.4. Geo-Detectors
The Geo-detectors method is a statistical tool designed to determine drivers of spatial heterogeneity. In this study, we applied its factor detection module to isolate the key determinants influencing the CCD between ESV and urbanization [26,56]. Central to this approach is the q-statistic, which measures the explanatory power of individual factors on observed spatial patterns, with values ranging from 0 to 1. A higher q-statistic signifies a more substantial contribution of the factor to spatial variation in coupling coordination, thereby highlighting its role in shaping system synergies. The q-statistic is calculated as
where and denote the sample size and variance of the coupling coordination degree within subregion h, N and represent the total sample size and variance across the study area, and L is the number of subregions stratified by the influencing factor.
Drawing on existing studies and taking into account the availability of data and information as well as the characteristics of the YRDUA, this study selects 10 influencing factors from four aspects: the natural environment [48,57], economic structure [26], policy-driven [35], and technical efficiency [58] (Table 4).

Table 4.
Indicators of coupled coordination impact factors.
2.3.5. Classification of Regional Development Typologies
To further explore the coordination relationship between ESV and urbanization, we classified the cities into three development types based on the rank difference between their ESV and comprehensive urbanization level [52,53]. The specific classification criteria are as follows:
ESV-guidance type: The rank order of ESV exceeds that of the urbanization level by more than 2. Urbanization-guidance type: The rank order of the urbanization level exceeds that of ESV by more than 2. Balanced development type: The absolute difference between the two ranks does not exceed 2.
This typology helps to identify whether a city’s development is more reliant on its ecological foundation or its urban socioeconomic development or whether it is in a state of relative balance between the two.
2.3.6. Geographically and Temporally Weighted Regression Models
Traditional geographically weighted regression (GWR) models often neglect temporal dynamics, focusing solely on spatial heterogeneity [39]. To address this limitation, the geographically and temporally weighted regression (GTWR) model incorporates a temporal dimension, allowing for a robust analysis of spatial and temporal variability in driving factors. This advancement enables more precise identification of spatiotemporal patterns and the dynamic evolution in ESV–urbanization interactions. The GTWR model’s mathematical formulation [16] is expressed as
where is the CCD between ESV and urbanization for city . , are the spatio-temporal coordinates of city . is the spatiotemporally varying intercept. corresponds to the regression coefficient of the j-th explanatory variable at city i; is the observed value of variable j for city . is the number of explanatory variables, and is the random error term. All impact factors were rasterized in ArcGIS 10.8, and a unified projected coordinate system was established [59].
3. Results
3.1. Spatiotemporal Evolution of ESV and Urbanization
3.1.1. Temporal Evolution of ESV: Fluctuating Downward Trend in Total Volume
According to existing studies on urbanization stages [60], the period 1996–2011 is defined as the rapid development stage, emphasizing the role of an externally oriented economy (e.g., industrial upgrading of the Pearl River Delta and the Yangtze River Delta) in promoting urbanization and pointing out that after 2012, it enters the “new urbanization stage”, focusing on quality improvement as the core. During the study period, urbanization in the YRDUA was accelerated by the export-oriented economy (1992–2011) and a mature period of high-quality urbanization (2012–present).
Temporally, the ESV showed a “fluctuating downward” trend, which stands in sharp contrast to the steady upward trend of comprehensive urbanization (Figure 3, Figure 4). This decline was particularly notable during the period of rapid, export-oriented urbanization before 2011—a pattern that suggests a significant trade-off between urban expansion and ecosystem integrity in the early stage of development. Existing studies indicate that two factors are key drivers of this ESV reduction: first, industrial isomerization, which is driven by competition among cities within the agglomeration; second, the spread of inefficient land use, triggered by the expanded commuting radii of metropolitan areas [61].
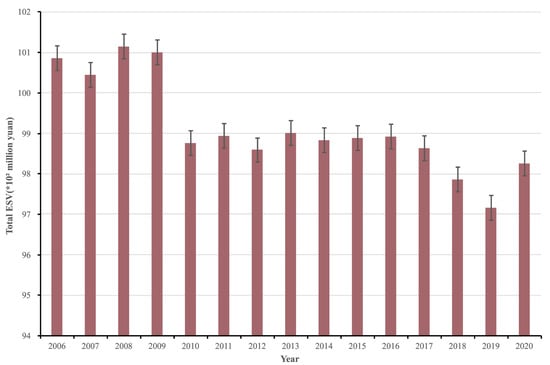
Figure 3.
Trend direction of ESV in the YRDUA, 2006–2020.
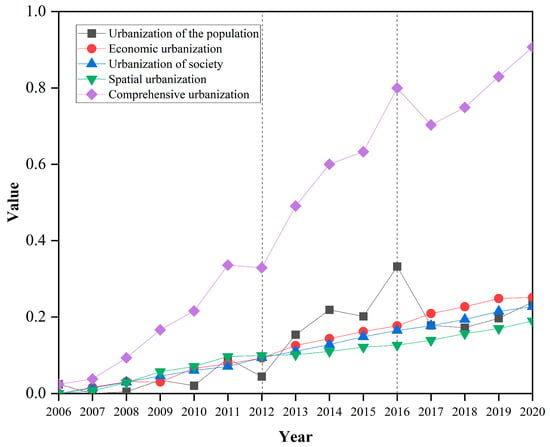
Figure 4.
Comprehensive level of urbanization development in YRDUA, 2006–2020.
3.1.2. Spatial Pattern: Stable Gradients with Localized Changes
Spatially, ESV distribution remained relatively stable but exhibited a clear core-periphery gradient (Figure 5). Cities with abundant forest and water resources (e.g., Suzhou, Hangzhou) consistently formed high-value cores, while cities with limited ecological land and smaller areas (e.g., Zhoushan, Maanshan) constituted low-value areas. A general, albeit gradual, decline in ESV was observed across most prefectural cities from 2006 to 2020.
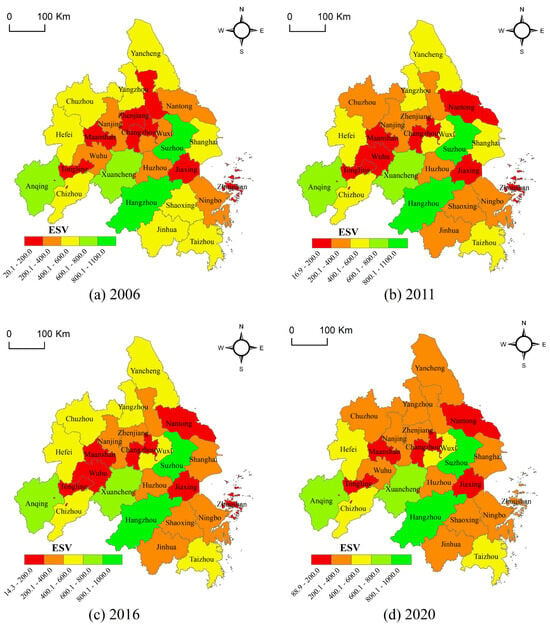
Figure 5.
Characteristics of ESV spatial distribution in YRDUA, 2006–2020.
By 2020, the YRDUA’s ESV distribution showed incremental adjustments rather than systemic shifts. However, most prefectural cities experienced gradual declines in ESV peaks, which can be attributed to urban expansion and the conversion of natural landscapes to built-up land. The deceleration in ESV loss from 2016 to 2020 likely reflects two factors: (1) moderated urban sprawl following peak construction phases and (2) enhanced ecosystem conservation efforts under China’s Five-in-One Strategic Layout, though policy impacts were delayed due to implementation lags.
3.1.3. Temporal Evolution of the Level of Urbanization: Overall Continuing Upward Trend
The entropy value and linear weighting methods are used to obtain comprehensive indicators of urban development. From the weight of the indicators of urbanization level, the results show that population urbanization has a greater impact on the extensive level of urbanization. We can divide existing studies into stages of urbanization [61]. This paper divides the urban development of the YRDUA into I. Rapid urbanization driven by economic system reform and export-oriented economy (2006–2011) and II. new urbanization focusing on quality enhancement, with the core being the “urbanization of people” (2012–2020). As can be seen from the chronological evolution characteristics (Figure 4), the comprehensive development level of urbanization in the YRDUA has shown a significant stage-by-stage leap, especially in stage II, where the growth rate is more pronounced, which is probably due to the effect of national policies, such as the policy direction of “narrowing the gap between the urbanization rate of the resident population and the urbanization rate of the household population by two percentage points” put forward by the “National New Type of Urbanization Plan (2014–2020)”. This “quantitative and qualitative transformation” verifies the applicability of Northam’s urbanization S-curve [62] theory at the regional scale.
The comprehensive urbanization level exhibited significant phased growth (Figure 5), a trend that aligns with national policy cycles. Notably, a temporary slowdown around 2012 coincided with post-financial-crisis recovery and adjustments to domestic macroeconomic regulations [63,64]. In contrast, the peak in 2016 corresponded to the launch of the 13th Five-Year Plan and supply-side reforms, which boosted industrial upgrading and regional integration [62,65].
3.1.4. Urbanization Spatial Structure: A Strengthening Core–Periphery Hierarchy
The comprehensive urbanization level of the YRDUA exhibited pronounced spatial heterogeneity and path-dependent trajectories between 2006 and 2020 (Figure 6). In 2006, Shanghai emerged as the primary core, dominating the agglomeration due to its advanced economic output and high urban population density. A sub-core cluster—comprising Nanjing, Wuxi, Suzhou, and Hangzhou—demonstrated strong urban development foundations and elevated urbanization levels. Nine intermediate cities, including Ningbo and Hefei, occupied a transitional gradient with moderate urbanization progress. Conversely, peripheral cities such as Nantong and Anqing lagged significantly, constrained by weaker economic foundations, infrastructure gaps, and low scores across economic, demographic, spatial, and social dimensions, collectively forming peripheral zones with lagging urbanization.
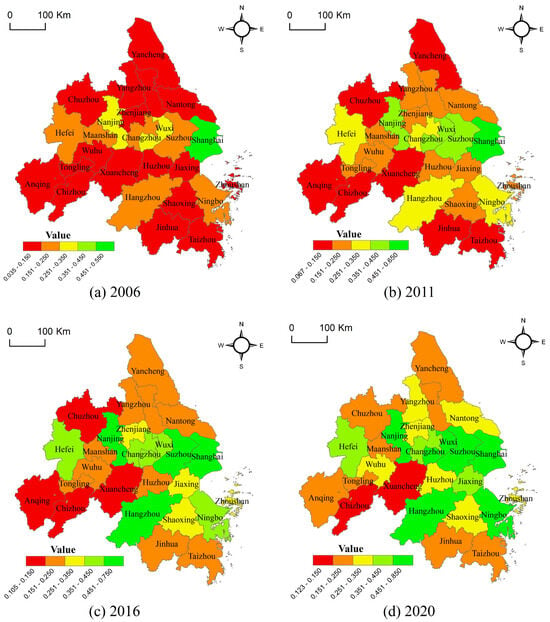
Figure 6.
Evolutionary pattern of urbanization levels in the YRDUA.
By 2020, the urbanization pattern in the city cluster exhibited remarkable characteristics of “gradient enhancement and local leap”. First of all, the polarization effect of the core area continues, with Shanghai and Nanjing’s comprehensive score being 0.82 and 0.69, respectively, while Suzhou, Hangzhou, and other five cities form a high level of agglomeration at 0.44–0.56; second, the middle gradient of the town shows differentiation, with Changzhou and Jiaxing relying on industrial upgrading and transformation of urban development to improve the position order. The edge cities, such as Chuzhou and Xuancheng, have caught up by undertaking industrial transfer; however, due to the limitations of their spatial location, Yancheng and Chizhou are still cities with a lower level of development.
3.2. Spatio-Temporal Characterization of Coupled Coordination Degrees
3.2.1. Temporal Process: Phased Growth from Incoordination to Coordination
Between 2006 and 2020, the coupling relationship between ESV and urbanization in the YRD transitioned from low-level mismatches to synergistic alignment (Table 5). The coordination degree of these systems exhibited fluctuating yet sustained growth (Figure 7), signaling progressive harmonization of ecological and urban development. A pivotal shift occurred in 2011, marking the transition from a period of dissonance (2006–2011) to one of coordination (2011–2020). During the initial phase, interactions between ESV and urbanization were limited, resulting in suboptimal coordination. Following 2011, rapid urbanization coincided with increased ecological stewardship, fostering stronger bidirectional interactions.

Table 5.
Classification of coupling harmonization levels, 2006–2020.
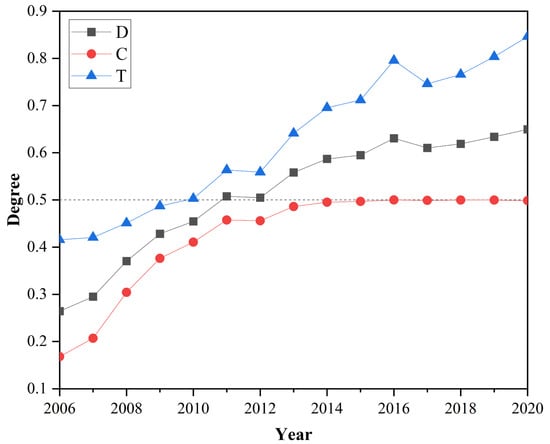
Figure 7.
Evolution of coupling harmonization trends, 2006–2020.
Quantitatively, the coupling degree rose from 0.168 (2006) to 0.4987 (2020), averaging 2.2% annual growth, while the coupling coordination degree increased from 0.2642 to 0.6497 (2.57% yearly growth). These trends reflect deepening systemic interdependence, where urbanization has increasingly integrated ecological preservation into its trajectory. The steady upward trajectory of both metrics underscores the YRD’s progress in reconciling economic expansion with ecosystem resilience, likely driven by policy measures prioritizing balanced development.
We analyzed the CCD across the region to assess the spatiotemporal interactions between ESV and urbanization in the YRDUA. Figure 8 illustrates the CCD distribution via box plots, where the white boxes denote median values and scattered points represent individual cities (n = 26). During the study period, median CCD values fluctuated moderately (0.31–0.38), with an overall trend of slow increase. According to the classification in Table 3, the YRDUA transitioned through three distinct phases: (1) moderate incoordination (0.2 ≤ CCD < 0.4) from 2006 to 2008, (2) basic coordination (0.4 ≤ CCD < 0.6) from 2009 to 2015, and (3) moderate coordination (0.6 ≤ CCD < 0.8) from 2016 to 2020. This trajectory signifies a critical shift from fragmented development to integrated ecological–urban interactions, underscoring the region’s capacity to reconcile economic growth with ecosystem resilience.
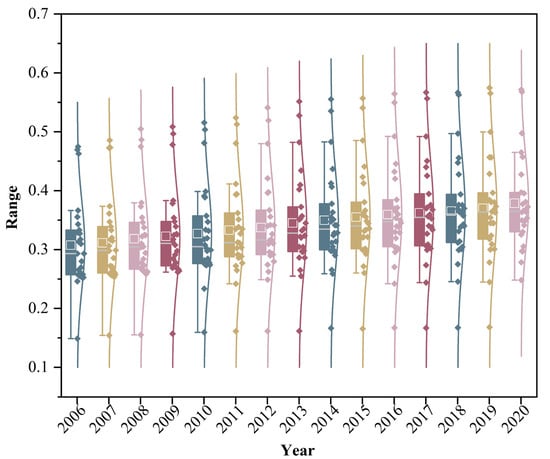
Figure 8.
Box plot of coupling coordination degree of YRDUA, 2006–2020, where white squares indicate mean values and scattered points show data from the 26 cities. Colors are for visual distinction only.
Looking specifically at the trend of the coupling coordination degree of each city over time (Figure 9), it can be seen that although the coupling coordination degree of each town has been on the rise, the trajectory of development is characterized by an “inverted U-shape”—accelerated growth in the early stage followed by a gradual slowdown. Among them, the coupling coordination degree of Suzhou continues to be in the leading position, while the coupling coordination degree of Zhoushan, although always at a low level, also maintains a growing trend.
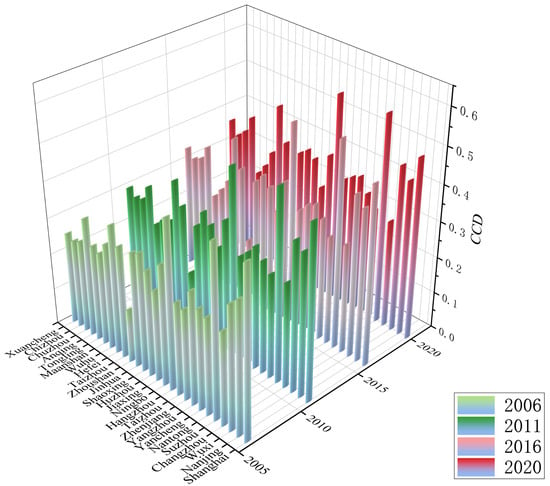
Figure 9.
Trend of coupling coordination among cities in YRD, 2006–2020.
3.2.2. Spatial Pattern: Radial Diffusion from Core Cities
Using CCD results from 2006, 2011, 2016, and 2020, spatial pattern dynamics were mapped via ArcGIS 10.8 (Figure 10). The results reveal a pronounced spatial autocorrelation, characterized by a radiation-diffusion pattern centered on core cities as growth poles. Over the study period, regional disparities narrowed, with the overall CCD transitioning from a dysfunctional state (2006) to one of primary coordination (2020).
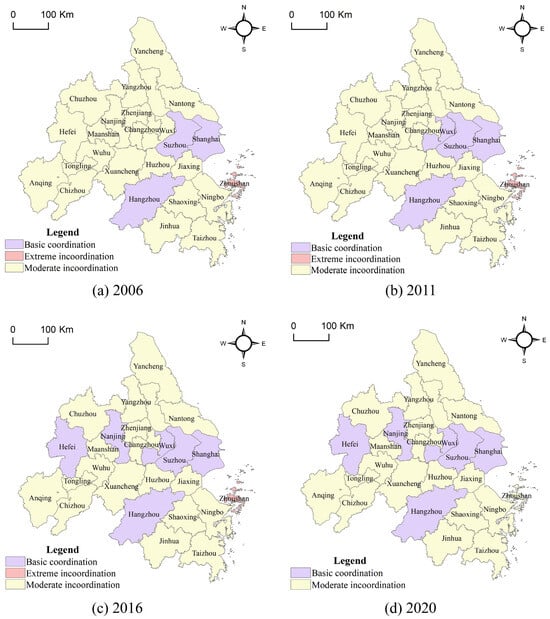
Figure 10.
Evolution of the type of coupled coordination in the YRDUA, 2006–2020.
Spatially, the CCD evolved from a fragmented pattern with isolated coordination cores (e.g., Suzhou, Shanghai, Hangzhou in 2006) to a more integrated, multi-nodal structure radiating along major development axes by 2020 (Figure 10). Despite an overall improvement in regional balance, a persistent core–periphery disparity remained evident.
From 2006 to 2020, the mean ESV–urbanization level coupling coordination degree of the YRDUA increased from 0.31 to 0.38 (+22.6%). The standard deviation expanded from 0.073 to 0.078 (+7%), decreasing the coefficient of variation from 23.60% to 20.60% (with a speed of decline of 12.7%), indicating that the relative equilibrium of regional coordination degree improved. However, the core–edge absolute gap still needs attention. Overall, the balance between ESV and urbanization level coupling coordination degree in the YRDUA is improving.
3.2.3. Types of Development: Predominantly ESV Guidance, with a Growing Number of Balanced Development Types
From 2006 to 2011 (Figure 11a,b), the balanced development type expanded from a single city (Shaoxing) to four cities (Hefei, Suzhou, Taizhou, and Shaoxing), with the new cities mainly located in central Anhui (Hefei) and Jiangsu’s riverside areas (Suzhou and Taizhou); the number of ESV-advance type cities shrunk from 11 to 10, with the spatial distribution maintaining a stable pattern of industrial cities along the Wanjiang River (Anqing, Chuzhou, Chizhou, and Xuancheng) and in the northern part of Zhejiang (Hangzhou, Huzhou, Jinhua, and Taizhou), with only Suzhou exiting the category. The number of urbanization-advanced cities decreased from 14 to 12 and continued to cluster in three major regions: industrial towns along the Yangtze River (Wuhu, Maanshan, Tongling), coastal hub cities (Shanghai, Ningbo, Jiaxing, Zhoushan), and economic powerhouses in southern Jiangsu (Nanjing, Wuxi, Changzhou, Nantong, Zhenjiang).
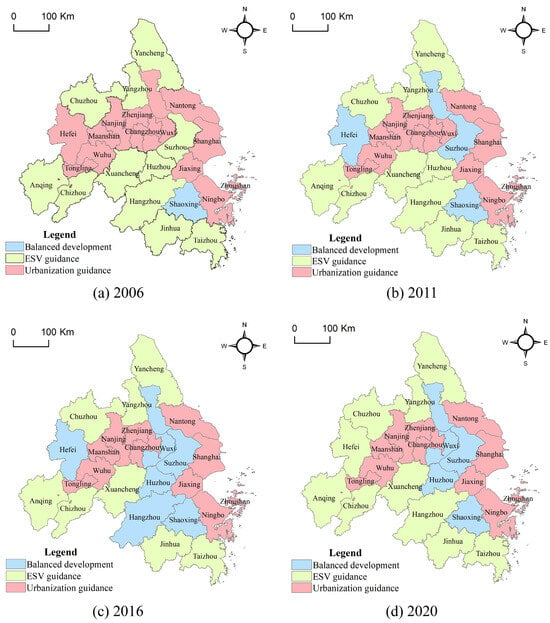
Figure 11.
Spatial and temporal distribution of development types, 2006–2020.
In 2016–2020 (Figure 11d), the pattern was reconfigured, with the number of balanced development-type cities being adjusted back to four cities (Wuxi, Taizhou, Huzhou, Shaoxing), concentrated around the Taihu Lake; the ESV pioneer type added the city of Hefei, and the number of cities rose to 10 cities, forming a “double-zone” pattern, the western part of which includes the ecological barrier zone formed by Hefei, Anqing, Chuzhou, Chizhou, and Xuancheng, and the eastern part of which consists of coastal ecological zones formed by Yancheng, Yangzhou, Hangzhou, Jinhua, and Taizhou. The number of urbanization pioneer-type cities stabilized at 12, and Suzhou returned to this type, forming a “core–periphery” structure, in which the core area includes the Shanghai–Nanjing–Hebei metropolitan area (covering Shanghai, Changzhou, Nanjing, and Suzhou) and the periphery consists of industrial cities along the river and coast, such as Wuhu, Ma’anshan, Tongling, Nantong, and Ningbo.
Overall, the evolution of the coupling relationship types in the spatial pattern of differentiation show the following patterns: (1) Ecologically sensitive areas (hills in western Anhui Province, mountainous regions in west Zhejiang Province) continue to maintain the ESV guidance advantage. (2) The urbanization process is located within the radius of the regional central cities (Shanghai, Nanjing, Hangzhou) and (3) along the main transportation arteries (Shanghai–Nanjing, Hu–Hangzhou, and He–Ning axes) to form a coordinated urban agglomeration zone and along the principal axes of regional development (Shanghai–Nanjing, Shanghai–Hangzhou, and He–Ning transportation corridors) to create a balanced development type of urban belt agglomeration. This is manifested in the joint effect of transportation accessibility and factor mobility; the axis cities are more likely to achieve a dynamic balance between ecological protection and urban construction. (4) Policy-oriented regions (such as the YRD Eco-Green Integration Demonstration Zone) show the characteristics of the development type of conversion; the implementation of national strategies in the region shows a coordinated evolution type of gradient. The gradient conversion characteristics of the coordinated evolution type reflect the directional regulation role of policy intervention in the ESV–urbanization coupling relationship.
3.3. Driving Mechanisms Revealed by GTWR Model
3.3.1. Dominant Factors of Coupling Coordination
The results of single-factor detection by Geo-detectors show (Table 6) that the p-values of the six factors NDVI, ECON, OPEN, ISUI, GOV, and TECH are all less than 0.01, indicating that their effects on the coupling coordination are statistically significant.

Table 6.
Detection results of factors influencing the coupling coordination degree.
Grounded in the human–land interaction relationship, six key factors were selected as explanatory variables to investigate their influence on the CCD between ESV and urbanization. The GTWR model was employed, with CCD as the dependent variable. Before modeling, variables were standardized using Z-score normalization, and multicollinearity was assessed via SPSS 27. Variance Inflation Factor (VIF) values for all variables remained below 10, confirming the absence of severe multicollinearity and validating their inclusion in the model.
The GTWR model was calibrated using ArcGIS 10.8′s spatiotemporal regression module, with automated bandwidth optimization and a spatiotemporal distance parameter ratio of one [16]. As shown in Table 7, the model demonstrated strong performance, including a residual sum of squares (RSS) of 0.0990 and a residual standard error (δ) of 0.0159, where lower values indicate superior model fit. The Akaike Information Criterion corrected (AICC) value (−1845.1) and adjusted R2 (0.9635) collectively confirm the GTWR model’s efficacy in spatially and temporally quantifying the drivers of CCD dynamics.

Table 7.
Correlation coefficients for the GTWR model.
3.3.2. Temporal Heterogeneity of Driving Factors
The GTWR model was applied to quantify the drivers influencing the degree of coupling coordination between ESV and urbanization in the YRDUA. Regression coefficients for each factor were analyzed, and their annual evolution from 2006 to 2020 is illustrated in Figure 12.
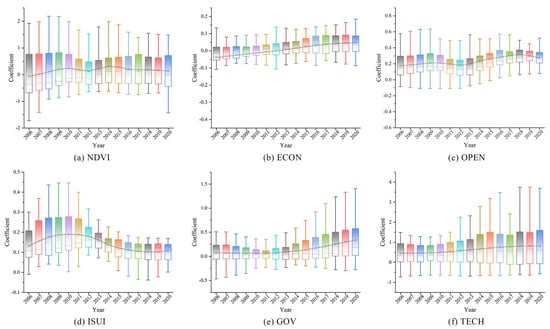
Figure 12.
Trends in regression coefficients of impact factors, 2006–2012.
The regression coefficients for the vegetation coverage (NDVI) exhibited a fluctuating yet statistically significant upward trajectory (Figure 12a). While NDVI impacts were predominantly negative before 2010, the mean coefficient shifted to a positive correlation thereafter, with a marked acceleration post-2015. This trend aligns with urbanization policies that emphasize ecological balance, such as the “park city” initiative, which mitigates ecological losses from land expansion through increased green space. Concurrently, large-scale afforestation (e.g., farmland-to-forest conversion) and wetland restoration projects further enhanced vegetation coverage, amplifying NDVI’s positive contribution to CCD.
The impact coefficient of ECON (Figure 12b) is negative in the first period from 2006 to 2012 and then turns to a stable positive impact in the second period from 2013 to 2020. In the early years, the increase in economic density relied on the consumption of land resources. High-density economic activities encroach on ecological space, negatively impacting the ESV. In contrast, promoting the “new urbanization” strategy after 2013 has led to a decrease in energy consumption per unit of GDP. The synergistic enhancement of economic agglomeration and eco-efficiency has increased, which in turn has enhanced the positive effect on the degree of coupling and coordination.
The impact coefficient of OPEN (Figure 12c) generally had a positive effect, and the average value of the impact coefficient exhibited a trough in 2012, followed by fluctuations and a rise. Still, the degree of agglomeration was strengthened (the box becomes narrower). Before 2012, there was a period of dividend opening that occurred after the country joined the WTO. The introduction of foreign investment led to the development of cleaner production and the creation of jobs, and the positive effect of coupling and coordination significantly increased. Later, the “Belt and Road” initiative, proposed in 2013, promoted foreign investment.
Although the ISUI (Figure 12d) impact coefficient was a positive driver, the intensity of its effect has gradually decreased since its peak in 2011. This is closely related to the process of industrial transformation and upgrading in the YRD; as the share of the tertiary industry breaks through the critical value, its marginal contribution to coupling coordination tends to level off.
The impact coefficient of GOV (Figure 12e) generally shows a positive driving effect, with the regression coefficient decreasing slightly and then accelerating. This may be attributed to the fact that in the early stage, the fiscal bias was towards infrastructure expansion, such as the construction of development zones, which exacerbated ecological fragmentation; in the later stage, it shifted towards ecological compensation and pollution control, such as the promotion of the “river chief system”, and the effectiveness of the government’s investment was enhanced.
The mean value of the impact coefficient of TECH (Figure 12f) shows a general upward trend, but the overall dispersion is increasing. This means that the role of science and technology in the degree of coordination and coupling is gradually increasing. However, the differences between regions continue to widen. The technology agglomeration effect continues to intensify in core cities, while insufficient investment in science and technology in peripheral cities contributes to greater regional disparities.
The results show that the coupling of ESV and urbanization in the YRD is stage-dependent: among them, the “negative to positive” NDVI of the natural elements provides the basic ecological security for the coupling. In the economic structure, ECON, OPEN, and ISUI reflect the transformation of the economic growth mode from scale expansion to quality improvement, GOV demonstrates the shift of the government’s role from growth-led to governance synergy, and TECH indicates that the overall scientific and technological inputs continue to increase the role of coupling coordination.
3.3.3. Spatial Heterogeneity of Driving Factors
To assess the spatial heterogeneity of the drivers of the degree of coupled coordination between ESV and urbanization, the mean regression coefficients of the influencing factors were analyzed using the natural breaks method, with zero as the critical threshold (Figure 13).
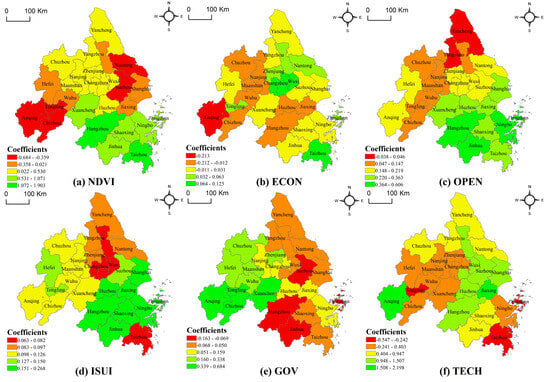
Figure 13.
Spatial heterogeneity of regression coefficients of influencing factors, 2006–2020.
The regression coefficients for vegetation coverage (NDVI) exhibited a distinct southeast-to-inland spatial gradient. Coastal regions displayed higher NDVI values, correlating with more substantial positive impacts on CCD. These areas likely enhance system synergy through two mechanisms: (1) ecological barrier functions (e.g., coastal wetlands mitigating urbanization-driven fragmentation) and (2) resource provisioning (e.g., forested zones supporting biodiversity and carbon sequestration). In contrast, inland regions—characterized by ecological fragility and limited environmental carrying capacity—showed weaker or harmful NDVI–CCD relationships, suggesting that vegetation cover alone cannot offset stressors such as soil erosion or water scarcity, thereby creating a bottleneck for coordinated development.
From the perspective of socio-economic factors, ECON primarily affects areas of the YRD that are concentrated in the urban belt of the Wanjiang River, with a positive impact on the central part of Jiangsu Province and Taizhou and Zhoushan in Zhejiang Province. This indicates that the influence of ECON on coupling coordination primarily presents a “double-edged” sword effect; excessive economic agglomeration may exacerbate pressure on resources and the environment, while an intensive and efficient economic layout can effectively promote coupling coordination. The OPEN coefficient presents a gradient distribution pattern of high in the south and low in the north. The cities with the lowest impact coefficients are Yancheng and Yangzhou, indicating that OPEN significantly restricts the factor flow and coordinated development of the northern cities and that they need to break through the bottleneck of openness through the mechanisms of FTZ linkage and cross-border cooperation. ISUI has a positive effect on all the cities in the region. The low values are found in Taizhou, Zhejiang Province, and the central cities of Jiangsu Province, suggesting that there is a need to optimize and adjust the industrial structure in these regions as a means of promoting the coupled and coordinated development of various factors and achieving overall efficiency.
There is a marginal effect of GOV decays, with the positive effect gradually weakening from southern Anhui to northern Jiangsu and northern Zhejiang. This indicates that the marginal benefits of policy interventions exhibit spatial attenuation, with southern Anhui significantly improving coupling coordination through ecological compensation, cross-provincial collaboration, and other policies. At the same time, northern Jiangsu and northern Zhejiang are constrained by the lack of policy suitability or weakened implementation, which prevents them from fully realizing the benefits of policies.
TECH has a positive effect on Suzhou, Hangzhou, and Shanghai as the peak core spreads to the periphery as well as a negative impact on cities in central Anhui, central Suzhou, coastal Taizhou, and Zhoushan in Zhejiang. This suggests that core cities drive neighboring regions through knowledge innovation spillovers. Still, the peripheral cities play a negative role in the coordination of coupling due to the loss of innovation factors and the lag in industrial acceptance.
4. Discussion
As a pioneering region in China’s reform and opening-up policies, the YRDUA has undergone accelerated urbanization while confronting the growing tension between ecological conservation and urban expansion. In the current phase of high-quality development and urban stock regeneration, the YRDUA strives to sustain robust economic growth and grapples with the pressing challenges of transitioning its urban development paradigm. Since 2006, rapid economic progress in the region has spurred simultaneous urbanization across demographic, economic, and spatial dimensions. This process, however, has encroached upon extensive areas of land characterized by high ESV, exacerbating ecological vulnerabilities. In pursuing high-quality development, the traditional development model of the past has struggled to meet the new requirements of economic growth during the transition stage.
4.1. Policy Effects
During the study period, many environmental protection plans and policy documents have been proposed in the YRDUA, such as the guidance proposed by the State Council in 2008, which for the first time included the indicator of energy consumption per unit of GDP in the regional development assessment system [66]; the “Yangtze River Delta Urban Agglomeration Development Plan”, which was put forward in 2016, stated the importance of “development in protection, protection in development”, making clear the imperative of ecological co-construction and environmental co-management in ecological barrier areas such as the Yangtze River ecological corridor and the coastal ecological protection belt. The Outline of the Plan for the Integrated Development of the Yangtze River Delta Region, issued in 2019, calls for the promotion of ecological and environmental co-protection and joint management as well as the formation of a green and low-carbon mode of production and life. It also clarifies the goal of cross-regional ecological network construction. This series of policy documents provides guidance and guarantees regional environmental improvement and sustainable development. It also promotes the deep integration of ecology and urbanization in the YRD. From 2006 to 2020, the number of cities characterized as basically coordinated or better increased significantly. Meanwhile, the basically coordinated type of the YRDUA predominated by 2009, and the overall degree of coordination again increased significantly after 2016, indicating that in each city, the level of coupled coordination between ESV and urbanization level has improved considerably. This shift corroborates the environmental Kuznets curve theory [67], indicating that policy intervention can enhance ecological quality when economic development reaches a specific stage.
4.2. Spatial Patterns and Mechanisms
The study shows that the coupling of ESV and urbanization in the YRD from 2006 to 2020 shows a significant gradient: the core cities of Shanghai, Hangzhou, and Nanjing achieved a high degree of coordination through the triple mechanism of “technological spillover–industrial upgrading–ecological compensation”, while there are still shortcomings in economic and social development in the central Anhui province and the northern Jiangsu province [68]. This difference stems from two significant inconsistencies: (1) land resource mismatch: the expansion of built-up areas in core cities has led to an average annual decrease of 1.2% in high ESV land (wetlands and forests), while the proportion of inefficient industrial land still reaches 34% [68]; (2) industrial path dependence: there is a high proportion of manufacturing industries and insufficient ecologicalization of service industries.
In the YRDUA, the interaction dynamics between ESV and urbanization show prominent spatial clustering features. Cities with high coupling and coordination levels—namely Hangzhou, Shanghai, Nanjing, Wuxi, and Hefei—are concentrated in the eastern region, forming a polycentric network centered on five core hubs. Key cities, such as Shanghai, Nanjing, and Hangzhou, have pioneered cross-regional resource integration through hybrid strategies that combine enclave economic models with collaborative ecological governance. For instance, Shanghai’s Zhangjiang Science City relocated its biomedical pilot base to Hefei while concurrently advancing the Chaohu Lake wetland restoration initiative [69]. This dual approach spurred industrial redistribution and strengthened ecological resilience, fostering coordinated development across neighboring cities. The resulting “technology–industry–ecology” tripartite framework has catalyzed the emergence of a diamond-shaped growth pole in the eastern YRDUA, with Shanghai, Ningbo, Hangzhou, and Hefei as pivotal nodes. Notably, the coupling coordination degree within this core structure markedly outperforms peripheral regions, underscoring the efficacy of integrated development models in reconciling urbanization with ESV preservation.
4.3. Optimization Strategies
As a frontrunner in China’s dynamic urbanization, the YRDUA exemplifies the complex interplay between ecological preservation and metropolitan expansion. While confronting the dual pressures of sustaining ecosystem integrity and accommodating rapid urban growth, this economically vibrant area presents unique opportunities for synergistic optimization. Achieving high-quality, harmonized development requires establishing an integrated governance framework that reconciles anthropogenic and ecological systems. Empirical analyses reveal that the coordinated progression of the YRDUA is governed by tripartite determinants: biophysical constraints, socioeconomic drivers, and institutional configurations. Grounded in this multidimensional understanding, we propose the following evidence-based policy interventions:
(1) Coordinate ecological protection and green innovation. Deepen ecological projects such as returning farmland to forests and wetland restoration to improve environmental carrying capacity and consolidate the positive effects of NDVI [70]. Build a gradient network of science and technology innovation to narrow the regional technology gap. Increase basic scientific research investment in areas with adverse TECH effects, realize technological transformation by undertaking industrial parks, and then accelerate the iterative upgrading of industrial structure.
(2) Optimize the economic model and open pattern. Optimize the economic spatial layout, and promote intensive and efficient development. In the ECON adverse effect area, strictly control the consumption of land resources, promote the green transformation of industrial clusters, and foster the synergy between economic agglomeration and ecological efficiency [71]. Construct an open pattern in the whole region and break through the bottleneck of opening up in the north. Deepen the linkage between the FTZ and the “Belt and Road”, strengthen the construction of cross-border cooperation platforms for OPEN low-value zones, and improve the quality of foreign investment introduction and factor flow efficiency.
(3) Innovate collaborative governance mechanisms, enhance the adaptability of policies, improve the precise placement of financial funds in pollution control, strengthen cross-provincial collaboration, and implement a differentiated assessment system. At the same time, cross-regional environmental protection regulatory agencies can be established to unify environmental protection enforcement standards and address the issue of border pollution [72].
4.4. Methodological Limitations and Future Research Directions
In this paper, we propose an evaluation index system for urbanization level and systematically examine the multidimensional relationships between ESV and the coupling coordination of urbanization within the YRDUA. Despite these contributions, several limitations in research depth and methodological frameworks remain, warranting further refinement in future work. First, the construction of the indicator system was constrained by data availability and reliance on the existing literature, leading to the exclusion of city-specific indicators. Advancing toward a more comprehensive and spatially nuanced evaluation framework will thus be a critical focus for subsequent research. Second, using nighttime lighting data to characterize urban spatial development introduced inherent spatial resolution biases. Integrating high-resolution remote sensing datasets with field-based validation could enhance the precision of such spatial analyses. Third, the classification of land use types lacked granularity, particularly in capturing regionally distinct ecosystems. For instance, wetland areas within the YRD’s dense river network were aggregated into broader water body categories, obscuring variations in ESVs across specific land use subtypes. Finer-scale land use categorization is essential for better quantifying the heterogeneous supply of ecological functions. Finally, the accuracy of ESV assessments for construction land was limited by the absence of standardized evaluation criteria and insufficient baseline data. Methodological innovations, including the adoption of localized valuation parameters and expanded ground-truthing efforts, are needed to improve the reliability of ESV quantification.
4.5. Comparison with Existing Research
Our findings on the declining ESV in the YRD are consistent with findings in other major Chinese urban agglomerations, such as Beijing–Tianjin–Hebei [73] and the Middle Reaches of the Yangtze River [74], which confirms the universal pressure that rapid urbanization imposes on ecosystems. However, the spatial pattern of the ESV–urbanization coupling reveals distinct regional characteristics. Unlike the “isolated coordination” pattern found in the Chengdu–Chongqing urban agglomeration [75], the YRD exhibits a more integrated core-radiation-balanced enhancement pattern. This difference underscores the advantage of the YRD’s stronger internal economic and transportation-infrastructural connectivity, which supports the spread of coordinated development. Furthermore, the driving factors in our study display a clear “core–periphery” distinction, especially for technology (TECH). This differs from the belt-driven pattern dominated by economic growth and forest land in the Yellow River Basin [76], highlighting that the YRD’s development is more reliant on cross-regional governance policies and knowledge spillovers from innovation hubs to balance spatial disparities.
5. Conclusions
This study systematically examined the coupling coordination between ESV and urbanization in the YRD from 2006 to 2020. The main conclusions are as follows: (1) From the temporal dimension, there is an obvious trade-off relationship—when the urbanization level rises, the economic value shows a downward trend. (2) From the spatial dimension, the coupling coordination degree evolved from moderate incoordination to moderate coordination, exhibiting a “core–periphery” diffusion pattern centered around major cities like Shanghai, Suzhou, and Hangzhou. (3) The driving factors, led by NDVI and economic density, exhibited significant spatiotemporal heterogeneity, as captured by the GTWR model. These findings have both theoretical and practical implications.
Theoretically, this research advances the methodological framework for studying human–environment interactions in metropolitan regions by integrating the CCD model with the GTWR approach, thereby effectively quantifying the evolving spatial and temporal influences of various drivers. Practically, the findings provide a nuanced, spatially explicit evidence base for policymakers. The identification of regional development typologies (ESV guidance, urbanization guidance, balanced development) and the spatiotemporal heterogeneity of drivers enable targeted and adaptive strategies for ecological redline adjustment, industrial layout optimization, and cross-jurisdictional governance in the YRD and similar urban agglomerations worldwide.
Author Contributions
X.G.: Methodology, Formal analysis, Visualization, Writing—original draft. C.Z.: Conceptualization, Supervision, Validation, Funding acquisition. All authors have read and agreed to the published version of the manuscript.
Funding
This research did not receive any specific grant from funding agencies in the public, commercial, or not-for-profit sectors.
Data Availability Statement
The original opinion presented in this study is contained in the article. For further information, please contact the author directly.
Conflicts of Interest
The authors declare that the research was conducted in the absence of any commercial or financial relationships that could be construed as a potential conflict of interest.
References
- Gretchen, C.D.; Söderqvist, T.; Aniyar, S.; Arrow, K.; Dasgupta, P.; Ehrlich, P.R.; Folke, C.; Jansson, A.; Jansson, B.-O.; Kautsky, N.; et al. The Value of Nature and the Nature of Value. Science 2000, 289, 395–396. [Google Scholar] [CrossRef]
- Robert, C.; d’Arge, R.; de Groot, R.; Farber, S.; Grasso, M.; Hannon, B.; Limburg, K.; Naeem, S.; O’Neill, R.V.; Paruelo, J.; et al. The Value of the World’s Ecosystem Services and Natural Capital. Nature 1997, 1, 253–260. [Google Scholar]
- Robert, C.; de Groot, R.; Braat, L.; Kubiszewski, I.; Fioramonti, L.; Sutton, P.; Farber, S.; Grasso, M. Twenty Years of Ecosystem Services: How Far Have We Come and How Far Do We Still Need to Go? Ecosyst. Serv. 2017, 28, 1–16. [Google Scholar] [CrossRef]
- Xie, G.; Zhen, L.; Lu, C.X.; Xiao, Y.; Chen, C. Expert Knowledge-Based Valuation Method of Ecosystem Services in China. J. Nat. Resour. 2008, 23, 911–919. [Google Scholar]
- Peng, L.R.; Xu, Q.R.; Yu, J.; Chen, L.; Peng, Y.H. Multiscale Assessment of the Spatiotemporal Coupling Relationship between Urbanization and Ecosystem Service Value Along an Urban–Rural Gradient: A Case Study of the Yangtze River Delta Urban Agglomeration, China. Ecol. Indic. 2024, 160, 111864. [Google Scholar] [CrossRef]
- Jian, W.S.; Ma, H.T.; Zhao, Y.B. Exploring the Relationship between Urbanization and the Eco-Environment—A Case Study of Beijing–Tianjin–Hebei Region. Ecol. Indic. 2014, 45, 171–183. [Google Scholar]
- Walter, R.; Mooney, H.; Cropper, A.; Capistrano, D.; Carpenter, S.; Chopra, K. Millennium Ecosystem Assessment. Ecosystems and Human Well-Being: Synthesis; WIMEK: Wageningen, The Netherlands, 2005. [Google Scholar]
- Fang, L.R.; Zhao, W.P.; Tian, X.L.; Zhang, J.M. The Trade-Offs among Ecosystem Services and Their Response to the Socio-Ecological Environment in the Qilian Mountains. J. Glaciol. Geocryol. 2021, 43, 928–938. [Google Scholar]
- Yang, X.Y.; Zhu, Q.C.; Bai, H.; Luo, P.P.; Liu, J.F. Spatio-Temporal Evolution and Coupled Coordination of Lucc and Esv in Cities of the Transition Zone, Shenmu City, China. Remote Sens. 2023, 15, 3136. [Google Scholar]
- Qing, Z.J.; Huang, H.Y.; Cui, H.Q.; Hui, Y.; Xiao, Z.Y. Ipbes: Biodiversity Science Assessment as a Driver for Policy Decision-Making. Acta Ecol. Sin. 2016, 36, 1793–1796. [Google Scholar]
- Li, Z.K.; Feng, R.R.; Liu, T.; Zhang, Z.C.; Zhang, J.N.; Liu, K. Coordination and Obstacle Factors of Urbanization and Ecosystem Service Value in the Yellow River Basin. Arid Land Geogr. 2022, 45, 1254–1267. [Google Scholar]
- Xue, Z.Z.; Qiu, L.H. Experimental Study on the Effect of Urbanization on the Service Functions of Ecosystems—A Case Study in the Southern Suburbs of Xi’an City. Arid Zone Res. 2011, 28, 974–979. [Google Scholar]
- Fang, L.; Qin, T.; Liu, S.; Wang, H.; Nie, H. Spatial Response of Urban Land Use Change and Ecosystem Service Value in the Lower Reaches of the Yangtze River: A Case Study of Tongling, China. Front. Environ. Sci. 2023, 11, 1137442. [Google Scholar] [CrossRef]
- Mou, Y.S.; Li, J.; Wu, Q.H.; Roger, C.K.C.; Zhang, L.C. Study on the Development Trend and Direction of Chinese Urban Agglomerations. Geogr. Res. 2010, 29, 1345–1354. [Google Scholar]
- Lin, F.C.; Zhou, C.H.; Wang, Z.B. Sustainable Development Strategy and Priorities of Spatially Differentiated Development of Urban Agglomerations Along the Yangtze River Economic Belt. Prog. Geogr. 2015, 34, 1398–1408. [Google Scholar]
- Duo, Z.Z.; Yuan, X.D.; Zhang, Z.; Li, X.Y.; Zhou, C.S. Spatiotemporal Evolution and Influencing Factors of Coupling and Coordination between the Ecosystem Service Value and Economy in the Pearl River Delta Urban Agglomeration of China. Land 2024, 13, 1670. [Google Scholar] [CrossRef]
- Hao, T.D.; Cai, Y.Y.; Liu, M.B. Coupling Coordination Analysis and Spatiotemporal Heterogeneity between Ecosystem Services and New-Type Urbanization: A Case Study of the Yangtze River Economic Belt in China. Ecol. Indic. 2023, 154, 110535. [Google Scholar] [CrossRef]
- Cheng, H.Y.; Liu, Y.; Yan, Z.Y. Research Regarding the Coupling and Coordination Relationship between New Urbanization and Ecosystem Services in Nanchang. Sustainability 2022, 14, 15041. [Google Scholar] [CrossRef]
- Qi, C.Y.; Liu, W.; Zhao, F.; Zhao, Q.; Xu, Z.W.; Kumi, M.A. Multi-Scale Analysis of Ecosystem Service Trade-Offs/Synergies in the Yangtze River Delta. Land 2024, 13, 1462. [Google Scholar]
- Xi, C.W.; Yang, X.J.; LI, R.Y. Coupling Coordination Relationship and Influencing Factors between Urban Resilience and Ecosystem Services in the Guanzhong Plain Urban Agglomeration. Arid Land Geography. 2024. Available online: https://link.cnki.net/urlid/65.1103.X.20250327.1615.003 (accessed on 14 May 2025).
- Mei, H.X.; Li, J.L.; Guan, J.; Liu, Y.C.; Tian, P.; Ai, S.Y.; Gong, H.B. Land Use Dynamics and Ecosystem Service Value Changes in the Yangtze River Delta Urban Agglomeration under Different Scenarios. Chin. Geogr. Sci. 2024, 34, 1105–1118. [Google Scholar] [CrossRef]
- Qian, W.X.; Zhao, S.N. Spatial-Temporal Coupling and Coordination of Carbon Emission-Technological Innovation-Green Development in the Yangtze River Economic Belt. Resour. Environ. Yangtze Basin 2025, 34, 494–506. [Google Scholar]
- Ling, H.L. Spatiotemporal Variations of Coupling and Coordination between Urbanization and Ecological Environment and Associated Influencing Factors in the Yangtze River Economic Belt. Resour. Environ. Yangtze Basin 2024, 33, 2675–2687. [Google Scholar]
- Yuan, W.D.; Wang, J.; Liu, H.F.; Han, M.; Ma, X. Research on Coupling Coordination and Driving Factors of Ecosystem Services and Economic Development in Shanxi Province. Areal Res. Dev. 2024, 43, 52–59. [Google Scholar]
- Qi, Q.; Wang, L.; Chen, J.C.; Wang, B.Y.; He, S.Y.; Han, J.N.; Li, Z.H.; Li, K. Interaction between Rapid Urban Expansion and Ecosystem Service Value Trade-Off/Synergy in Wuhan City. Sci. Geogr. Sin. 2024, 44, 953–963. [Google Scholar]
- Yan, J.; Liu, Y.; Ma, R. Towards high-quality territorial spaces: Theorizing space quality and measuring its social-spatial inequities. Habitat Int. 2025, 164, 103537. [Google Scholar] [CrossRef]
- Yue, C.C.; Tang, J.X.; Chen, W.H. Research on the Interactive Relationship and Coordination Effect between Tourism Urbanization and Ecosystem Services Value: A Case Study Wuling Mountain Area of Hunan Province. J. Cent. China Norm. Univ. Nat. Sci. 2024, 58, 453–469. [Google Scholar]
- Basu, T.; Das, A. Urbanization Induced Changes in Land Use Dynamics and Its Nexus to Ecosystem Service Values: A Spatiotemporal Investigation to Promote Sustainable Urban Growth. Land Use Policy 2024, 144, 107239. [Google Scholar] [CrossRef]
- Dan, P.; Chen, J.; Kong, F.B. Impact of Mountain-River-Forest-Cropland-Lake-Grassland System Project on the Spatial-Temporal Evolution of Ecosystem Service Values and Trade-Off Synergistic Relationships: A Case Study of Ganzhou City. Acta Ecol. Sin. 2025, 45, 4758–4773. Available online: https://link.cnki.net/doi/10.20103/j.stxb.202405181137 (accessed on 14 May 2025).
- Rong, H.X.; Cai, C.Y.; Tang, J.X.; Shi, J.Z.; Yang, R.B. Analysis of Coupling Coordination and Obstacle Factors between Tourism Development and Ecosystem Services Value: A Case Study of the Yellow River Basin, China. Ecol. Indic. 2023, 157, 111234. [Google Scholar] [CrossRef]
- Yang, L.; Wang, K.; Zhao, Y.T. Influencing Mechanism of Information Flow on the Synergy of Economic Development and Ecological Environment in the Yellow River Basin. Economic Geography. 2025. Available online: https://link.cnki.net/urlid/43.1126.K.20250325.1747.002 (accessed on 14 May 2025).
- Zhong, T.Q.; Xin, C.N.; Wang, Y.Z.; Yu, H.R. Research on Coupling Coordination between New Urbanization and Sustainable Land Resource Utilization in the Yangtze River Delta Urban Agglomeration. J. China West Norm. Univ. Nat. Sci. 2025, 46, 403–411. Available online: https://link.cnki.net/urlid/51.1699.N.20240914.1311.002 (accessed on 14 May 2025).
- Yu, T.; Xue, D.Q.; Song, Y.Y.; Zheng, B.K.; Ma, B.B.; Ye, H. Coupling Coordination and Influencing Factors of Economic-Scale-Structure-Efficiency of Resource-Based Cities on the Loess Plateau. Acta Geogr. Sin. 2025, 80, 793–810. [Google Scholar]
- Xin, C.S.; Wu, D.M.; Shao, D.W. Multi-Scale Evolutionary Patterns and Mechanisms of Ecosystem Service Values in Highly Urbanised Areas: A Case Study of Suzhou City. Environmental Science. 2025. Available online: https://link.cnki.net/doi/10.13227/j.hjkx.202411318 (accessed on 14 May 2025).
- Xin, C.; Xiao, Z.L.; Hu, X.Y.; Tan, X.H.; Liu, R. Land Use Simulation and Ecosystem Service Value Assessment of the Panxi Dry Valley Region under Policy-Oriented Scenarios. Environmental Science. 2025. Available online: https://link.cnki.net/doi/10.13227/j.hjkx.202410200 (accessed on 14 May 2025).
- Jie, S.Y.; Wei, S.K.; Yuan, W.L.; Miao, Y. Spatial-Temporal Differentiation and Influencing Factors of Coupling Coordination of “Production-Living-Ecological” Functions in Yangtze River Delta Urban Agglomeration. Acta Ecol. Sin. 2022, 42, 6644–6655. [Google Scholar]
- Yuan, L.; Wang, J. A Comparative Study on Spatial-Temporal Dynamics and Associated Driving Factors of Wetlands in the Three Coastal Urban Agglomerations of China. Wetl. Sci. 2024, 22, 617–629. [Google Scholar]
- National-Bureau-of-Statistics-of-China. China Urban Statistical Yearbook (2006~2020); China Statistical Publishing House: Beijing, China, 2021.
- Jia, S.; Leng, J. Types and Spatial Pattern of Coupling Coordination between the New-Type Urbanization and Eco-Environment in Wuling Mountainous Area of Hunan. Econ. Geogr. 2022, 42, 87–95. [Google Scholar]
- Chao, Y.; Duan, B.Q.; Chen, W.X. Interactive Coercive Relationship between Urbanization and Ecosystem Services in Developed Regions: A Case Study of Guangdong Province. J. Saf. Environ. 2024, 24, 4494–4505. [Google Scholar]
- Da Hao, Z.; Zhou, C.S.; He, B.J. Spatial and Temporal Heterogeneity of Urban Land Area and Pm2.5 Concentration in China. Urban Clim. 2022, 45, 101268. [Google Scholar] [CrossRef]
- Jun, J.X.; Yang, Q.S.; Geng, Q.G.; Wang, X.Y.; Liu, J. Spatial-Temporal Differentiation and Driving Mechanism of Coordinated Development of Ecological-Economic-Society Systems in the Yangtze River Economic Belt. Resour. Environ. Yangtze Basin 2019, 28, 493–504. Available online: https://yangtzebasin.whlib.ac.cn/CN/10.11870/cjlyzyyhj201903001 (accessed on 14 May 2025).
- Di, X.G.; Lu, C.X.; Leng, Y.F.; Zheng, D.; Li, S.C. Ecological Assets Valuation of the Tibetan Plateau. J. Nat. Resour. 2003, 2, 189–196. [Google Scholar]
- Di, X.G.; Zhang, C.X.; Zhang, L.M.; Chen, W.H.; Li, S.M. Improvement of the Evaluation Method for Ecosystem Service value Based on Per Unit Area. J. Nat. Resour. 2015, 30, 1243–1254. [Google Scholar]
- Qiong, Y.Y.; Zhang, J.E.; Wang, T.; Bai, H.; Wang, X.; Zhao, W. Changes in Land-Use and Ecosystem Service Value in Guangdong Province, Southern China, from 1990 to 2018. Land 2021, 10, 426. [Google Scholar] [CrossRef]
- Lin, F.C.; Cui, X.G.; Liang, L.W. Theoretical Analysis of Urbanization and Eco-Environment Coupling Coil and Coupler Control. Acta Geogr. Sin. 2019, 74, 2529–2546. [Google Scholar]
- Cong, T.Y.; Tian, M.; Li, P.; Wu, Z.L. Coordinated Development of Urbanization and Ecosystem Services in the Tibet Autonomous Region. Prog. Geogr. 2023, 42, 1947–1960. [Google Scholar]
- Jian, W.S.; Cui, Z.T.; Lin, J.J.; Xie, J.Y.; Su, K. Coupling Relationship between Urbanization and Ecological Resilience in the Pearl River Delta. Acta Geogr. Sin. 2021, 76, 973–991. [Google Scholar]
- Fan, W.Y.; Liu, Y.S.; Li, Y.R. Spatio-Temporal Coupling of Demographic-Landscape Urbanization and Its Driving Forces in China. Acta Geogr. Sin. 2018, 73, 1865–1879. [Google Scholar]
- Yan, J.; Liu, Y.; Lou, H. Integrating ecosystem services into comprehensive land consolidation: A multi-scale governance perspective. J. Geogr. Sci. 2025, 35, 716–744. [Google Scholar] [CrossRef]
- Su, L.; Liu, H.N. Spatio-Temporal Pattern Evolution of Coupling Coordination between Urbanization and Ecological Resilience in Arid Region: A Case of Ningxia Hui Autonomous Region. Arid Land Geogr. 2022, 45, 1281–1290. [Google Scholar]
- Da Hao, Z.; Xie, X.; Zhou, C.S. Spatial Influence of Exposure to Green Spaces on the Climate Comfort of Urban Habitats in China. Urban Clim. 2023, 51, 101657. [Google Scholar] [CrossRef]
- Jun, Z.G.; Deng, H.H. Spatial-Temporal Evolution of the Coordination Relationship between the Service Industry and Urbanization in the Pearl River Delta Region. Geogr. Sci. 2018, 38, 1118–1128. [Google Scholar]
- Liang, C.J.; Yu, H. The Coupling Development of Tourism and Urbanization in Daxiangxi Area. Econ. Geogr. 2016, 36, 204–208+141. [Google Scholar]
- Gui, L.T.; Wu, C.F.; Li, H.Y.; You, H.Y.; Cai, X. The Coordination and Its Optimization About Population and Land of Urbanization: A Case Study of Nanchang City. Geogr. Sci. 2016, 36, 239–246. [Google Scholar]
- Yue, Y.M.; Yan, M.T.; Zhang, Y.; Zhao, J.J. Pattern Evolution and Influencing Factors of High-Quality Tourism Development in Urban Areas of China. Econ. Geogr. 2024, 44, 206–217. [Google Scholar]
- Sheng, L.M.; Ren, X.X.; Yu, Y.; Zhou, L. Spatiotemporal Pattern of Ground-Level Fine Particulate Matter (Pm2.5) Pollution in Mainland China. China Environ. Sci. 2016, 36, 641–650. [Google Scholar]
- Ming, J.S.; Tang, H.J. Nonlinear Impact of Technological Innovation on Economic Growth—From the Perspective of Factor Flow. Res. Dev. 2021, 2, 69–76. [Google Scholar]
- Chen, L.; Wu, Y.M.; Gao, B.P.; Wu, Y.; Zheng, K.J.; Chan, L. Spatial Differentiation and Driving Factors of Rural Settlement in Plateau Lake: A Case Study of the Area around the Erhai. Econ. Geogr. 2022, 42, 220–229. [Google Scholar]
- Council, United Nations Development Programme (UNDP) and Development Research Center of the State. China National Human Development Report Special Edition: 40 Years of Human Development in China Under Historical Transformation—Towards a Sustainable Future; China Translation & Publishing House: Beijing, China, 2019. [Google Scholar]
- Dong, D.; Luo, Y.; Gu, K.K. Spatio-Temporal Differentiation and Driving Forces of Eco-Environmental Effects of Land Use Transformation in Yangtze River Delta Economic Zone: A Perspective of Production-Living-Ecological Spaces. Resour. Environ. Yangtze Basin 2023, 32, 1664–1676. [Google Scholar]
- Feng, F.Z. On the Theory, Logic, and Practice Path to Structural Reform of the Supply Front. Econ. Probl. 2016, 2, 12–17. [Google Scholar]
- Yang, C.Z.; Liu, Q.; Cao, S.X. Real Estate Supports the Rapid Development of China’s Urbanization. Land Use Policy 2020, 95, 104582. [Google Scholar]
- Rui, D.K.; Cheng, Y.Y.; Yao, X. Environmental Regulation, Green Technology Innovation, and Industrial Structure Upgrading: The Road to the Green Transformation of Chinese Cities. Energy Econ. 2021, 98, 105247. [Google Scholar] [CrossRef]
- Lin, L.Y.; Zhang, X.H.; Pan, X.Y.; Ma, X.X.; Tang, M.Y. The Spatial Integration and Coordinated Industrial Development of Urban Agglomerations in the Yangtze River Economic Belt, China. Cities 2020, 104, 102801. [Google Scholar] [CrossRef]
- Dong, L.; Yang, Y.; Zhang, W.H.; Xu, M.J. Study on Planning and Policy System of Regional Integration Development in the Yangtze River Delta. Environ. Prot. 2020, 48, 9–15. [Google Scholar]
- Gene, M.G.; Krueger, A.B. Economic Growth and the Environment. In National Bureau of Economic Research Working Paper Series; National Bureau of Economic Research (NBER): Cambridge, MA, USA, 1994; p. 4634. [Google Scholar]
- Cheng, L.; Zhao, J.; Zhuang, Z.C. Spatiotemporal Dynamics and Influencing Factors of Ecosystem Service Trade-Offs in the Yangtze River Delta Urban Agglomeration. Acta Ecol. Sin. 2022, 42, 5708–5720. [Google Scholar] [CrossRef]
- Ran, W.; Cheng, J.H. Coupling Analysis of Socioeconomic Development and Resource Environment in the Yangtze River Delta Urban Agglomeration under the Perspective of High-Quality Development. Acad. Forum 2019, 42, 54–60. [Google Scholar]
- Yi, T.J.; Dong, P.; Lu, Y.Q. Spatial-Temporal Analysis and Influencing Factors of Ecological Resilience in the Yangtze River Delta. Resour. Environ. Yangtze Basin 2022, 31, 1975–1987. [Google Scholar]
- Ran, Z.X.; Wang, J.Y.; He, W.; Wei, Q.; Yang, Y.H. Spatial-Temporal Distribution and Influencing Factors of Urban Carbon Emissions under the Background of Carbon Emission Reduction: A Case Study of Guangxi Autonomous Region. J. Resour. Ecol. 2024, 15, 870–879. [Google Scholar] [CrossRef]
- Quan, Z.H.; Chen, S.Q.; Zhang, C.J.; Li, H.Y.; Chen, B.B. Evaluation and Analysis of Coupling Coordination between Water Use Efficiency and Industrial Structure in the Yangtze River Economic Belt. J. Econ. Water Resour. 2022, 40, 1–7+93. [Google Scholar]
- Xu, C.W.; Liu, Z.L.; Li, J.F.; Ran, D.; Zeng, J. Mapping the Spatial Relationship between Ecosystem Services and Urbanization in the Middle Reaches of the Yangtze River Urban Agglomerations. Acta Ecol. Sin. 2020, 40, 5137–5150. [Google Scholar]
- Peng, Z.Y.; Zhai, G.Q.; Yu, Z.J.; Lu, Z.Y.; Chen, Y.M.; Liu, J.Z. Coupling Coordination between Urbanization and Ecosystem Services Value in the Beijing-Tianjin-Hebei Urban Agglomeration. Sustain. Cities Soc. 2024, 113, 105715. [Google Scholar]
- Wen, R.Y.; Cao, W.D.; Zhang, Y.; Su, H.F.; Wang, X.W. Temporal and Spatial Coupling Characteristics of Urbanization and Ecological Environment of Three Major Urban Agglomerations in the Yangtze River Economic Belt. Resour. Environ. Yangtze Basin 2019, 28, 2586–2600. [Google Scholar]
- Li, Z.K.; Liu, T.; Feng, R.R.; Zhang, Z.C.; Liu, K. Coupling Coordination Relationship and Driving Mechanism between Urbanization and Ecosystem Service Value in Large Regions: A Case Study of Urban Agglomeration in Yellow River Basin, China. Int. J. Environ. Res. Public Health 2021, 18, 7836. [Google Scholar]
Disclaimer/Publisher’s Note: The statements, opinions and data contained in all publications are solely those of the individual author(s) and contributor(s) and not of MDPI and/or the editor(s). MDPI and/or the editor(s) disclaim responsibility for any injury to people or property resulting from any ideas, methods, instructions or products referred to in the content. |
© 2025 by the authors. Licensee MDPI, Basel, Switzerland. This article is an open access article distributed under the terms and conditions of the Creative Commons Attribution (CC BY) license (https://creativecommons.org/licenses/by/4.0/).