Abstract
Thanks to the development of geodetic methods and equipment, there has been a transition from conventional methods to modern technologies, which can efficiently and accurately acquire a large amount of data in a short time without the need for direct contact with the measured object. Combined technologies such as Structure from Motion (SfM), Multi-View Stereo (MVS) photogrammetry using Unmanned Aerial Systems (UAS), and terrestrial laser scanning (TLS) are often used for monitoring geohazards and documenting objects in quarries to obtain detailed and accurate information about their condition and changes. This article deals with the analysis of point clouds obtained with different settings in terms of average absolute point distance, average point density, and time range for surveying and office work. The numerical and graphical results of the research lead to conclusions for scientific and practical applications for activities in the mining industry.
1. Introduction
The mapping and documentation of the earth’s surface have advanced significantly as a result of digitization and the advancement of technical and software technologies. The use of photogrammetry and laser scanning to document objects on the surface of the Earth is growing. Due to frequent changes in morphology, mining areas require systematic monitoring of their geological and geomorphological characteristics to prevent undesirable events such as erosion, landslides, and deformations of the terrain. Nowadays, quarries are monitored by contemporary technologies, which provide precise and comprehensive data on their development and state.
High-resolution and accurate terrain monitoring is made possible by these technologies, which include UAS photogrammetry techniques based on the Structure from Motion—Multi View Stereo (SfM-MVS) and TLS principles. The instrumentation, necessary accuracy, budget, point density, and interpretation of the outputs are all important factors to take into account when selecting an appropriate method. Nowadays, hard-to-reach areas are the main focus of UAS photogrammetry, which uses a camera mounted on an Unmanned Aerial Vehicle (UAV) carrier. Due to their high-accuracy terrain models, ease of use, low acquisition costs, and speed of data collection, UAS carriers are becoming more and more popular, particularly in smaller areas. These indications have made UAS photogrammetry a competitive and efficient substitute for traditional geodetic techniques in terms of both quality and efficiency. In many different fields and disciplines, including mining [1,2], real estate cadastre [3,4], industry [5,6], geology [7,8], archeology [9,10], architecture [11,12], agriculture [13,14], and monitoring natural processes in the landscape [15,16], geohazards [17,18], or landslides [19,20], measurement using unmanned aerial system (UAS) technology is used.
TLS is the most recent non-contact method that is used to measure smaller parts of the landscape and smaller objects. The advantage of TLS is that it is a high-speed measurement that can measure the position and shape of irregular objects. It can capture a high point density in a short time. An uneven object with varying sizes and shapes can be accurately represented in a digital 3D model with high detail and speed. TLS applies the spatial polar method to find the spatial coordinates of points; its uses are evident in engineering and construction [21,22], industry [23,24], and land mapping [25,26]. Laser scanning and photogrammetric techniques typically use ground control points (GCP) for georeferencing [27]. The components of the camera’s internal and external orientation can be accurately determined using GCPs. Global Navigation Satellite System (GNSS) receivers or total stations are used to measure the coordinates of GCPs in the field [28,29,30]. When using UAS with the Real Time Kinematic/Post Processed Kinematic (RTK/PPK) module, photogrammetric data can be acquired without the need for GCPs. In this instance, a position is assigned to each image. The authors [31,32,33] devoted themselves to measurement without the use of GCPs. Aerial images, digital terrain models (DTM) [34], digital surface models (DSM) [35], digital elevation models (DEM) [36], point clouds [37], vector maps [38], or orthophoto maps [39]—all of which depict real-world objects—are the most common results of data collection utilizing non-contact methods.
The study [40] compared multicopter UAV data with total station (TS) data to estimate volumes. According to the findings, the data collected by UAS is more precise and of higher quality than TS data. The authors also recommend the UAV approach regarding the time efficiency of the fieldwork. Article [41] examined, evaluated, and estimated the stock volume of excavated material. In comparison to the UAS method, which was the most precise, safest, and fastest way to map large areas, the GNSS method took a lot of time. Using GCP, they achieved an accuracy of up to 10 cm. The topographic survey technique in a large surface limestone mine using a fixed-wing UAS was examined by the authors of [42]. Flight height was 300 m, and accuracy on GCP was up to 15 cm. In a different study [43], the volume of reserves was calculated and the GNSS and UAS methods were compared in a quarry close to Sofia, Bulgaria. The authors claim that the UAS photogrammetry method is quick, precise, and capable of quickly mapping a sizable area. In a quarry environment, the authors [44] used digital photogrammetry. Research explains the benefits and drawbacks of this technology as well as the steps involved in processing, with a mention of outcomes. An overview of UAS use in the mining industry is conducted by a research study [45]. It investigates the principles, classification, and technology of UAS. In areas where mining activity has an impact, this article suggests utilizing UAS technology regarding the efficiency of fieldwork and mining operations. Georeferencing with RTK and using GCP was solved by the authors in [46]. They achieved centimeter accuracy at a flight height of 100 m Above Ground Level (AGL). Research [47] was conducted to compare various carriers and cameras. As a result, the RMSE of point clouds reaches 0.11 m and 0.19 m. Using UAS Atmos-7, the authors of the paper [48] tracked soil erosion that happened while a quarry was being restored. The aim of the study was to develop a technique for detecting leaks in quarries where mining operations have had an impact. Consequently, two different DEMs are produced: one before the erosion process and the other after. To define the fracture zones at inaccessible quarry faces, the study [49] details the application of UAS and TLS technology in topographic modeling and structural geological mapping of a limestone quarry. The authors focused on the detailed creation of a 3D model from UAS photogrammetry in the quarry environment. From the DTM, they derived structural geological parameters at the level of centimeter-sized triangles. Using UAS photogrammetry, the authors of the paper [50] characterized the rock massif by semi-automatically identifying and extracting planar elements from the rock slope, and they also produced a 3D model of a limestone quarry. Based on a detailed DEM, the authors implemented semi-automatic segmentation of the characteristic surfaces in the quarry.
Research [51] examined the application of DTM to calculate the water-filling rate of a quarry using Light detection and ranging (Lidar). The classification of Lidar data was used in [52,53]. In their research [54], the authors dealt with the classification of vegetation based on vegetation indices. Stability and accuracy analysis of quarry walls based on TLS measurements was the subject of research [7], where TLS was evaluated as a highly accurate and reliable reference method.
Our research discusses an approach for monitoring the Dreveník quarry using non-contact techniques, which don’t require direct contact with the object being measured and can yield fast, accurate, and large amounts of detailed spatial data.
The goal of our research was to verify and quantify these characteristic properties of non-contact measurement methods. By mutual comparison of point clouds obtained by different measurement methods or with their different configurations during measurement, we expect confirmation of the suitability of the UAS photogrammetry method compared to the TLS method. We focus on the analysis of measurable quantities to achieve demonstrable results. We evaluate the distance of point clouds, their density, and their completeness. The general inclination of the quarry is approximately 50°. The walls themselves have an inclination of approximately 70°. In these specific conditions, we compared nadir and oblique imaging as well. We primarily assume that oblique imaging will bring better results.
The study area’s features and in-depth description are the main topics of the study area section. Monitoring of the Dreveník quarry is the subject of the Materials and Methods section. Methods and practical aspects of surveying in the field are covered in this section. The quarry was monitored using TLS techniques and UAS photogrammetry. This section outlines field operations, the process for stabilizing individual GCPs, and a technical description of each measuring device in use. The field measurement, data processing, and method comparison based on point density, standard deviation, and number of points on the mining wall and earth’s surface are presented in the Results section. The benefits and drawbacks of the measurement techniques employed are discussed in the Discussion section, along with a comparison of these techniques based on different parameters and a comparison of the techniques in terms of the point density on the rock object. The solutions provided by other authors whose articles tackled related issues in the quarry are also covered.
2. Study Area
Dreveník quarry is located in the Slovak Republic, specifically in the Prešov region, Levoča district, and Spišské Podhradie town. Spišské Podhradie is located in the Hornádská basin, along the valley of the Margecianka river, approximately 12 km east of Levoča. Spišské Podhradie covers 24.94 km2 and has a population of 4035 people. Spišské Podhradie is situated west of the region’s historical landmark, Spiš Castle. Spišské Podhradie is located in the valley between Spiš Castle and Spišská Kapitula [55].
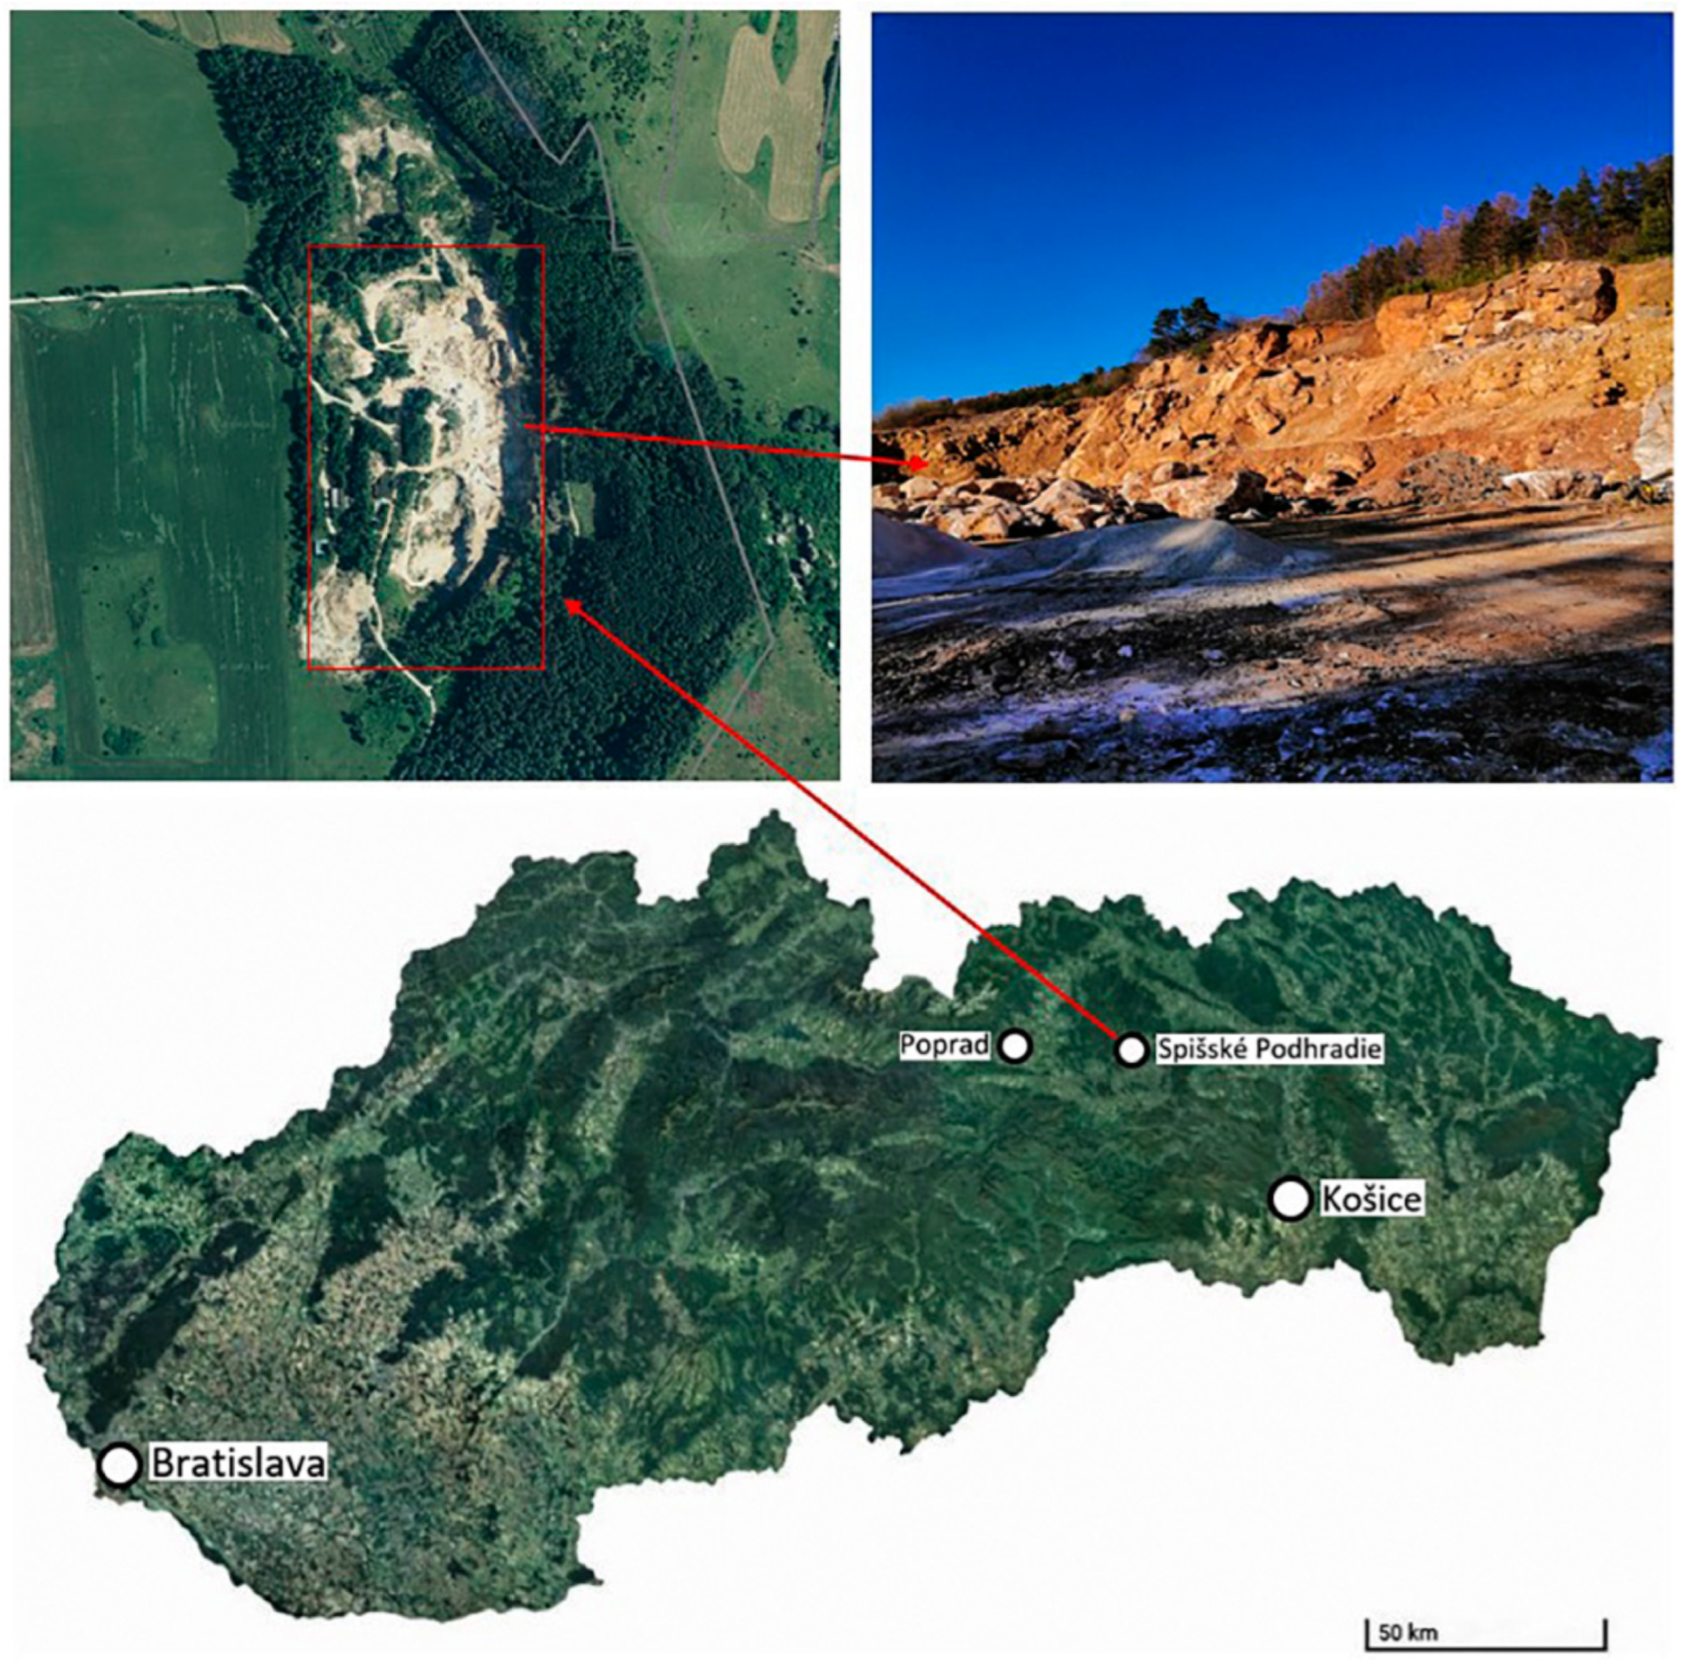
The close vicinity of Dreveník Quarry (Figure 1) is listed as a particularly protected natural area in the Slovak Republic. The Dreveník is a national nature reserve located in the Hornádská basin. It was formed by combining multiple travertine mounds deposited by mineral springs. It is situated on the boundary between Spišská Nová Ves and Levoča districts. The area of 1,018,186 m2 has been protected since 1925. Since 1993, it has been the United Nations Educational, Scientific, and Cultural Organization (UNESCO) site, alongside the nearby Spiš Castle [56]. The national nature reserve is managed by the Slovak Paradise National Park and has the fifth highest level of protection. Dreveník is one of the oldest protected areas in Slovakia and the most extensive travertine area with karst morphology. Among the occurrences of travertine in Spiš, Dreveník is the oldest and largest travertine area in Slovakia [57,58].

Figure 1.
The study area’s location—the Dreveník quarry.
3. Materials and Methods
The purpose of this research is to use non-contact techniques, such as UAS photogrammetry based on the SfM-MVS and TLS principles, to map and document the quarry. These are some of the best techniques for making digital maps, orthophotos, or DEMs. The point cloud was georeferenced using GCPs, whose coordinates were measured using the GNSS method, for both approaches. The following workflow was followed for fieldwork in the Dreveník study area:
- Terrain reconnaissance.
- Location and determination of the coordinates of GCPs for TLS and photogrammetry.
- UAS photogrammetry.
- TLS measurement
The quarry was surveyed in one day at the same time epoch (March 2022) using photogrammetric and TLS measurement techniques. In-depth documentation of the topography within the quarry was the primary objective of this measurement. Adequate measuring devices, tools, and equipment were employed to accomplish this aim. An RTK UAS DJI Phantom 4 (SZ DJI Technology Co., Ltd., Shenzhen, China) was used to collect photogrammetric data. For TLS, a terrestrial laser scanner Leica RTC360 (Leica Geosystems AG, Heerbrugg, Switzerland) was employed. A dual-frequency GNSS set, Leica GS07 (Leica Geosystems AG, Heerbrugg, Switzerland), was used to measure the coordinates of GCPs for photogrammetry and TLS.
3.1. Measurement by GNSS Method
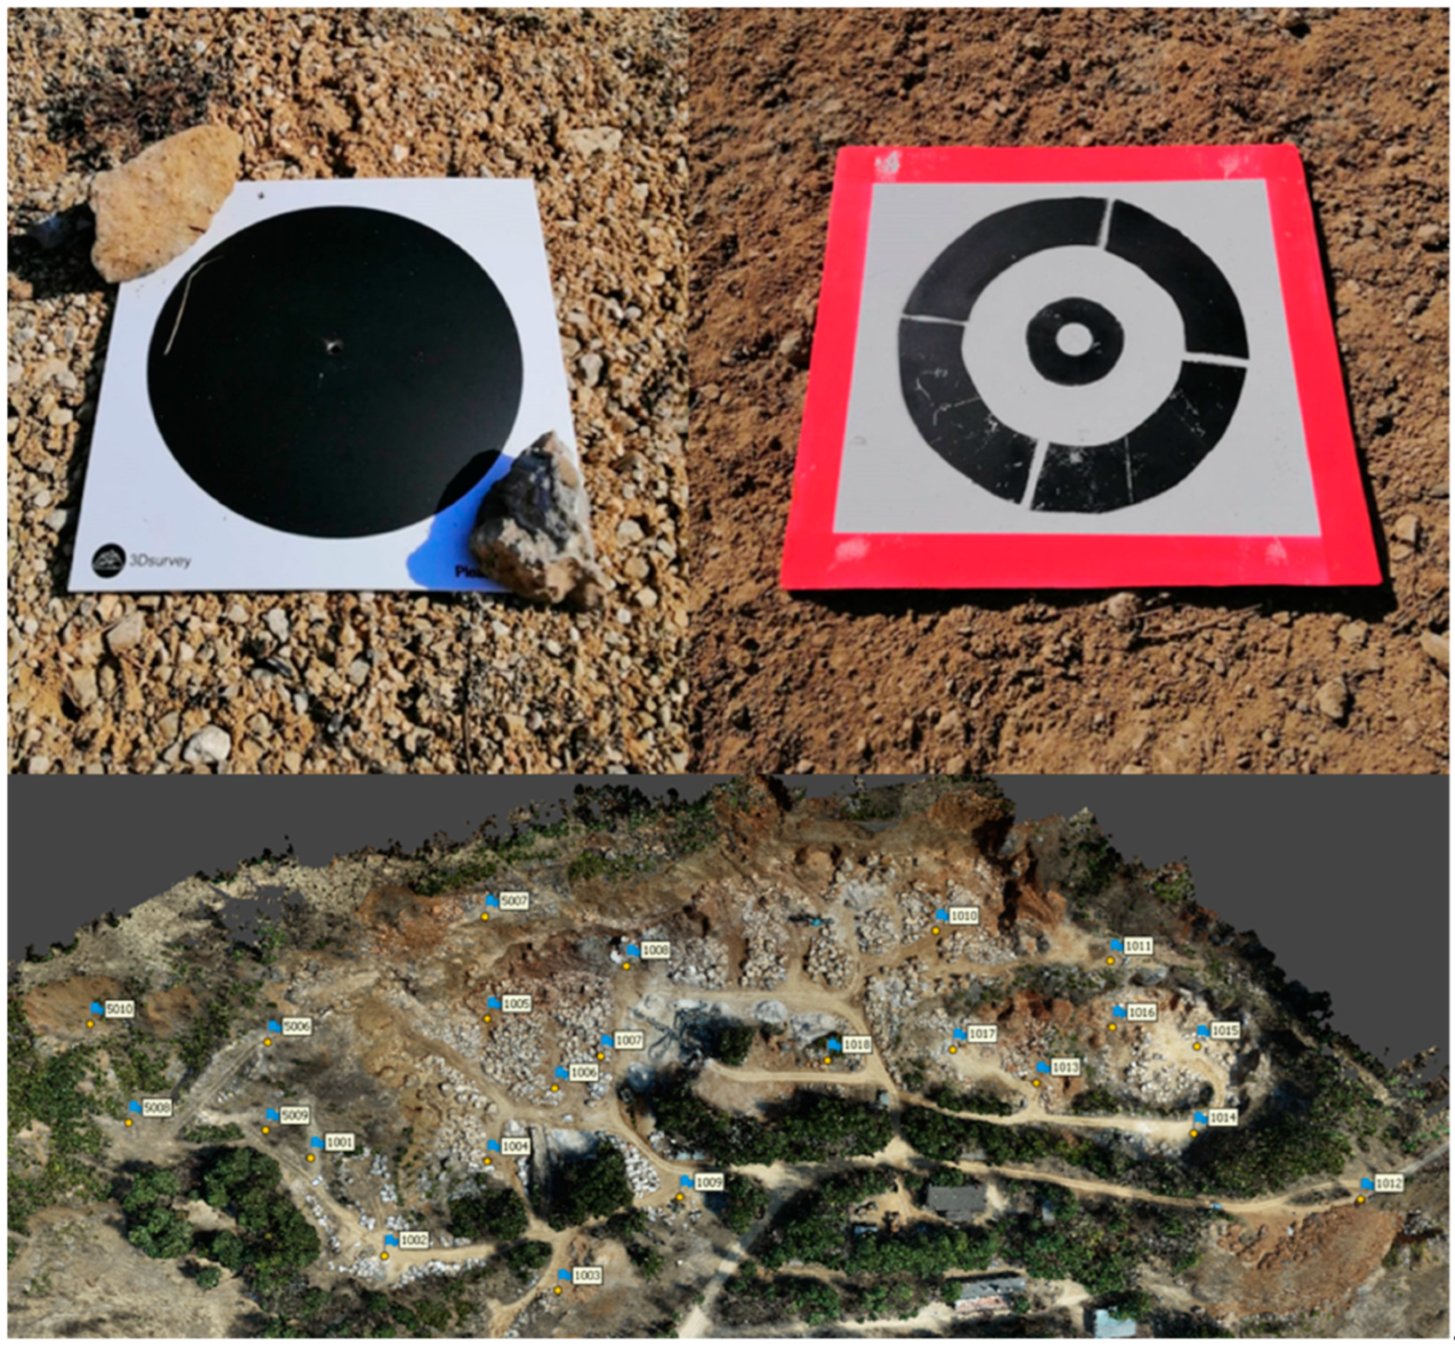
In the research area, a total of 23 temporarily stabilized GCPs were positioned to georeferenced point clouds. A dual-frequency GNSS receiver Leica GS07 (Figure 2) and quick static method were used to measure the coordinates of GCPs for photogrammetry and TLS. As a reference network for GNSS measurements using the RTK method, the Leica SmartNet service was utilized. Table 1 presents the attributes of the Leica GS07 GNSS receiver. GCPs were represented by 3D survey targets and circular black-and-white targets with red margins to improve field visibility (Figure 3). GCPs for UAS photogrammetry were distributed evenly throughout the area.
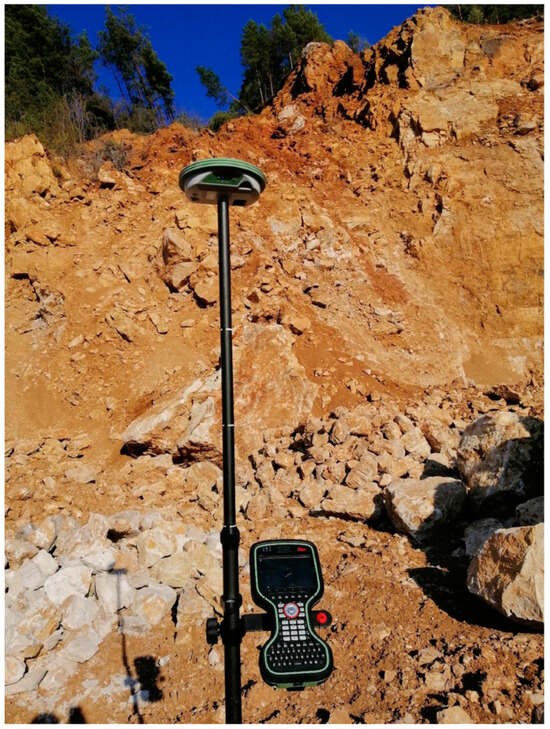
Figure 2.
GNSS rover, Leica GS07, in quarry.

Table 1.
Technical parameters of GNSS rover Leica GS07 [59].

Figure 3.
Types of GCPs for SfM photogrammetry and their distribution.
At each position, at least 3 temporary Leica GZT21 HDS 4.5 black and white circular scanning targets (Leica Geosystems AG, Heerbrugg, Switzerland) (Figure 4) were scanned separately, which served as GCPs for the TLS method. The coordinates of the 11 GCPs for the TLS were determined by the GNSS Leica GS07 with Real Time Network (RTN) corrections.
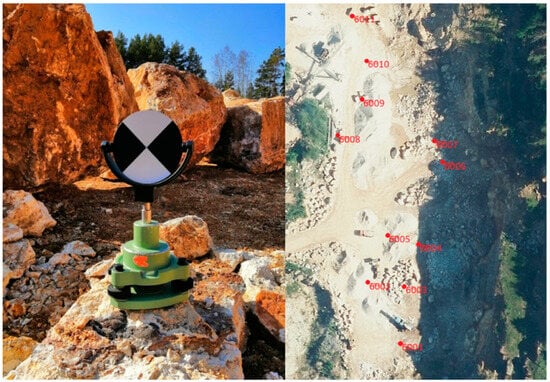
Figure 4.
GCPs for TLS and their distribution.
3.2. Measurement by UAS Photogrammetry
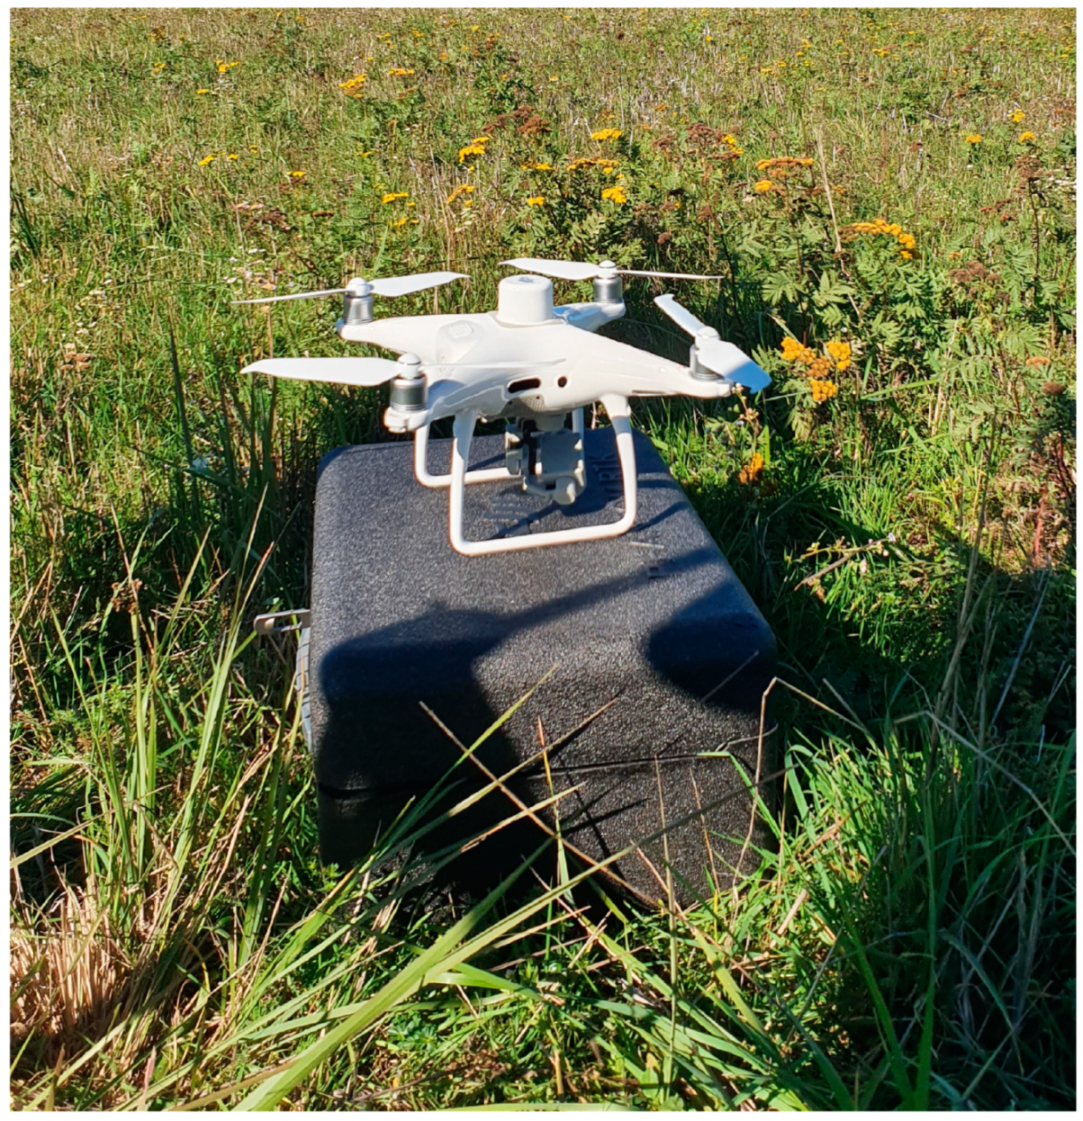
First, a DJI Phantom 4 RTK UAS (Figure 5) equipped with an FC6310R digital camera with a resolution of 4864 × 3648 pixels, a CMOS sensor of 13.2 × 8.8 mm, and a focal length of 8.8 mm was used to measure and document the terrain using this method. Subsequently, a DJI Phantom 4 Pro UAS equipped with a digital camera with a 20 Mpix CMOS sensor, a resolution of 5472 × 3648 pixels, and an automatic mode with a fixed ISO (100) was used to obtain nadir images. A comparison of the technical parameters of both UAS carriers is shown in Table 2.
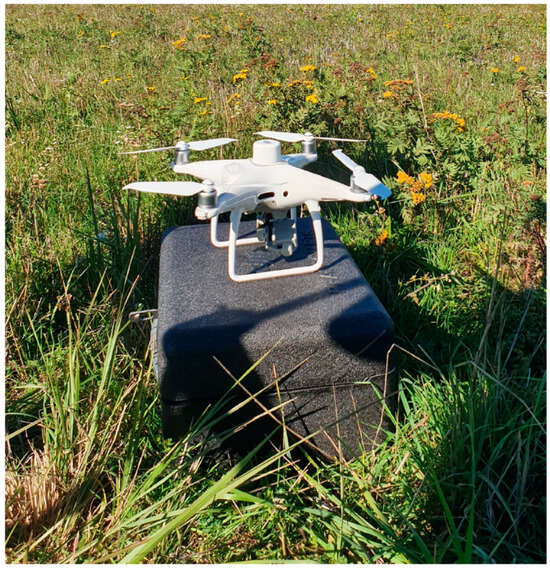
Figure 5.
UAS DJI Phantom 4 RTK.
Table 2.
Comparison of technical parameters of UAS DJI Phantom 4 Pro and DJI Phantom 4 RTK UAS [60,61].
Four different flights were used to complete the measurement using the UAS DJI Phantom 4 RTK. Using a flight plan that was made in the DJI GS v. 2.0.17. field software, three flights were performed, each taking a 70-m flight height of the area. For imaging on this flight, a double-grid mission was employed. The UAS was manually piloted during its most recent flight. The first flight yielded 430 images, followed by 285 images on the second, 356 images on the third flight, and 175 images on the fourth. In total, 1246 pictures were taken. The gimbal tilt was set at 30°, and the longitudinal and transversal image overlap values were 70%. Twenty-three GCPs for photogrammetry were used, evenly spaced around the region, for georeferencing the point cloud. All flights lasted for almost 2.5 h in total. The tilt of the camera and the orientation of the transverse axes perpendicular to the quarry wall presuppose a better capture of details and the completeness of this cloud of points.
The UAS DJI Phantom 4 Pro was then used to perform a fly to capture nadir photographs. The Pix4Dcapture v. 4.11.0 field software was used to design the flight, which was executed at a height of 98 m. Since the gimbal tilt was adjusted to 90°, a higher flying height was selected for the nadir shots to capture the entire area and quarry wall. A single-grid flight mission was set in this flight, with flight lines in parallel with the quarry wall. In about fifty minutes, 289 pictures were taken during this flight mission. For georeferencing, the identical 23 GCPs from photogrammetry were used, with an 80 percent longitudinal and transversal overlap setting. Table 3 presents a comparison of the measurement parameters for both UAS missions. Figure 6 displays the camera positions during flights. We expect Lower quality of point cloud obtained by nadir imaging, especially on vertical walls.
Table 3.
Parameters of flight missions.
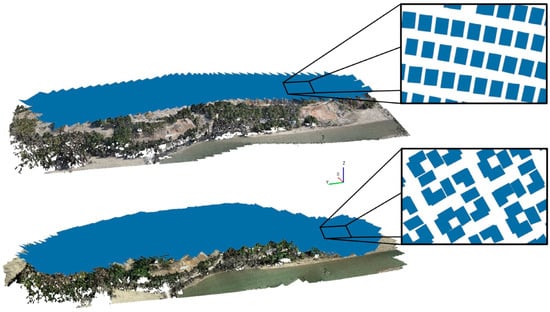
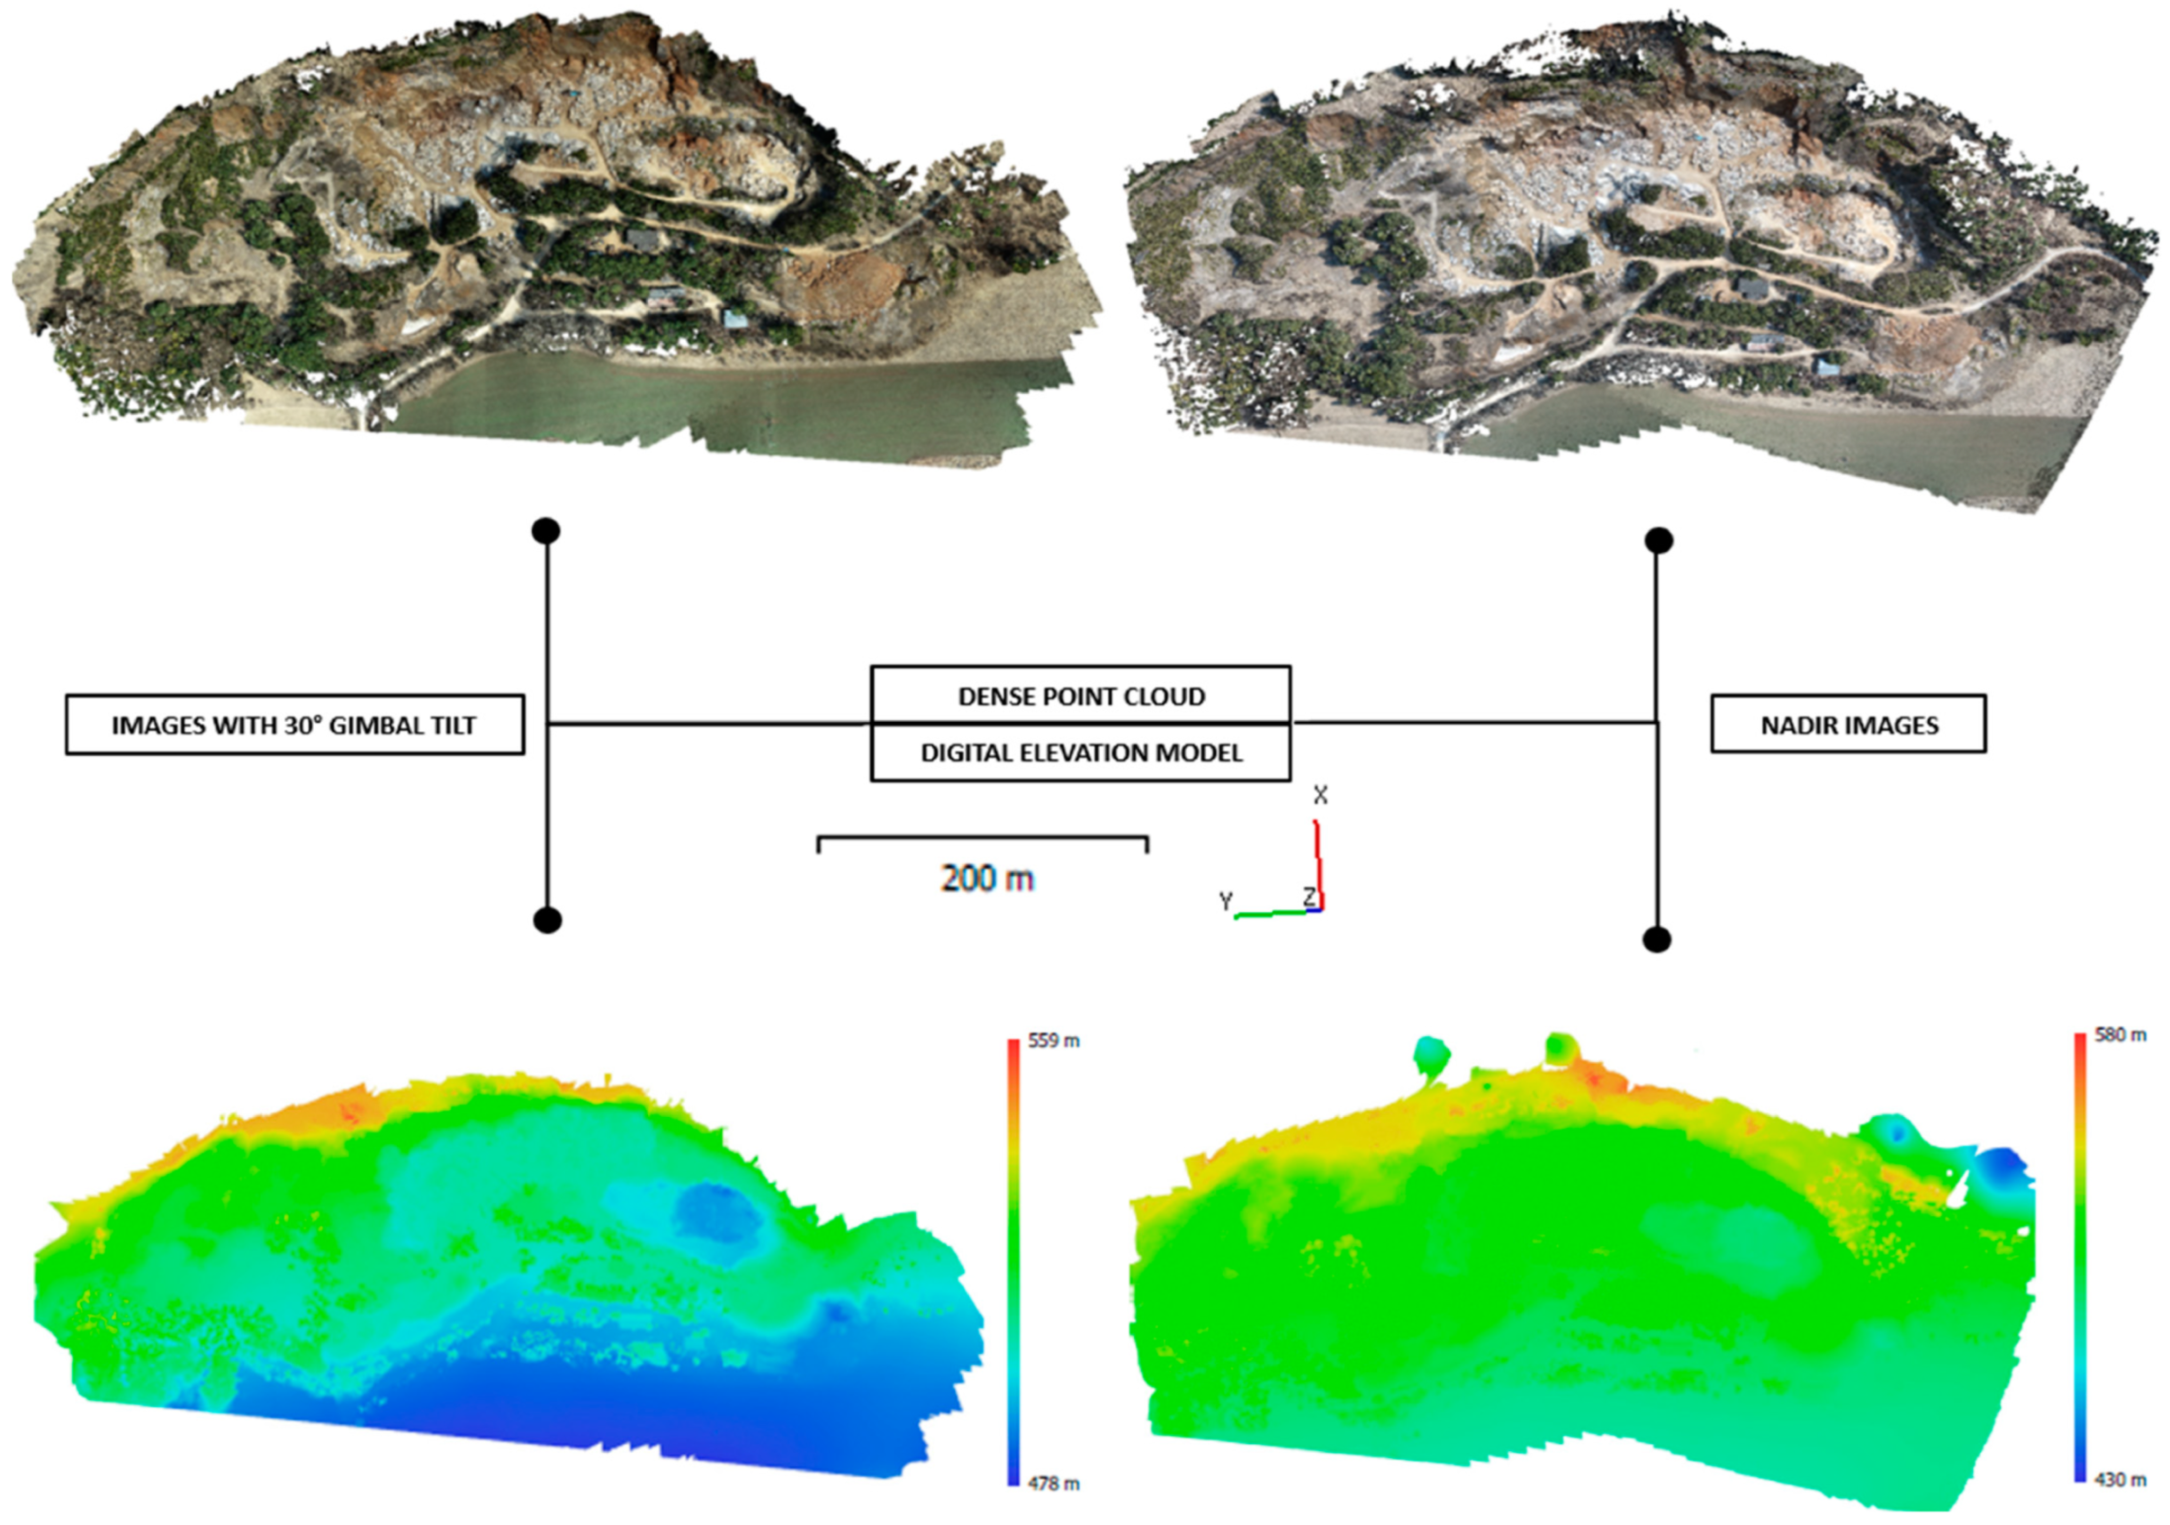
Figure 6.
Comparison of camera position for nadir images (top) and images with a 30° gimbal tilt (bottom).
The data were processed in a computer environment after being collected through field measurements in the research area utilizing UAS photogrammetry and TLS technologies. Agisoft Metashape Professional 1.8.0 (Agisoft LLC, St. Petersburg, Russia) was used to process data acquired using UAS photogrammetry. In photogrammetric processing, it is necessary for the images to contain spatial coordinate data directly from the camera, allowing such images to be further processed as their spatial orientation is known. The images were processed using the SfM method. The main principle of this method is to estimate the three-dimensional structure of a spatial object based on two-dimensional image sequences. The position of the cameras and the geometry of the scene are simultaneously reconstructed using SfM by automatically identifying matching features. These matching features are called key points, which are identified using various algorithms in Agisoft Metashape Professional software.
Images with a 30° gimbal tilt were taken using a DJI Phantom 4 RTK UAS equipped with a digital camera, which captured 1246 images in four flights. After importing them into the Agisoft Metashape Professional 1.8.0 software and aligning them with the highest quality, tie points were created, consisting of 945,534 points. Subsequently, the point cloud was georeferenced using GCPs. The Root Mean Square Error (RMSE) when processing this model is 2.70 cm. A dense point cloud with high quality and moderate depth filtering was created in 9 h and 23 min and consisted of 167,818,865 points. Subsequently, we created a DEM from the dense point cloud, the resolution of which is 7.08 cm/pix, and the point density is 200 points/m2. The DEM was generated in 55 s and defined the lowest and highest points in the study area. The lowest point in our area of interest is 478 m above sea level (ASL), and the highest point is 559 m ASL. Other parameters of the point cloud obtained using images with a 30° gimbal tilt are shown in Table 4.
Table 4.
Parameters of processed point clouds by UAS photogrammetry.
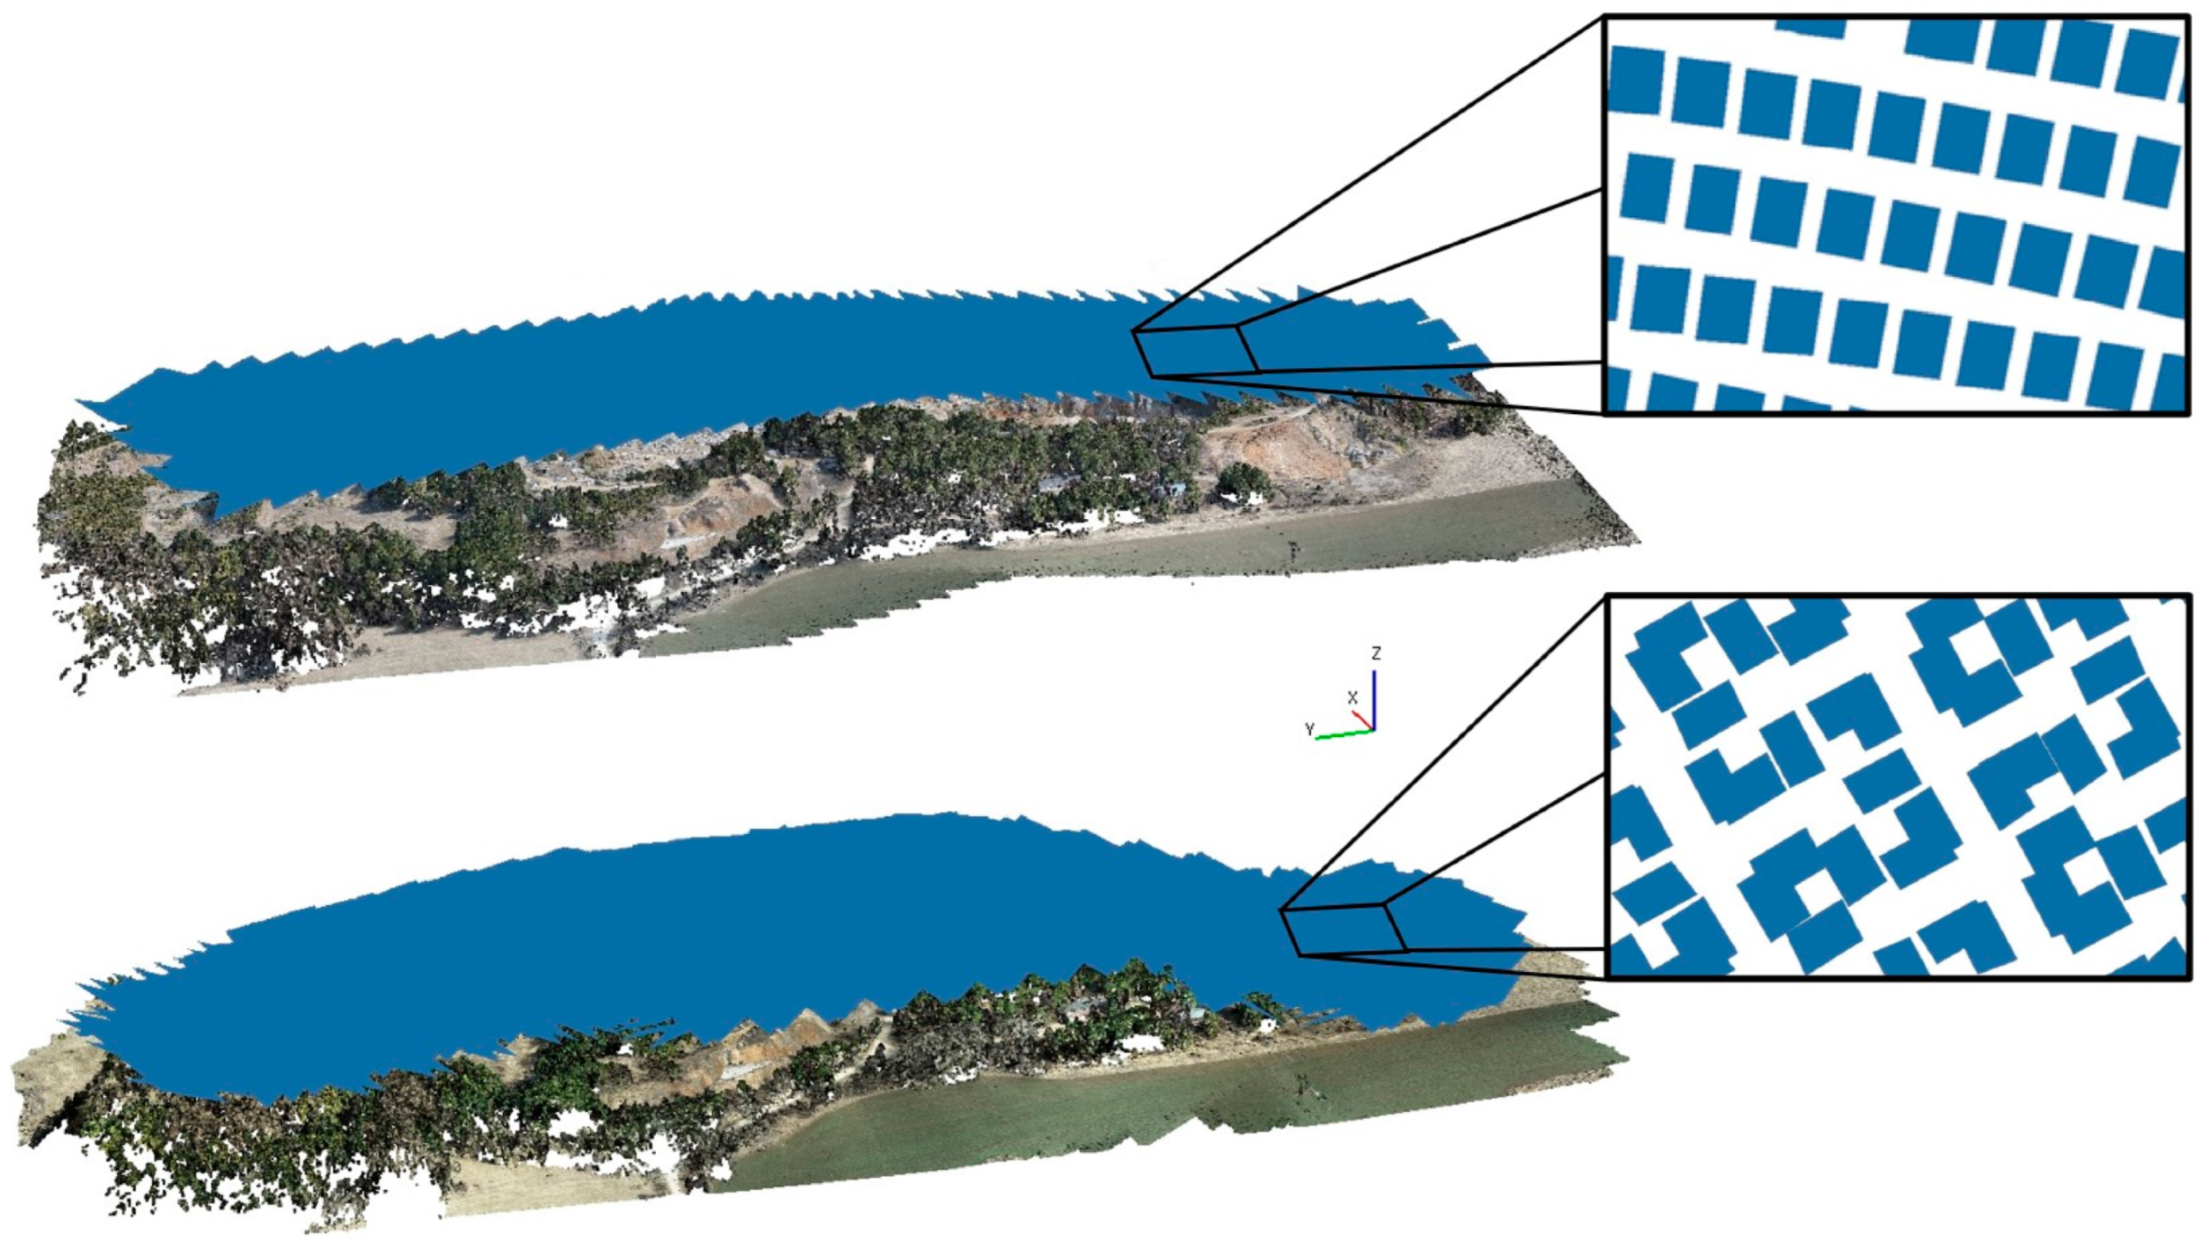
Nadir images were acquired using the DJI Phantom 4 Pro UAS and processed in the same way in the Agisoft Metashape Professional 1.8.0 software. The tie points were created after aligning 289 images with the highest quality and contained 770,698 points. The dense cloud was created at high quality with moderate depth filtering and contained 85,416,175 points. RMSE on GCPs reached values in the X coordinate—0.70 cm, in the Y coordinate—0.70 cm, in the Z coordinate—0.32 cm, and the overall RMSE value was 1.01 cm. The DEM was created with a point density of 427 points/m2 and a resolution of 4.84 cm/pix. Additional parameters of the point cloud obtained using nadir images are shown in Table 4. The resulting dense point clouds and DEM for images with a 30° gimbal tilt and nadir images are shown in Figure 7.
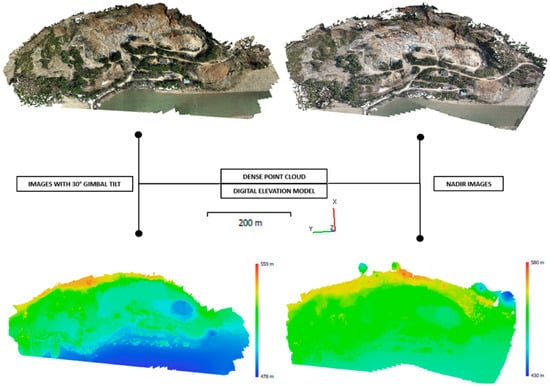
Figure 7.
Dense point clouds and DEM for 30° gimbal tilt and nadir images.
3.3. Measurement by TLS Method
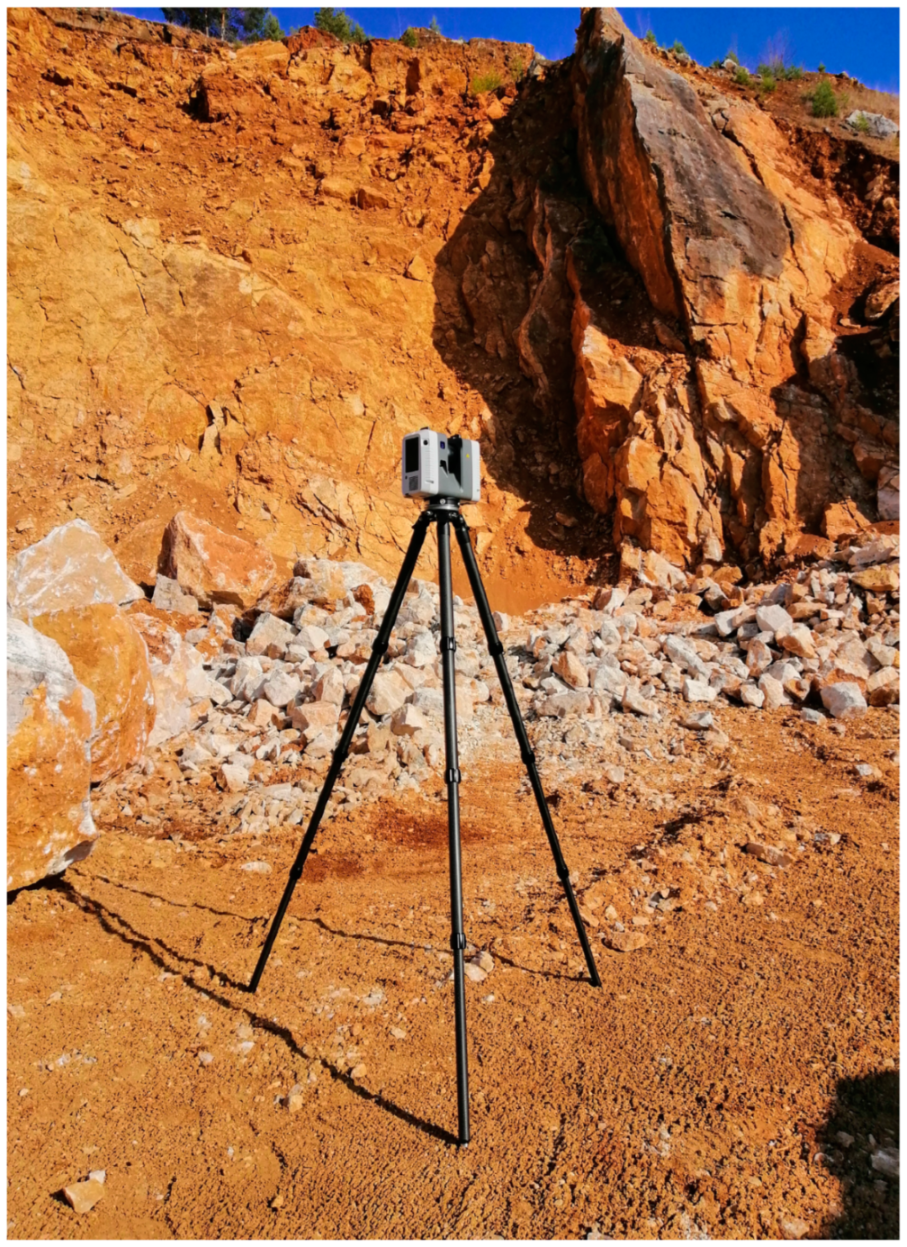
We employed the TLS approach in the Dreveník study region to quantify landslides that occurred in a quarry. This landslide was surveyed with a Leica RTC360 terrestrial laser scanner (Figure 8). The most notable advancement of this instrument is the automatic point cloud registration in the field using Visual Inertial System (VIS) technology. This minimizes processing time, and double-scan mode enables the automatic removal of moving objects. Table 5 presents a selected instrument’s technical parameters.
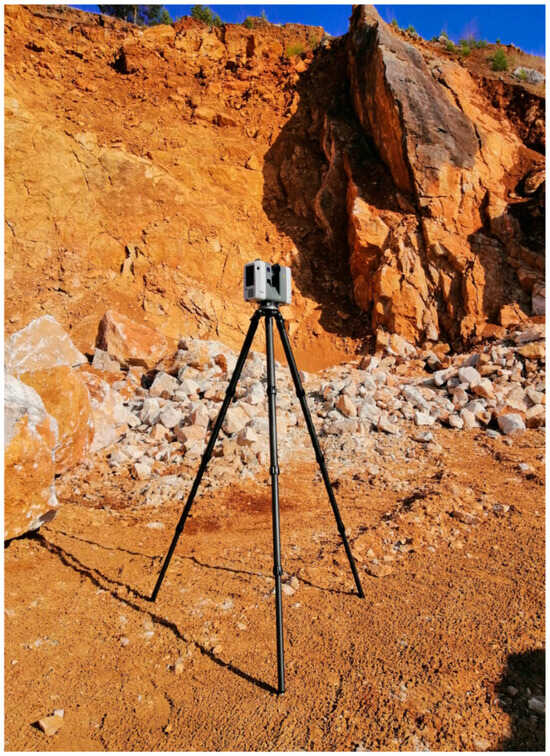
Figure 8.
3D Laser Scanner, Leica RTC360.
Table 5.
Technical parameters of TLS Leica RTC360 [62].
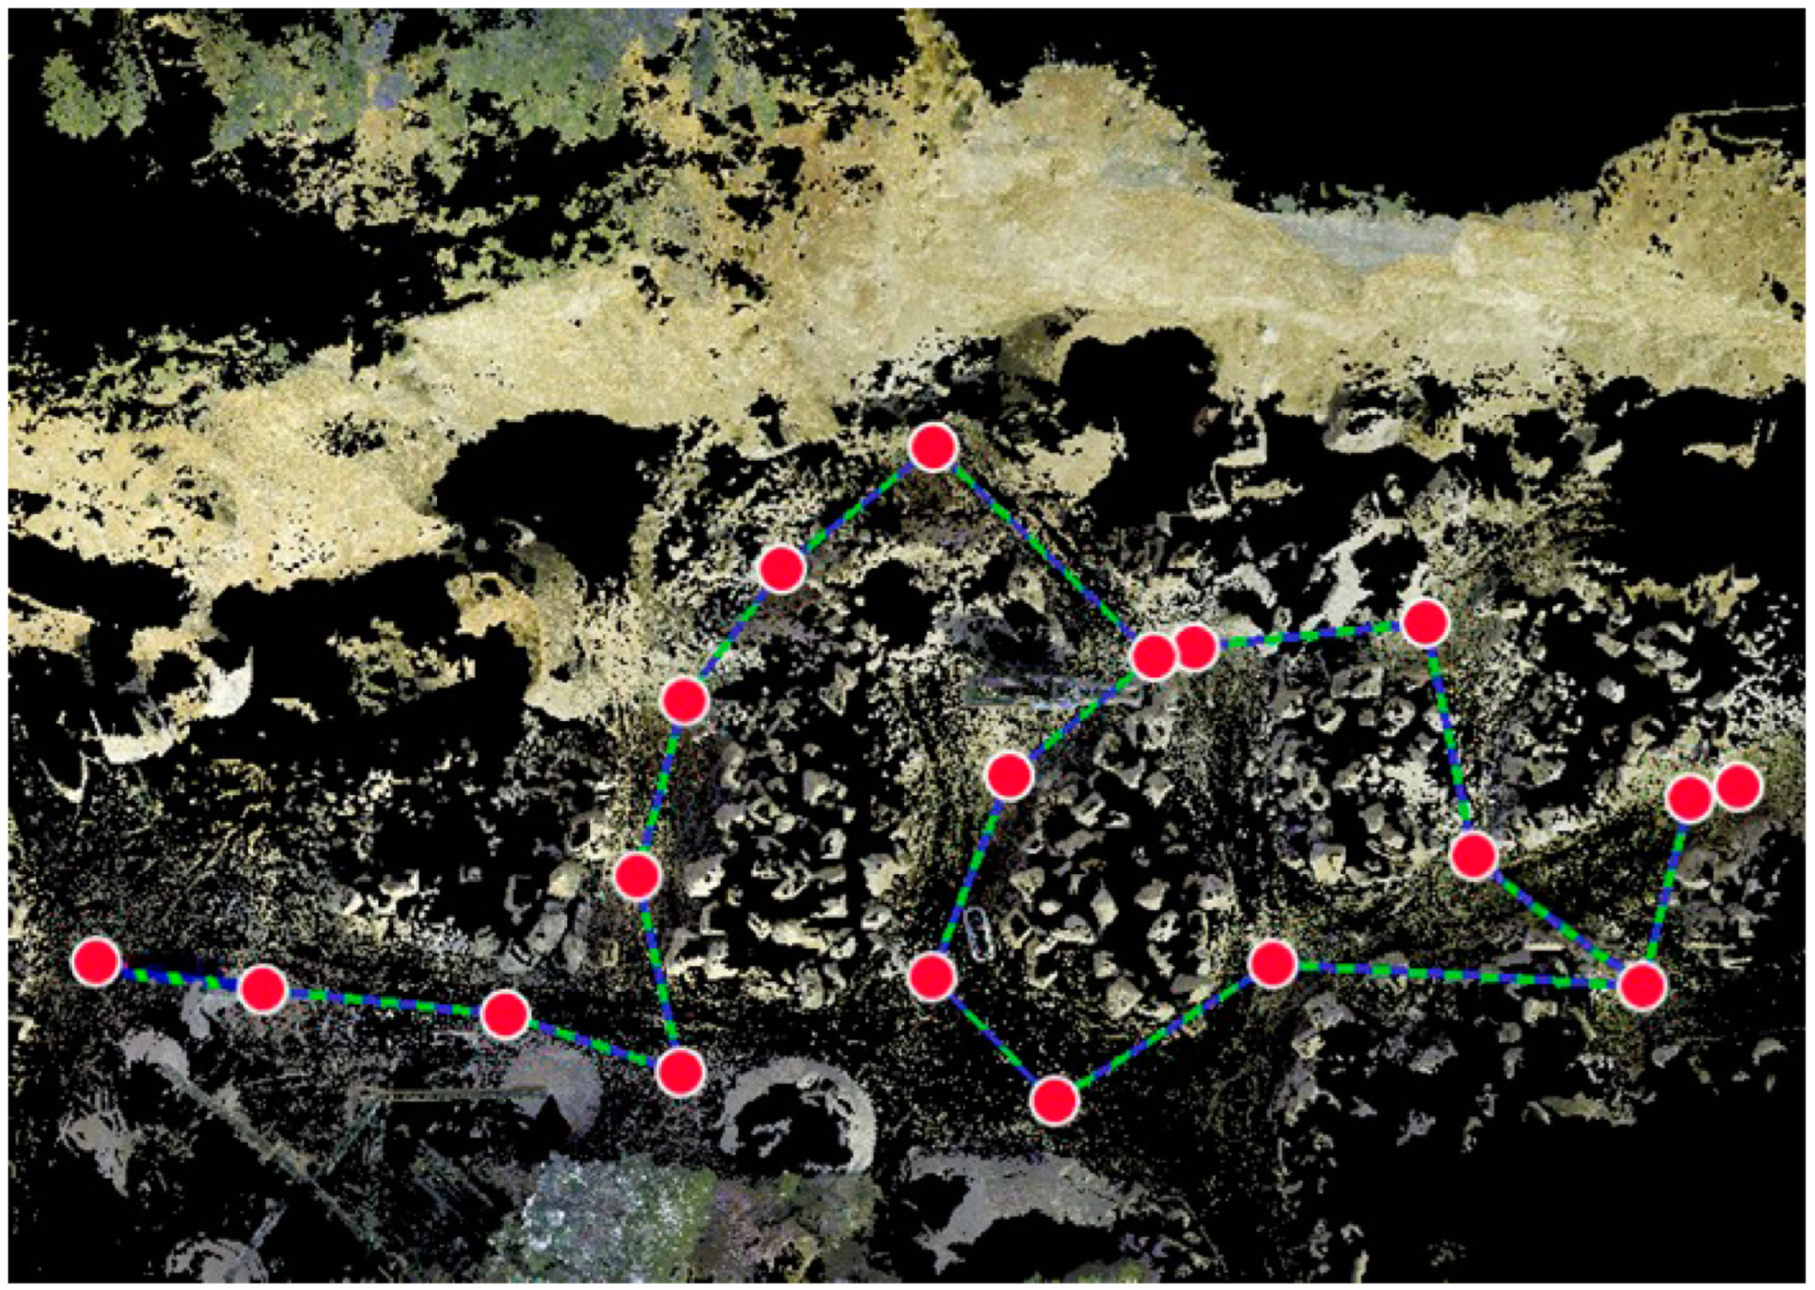
In approximately one hour, 19 positions (Figure 9) were used for the TLS technique measurement. At least three GCPs were independently scanned at each stand. Individual point clouds were registered to a common coordinate system using these GCPs. On 19 positions, the scanner’s resolution was set to 6 mm/10 m with a range of 130 m.
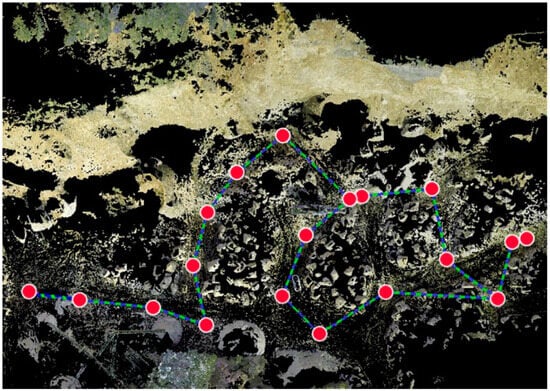
Figure 9.
Positions of TLS measurement (red dots) with registration links (green-blue lines).
Using the terrestrial scanner Leica RTC 360, the TLS data of the landslide in the study area were obtained, which were processed in the Leica Cyclone REGISTER 360 software. After importing data from 19 stations and scanning registration, the resulting point cloud consisted of 409,735,649 points with an overlap of 74% and a strength of 78%. The value of bundle error reached 0.007 m, and Cloud-to-Cloud error was also 7 mm. Subsequently, we georeferenced the point cloud using 11 GCPs for the TLS method where the RMSE value was 1.8 cm. Parameters of the processed point cloud by TLS are shown in Table 6.
Table 6.
Parameters of processed point clouds by TLS.
4. Results
In this chapter, we present the results of our study focusing on the spatial analysis of point clouds obtained through SfM photogrammetry and TLS methods in a quarry environment. The comparison of point clouds based on various parameters serves as a critical aspect of our investigation, shedding light on the efficacy and applicability of these two prominent techniques in capturing the complex topographical features of quarry landscapes. Through the utilization of SfM photogrammetry and TLS methods, we have amassed comprehensive datasets of the quarry environment, each offering distinct advantages and limitations. By systematically evaluating these datasets across different parameters, including point density, accuracy, and geometric detail, we aim to provide insights into their respective capabilities and suitability for quarry characterization and monitoring purposes. The comparison of individual point clouds was carried out using CloudCompare v. 2.13 and Leica Cyclone 3DR v. 2023.1 software. All individual compared areas were identical for the point clouds obtained by different methods. Therefore, they were trimmed in one step using a rectangular fence.
4.1. UAS Photogrammetry—Comparison of Images with 30° Gimbal Tilt and Nadir Images
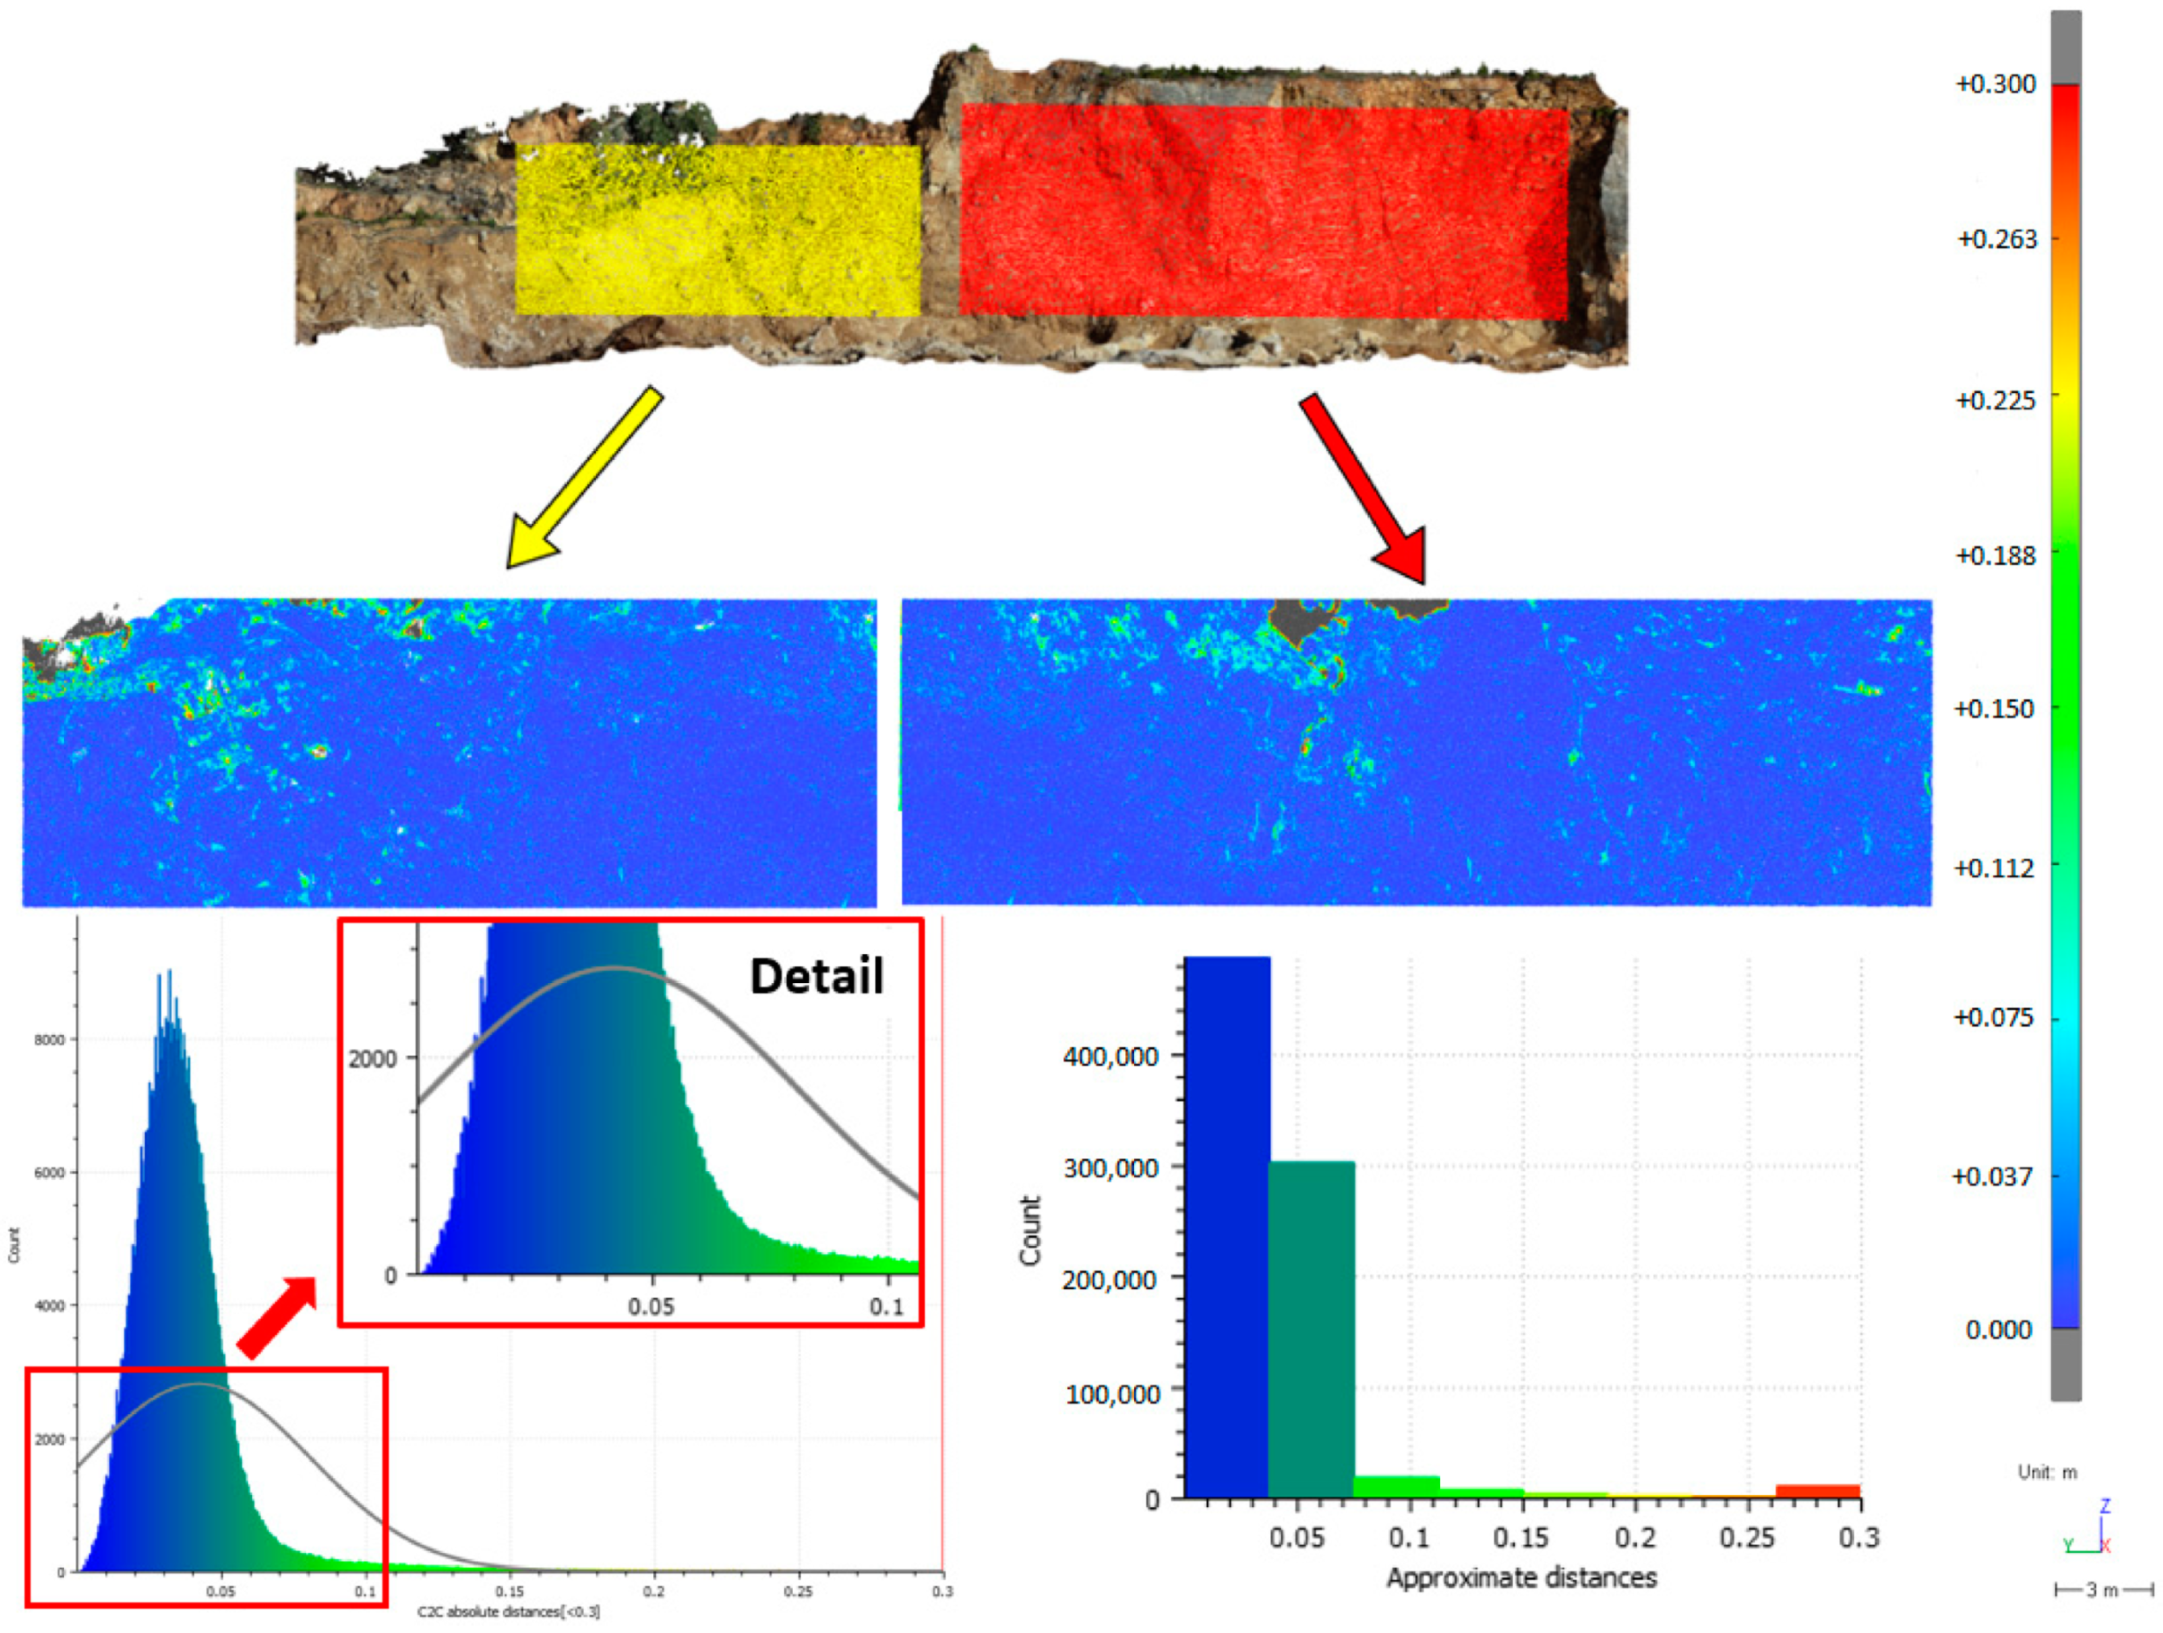
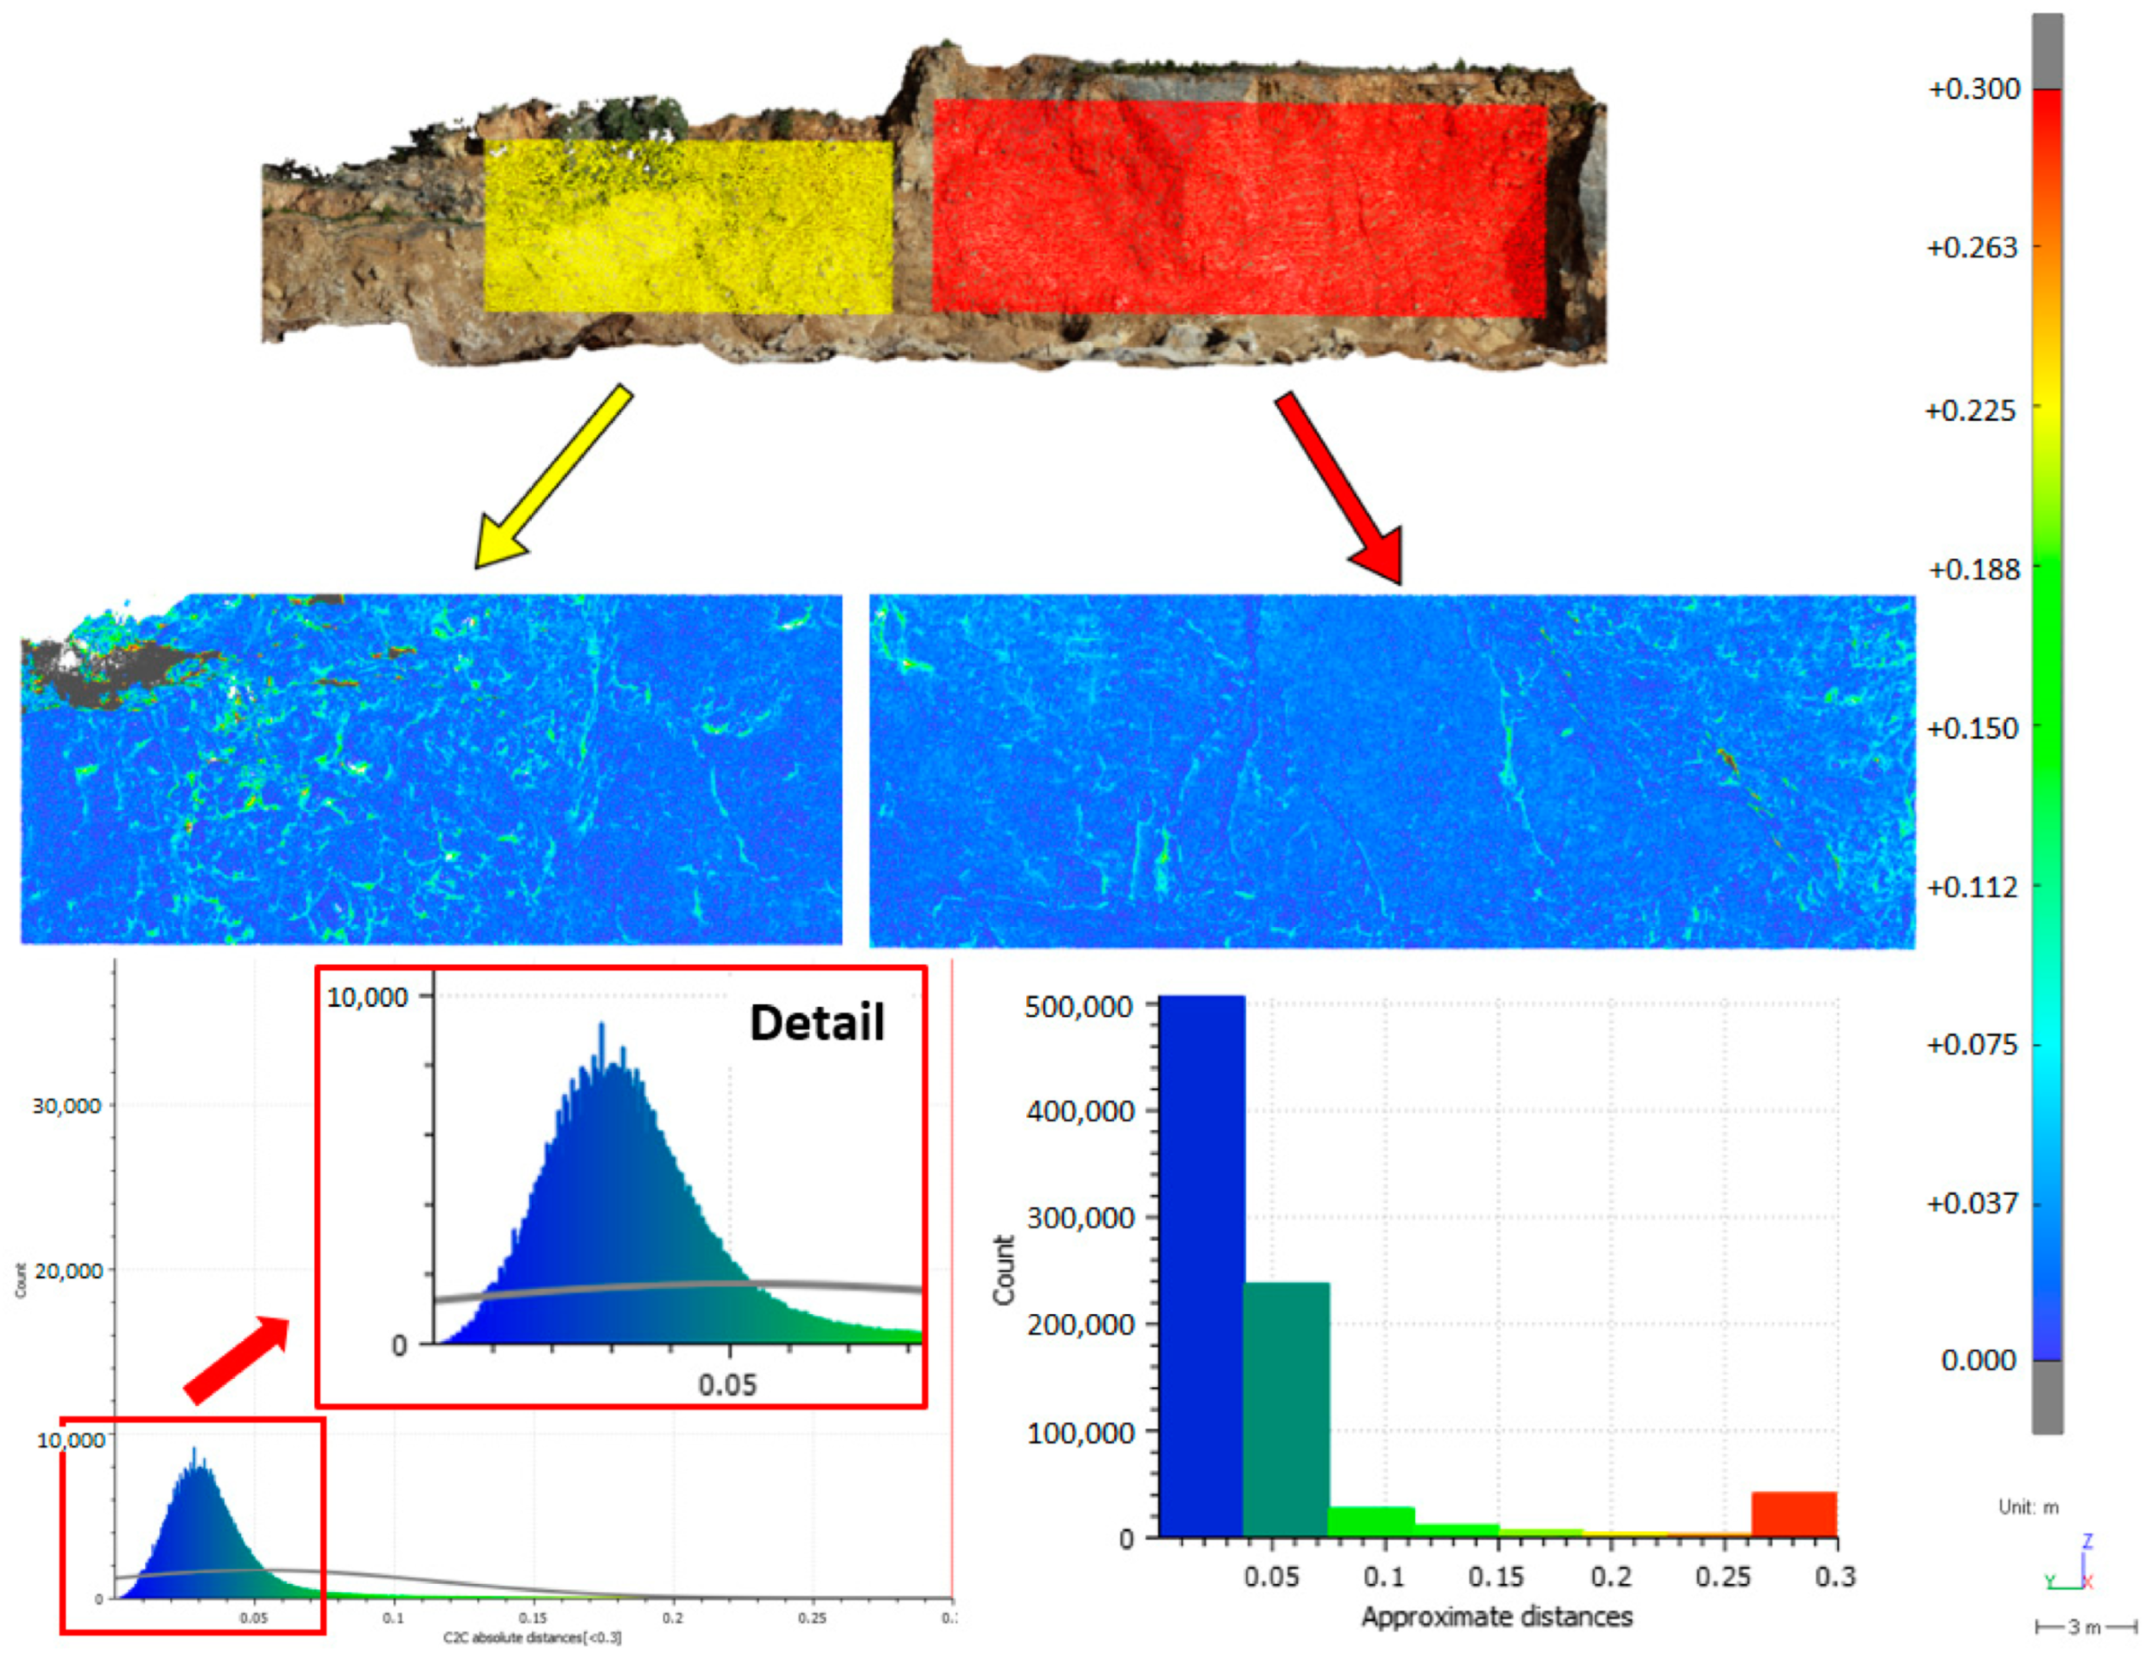
The comparison of both point clouds obtained by UAS photogrammetry was also carried out on a specific part of the territory—the mining wall. Two sectors were selected on the mining wall and compared (Figure 10). The smaller sector marked in yellow is in an area where landslides occur without the presence of human activity and where there is vegetation. The larger sector in red represents the part of the wall on which active mining activity is carried out. The comparison was made in the Leica Cyclone 3DR program based on the Cloud/Cloud Distance function. A point cloud made from images with a 30° gimbal tilt was chosen as the reference point cloud. The point cloud created from nadir images was chosen as the comparison point cloud. On the output of the difference between point clouds on the mining wall, it is possible to observe differences between the point clouds from 0 to 30 cm.
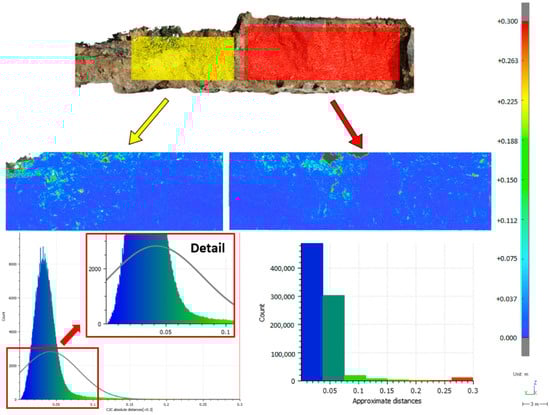
Figure 10.
Comparison of point clouds from both UAV photogrammetry measurements on the mining wall.
When comparing the point clouds on the mining wall, it is possible to observe that the largest representation of points is in the range of 0 to 6 cm. The values of the comparison of both point clouds on the mining wall are shown in Table 7. Almost 96% of the points are in the range from 0 to 6 cm. Places where there is insufficient coverage of both point clouds are marked in gray color, due to the low density of the compared point cloud and the incomplete removal of vegetation. Comparisons between point clouds were also made based on statistical methods. The standard deviation has a value of 0.039 m, and the mean in comparison was 0.042 m. The maximum distance between the compared clouds was 0.757 m, and the average absolute distance was 6 mm. The point cloud obtained by UAS with a 30° gimbal tilt achieves a higher density.
Table 7.
Comparison values of both point clouds on the mining wall.
The same analysis was also carried out on the ground surface of the quarry. A point cloud created from images with a 30° gimbal tilt was chosen as the reference point cloud. A point cloud obtained from nadir images was used as a comparison point cloud. The values of the comparison of both clouds obtained through UAS methods on the ground surface are presented in Table 8. In this case, when comparing point clouds on the ground surface, more than 85% of the points were between 0 and 5 cm. The point cloud from the UAS with a 30° gimbal tilt also achieves a higher density in this analysis. When comparing the point clouds, the maximum distance, average absolute distance, mean, and standard deviation were calculated. In this case, the maximum distance between the compared point clouds is 0.405 m, and the average absolute distance reached a value of only 2 mm. The standard deviation was 2.9 cm. In Figure 11, however, we can also observe places marked in gray. The distance between the two point clouds in these places exceeds 30 cm due to the insufficient overlay of both point clouds.
Table 8.
Comparison values of both point clouds on the earth’s surface.
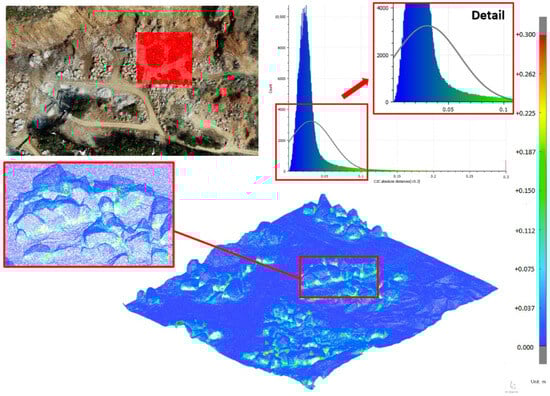
Figure 11.
Comparison of point clouds from both UAS photogrammetry measurements on the earth’s surface.
4.2. Comparison of Images with a 30° Gimbal Tilt from UAS Photogrammetry and TLS
After filtering out unnecessary points, the optimized point cloud consisted of 90,730,789 points. The point cloud from images with a 30° gimbal tilt obtained by UAS photogrammetry was also trimmed only to the area of the landslide and consisted of 7,088,939 points. The point clouds thus trimmed from both methods were ready for comparison.
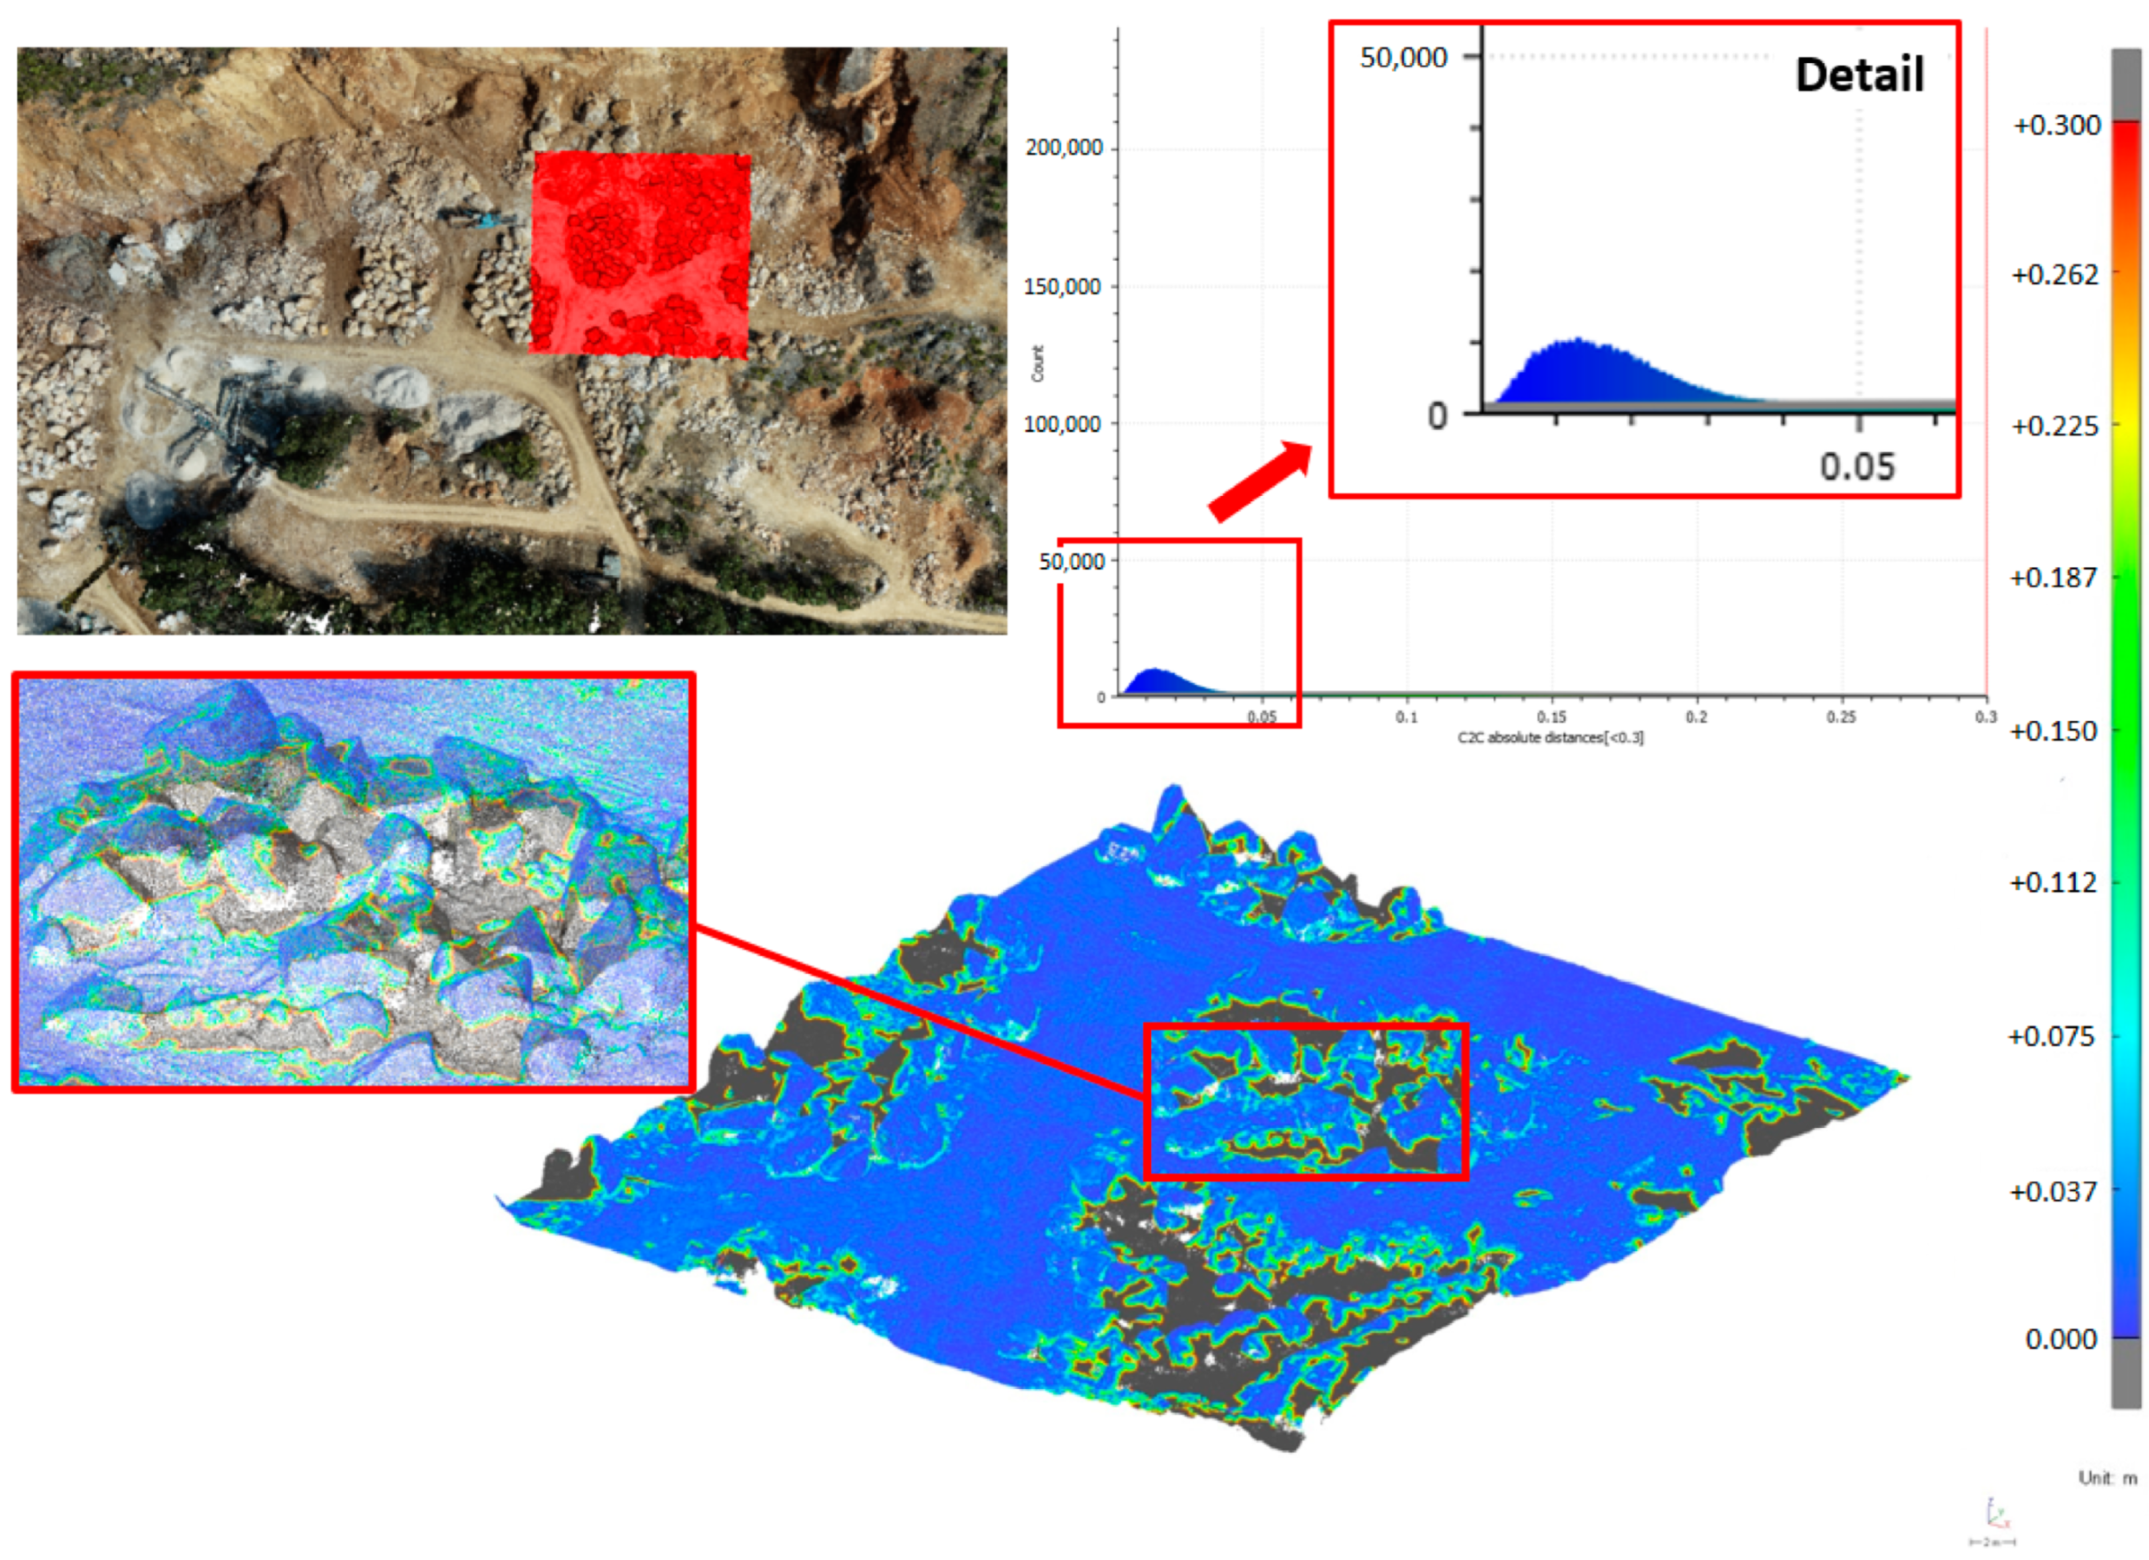
The point cloud obtained through UAS photogrammetry at 30° gimbal tilt was compared with the point cloud created by the TLS method in the Leica Cyclone 3DR software environment. The comparison was made on the mining wall of this quarry. After running the Cloud/Cloud Distance function in the Leica Cyclone 3DR software, the point cloud obtained by the TLS method was selected as the reference point cloud. The point cloud created by the photogrammetric method was chosen as the comparison point cloud. The point clouds were directly compared by determining the minimum distance of each point of the point cloud obtained by the UAS photogrammetry method to the irregular triangular mesh formed between the nearest six points of the point cloud obtained by TLS. The scale range was set to a value of 30 cm. Figure 12 shows all TLS points compared to points from UAS photogrammetry. It is possible to observe deviations between the point clouds from 0 to 30 cm on the output of the point cloud difference.

Figure 12.
Comparison of point clouds obtained by UAS photogrammetry with a 30° gimbal tilt and TLS on the mining wall.
The highest differences are detected in places where there is insufficient overlap between both point clouds. This is due to low point density, incomplete removal of vegetation, or obscured and dark areas when measuring by the TLS method. These errors are predominantly in the smaller sector, and insufficient overlap in this area reached 12%. The comparison values of the point clouds obtained through the UAS method with a 30° gimbal tilt and TLS on the mining wall are shown in Table 9. When comparing point clouds on the mining wall, it is possible to observe that the largest representation of points is located at a distance of up to 5 cm. After counting both areas, it has a sufficient overlap of more than 84% points. Points without overlap represent 15.7%. The TLS method is characterized by high density, which is also confirmed by this analysis. In the TLS method, the point density is more than 38,000 points/m2. In the CloudCompare software, we performed statistical analyses, based on which the maximum distance between the compared point clouds on the mining wall was 1.297 m, and the average absolute distance reached 0.053 m. The standard deviation in this comparison was 0.066 m.
Table 9.
Comparison values of point clouds from UAS with a 30° gimbal tilt and TLS on the mining wall.
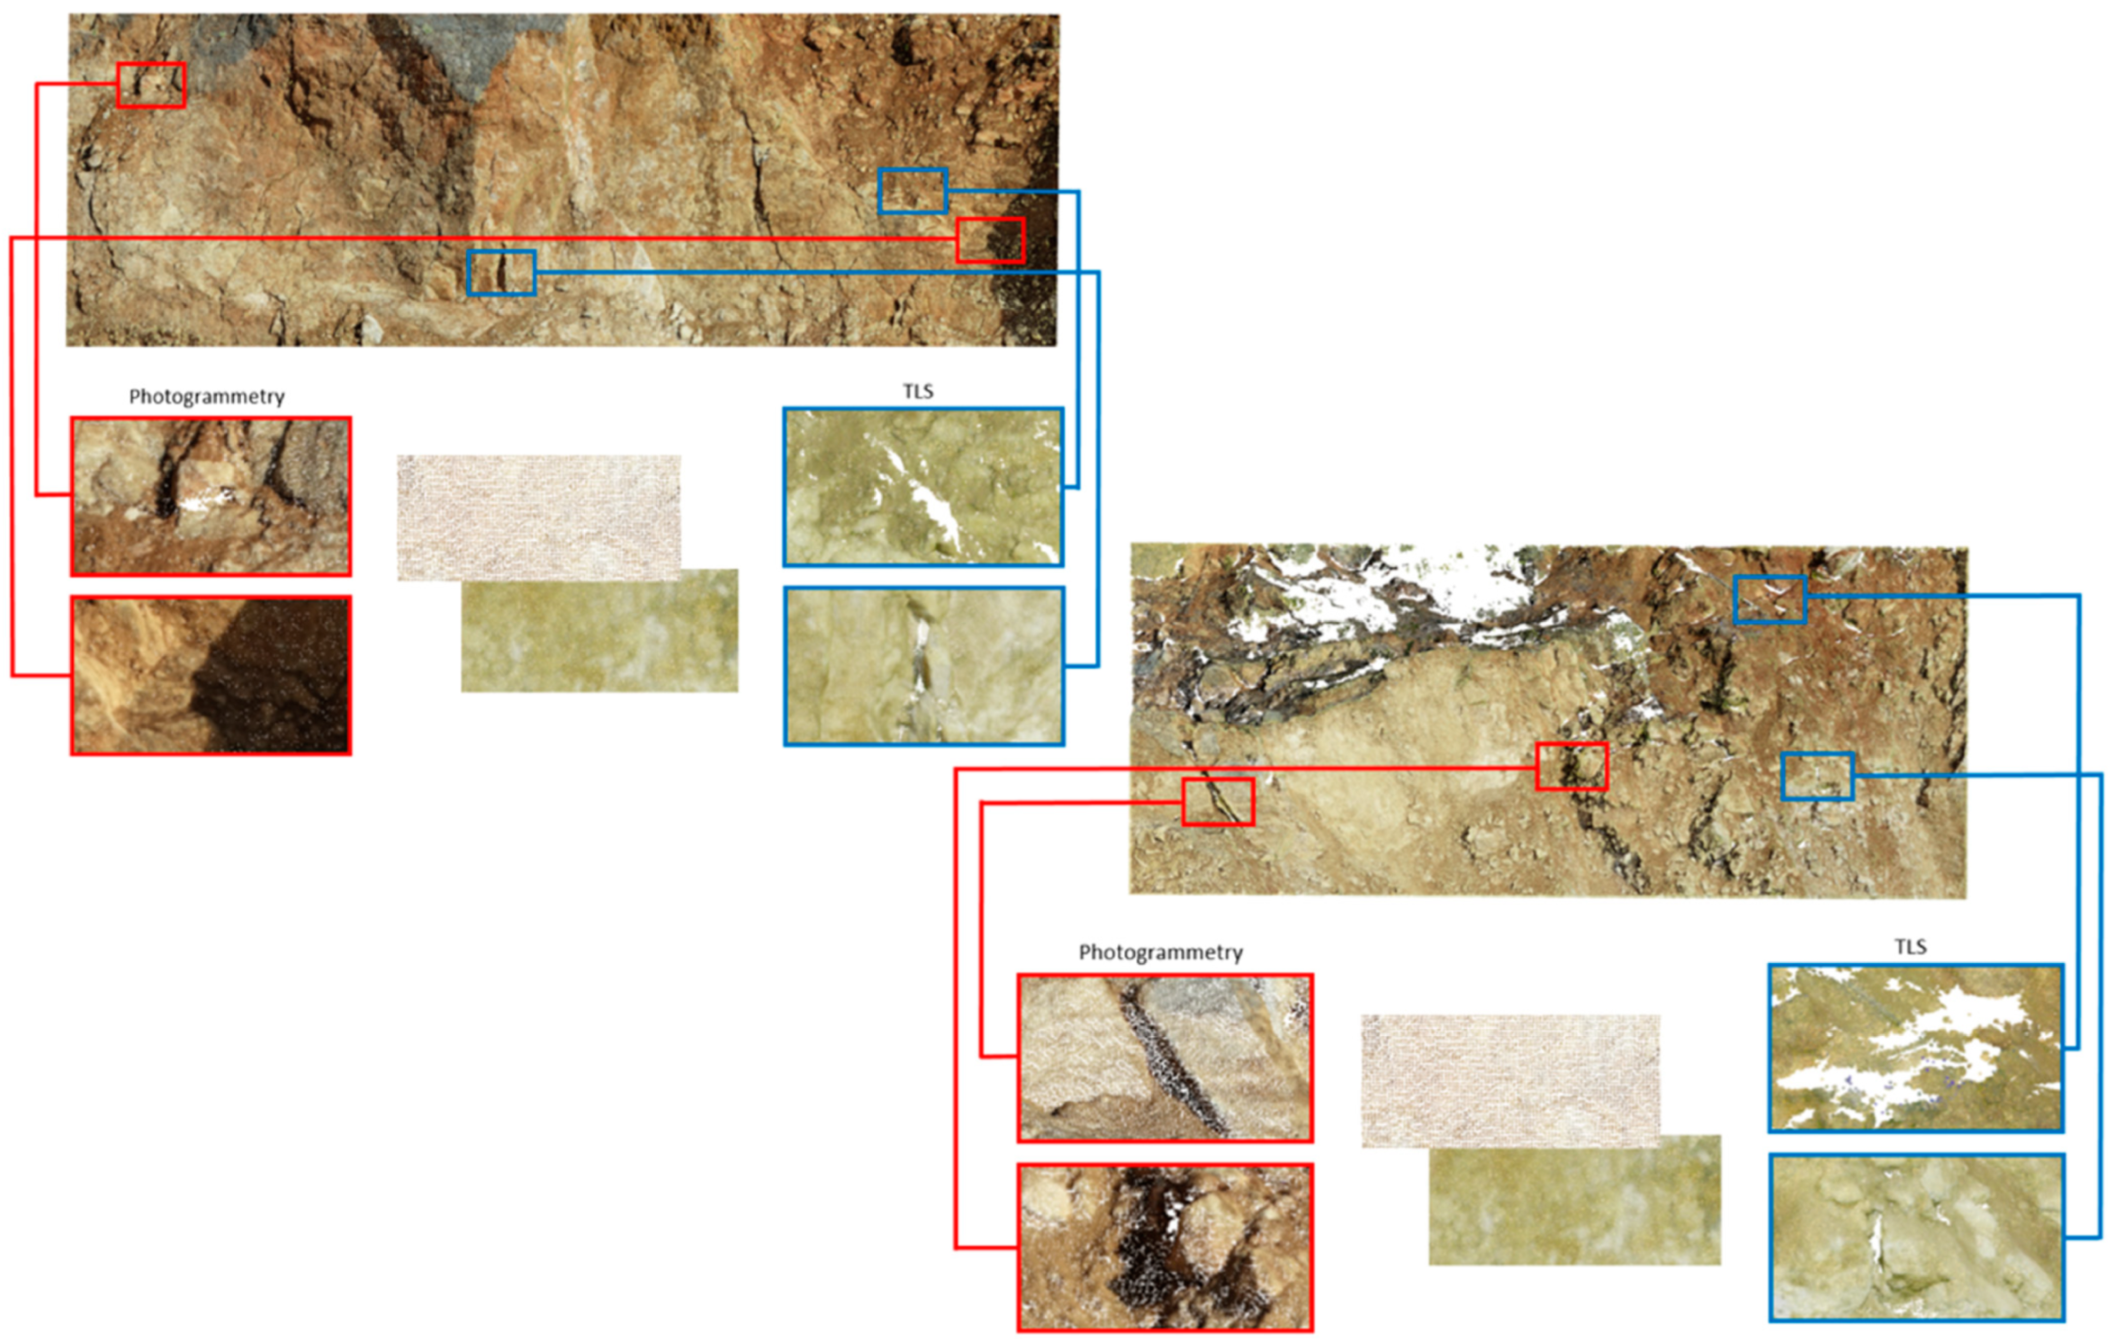
Every section of the mining wall was examined in detail, which led to the discovery of each method’s weaknesses, which are depicted in Figure 13. After data processing, shortcomings in the UAS photogrammetry point cloud were found. The locations where there was insufficient or occasionally no point density are among these errors. A hole in the point cloud is visible, as seen in the detail of the figure. The obscuration of locations that were not captured from a distance is the reason for this kind of mistake. The shadows and dark areas are another issue. There were still flaws in the TLS approach, as indicated by Figure 13, where the flaws are positioned on the mining wall. These are mainly non-dense locations that haven’t been scanned because of their location when using the TLS approach. These areas consist of either nearly no points or a minimum number of points.

Figure 13.
Shortcomings of methods presented by point clouds on the mining wall; blue frames—TLS, red frames— SfM photogrammetry.
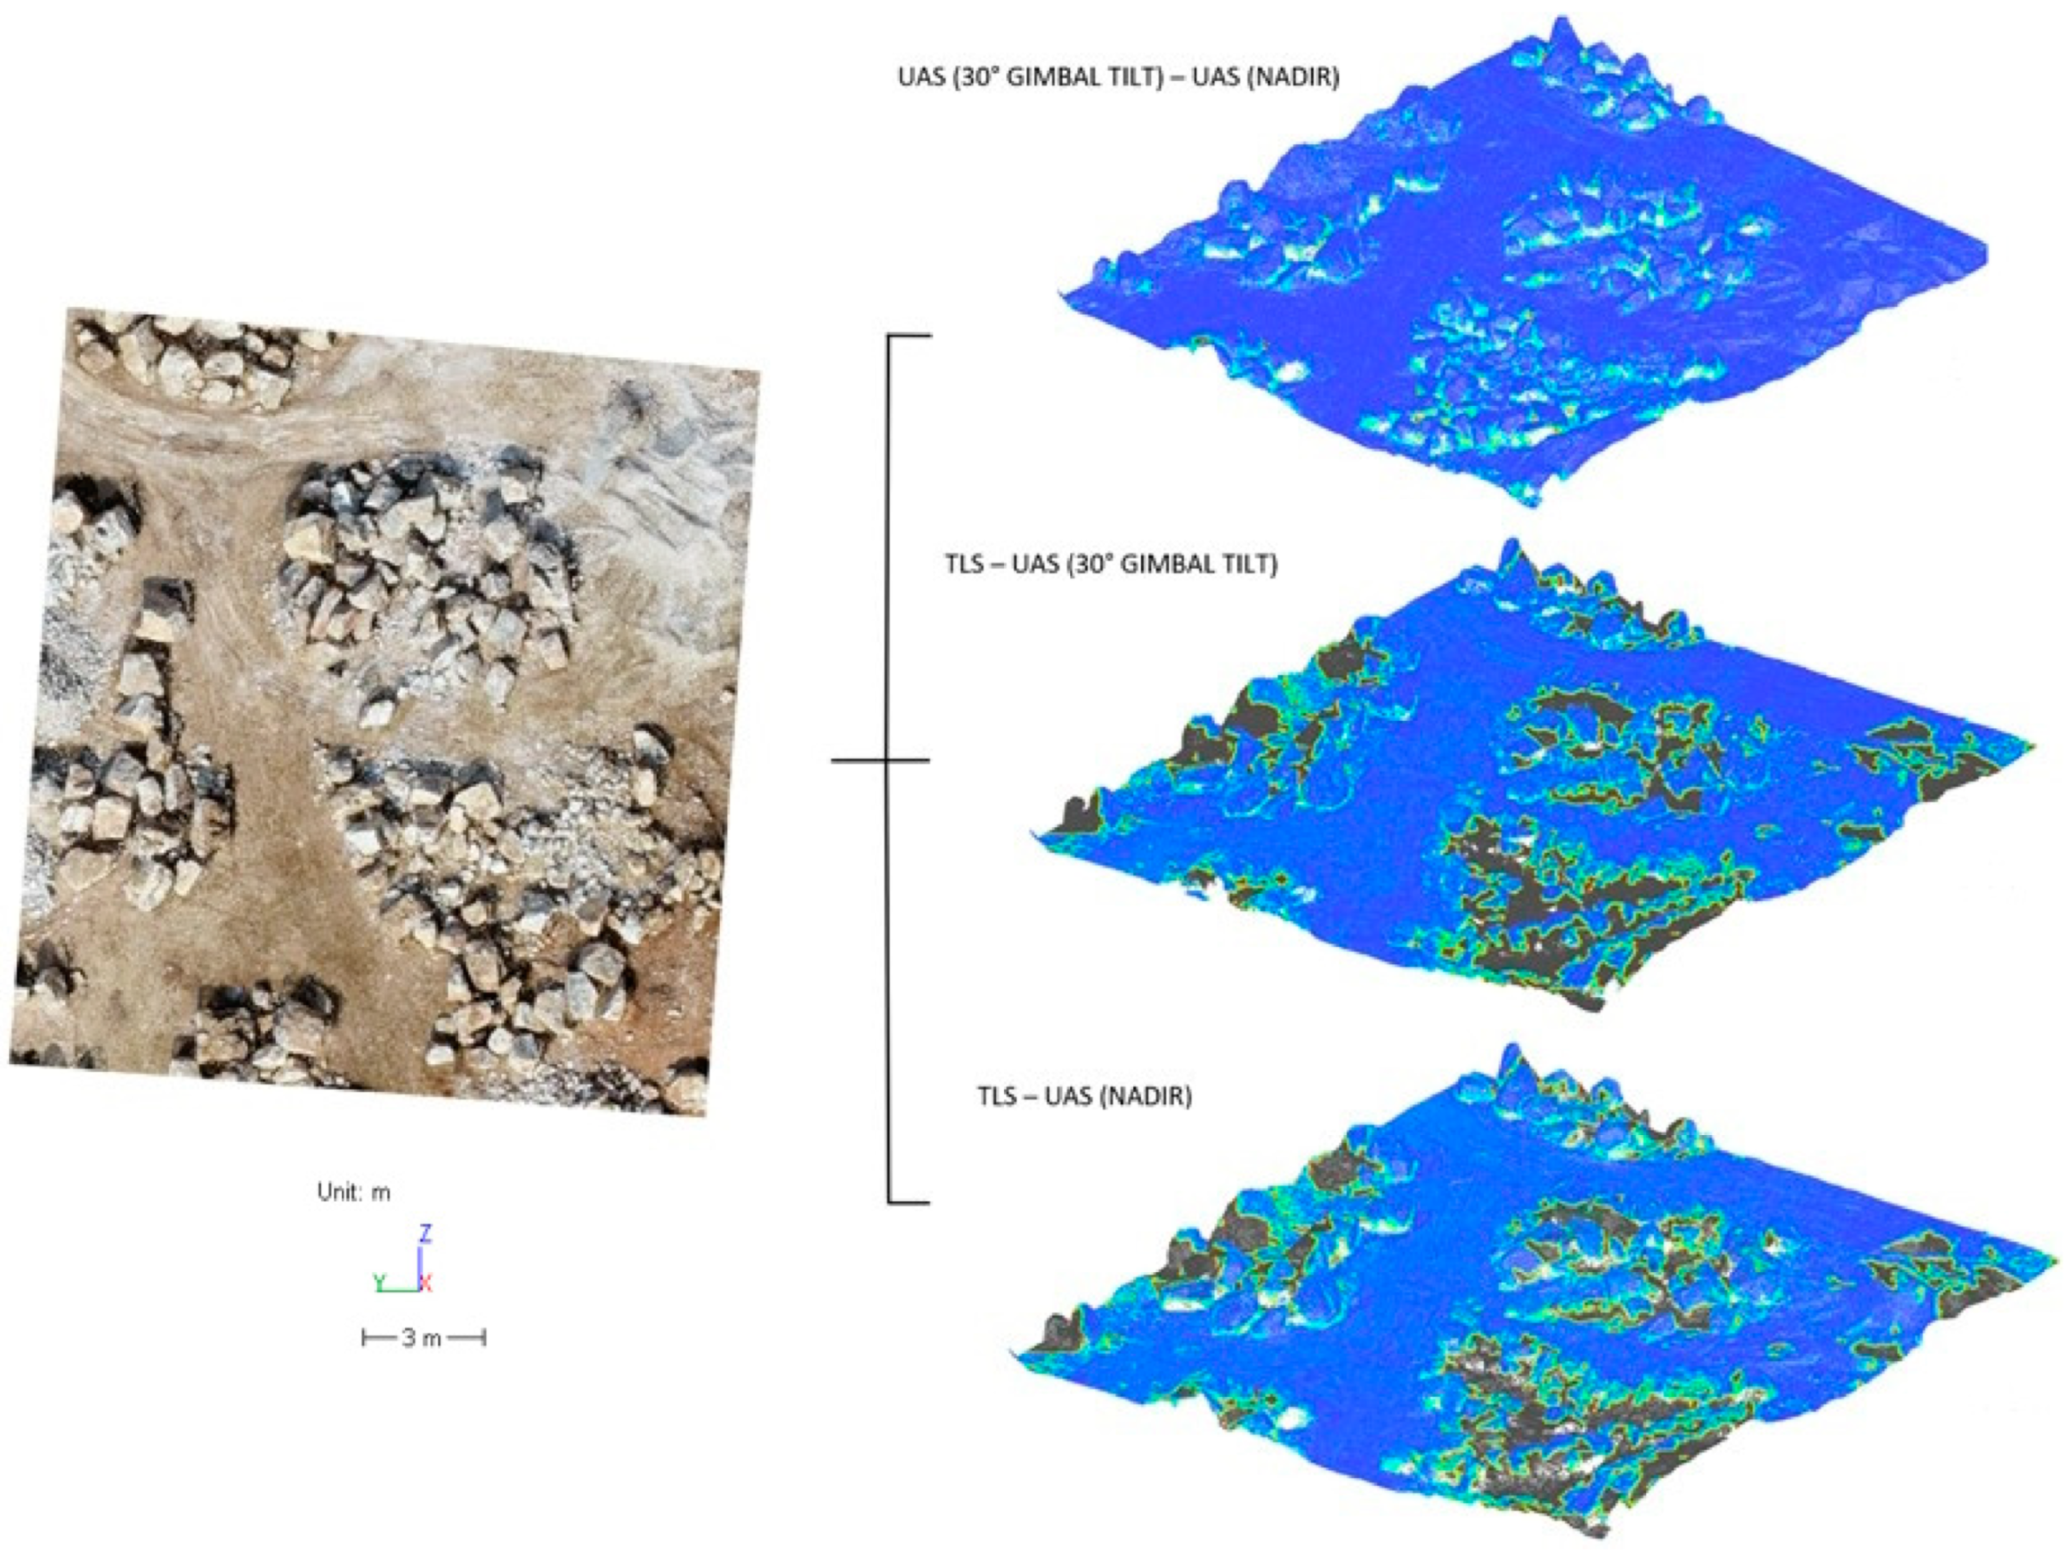
The lack of overlay between the two point clouds is more visible when comparing the two point clouds on the earth’s surface. Again, the point cloud obtained by the TLS method was chosen as the reference point cloud, and the UAS photogrammetry point cloud from images with a 30° gimbal tilt was chosen as the comparison point cloud. The comparison values of the point clouds obtained through the UAS method with a 30° gimbal tilt and TLS on the ground surface are shown in Table 10. Although up to 76% of the points are located within 30 cm, the gray areas that represent 24% in Figure 14 show the mentioned insufficient overlap of both point clouds. This is an expected feature of the TLS method; there are gaps in the point cloud due to obstacles in the rugged terrain. With the TLS method, a large number of positions and measurements would be required to capture the entire area without neglecting gaps in the point cloud. When observing statistical analyses, the maximum distance on the earth’s surface reached 0.858 m, the average absolute distance was 0.123 m, the mean was 0.093 m, and the standard deviation was 0.112 m.
Table 10.
Comparison values of point clouds from UAS with a 30° gimbal tilt and TLS on the earth’s surface.
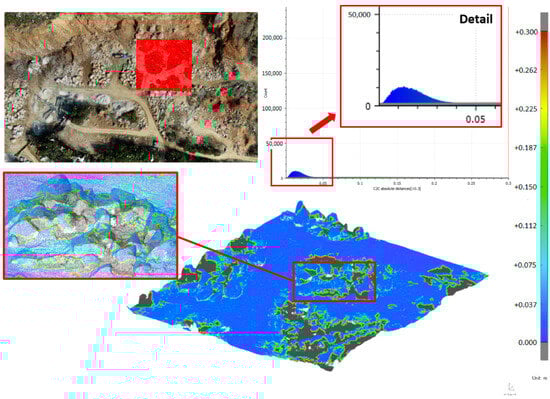
Figure 14.
Comparison of point clouds obtained by UAS photogrammetry with a 30° gimbal tilt and TLS on the earth’s surface.
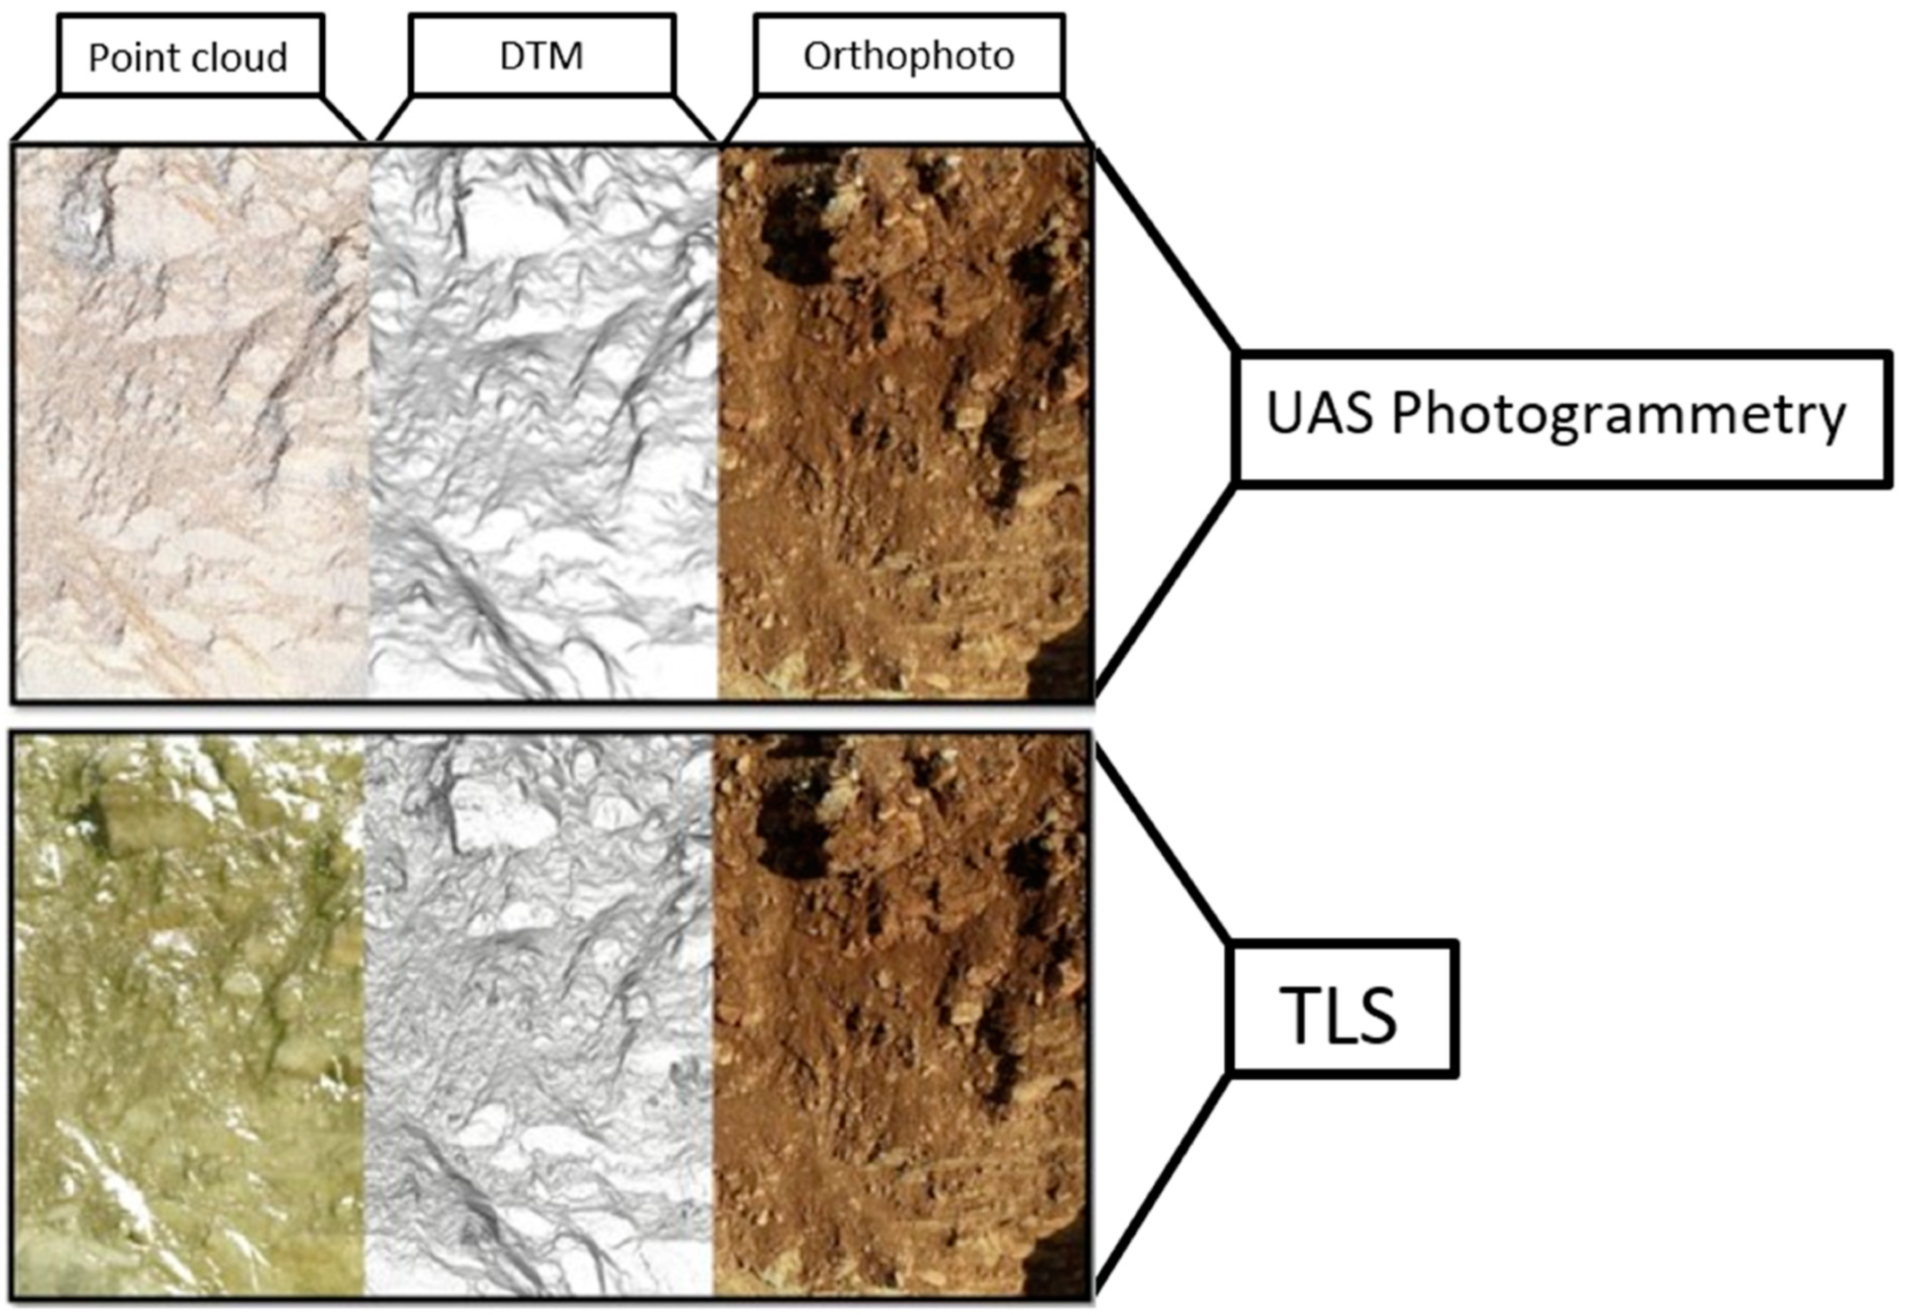
The next comparison of both methods was based on the dense point cloud created, the creation of a DTM in the CloudCompare software environment, and the orthophoto mosaic (Figure 15). The DTM made from the point cloud obtained by the TLS method provides a better representation of the terrain itself, due to the denser point cloud.
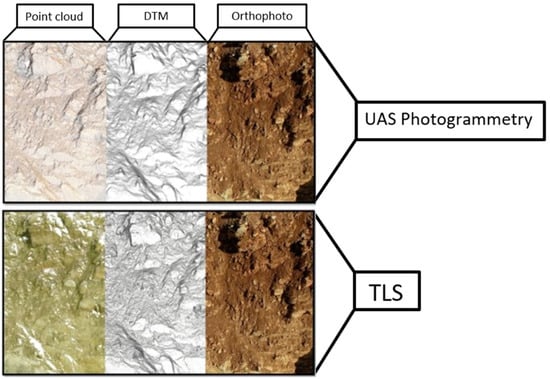
Figure 15.
Comparison of the UAS and TLS methods as a dense point cloud, DTM, and orthophoto mosaic.
4.3. Comparison of Nadir Images from UAS Photogrammetry and TLS
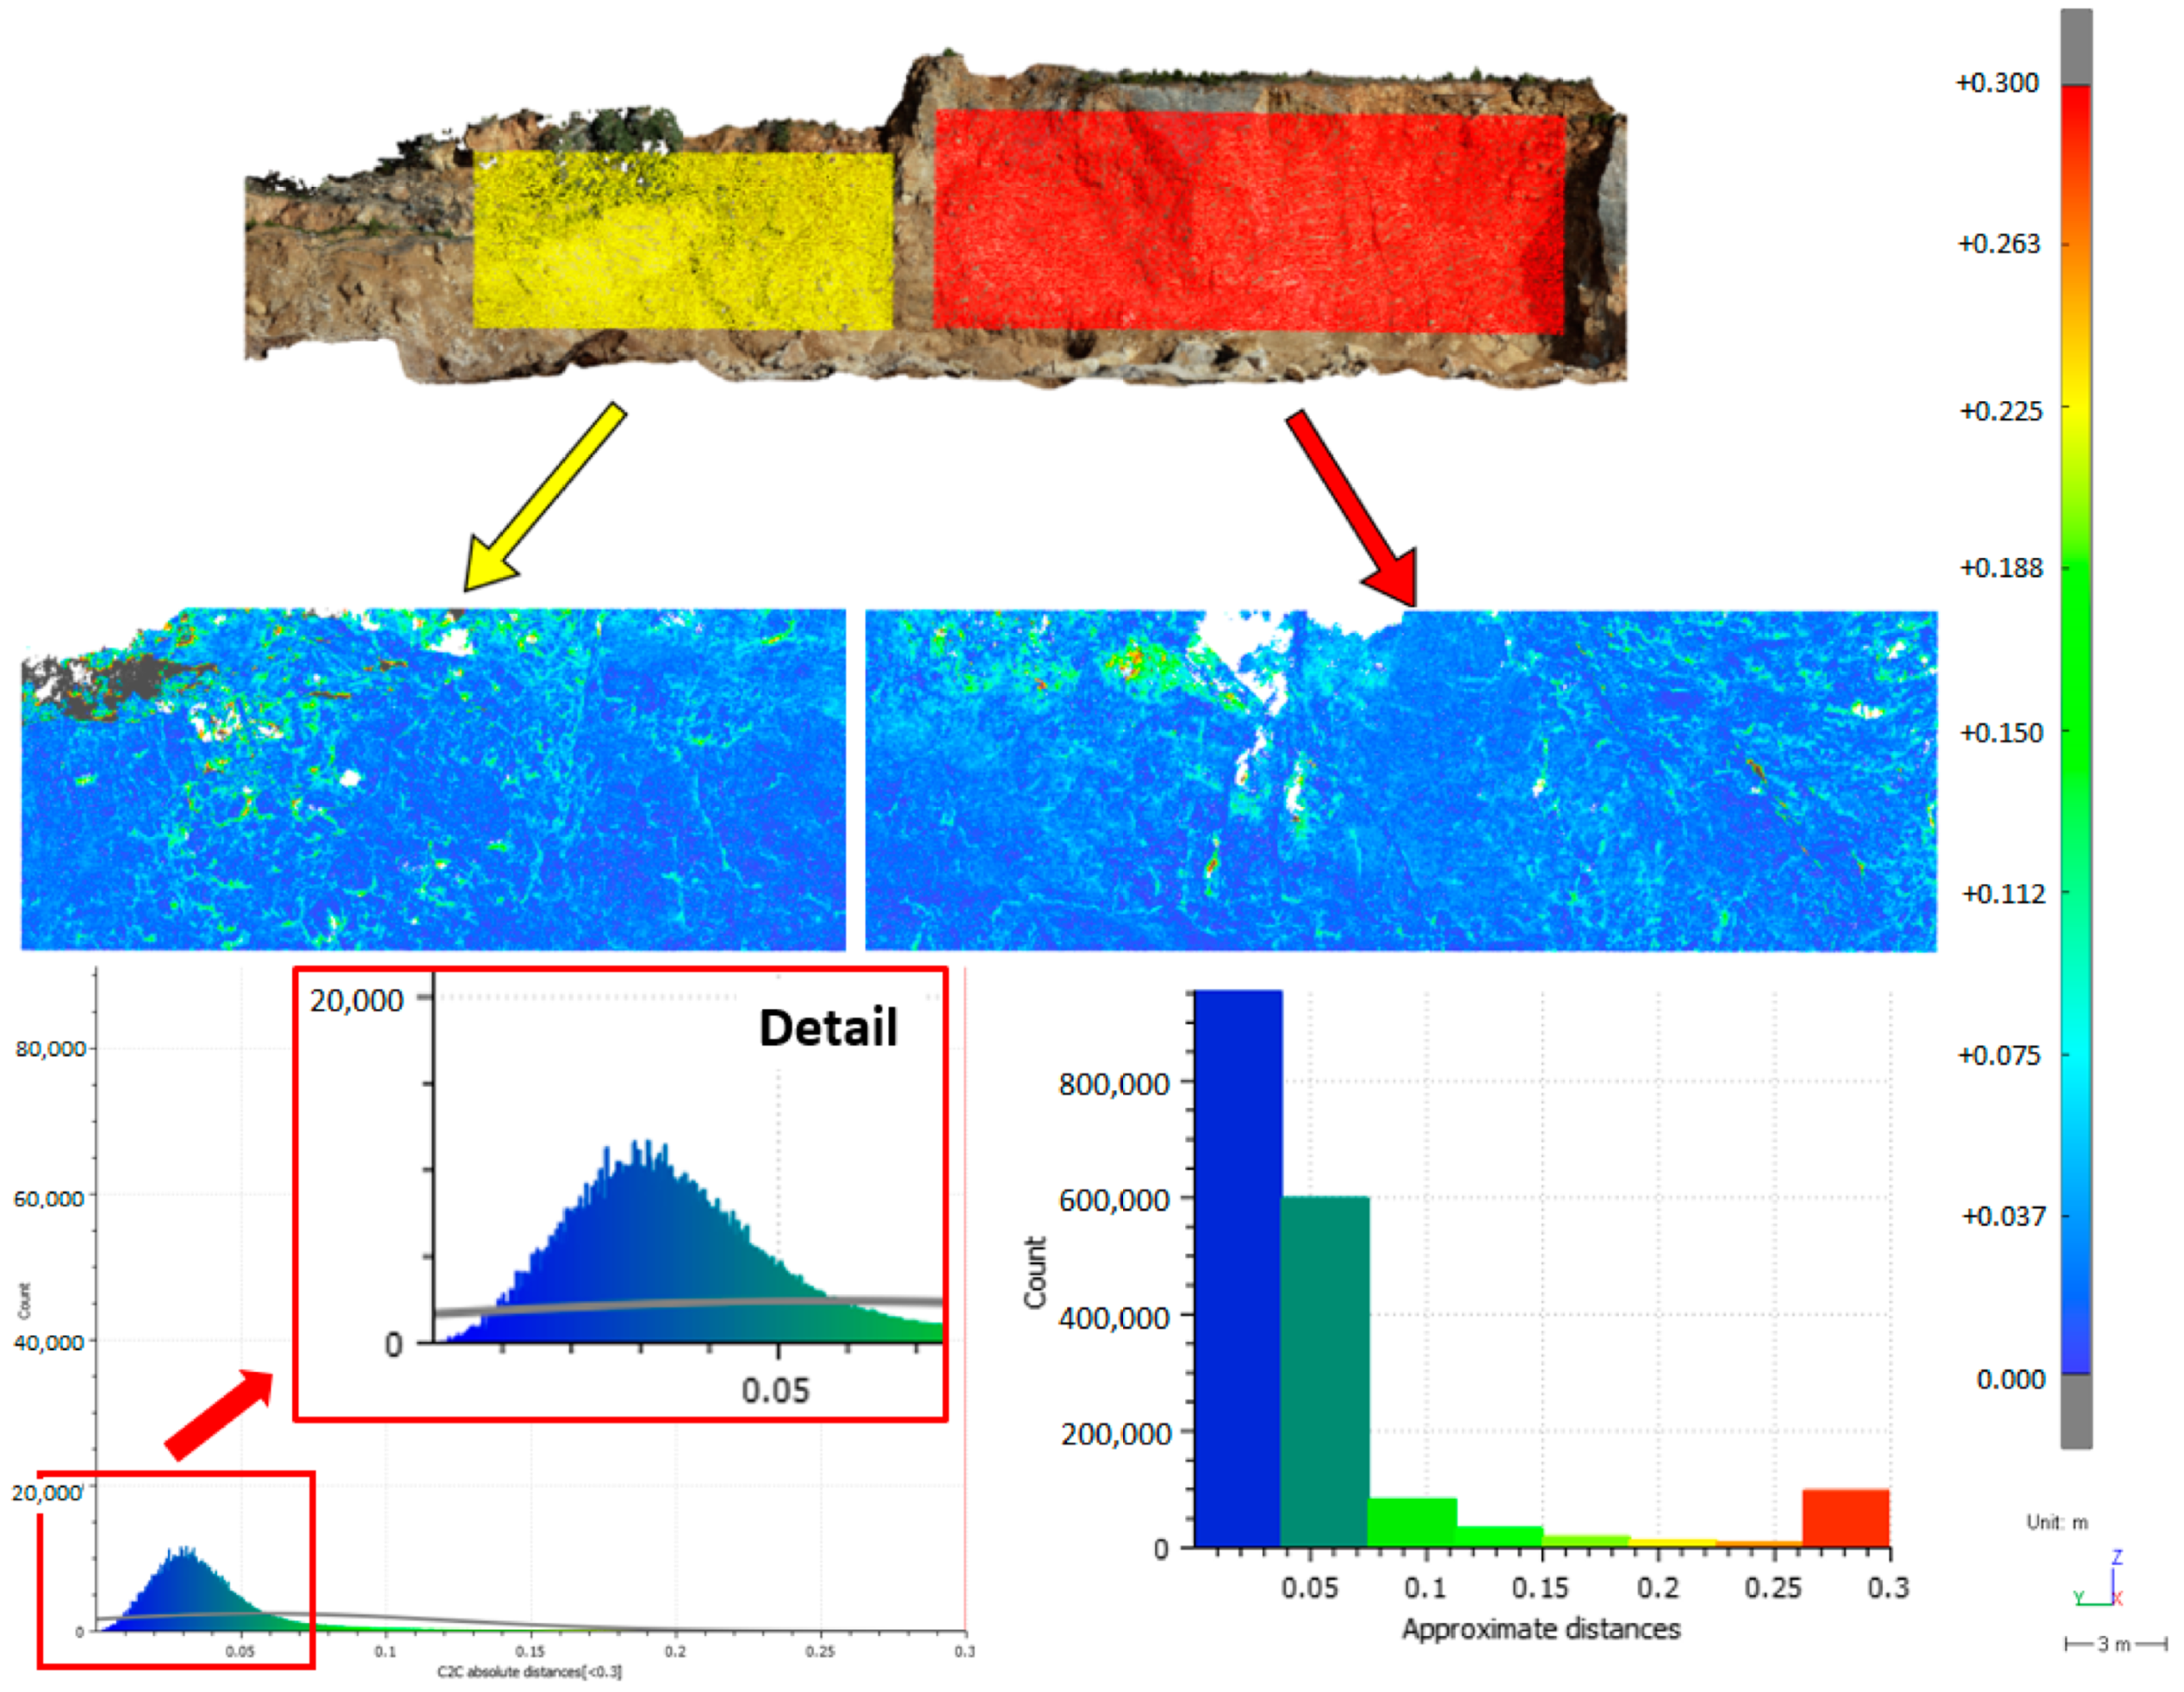
The last comparison was made between the point clouds from UAS photogrammetry, which were made from nadir images, and the point clouds from TLS. In the analysis on the mining wall and on the earth’s surface, the point cloud obtained by the TLS method was chosen as the reference point cloud, and the point cloud from the nadir images was chosen as the comparison point cloud. In Figure 16, in the analysis of the mining wall, in the area where vegetation is present, insufficient overlay of both point clouds can be seen. Insufficient overlay represents up to 10% of the points in this comparison. On the parts of the mining wall where there is no vegetation, the distance between the two point clouds is between 0.5 cm and 3.5 cm, which is 90% of all points. The comparison values of point clouds obtained through the UAS method with nadir images and TLS on the mining wall are shown in Table 11. The TLS method provides significantly more points and a significantly higher density. The standard deviation has a value of 0.063 m. The maximum distance between point clouds on the mining wall is 1.445 m, and the average absolute distance is 0.049 m.
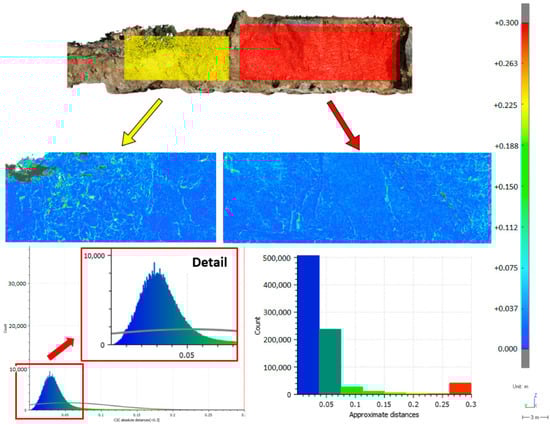
Figure 16.
Comparison of point clouds from nadir images and the TLS method on a mining wall.
Table 11.
Comparison values of point clouds from UAS with nadir images and TLS on the mining wall.
Analysis of the comparison of point clouds from nadir images using UAS photogrammetry and TLS on the ground surface confirmed the results from the comparison of point clouds obtained using UAS photogrammetry with a 30° gimbal tilt and TLS on the ground surface. Figure 17 shows the insufficient overlay on the earth’s surface, which is caused by the fact that when measuring with the TLS method, there are gaps in the point cloud due to the ruggedness of the terrain. In this case, up to 64% of the points had insufficient overlay. The comparison values of point clouds obtained through the UAS method with nadir images and TLS on the ground surface are shown in Table 12. The density of points in the TLS method is 16,350 points/m2 in this area, while only 247 points/m2 in the UAS at nadir images method. Statistical analysis showed us that the maximum distance between the compared point clouds on the earth’s surface is 0.857 m, and the average absolute distance of the point clouds on the earth’s surface reached a value of 0.116 m. In this comparison, the mean was more than 9 cm, and the standard deviation was 10.9 cm.
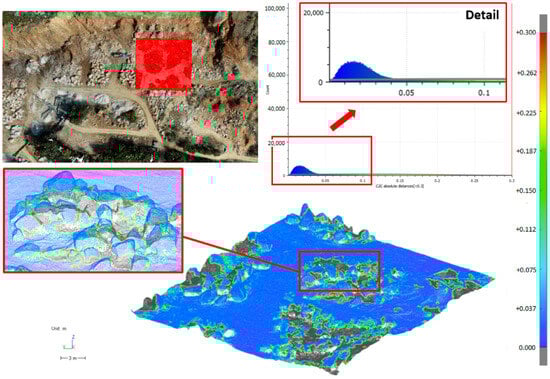
Figure 17.
Comparison of the point cloud from nadir images and the TLS method on the earth’s surface.
Table 12.
Comparison values of point clouds from UAS with nadir images and TLS on the earth’s surface.
4.4. Comparison of Used Methods Based on Point Density
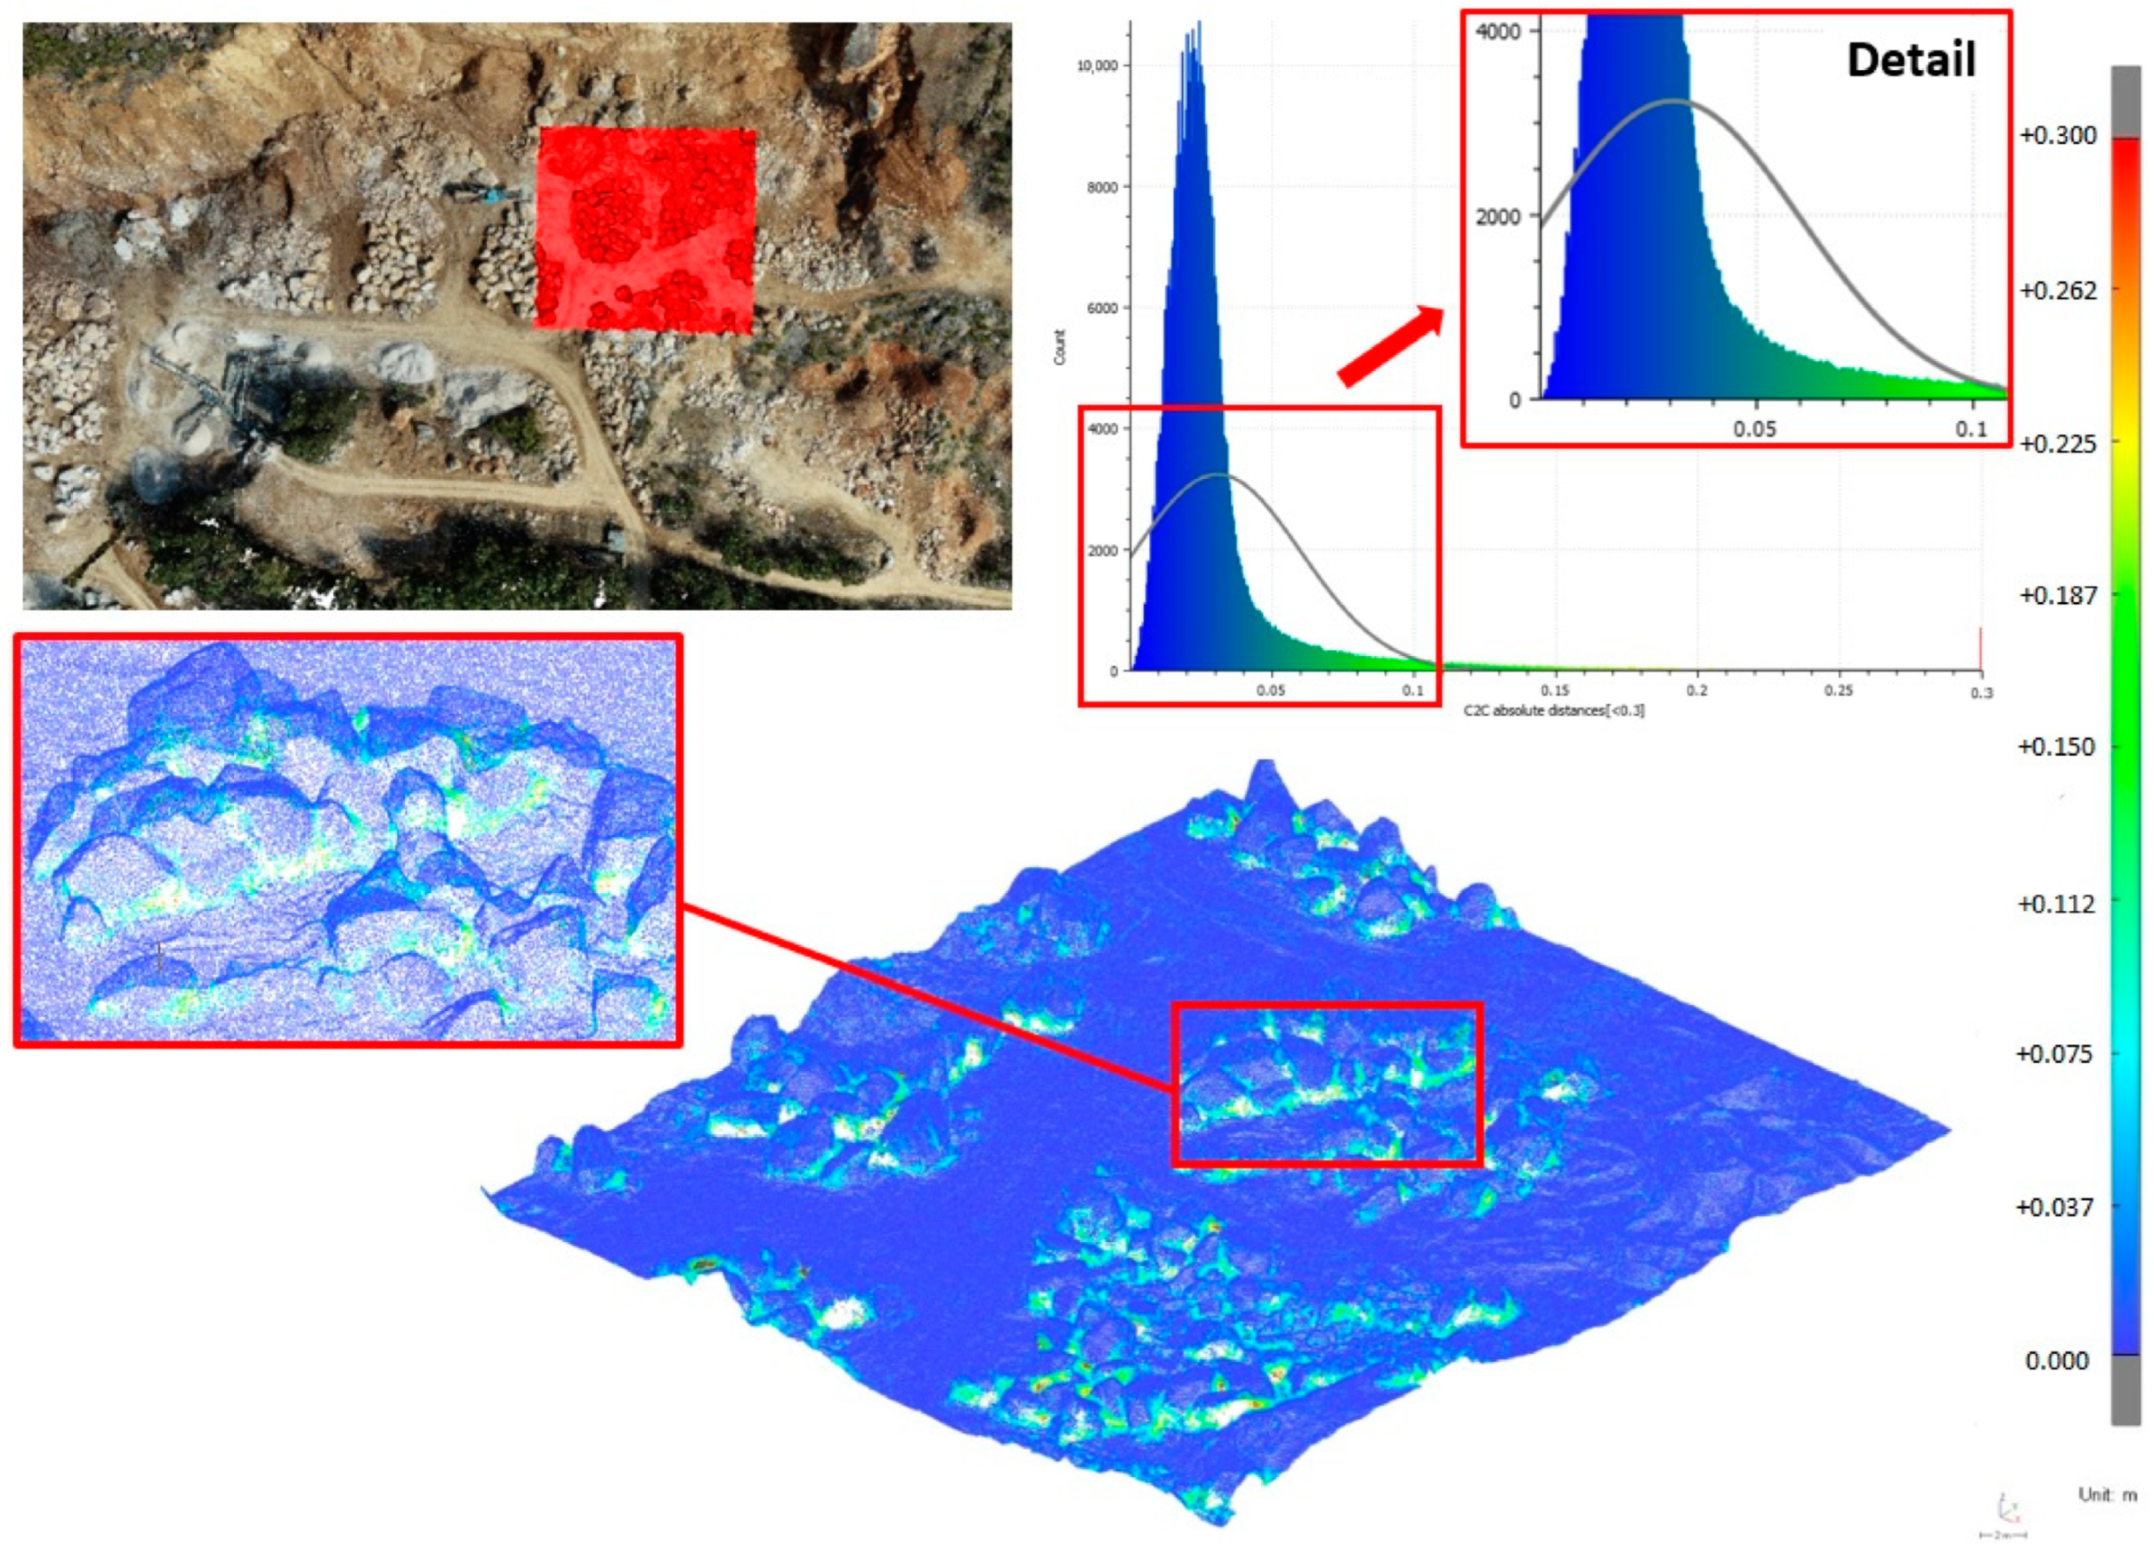
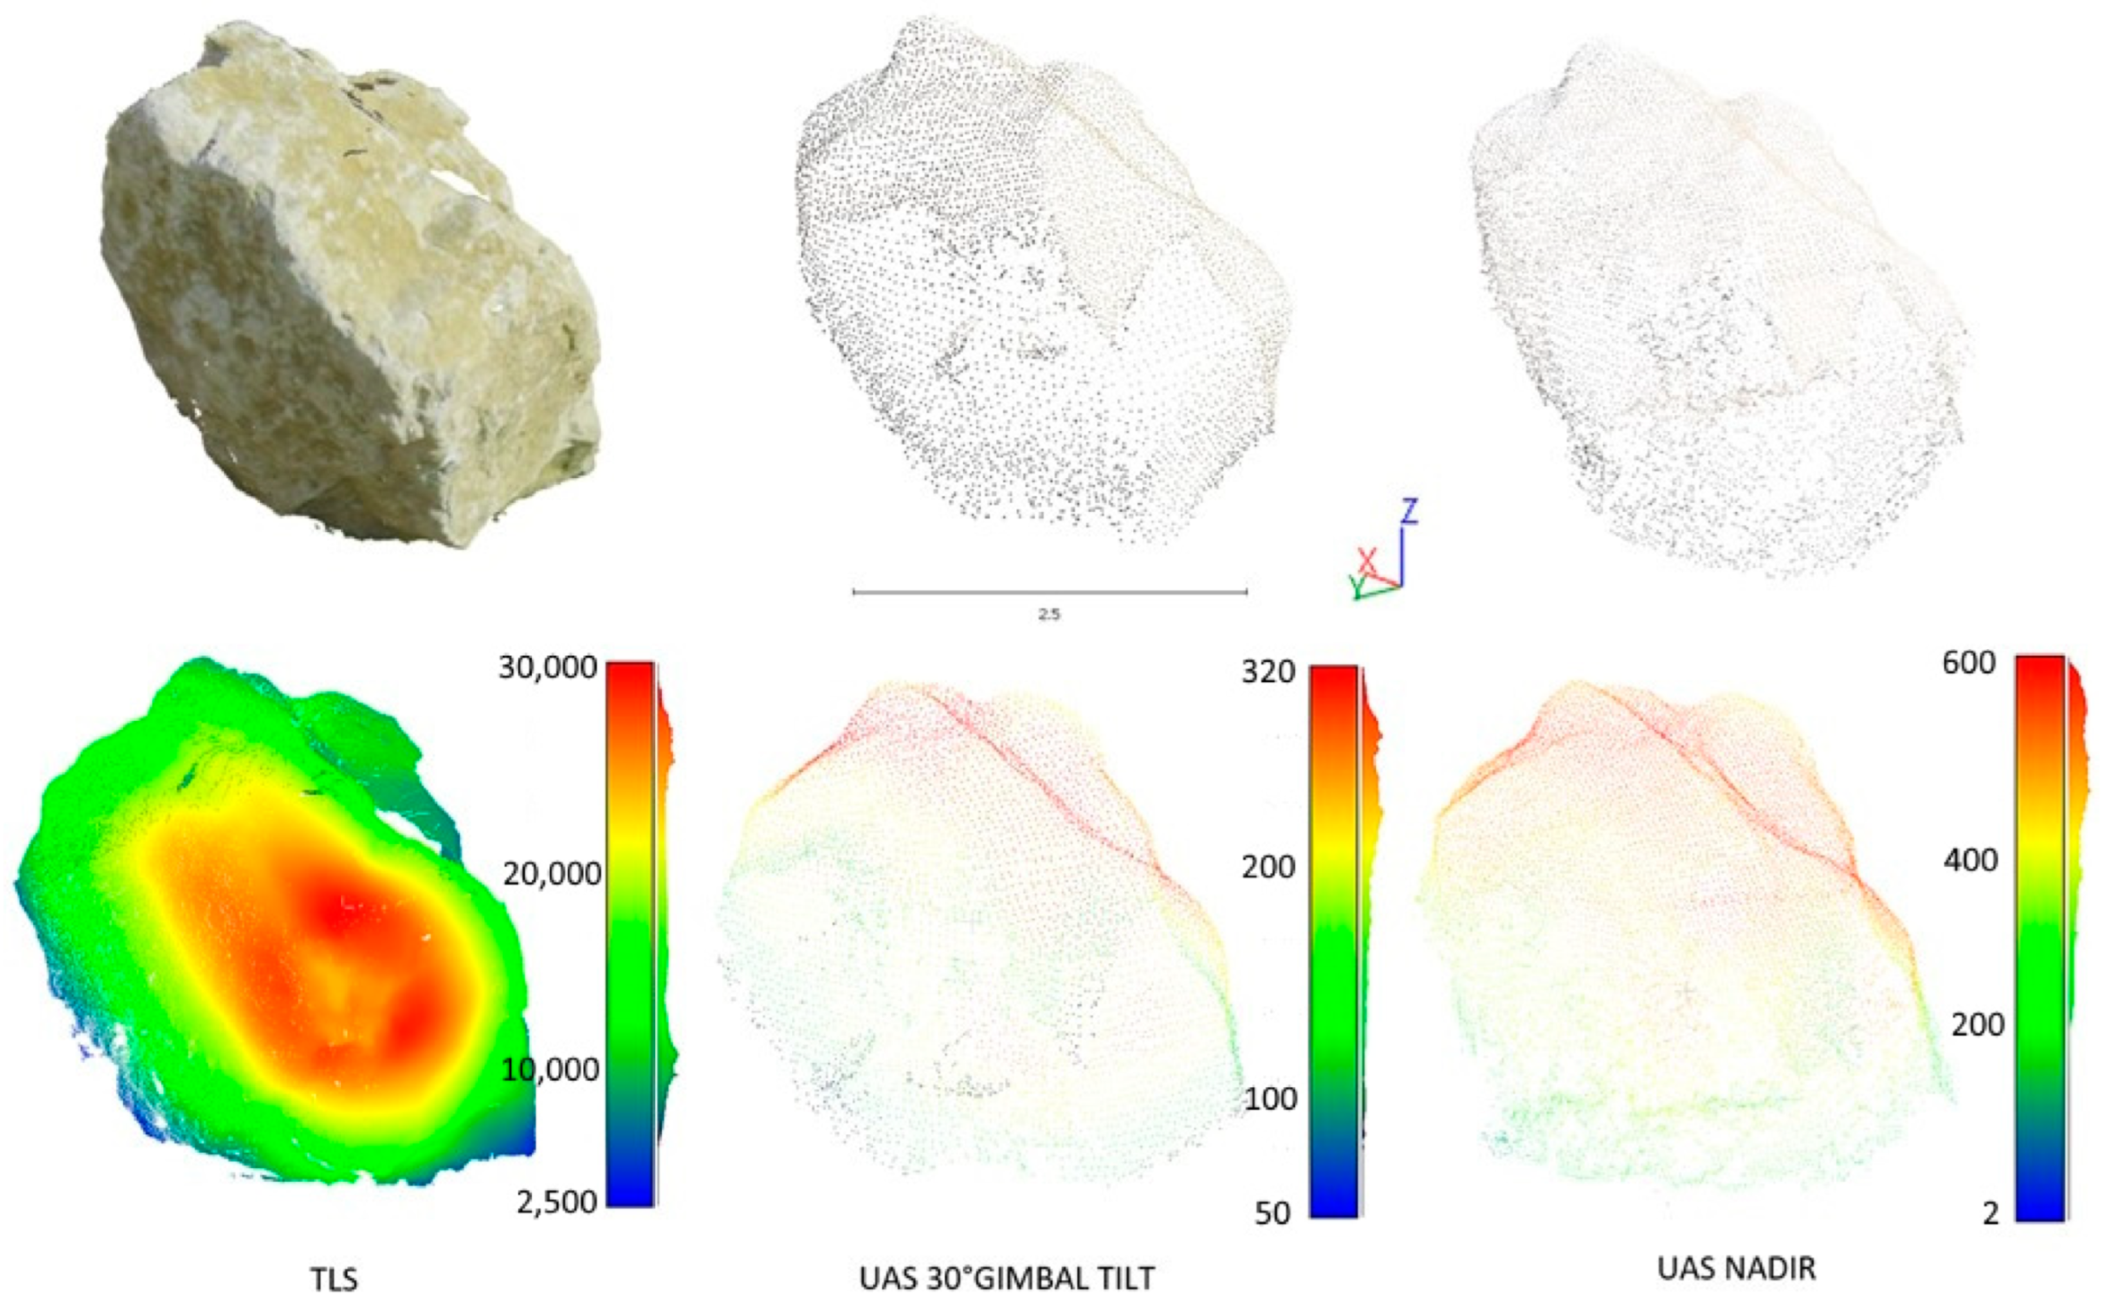
The studied point clouds were compared in terms of point density on the selected rock object in the CloudCompare software to confirm the results. The point cloud obtained using the TLS method is significantly denser. Figure 18 shows a comparison of the point density of the methods used on point clouds on a single rock object. As a result, the TLS method provides a much denser point cloud than the UAS photogrammetry methods. The total number of points on the compared rock object is 317,126 points obtained by the TLS method, and the average density of points was 16,548 points/m2. During UAS photogrammetry with a 30° gimbal tilt, there were 15,085 points on the rock object, and the average point density was 493 points/m2. The point cloud obtained by UAS photogrammetry based on nadir images contains 6469 points on the rock object, and the average point density was 226 points/m2. In UAS photogrammetry methods, the point density is chosen by the surface density method, and the point density is relatively evenly distributed over the entire area of interest, even if the higher point density is located in the upper part of the rock object. When choosing the same parameters for the point cloud obtained through the TLS method, the point density is unevenly distributed throughout the area of interest; most points are located in the center of the rock object and around the viewpoints.

Figure 18.
Comparison of the point cloud density of individual methods on a rock object.
5. Discussion
All methods used in the study area in quarry Dreveník were compared in terms of the number of points, point density, mean, standard deviation, maximum distance, average absolute distance of points, RMSE on GCPs, and time for field and office work. Table 13 presents the results achieved with the two methods of UAS photogrammetry and the TLS method. The parameters of the number of points and point density refer to the selected ground surface in Figure 19. The other parameters describe the measurement and data processing that refer to the entire territory of the quarry. The advantage of UAS SfM photogrammetry methods is faster data acquisition time. However, the TLS method can provide a denser point cloud, although there are often visible holes or gaps in this point cloud due to the occlusion of some locations during scanning, resulting in shadows and unmeasured areas in the point cloud. For UAS photogrammetry methods, the point cloud obtained by capturing with a 30° gimbal tilt provided better results, as it achieved a higher point density and a larger number of points on the compared areas.
Table 13.
Comparison of all used methods in terms of various parameters.
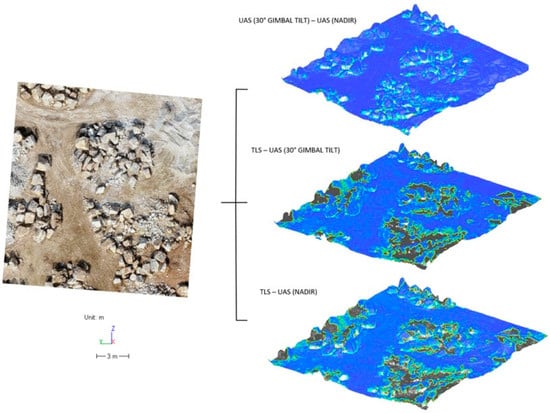
Figure 19.
Comparison of point clouds of all methods used on the ground surface.
The advantage of UAS photogrammetry is its high spatial coverage. UAS photogrammetry allows for the rapid acquisition of aerial imagery over large areas, providing comprehensive spatial coverage of the quarry or mine site. UAS photogrammetry can be used in hard-to-reach or hazardous areas, offering flexibility in data acquisition and enabling monitoring in areas where traditional methods may be impractical. The low purchase price is also an advantage. The main disadvantage is that this method demands higher hardware requirements for image processing and longer data processing times. The main advantage of the TLS method is that it offers high spatial accuracy and precision, capturing detailed point clouds with sub-centimeter resolution, making them suitable for precise monitoring and analysis. TLS instruments directly measure distances to surfaces, providing accurate and reliable data even in complex terrain or obstructed environments within the quarry or mine. Many TLS systems feature automated data processing capabilities, streamlining point cloud registration, filtering, and modeling tasks, reducing processing time and human intervention. However, disadvantages include the high purchase cost of the equipment and the necessity for measurements from numerous scanning stations, which increases the time required for field measurements.
The authors [63] addressed similar issues, attempting to solve the problem associated with the high risk and insufficient efficiency of the traditional method of mining rock massifs on a slope in a quarry using UAS technology. The authors propose a new approach to increase the efficiency of geological mining on slopes in common surface mines. A lightweight UAS with an FC6310S camera was used for data collection, with a resolution of 5472 × 3648. UAS imaging over the surface quarry with an area of 101,510 m2 was performed in 13 min, with 8 GCPs distributed throughout the area of interest. A total of 217 photographs were taken. The result was an orthophoto map and DSM with a GSD of 3.9 cm/pix. The RMSE value in the X direction was 3.17 cm, in the Y direction was 2.50 cm, and in the Z direction was 7.54 cm. In our research, we reach a better RMSE value on GCPs—up to 3 cm. The article [64] presents the technology of creating a 3D model of an open-surface quarry based on UAV digital imagery, along with the integration of UAV data into GIS and spatial analysis. It emphasizes the use of digital imagery and photogrammetric techniques for accurate 3D modeling, which facilitates better quarry management. The quarry was mapped using senseFly’s eBee UAS equipped with eMotion flight planning software. The area that was the subject of mapping is rectangular, with dimensions of 655 and 644 m. The area of the site represents an area of 42.2 hectares. The resolution is 2.8 cm/pixel, and the overlap between individual images is 75%. After processing, DSM and orthophoto mosaics were created. The Pix4Dmapper application was used to create these elements, which automatically generates a DSM with a GSD value of 3.46 cm. By monitoring the fracture profiles, several features, such as the overall slope of the wall, can be monitored. Based on the results of the case study, it can be concluded that current technologies combined with innovative and interactive processing methods, especially photogrammetric and GIS methods, are fully applicable and compatible in the case of open mining. This combination provides accurate value processed in real time and helps to better plan future mining activities.
In the article [18], the authors achieved accuracy in the order of centimeters when comparing the distances of point clouds obtained by TLS and SfM photogrammetry. The same devices, analogous processing and analyzing the measurements were used. Our results also reach the same range of values.
The authors of the article [65] devoted themselves to the mapping of two open quarries. Their area covers 17 km2, and they have more than 140 million tons of iron ore. Data collection was carried out using the UAV Skywalker X5, which carries a Sony QX100 camera with a resolution of 20.9 Mpix. The flights were carried out at a flight height of 200 to 250 m, with a total overlap of 80%. 10–13 GCPs were used for georeferencing. The vertical accuracy (RMSE) was evaluated and estimated in flat areas to be approximately 0.1 m. This paper proposes the characterization of geomorphic features of open pits using fast, low-cost, and high-resolution topography from UAS using the SfM method to obtain an accurate DSM in virtually real-time and at minimal cost. From our results, we can recommend a lower AGL height of flight to increase the accuracy and quality of the photogrammetric models, thereby reducing the RMSE on GCP and CP while improving the GSD value at once.
6. Conclusions
Our research in the quarry near the village of Spišské Podhradie aims at the differential analysis of spatial data obtained using UAS photogrammetry and TLS. In this article, we focused on the comparison of the individual methods used based on the determination of the minimum distance of each point of the compared point cloud to the reference point cloud using the CloudCompare and Leica Cyclone 3DR software. Another comparative criterion of the analyzed methods was the average point density and the range of time for surveying and office work. The last step in this article was to compare the methods used based on statistical analysis in terms of maximum distance, average absolute distance of points, mean, and standard deviation. Based on our results, it is appropriate to state that the parameters of the point clouds obtained by photogrammetric methods are qualitative, accurate, and comparable to the parameters of the point clouds obtained by TLS, and both methods are therefore suitable as a basis for systematic quarry monitoring. The advantage of the TLS method is a significantly higher point density and a better representation of the terrain itself when creating the DTM. However, the use of photogrammetric methods is more advantageous than the use of the TLS method due to the simplicity of data acquisition, flexible and fast use, low purchase price, and high point density, where the equipment costs and the risk of damage to expensive devices are higher.
Author Contributions
Conceptualization: Ľ.K., B.T., P.P. and P.B.; methodology: Ľ.K., B.T., P.P. and P.B.; software: Ľ.K., B.T. and P.P.; validation: Ľ.K., B.T., P.P. and P.B.; formal analysis: Ľ.K., B.T., P.P. and P.B.; investigation: Ľ.K.; resources: B.T. and P.P.; data curation: Ľ.K., B.T. and P.P.; writing—original draft preparation: Ľ.K., B.T. and P.P.; writing—review and editing: Ľ.K., B.T., P.P. and P.B.; visualization: Ľ.K., B.T. and P.P.; supervision: Ľ.K. All authors have read and agreed to the published version of the manuscript.
Funding
This research was supported by the Slovak Research and Development Agency under contract KEGA grant no. 055TUKE-4/2021, 003TUKE-4/2023, 011TUKE-4/2024, grant no. APVV-18-0351, and grant no. VEGA 1/0588/21.
Institutional Review Board Statement
Not applicable.
Informed Consent Statement
Not applicable.
Data Availability Statement
The dataset is available on request from the authors.
Conflicts of Interest
The authors declare no conflicts of interest.
References
- Park, S.; Choi, Y. Applications of Unmanned Aerial Vehicles in Mining from Exploration to Reclamation: A Review. Minerals 2020, 10, 663. [Google Scholar] [CrossRef]
- Ćwiąkała, P.; Gruszczyński, W.; Stoch, T.; Puniach, E.; Mrocheń, D.; Matwij, W.; Matwij, K.; Nędzka, M.; Sopata, P.; Wójcik, A. UAV Applications for Determination of Land Deformations Caused by Underground Mining. Remote Sens. 2020, 12, 1733. [Google Scholar] [CrossRef]
- Šafář, V.; Potůčková, M.; Karas, J.; Tlustý, J.; Štefanová, E.; Jančovič, M.; Cígler Žofková, D. The Use of UAV in Cadastral Mapping of the Czech Republic. ISPRS Int. J. Geo-Inf. 2021, 10, 380. [Google Scholar] [CrossRef]
- Fetai, B.; Oštir, K.; Kosmatin Fras, M.; Lisec, A. Extraction of Visible Boundaries for Cadastral Mapping Based on UAV Imagery. Remote Sens. 2019, 11, 1510. [Google Scholar] [CrossRef]
- Ajayi, O.G.; Ajulo, J. Investigating the Applicability of Unmanned Aerial Vehicles (UAV) Photogrammetry for the Estimation of the Volume of Stockpiles. Quaest. Geogr. 2021, 40, 25–38. [Google Scholar] [CrossRef]
- Kovanič, Ľ.; Blistan, P.; Urban, R.; Štroner, M.; Pukanská, K.; Bartoš, K.; Palková, J. Analytical Determination of Geometric Parameters of the Rotary Kiln by Novel Approach of TLS Point Cloud Segmentation. Appl. Sci. 2020, 10, 7652. [Google Scholar] [CrossRef]
- Kovanič, Ľ. Possibilities of Terrestrial Laser Scanning Method in Monitoring of Shape Deformation in Mining Plants. Inż. Miner. J. Pol. Miner. Eng. Soc. 2013, 1, 29–41. [Google Scholar]
- Jacko, S.; Farkašovský, R.; Ďuriška, I.; Ščerbáková, B.; Bátorová, K. Critical Tectonic Limits for Geothermal Aquifer Use: Case Study from the East Slovakian Basin Rim. Resources 2021, 10, 31. [Google Scholar] [CrossRef]
- Fiz, J.I.; Martín, P.M.; Cuesta, R.; Subías, E.; Codina, D.; Cartes, A. Examples and Results of Aerial Photogrammetry in Archeology with UAV: Geometric Documentation, High Resolution Multispectral Analysis, Models and 3D Printing. Drones 2022, 6, 59. [Google Scholar] [CrossRef]
- Schroder, W.; Murtha, T.; Golden, C.; Scherer, A.K.; Broadbent, E.N.; Almeyda Zambrano, A.M.; Herndon, K.; Griffin, R. UAV LiDAR Survey for Archaeological Documentation in Chiapas, Mexico. Remote Sens. 2021, 13, 4731. [Google Scholar] [CrossRef]
- Lin, G.; Sang, K. Application of UAV-Based Oblique Photography in Architectural Design: The Case of Mengyuan Resort Hotel in Yunnan, China. In Proceedings of the 2021 4th International Conference on Civil Engineering and Architecture, Seoul, Republic of Korea, 10–12 July 2021; Kang, T., Lee, Y., Eds.; Lecture Notes in Civil Engineering. Springer: Singapore, 2022; Volume 201. [Google Scholar] [CrossRef]
- Germanese, D.; Leone, G.R.; Moroni, D.; Pascali, M.A.; Tampucci, M. Towards Structural Monitoring and 3D Documentation of Architectural Heritage Using UAV. In Multimedia and Network Information Systems. MISSI 2018. Advances in Intelligent Systems and Computing; Choroś, K., Kopel, M., Kukla, E., Siemiński, A., Eds.; Springer: Cham, Switzerland, 2018; Volume 833. [Google Scholar] [CrossRef]
- Lambertini, A.; Mandanici, E.; Tini, M.A.; Vittuari, L. Technical Challenges for Multi-Temporal and Multi-Sensor Image Processing Surveyed by UAV for Mapping and Monitoring in Precision Agriculture. Remote Sens. 2022, 14, 4954. [Google Scholar] [CrossRef]
- Marín-Buzón, C.; Pérez-Romero, A.; Tucci-Álvarez, F.; Manzano-Agugliaro, F. Assessing the Orange Tree Crown Volumes Using Google Maps as a Low-Cost Photogrammetric Alternative. Agronomy 2020, 10, 893. [Google Scholar] [CrossRef]
- Migliazza, M.; Carriero, M.T.; Lingua, A.; Pontoglio, E.; Scavia, C. Rock Mass Characterization by UAV and Close-Range Photogrammetry: A Multiscale Approach Applied along the Vallone dell’Elva Road (Italy). Geosciences 2021, 11, 436. [Google Scholar] [CrossRef]
- Fraštia, M.; Liščák, P.; Žilka, A.; Pauditš, P.; Bobáľ, P.; Hronček, S.; Sipina, S.; Ihring, P.; Marčiš, M. Mapping of debris flows by the morphometric analysis of DTM: A case study of the Vrátna dolina Valley, Slovakia. Geogr. Čas. 2019, 71, 101–120. [Google Scholar] [CrossRef]
- Bakuła, K.; Pilarska, M.; Salach, A.; Kurczyński, Z. Detection of Levee Damage Based on UAS Data—Optical Imagery and LiDAR Point Clouds. ISPRS Int. J. Geo-Inf. 2020, 9, 248. [Google Scholar] [CrossRef]
- Urban, R.; Štroner, M.; Blistan, P.; Kovanič, Ľ.; Patera, M.; Jacko, S.; Ďuriška, I.; Kelemen, M.; Szabo, S. The Suitability of UAS for Mass Movement Monitoring Caused by Torrential Rainfall—A Study on the Talus Cones in the Alpine Terrain in High Tatras, Slovakia. ISPRS Int. J. Geo-Inf. 2019, 8, 317. [Google Scholar] [CrossRef]
- Kyriou, A.; Nikolakopoulos, K.; Koukouvelas, I.; Lampropoulou, P. Repeated UAV Campaigns, GNSS Measurements, GIS, and Petrographic Analyses for Landslide Mapping and Monitoring. Minerals 2021, 11, 300. [Google Scholar] [CrossRef]
- Gantimurova, S.; Parshin, A.; Erofeev, V. GIS-Based Landslide Susceptibility Mapping of the Circum-Baikal Railway in Russia Using UAV Data. Remote Sens. 2021, 13, 3629. [Google Scholar] [CrossRef]
- Bariczová, G.; Erdélyi, J.; Honti, R.; Tomek, L. Wall Structure Geometry Verification Using TLS Data and BIM Model. Appl. Sci. 2021, 11, 11804. [Google Scholar] [CrossRef]
- Erdélyi, J.; Kopáčik, A.; Kyrinovič, P. Spatial Data Analysis for Deformation Monitoring of Bridge Structures. Appl. Sci. 2020, 10, 8731. [Google Scholar] [CrossRef]
- Sofranko, M.; Zeman, R. Simulation of pipeline transport backfill mixtures. In Proceedings of the 15th International Carpathian Control Conference (ICCC), Velke Karlovice, Czech Republic, 28–30 May 2014; pp. 578–583. [Google Scholar]
- Wittenberger, G.; Sofranko, M. Formation and protection against incrustation on the geothermal pipe by utilizing of geothermal water in the area of Ďurkov (Eastern Slovakia). Acta Montan. Slovaca 2015, 20, 10–15. [Google Scholar]
- Štroner, M.; Urban, R.; Kremen, T.; Braun, J. UAV DTM Acquisition in a Forested Area—Comparison of Low-Cost Photogrammetry (DJI Zenmuse P1) and LiDAR Solutions (DJI Zenmuse L1). Eur. J. Remote Sens. 2023, 56, 2179942. [Google Scholar] [CrossRef]
- Pavelka, K.; Matoušková, E.; Pavelka, K., Jr. Remarks on Geomatics Measurement Methods Focused on Forestry Inventory. Sensors 2023, 23, 7376. [Google Scholar] [CrossRef] [PubMed]
- Ren, H.; Zhao, Y.; Xiao, W.; Wang, X.; Sui, T. An Improved Ground Control Point Configuration for Digital Surface Model Construction in a Coal Waste Dump Using an Unmanned Aerial Vehicle System. Remote Sens. 2020, 12, 1623. [Google Scholar] [CrossRef]
- Vanneschi, C.; Di Camillo, M.; Aiello, E.; Bonciani, F.; Salvini, R. SfM-MVS Photogrammetry for Rockfall Analysis and Hazard Assessment Along the Ancient Roman Via Flaminia Road at the Furlo Gorge (Italy). ISPRS Int. J. Geo-Inf. 2019, 8, 325. [Google Scholar] [CrossRef]
- Cao, L.; Liu, H.; Fu, X.; Zhang, Z.; Shen, X.; Ruan, H. Comparison of UAV LiDAR and Digital Aerial Photogrammetry Point Clouds for Estimating Forest Structural Attributes in Subtropical Planted Forests. Forests 2019, 10, 145. [Google Scholar] [CrossRef]
- Wallace, L.; Lucieer, A.; Malenovský, Z.; Turner, D.; Vopěnka, P. Assessment of Forest Structure Using Two UAV Techniques: A Comparison of Airborne Laser Scanning and Structure from Motion (SfM) Point Clouds. Forests 2016, 7, 62. [Google Scholar] [CrossRef]
- Štroner, M.; Urban, R.; Seidl, J.; Reindl, T.; Brouček, J. Photogrammetry Using UAV-Mounted GNSS RTK: Georeferencing Strategies without GCPs. Remote Sens. 2021, 13, 1336. [Google Scholar] [CrossRef]
- Tomaštík, J.; Mokroš, M.; Surový, P.; Grznárová, A.; Merganič, J. UAV RTK/PPK Method—An Optimal Solution for Mapping Inaccessible Forested Areas? Remote Sens. 2019, 11, 721. [Google Scholar] [CrossRef]
- Zeybek, M. Accuracy assessment of direct georeferencing UAV images with onboard global navigation satellite system and comparison of CORS/RTK surveying methods. Meas. Sci. Technol. 2021, 32, 065402. [Google Scholar] [CrossRef]
- Salach, A.; Bakuła, K.; Pilarska, M.; Ostrowski, W.; Górski, K.; Kurczyński, Z. Accuracy Assessment of Point Clouds from LiDAR and Dense Image Matching Acquired Using the UAV Platform for DTM Creation. ISPRS Int. J. Geo-Inf. 2018, 7, 342. [Google Scholar] [CrossRef]
- Forlani, G.; Dall’Asta, E.; Diotri, F.; Cella, U.M.D.; Roncella, R.; Santise, M. Quality Assessment of DSMs Produced from UAV Flights Georeferenced with On-Board RTK Positioning. Remote Sens. 2018, 10, 311. [Google Scholar] [CrossRef]
- Kovanič, Ľ.; Blistan, P.; Rozložník, M.; Szabó, G. UAS RTK/PPK photogrammetry as a tool for mapping the urbanized landscape, creating thematic maps, situation plans and DEM. Acta Montan. Slovaca 2021, 26, 649–660. [Google Scholar] [CrossRef]
- Santagata, T. Monitoring of the Nirano Mud Volcanoes Regional Natural Reserve (North Italy) using Unmanned Aerial Vehicles and Terrestrial Laser Scanning. J. Imaging 2017, 3, 42. [Google Scholar] [CrossRef]
- Kunina, I.A.; Teplyakov, L.M.; Gladkov, A.P.; Khanipov, T.M.; Nikolaev, D.P. Aerial images visual localization on a vector map using color-texture segmentation. In Proceedings of the SPIE 10696, Tenth International Conference on Machine Vision (ICMV 2017), 106961T, Bellingham, WA, USA, 13 April 2018. [Google Scholar] [CrossRef]
- Puniach, E.; Bieda, A.; Ćwiąkała, P.; Kwartnik-Pruc, A.; Parzych, P. Use of Unmanned Aerial Vehicles (UAVs) for Updating Farmland Cadastral Data in Areas Subject to Landslides. ISPRS Int. J. Geo-Inf. 2018, 7, 331. [Google Scholar] [CrossRef]
- Arango, C.; Morales, C.A. Comparison between Multicopter UAV and Total Station for Estimating Stockpile Volumes. Int. Arch. Photogramm. Remote Sens. Spatial Inf. Sci. 2015, 40, 131–135. [Google Scholar] [CrossRef]
- Mantey, S.; Aduah, M.S. Comparative Analysis of Stockpile Volume Estimation using UAV and GPS Techniques. Ghana Min. J. 2021, 21, 1–10. [Google Scholar] [CrossRef]
- Sungjae, L.; Yosoon, C. On-site Demonstration of Topographic Surveying Techniques at Open-pit Mines using a Fixed-wing Unmanned Aerial Vehicle (Drone). Tunn. Undergr. Space 2015, 25, 527–533. [Google Scholar] [CrossRef]
- Raeva, P.L.; Filipova, S.L.; Filipov, D.G. Volume computation of a stockpile–a study case comparing GPS and UAV measurements in an open pit quarry. Int. Arch. Photogramm. Remote Sens. Spat. Inf. Sci. 2016, 41, 999–1004. [Google Scholar] [CrossRef]
- Patikova, A. Digital Photogrammetry in the practice of Open Pit Mining. Int. Arch. Photogramm. Remote Sens. Spat. Inf. Sci. 2004, 34, 1–4. [Google Scholar]
- Lee, S.; Choi, Y. Reviews of unmanned aerial vehicle (drone) technology trends and its applications in the mining industry. Geosystem Eng. 2016, 19, 197–204. [Google Scholar] [CrossRef]
- Štroner, M.; Urban, R.; Reindl, T.; Seidl, J.; Brouček, J. Evaluation of the Georeferencing Accuracy of a Photogrammetric Model Using a Quadrocopter with Onboard GNSS RTK. Sensors 2020, 20, 2318. [Google Scholar] [CrossRef] [PubMed]
- Moudrý, V.; Urban, R.; Štroner, M.; Komárek, J.; Brouček, J.; Prošek, J. Comparison of a commercial and home-assembled fixed-wing UAV for terrain mapping of a post-mining site under leaf-off conditions. Int. J. Remote Sens. 2019, 40, 555–572. [Google Scholar] [CrossRef]
- Carabassa, V.; Montero, P.; Alcañiz, J.M.; Padró, J.-C. Soil Erosion Monitoring in Quarry Restoration Using Drones. Minerals 2021, 11, 949. [Google Scholar] [CrossRef]
- Török, Á.; Bögöly, G.; Somogyi, Á.; Lovas, T. Application of UAV in Topographic Modelling and Structural Geological Mapping of Quarries and Their Surroundings—Delineation of Fault-Bordered Raw Material Reserves. Sensors 2020, 20, 489. [Google Scholar] [CrossRef] [PubMed]
- Herrero, M.J.; Pérez-Fortes, A.P.; Escavy, J.I.; Insua-Arévalo, J.M.; De la Horra, R.; López-Acevedo, F.; Trigos, L. 3D model generated from UAV photogrammetry and semi-automated rock mass characterization. Comput. Geosci. 2022, 163, 105121. [Google Scholar] [CrossRef]
- Jawecki, B.; Szewrański, S.; Stodolak, R.; Wang, Z. The Use of Digital Terrain Models to Estimate the Pace of Filling the Pit of a Central European Granite Quarry with Water. Water 2019, 11, 2298. [Google Scholar] [CrossRef]
- Jawecki, B.; Dąbek, P.B.; Pawęska, K.; Wei, X. Estimating Water Retention in Post-mining Excavations Using LiDAR ALS Data for the Strzelin Quarry, in Lower Silesia. Mine Water Environ. 2018, 37, 744–753. [Google Scholar] [CrossRef]
- Mijić, N. Application of the Airborne LIDAR Technology on the Quarry Using AutoCAD Civil 3D Software. In Advanced Technologies, Systems, and Applications III. IAT 2018; Lecture Notes in Networks and Systems; Avdaković, S., Ed.; Springer: Cham, Switzerland, 2019; Volume 60. [Google Scholar] [CrossRef]
- Štroner, M.; Urban, R.; Suk, T. Filtering Green Vegetation Out from Colored Point Clouds of Rocky Terrains Based on Various Vegetation Indices: Comparison of Simple Statistical Methods, Support Vector Machine, and Neural Network. Remote Sens. 2023, 15, 3254. [Google Scholar] [CrossRef]
- Available online: https://www.unesconadosah.sk/lokalita-spisske-podhradie (accessed on 1 February 2024).
- Available online: https://old.uzemia.enviroportal.sk/main/detail/cislo/523 (accessed on 1 February 2024).
- Available online: https://www.spisskepodhradie.sk/ (accessed on 1 February 2024).
- Available online: https://eurokamen.sk/ (accessed on 1 February 2024).
- Leica GS07. Geotech. Available online: https://www.geotech.sk/Produkty/GPS-GNSS/Leica-GS07.html (accessed on 10 February 2024).
- Available online: https://www.dji.com/sk/phantom-4-pro-v2/specs (accessed on 5 February 2023).
- Available online: https://enterprise.dji.com/phantom-4-rtk/specs (accessed on 5 November 2023).
- Leica RTC360. Geotech. Available online: https://www.geotech.sk/downloads/Laserove-skenery-HDS/Leica_RTC360_sk2.pdf (accessed on 10 February 2024).
- Cao, J.; Dai, Y.; Hu, L.; Liang, Y.; Liu, Y.; Yang, B. [Retracted] Slope Topography Monitoring Based on UAV Tilt Photography Technology and Sensor Technology. J. Sens. 2022, 2022, 3531576. [Google Scholar] [CrossRef]
- Filipova, S.; Filipov, D.; Raeva, P. Creating 3D model of an open pit quarry by UAV imaging and analysis in GIS. In Proceedings of the International Conference on Cartography and GIS, Albena, Bulgaria, 13–17 June 2016; Volume 6, p. 652. [Google Scholar]
- Chen, J.; Li, K.; Chang, K.-J.; Sofia, G.; Tarolli, P. Open-pit mining geomorphic feature characterization. Int. J. Appl. Earth Obs. Geoinf. 2015, 42, 76–86. [Google Scholar] [CrossRef]


Disclaimer/Publisher’s Note: The statements, opinions and data contained in all publications are solely those of the individual author(s) and contributor(s) and not of MDPI and/or the editor(s). MDPI and/or the editor(s) disclaim responsibility for any injury to people or property resulting from any ideas, methods, instructions or products referred to in the content. |
© 2024 by the authors. Licensee MDPI, Basel, Switzerland. This article is an open access article distributed under the terms and conditions of the Creative Commons Attribution (CC BY) license (https://creativecommons.org/licenses/by/4.0/).