Abstract
The hydrological characteristics of gravel-containing soils are different from those of gravel-free soils, so it is worth further understanding and enriching the theory of soil and water conservation. In this study, adjustable slope (10°, 20°, 30°) test soil boxes with different surface gravel contents (0%, 25%, 50%, 75%, 100%) were prepared to study the runoff erosion characteristics of gravel-covered land slopes under different rainfall conditions (10 mm/h, 20 mm/h, 30 mm/h). Compared with the bare soil, the runoff start time of the three slopes covered with 100% soil surface gravel content is delayed by 38.90, 32.83 and 73.39%, the runoff producing rate of gravel condition under different slopes decreased by 7.20–71.52% and the total amount of sediment yield decreased by 7.94~84.57%. Surface gravel cover can effectively reduce runoff and sediment yield, which is beneficial for better soil and water conservation. The results of this study have a certain reference value for the theory of soil and water conservation and can be used as a basis for guiding efficient agricultural production in gravel-mulched land and construction (like road slope improvement).
1. Introduction
Soil erosion is the natural process in which the topsoil of a field is carried away by one or more natural or factitious erosive forces (wind, rain, runoff, gravity, farming, etc.) [1]. In tropical, temperate and Mediterranean regions, soil erosion is increasing due to anthropogenic impacts [2,3,4,5]. It causes siltation of rivers and lakes; contributes to floods and other disasters; restricts sustainable development; seriously threatens soil resources, agricultural productivity and water quality; and leads to serious ecological, economic and social problems [6,7,8,9,10,11]. Soil erosion research in various erosion conditions and various regions can give a theoretical basis for soil and water conservation.
Due to the significant economic and environmental consequences caused by soil erosion, it has attracted extensive attention from scholars [12]. Many experiments on runoff and erosion have been conducted [13,14,15,16,17]. The key elements influencing erosion include topography, surface conditions, soil characteristics, soil moisture, and rainfall intensity and duration [18,19,20,21]. Among them, the effects of surface conditions on soil erosion have attracted a lot of attention from scholars. Kateb et al. (2013) conducted a field experiment to investigate soil erosion and surface runoff under various plant covering and slope conditions [22]. Prosdocimi et al. (2016) investigated the direct influence of barley straw mulching on soil erodibility and the formation of surface runoff [23]. Zhang et al. (2015) investigated the effect of vegetation on runoff and soil erosion in a reclaimed land dump in a loess location [24]. All of these studies show that surface conditions such as roughness, vegetation and structure have an important influence on runoff generation and erosion. The increase in roughness will increase soil infiltration and delay the production time of runoff [25,26,27]. Li et al.’s research showed that with the increase in the complexity of vegetation patterns, the proportion of large aggregates and the stability of aggregates on the wall of most terraces showed an increasing trend, which could effectively reduce soil erosion [28]. Mulch has been found to be effective in reducing soil loss. Some studies have shown that straw mulch can effectively reduce slope runoff and soil erosion. The effects of different amounts and lengths of straw mulch on surface runoff and soil loss were different [29].
Gravel mulching (covering the soil with a layer of rock debris 15 cm thick) is a traditional technique in Northwest China. Gravel mulching was initially used to protect the soil from erosion and to increase the quantity and quality of crops [30,31]. Scholars have carried out various studies related to gravel-mulched fields. Zhao et al. (2018) studied the spatial variability of gravel-mulched fields of different ages in the arid region of Northwest China [32]. Li et al. (2003) studied the effect of gravel mulching on eolian dust accumulation in the semi-arid region of Northwest China [33]. The impact of gravel mulch on hydrological processes and soil erosion has attracted the attention of many researchers [34,35,36]. Previous research found that when the percentage of gravel mulch increases, runoff and erosion decrease [37,38]. It is generally believed that gravel cover has the following effects on soil surface runoff and soil erosion [39,40,41,42,43]: Firstly, gravel mulch can protect the soil surface, reduce raindrop energy [44], and thus weaken raindrop splash erosion [39,45]. Secondly, gravel mulch changes the surface roughness [37]. Previous studies have confirmed that surface roughness affects soil infiltration rate [38,46] as rough surfaces have more macro-pores and are therefore more conducive to rainfall infiltration [47,48,49]. In addition, the gravel mulching of a soil surface can effectively prevent soil surface sealing and slow down the runoff rate [50]. In summary, surface gravel cover delays runoff time and prevents surface closure, resulting in reduced runoff production and increased soil permeability, thereby reducing erosion. Jomaa et al. (2012a) used different gravel coverages in laboratory flume experiments and showed that raindrop detachment is proportional to effective rainfall and exposed soil area, other factors being equal (previous moisture content, bulk density and surface roughness) [51]. Gravel cover also significantly affected the time needed to reach a steady state for sand production at the soil surface; i.e., its presence reduced the time needed to reach stable conditions [52]. However, other studies have reported that gravel cover may lead to different soil erosion outcomes depending on its characteristics (covering pattern, rock size, etc.) [53].
Although researchers have done a lot of work on gravel-mulched soils, previous studies had limitations, such as conducting experiments using water erosion tests [42,43], which do not effectively replicate rainfall erosion processes under natural conditions; employing a single rainfall intensity in experimental designs [45], failing to differentiate the impacts of different rainfall conditions on experimental outcomes; conducting experiments under natural field conditions [50], lacking precise control over gravel cover levels; carrying out experiments under lower slope conditions [42], with limited research on the effectiveness of gravel cover under steeper slope conditions; and investigating gravel contents below 50%, necessitating further research on higher gravel content coverages [54]. Thus, studies were conducted on gravel-mulched slopes with various soil surface gravel contents under simulated rainfall circumstances. The variations in runoff and sediment processes of five soil surface gravel content types, three rainfall intensity types and three slope types are investigated on this premise. The objective of this research was to evaluate the effects of different soil surface gravel contents, slopes and rainfall intensities on runoff and sediment yields in gravel-mulched land, as well as to identify certain theoretical ideas that may be used to appropriately utilize a gravel-mulched field.
2. Materials and Methods
2.1. Experimental Control Variables
Experimental control variables were set according to the actual situation of the study area. Because there are many hills and mountains in the area and in reference to previous studies [55], the slope of the soil trough in this experiment was set to 10°, 20° and 30°. The study area is located in the arid region of Northwest China, where the multi-year average rainfall is less than 200 mm. Due to the lax maintenance of the weather stations set up in the study area, we only had limited measured rainfall data. According to the analysis of rainfall data recorded by the automatic weather station of the study area from 2009 to 2010 and 2014, the maximum instantaneous rain intensity was 29.4 mm/h [56]. Therefore, 30 mm/h was used as the upper limit of rainfall intensity in this experiment, and the rainfall intensity was set to 10 mm /h, 20 mm/h, 30 mm/h. Soil surface gravel content in gravel-mulched land will decrease with increasing service life. In view of this, the experiment set soil surface gravel content to 0% (bare soil), 25%, 50%, 75% and 100% (pure gravel). The designed experimental conditions are shown in Table 1.

Table 1.
Experimental factors.
2.2. Gravel and Soil
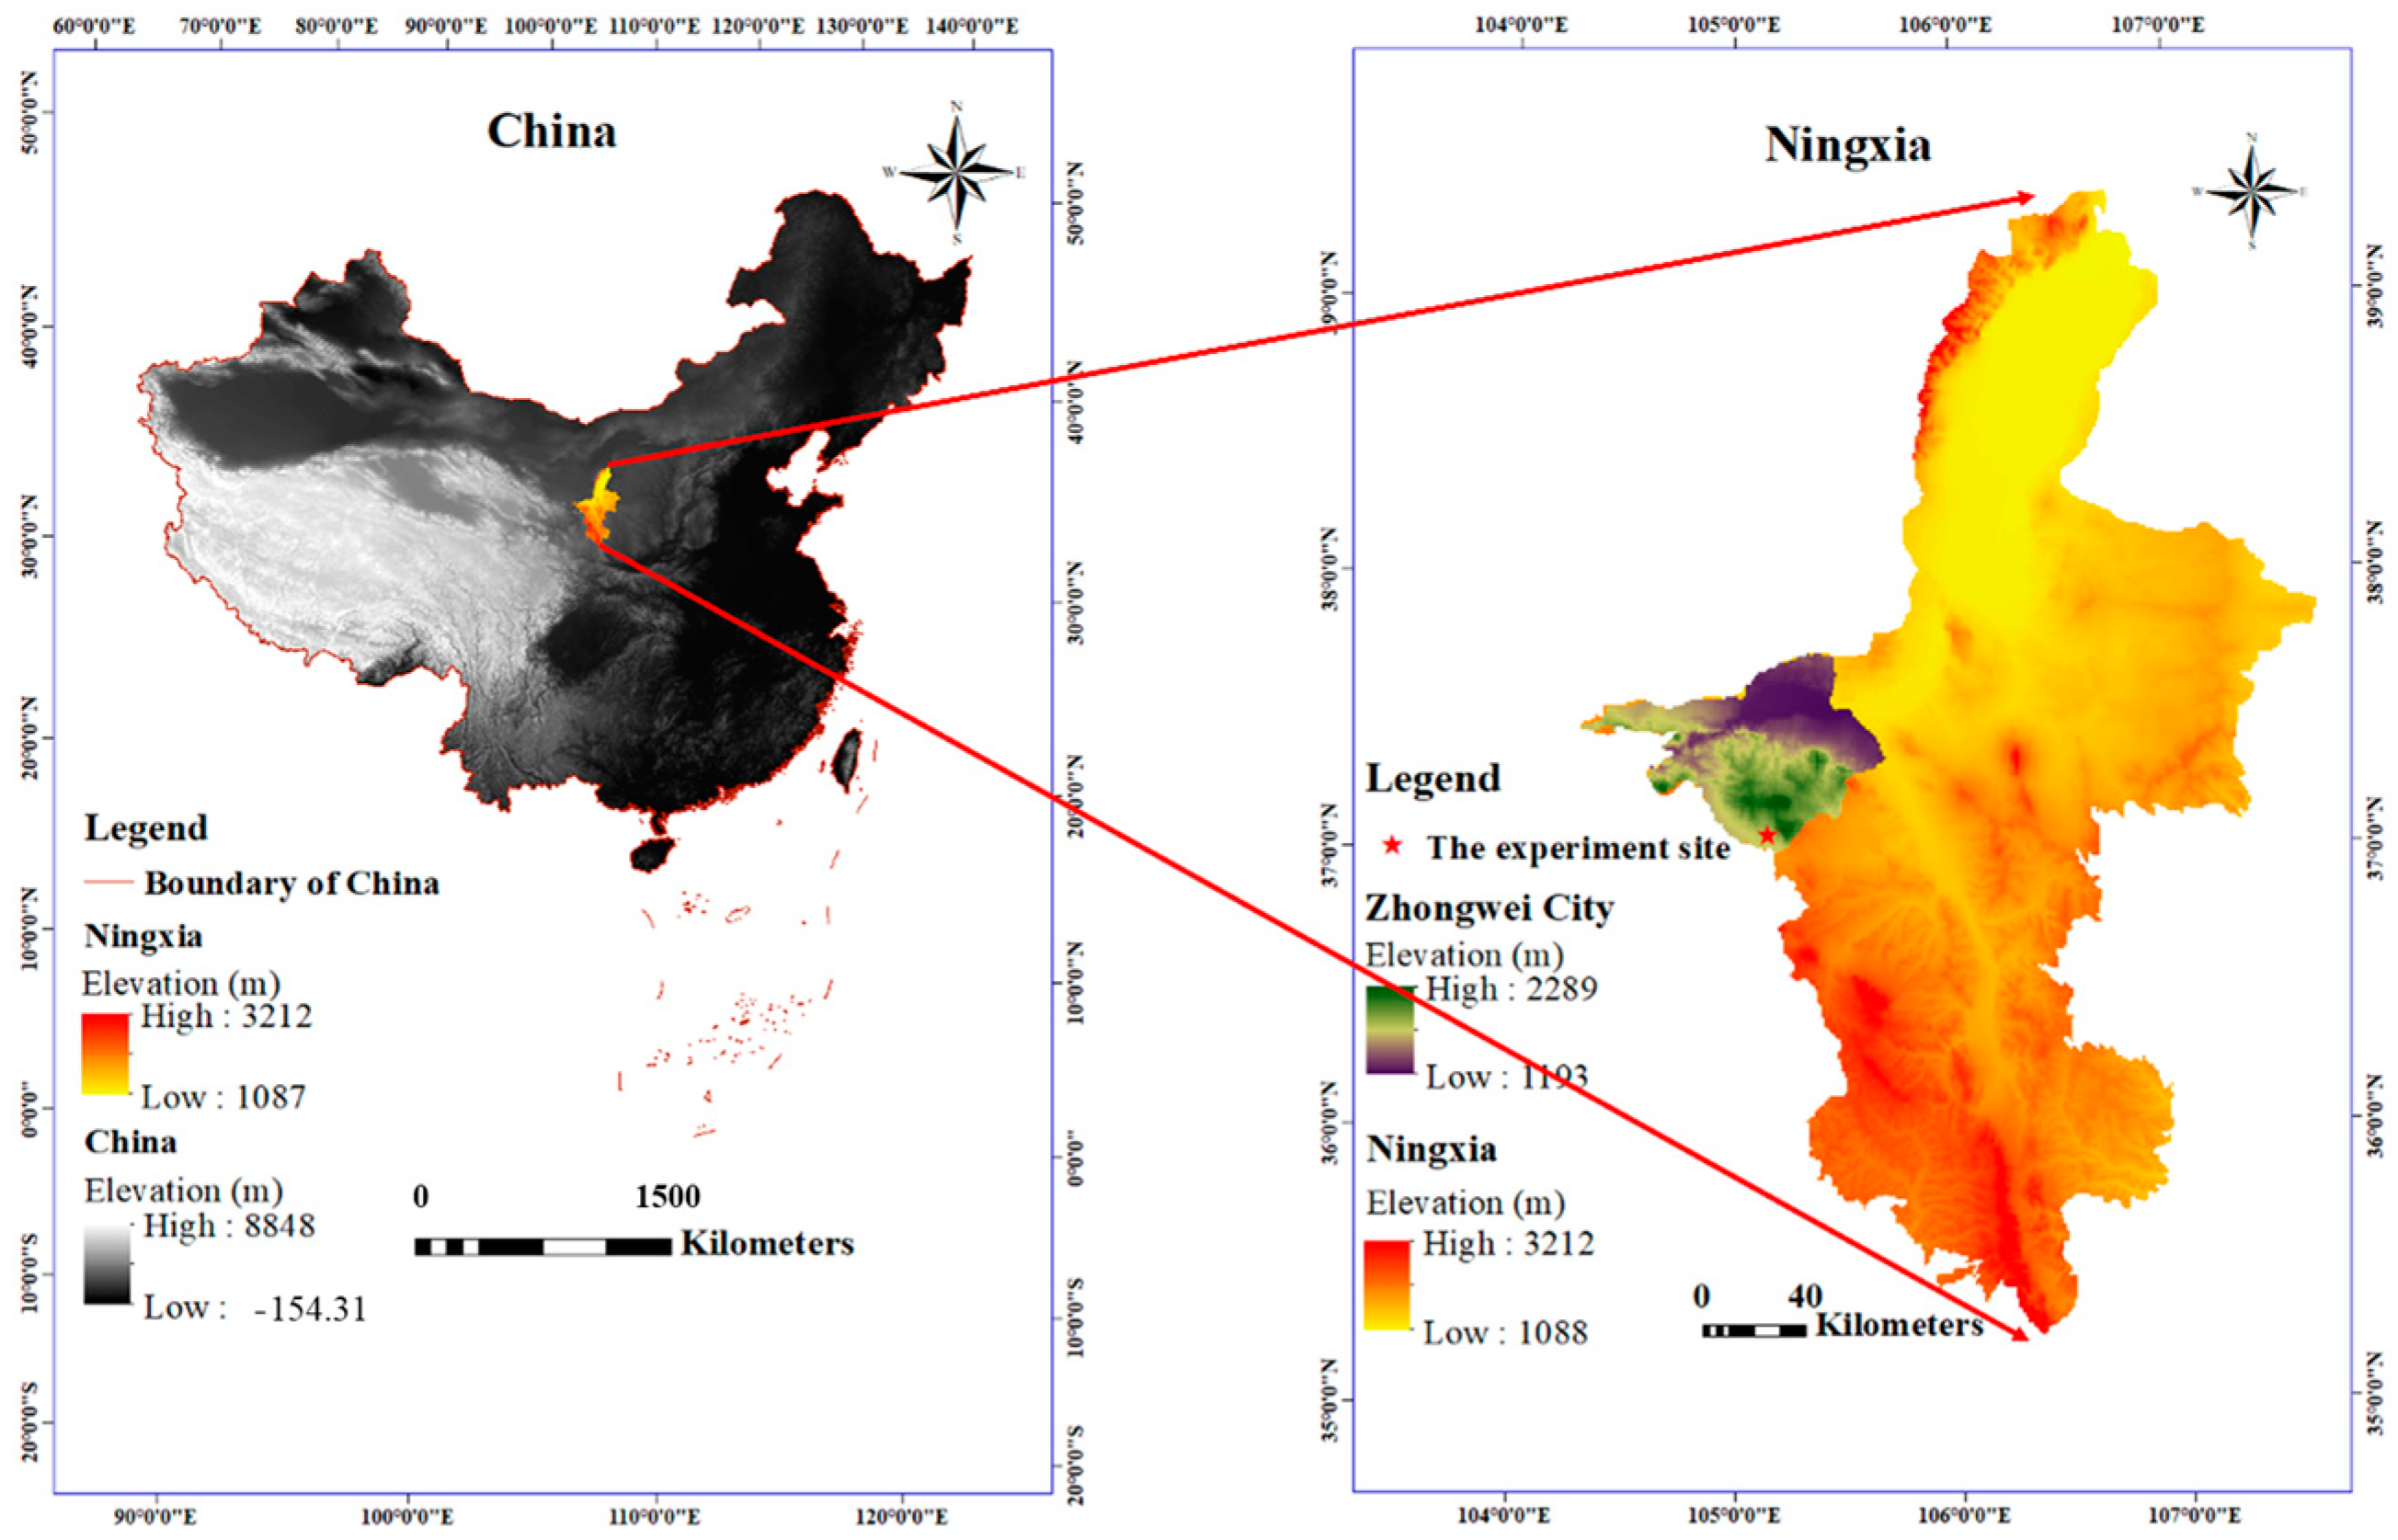
Experiment soil and gravel (naturally irregular, angular gravel) were taken from Hongquan Village, Shapotou District, Zhongwei City, and Ningxia Hui Autonomous Region, China (Figure 1). The average annual rainfall is less than 200 mm. Precipitation is mainly concentrated in summer, and snowfall is rare. According to previous research [56] and local farmers’ experience, the gravel was sieved through stainless steel sieves (with mesh sizes 1 cm and 3 cm). The collected natural gravel was first passed through a 3 cm mesh sieve and then passed through a 1 cm mesh sieve. After sieving, the gravel was washed and dried for later use.

Figure 1.
The location of the experiment site in Ningxia, China.
Seven layers of soil were collected at intervals of 5 cm from the surface to a depth of 35 cm, and the soil was put through a 10 mm sieve to remove rocks. The sieved soil of each layer was dried on a thick tarpaulin in a greenhouse [57].
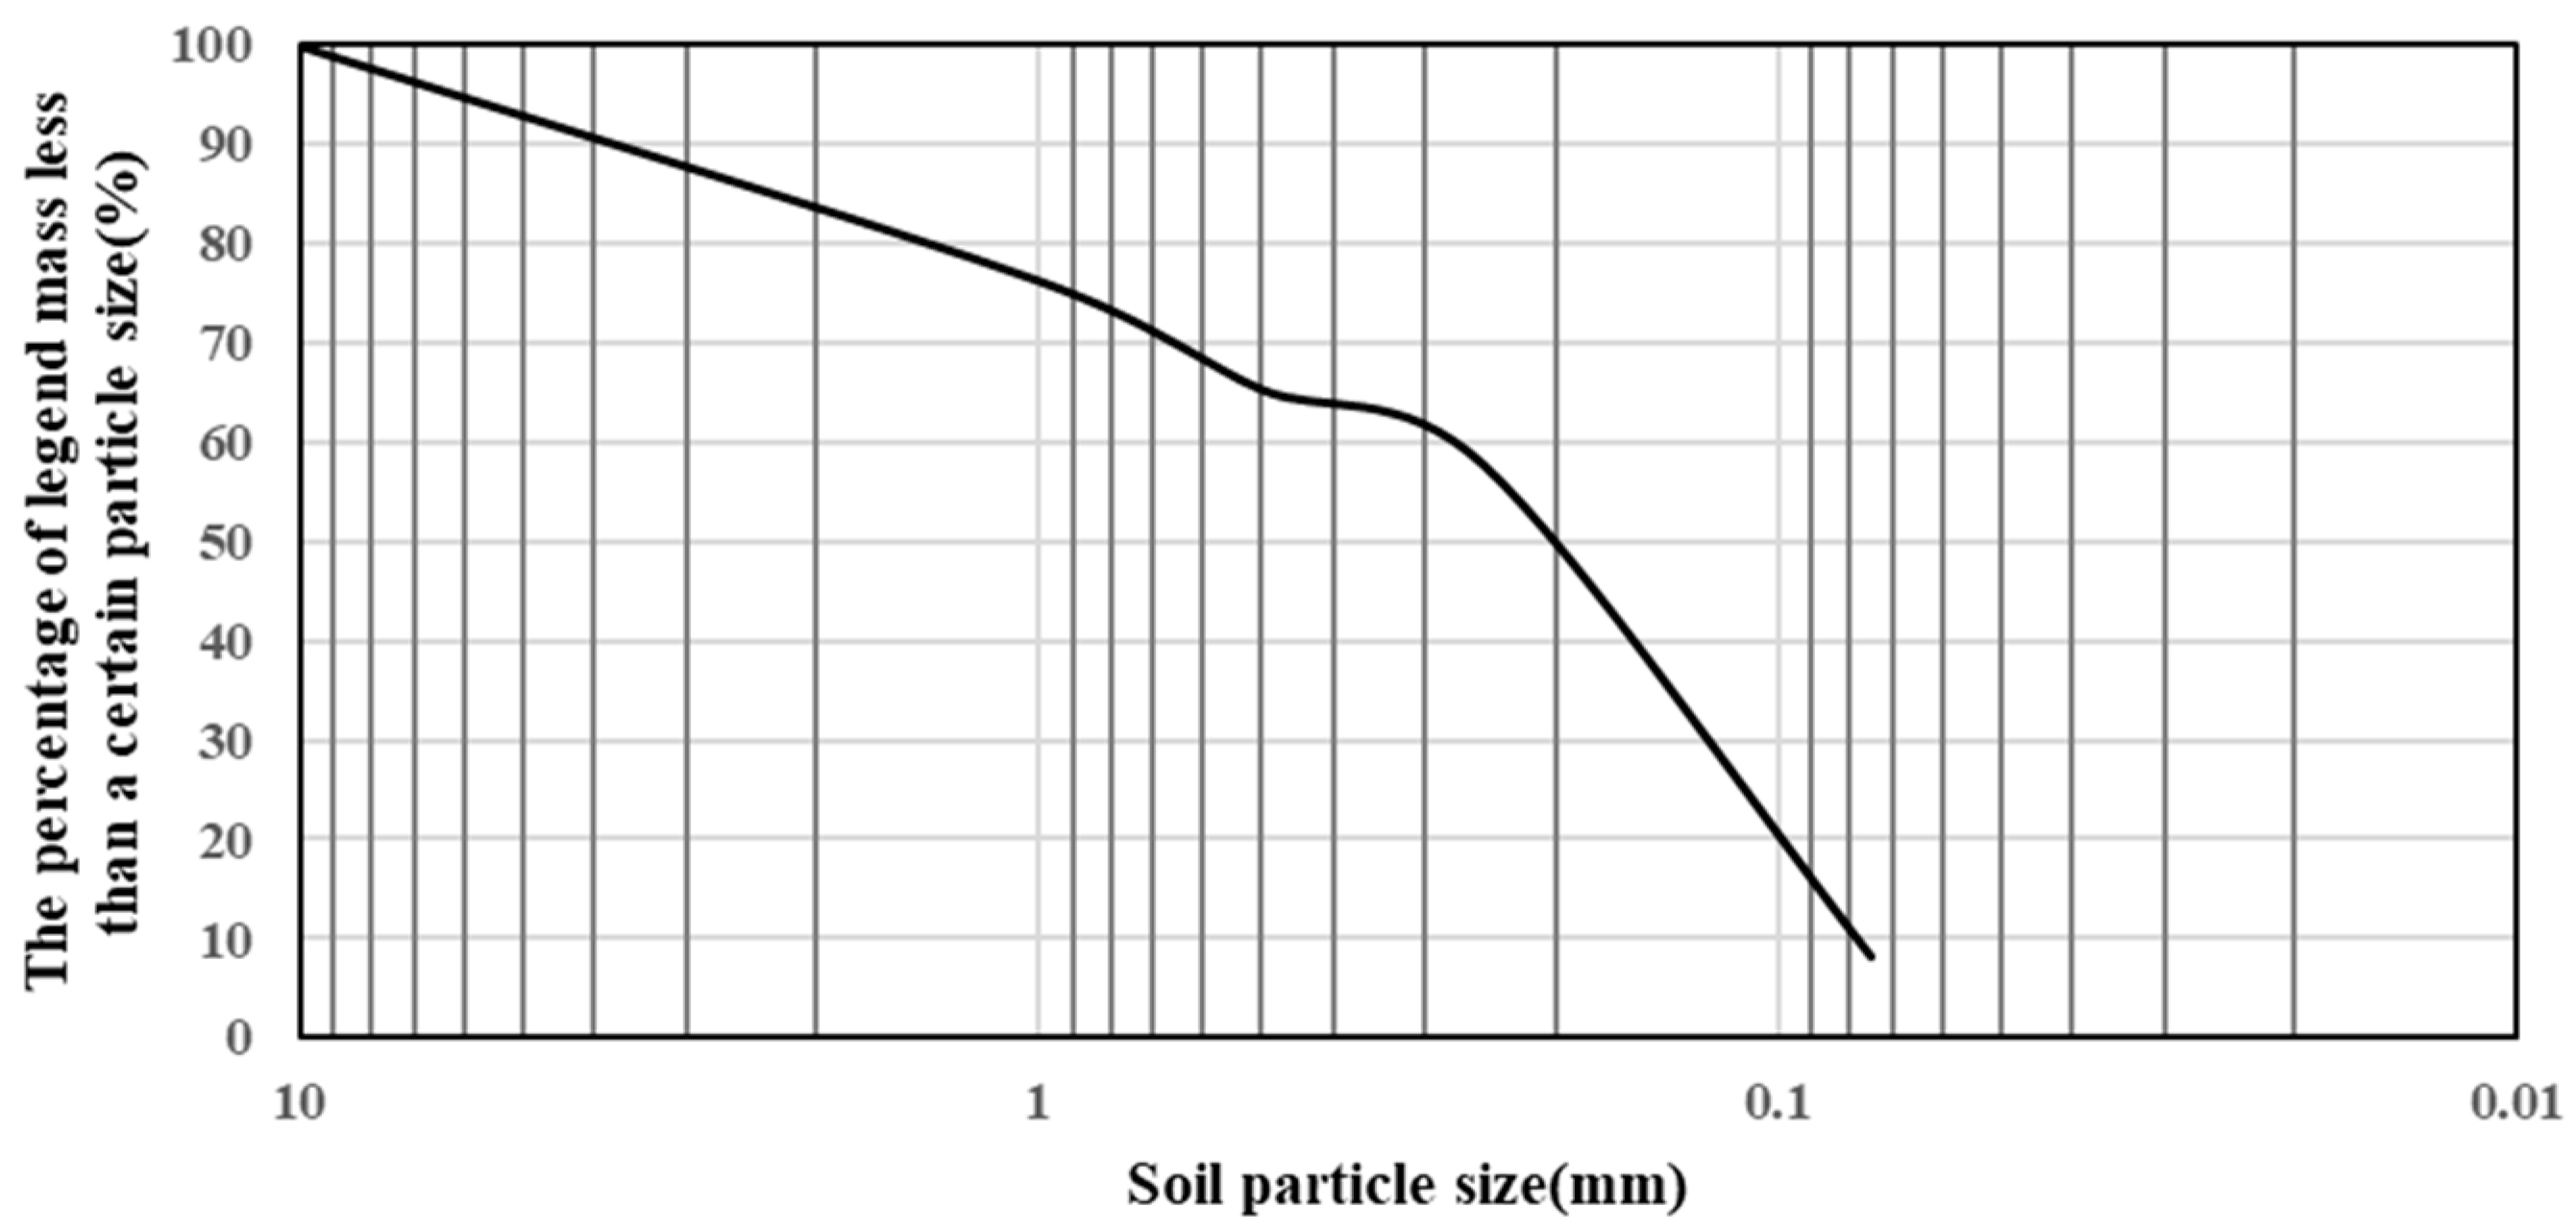
The local soil is yellow-white, belonging to the subcategory of calcareous soil, and soil particle grading is shown in Figure 2. The pH value of soil measured by the potentiometric method ranged from 8.22 to 8.44. The range of EC values measured by a probe was 809.43–873.09 µS/cm. Both pH and EC were measured in soil layers at a depth of 10 cm.
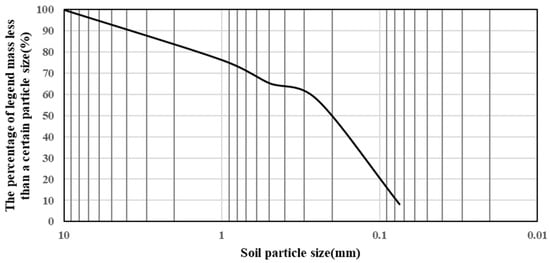
Figure 2.
Soil particle size distribution curve.
2.3. Experimental Device
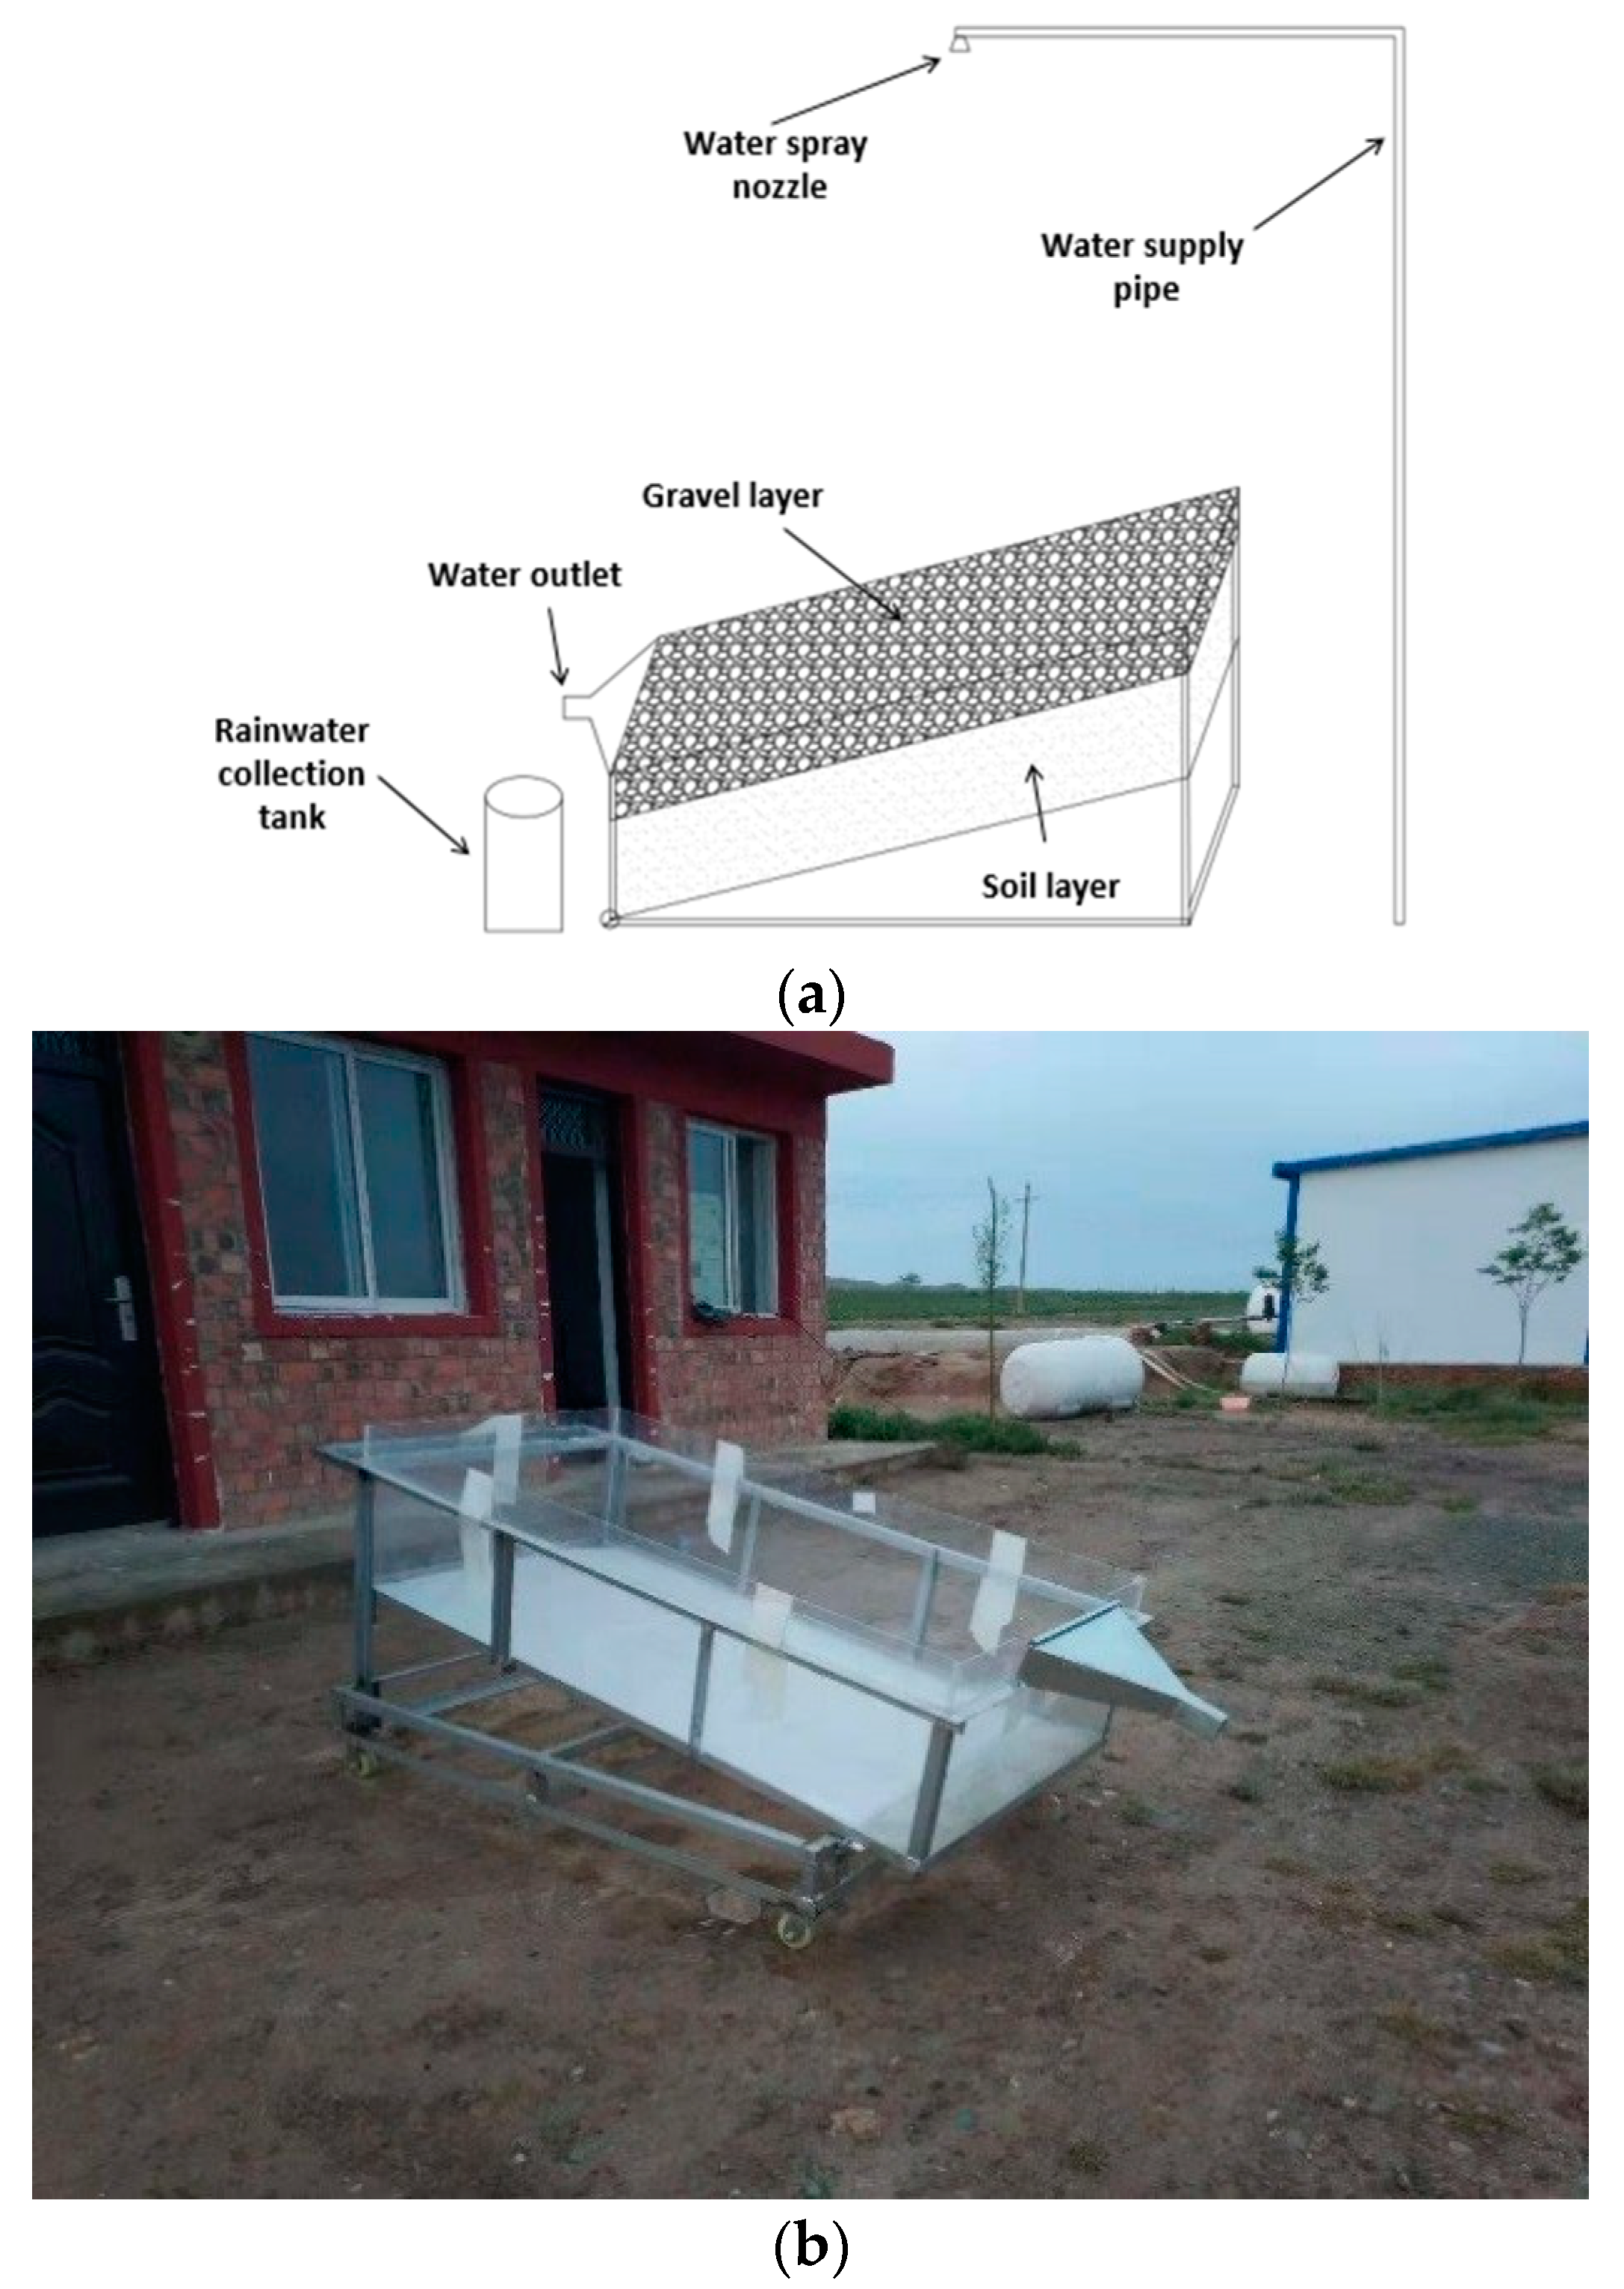
The rainfall simulator included a steel bracket, a water pump, water supply pipes, valves and a round nozzle that could adjust the size of water droplets. In order to make the final velocity of raindrops close to natural rainfall, the sprinkler of the rainfall simulator was located at a height of 4 m from the soil surface [57]. The raindrop size was 1.7–2.8 mm with a uniformity of 90%. The rainfall simulator was calibrated before the start of each experiment, so as to achieve the goal that the rain intensity meets the experimental requirements and the characteristics of raindrops are close to natural rainfall. The upper 15 cm of the soil box was the gravel-bearing layer, and the lower 35 cm was the soil layer. The soil box was placed on an angle-adjustable steel frame, and the slope could be adjusted according to the requirements of the experiment. The schematic diagram of the simulated rainfall device and the soil trough is shown in Figure 3a.

Figure 3.
Experimental device. (a) Design of the experimental device; (b) Soil tank.
The soil tank (2 m long, 1 m wide and 0.5 m high) used in this experiment was composed of acrylic sheet and steel support, and the bottom of the soil tank had uniform drainage holes to facilitate the free infiltration of water. A diversion channel was set at the outlet of the soil tank to collect the runoff and generated sand. The experimental device of the soil trough is shown in Figure 3b.
2.4. Experimental Procedure
The thickness of the soil in the soil tank was 35 cm. Before the experiment, processed soil was put in the soil tank layer by layer. Then, according to the experience of local farmers and local standards [58], 15 cm of soil with different gravel contents was spread on the top layer. After the soil was filled, the soil tank was subjected to pre-rainfall with an intensity of 10 mm/h for 10 min. This is because artificial filling can make the topsoil fluffier than it would be under natural conditions. Pre-rainfall can accelerate the soil settlement through the infiltration process after rainfall and keep the soil properties as stable as possible before the formal experiment. After 24 h of pre-rainfall, the soil moisture content was measured by the drying method. The experiments began when the soil moisture content was between 3 and 5%. Moreover, the soil and gravel in the experimental tank were replaced after each experiment.
The rainfall duration was set to 1 h. The rainfall intensity of each experiment was measured by 5 rain gauges placed within the effective rainfall range, and the error of the hourly rainfall intensity was within ±2 mm (if the hourly rainfall intensity deviation measured by the 5 rain gauges in a certain experiment exceeded ±2 mm, the experiment was invalid).
Because the runoff rate fluctuated greatly in the early stage of runoff, and the fluctuation in the runoff rate became smaller after 20 min from the start of runoff, in order to reduce the workload without affecting the experimental results, water samples were taken with a measuring cylinder (accuracy of 1 mL) every 3 min in the first 21 min and every 10 min after 21 min. The sampling vessel was placed at the outlet for 10 s to collect the water samples, and the volumes of the water samples were recorded. After the recording, the water sample was allowed to settle, and the upper layer of water was extracted via a syringe. The remaining turbid water sample was placed in an aluminum box and dried in an oven for 12 h. The amount of sediment yield was measured by the weighing method (the accuracy of the electronic scale is 0.01 g); the rest of the total runoff water was collected in a bucket, and sediment was measured after the experiment.
In this study, the experiment was repeated 3 times in each condition to improve the reliability of the data. All subsequent data used for analysis were the average of the 3 replicates.
2.5. Statistical Data Analysis
In order to evaluate the representativeness of the results obtained under different experimental conditions, a statistical analysis was performed. In this study, the Pearson method was used for correlation analysis, and the significance was evaluated by a double-tail test. The statistical analysis was performed using Origin 2017 software.
3. Results
3.1. Runoff Start Time
Table 2 shows the runoff start time under different slope and soil surface gravel con-tent conditions at 30 mm/h rainfall intensity. Compared with the bare soil, the runoff start time of the three slopes with 100% soil surface gravel content is delayed by 38.90, 32.83 and 73.39%. Under identical soil surface gravel content conditions, the runoff at slopes of 10° and 20° occurs significantly later compared to that at a 30° slope, with the former two exhibiting runoff start times 1.8 to 2.7 times longer than the latter.
Table 2.
Runoff start time under different slope and soil surface gravel content conditions.
Table 2 also shows the runoff start time under different soil surface gravel content and rainfall intensity for a 30° slope. In each soil surface gravel content condition, when the rainfall intensity increased from 10 to 20 mm/h, the runoff start time advanced by 43.20% (bare soil), 41.25% (25% soil surface gravel content), 39.31% (50% soil surface gravel content), 18.71% (75% soil surface gravel content) and 20.05% (100% soil surface gravel content). When the rainfall intensity continued to increase to 30 mm/h, the runoff start time advanced by 31.19% (bare soil), 24.86% (25% soil surface gravel content), 20.71% (50% soil surface gravel content), 25.62% (75% soil surface gravel content) and 28.55% (100% soil surface gravel content). Under the same soil surface gravel content and slope gradient, the greater the rainfall intensity, the earlier the runoff appeared.
In general, the start time of runoff is negatively correlated with slope and rainfall intensity, and positively correlated with soil surface gravel content. Soil surface gravel content can delay the runoff start time, and the higher the soil surface gravel content, the greater the delay.
3.2. Runoff Discharge and Total Runoff
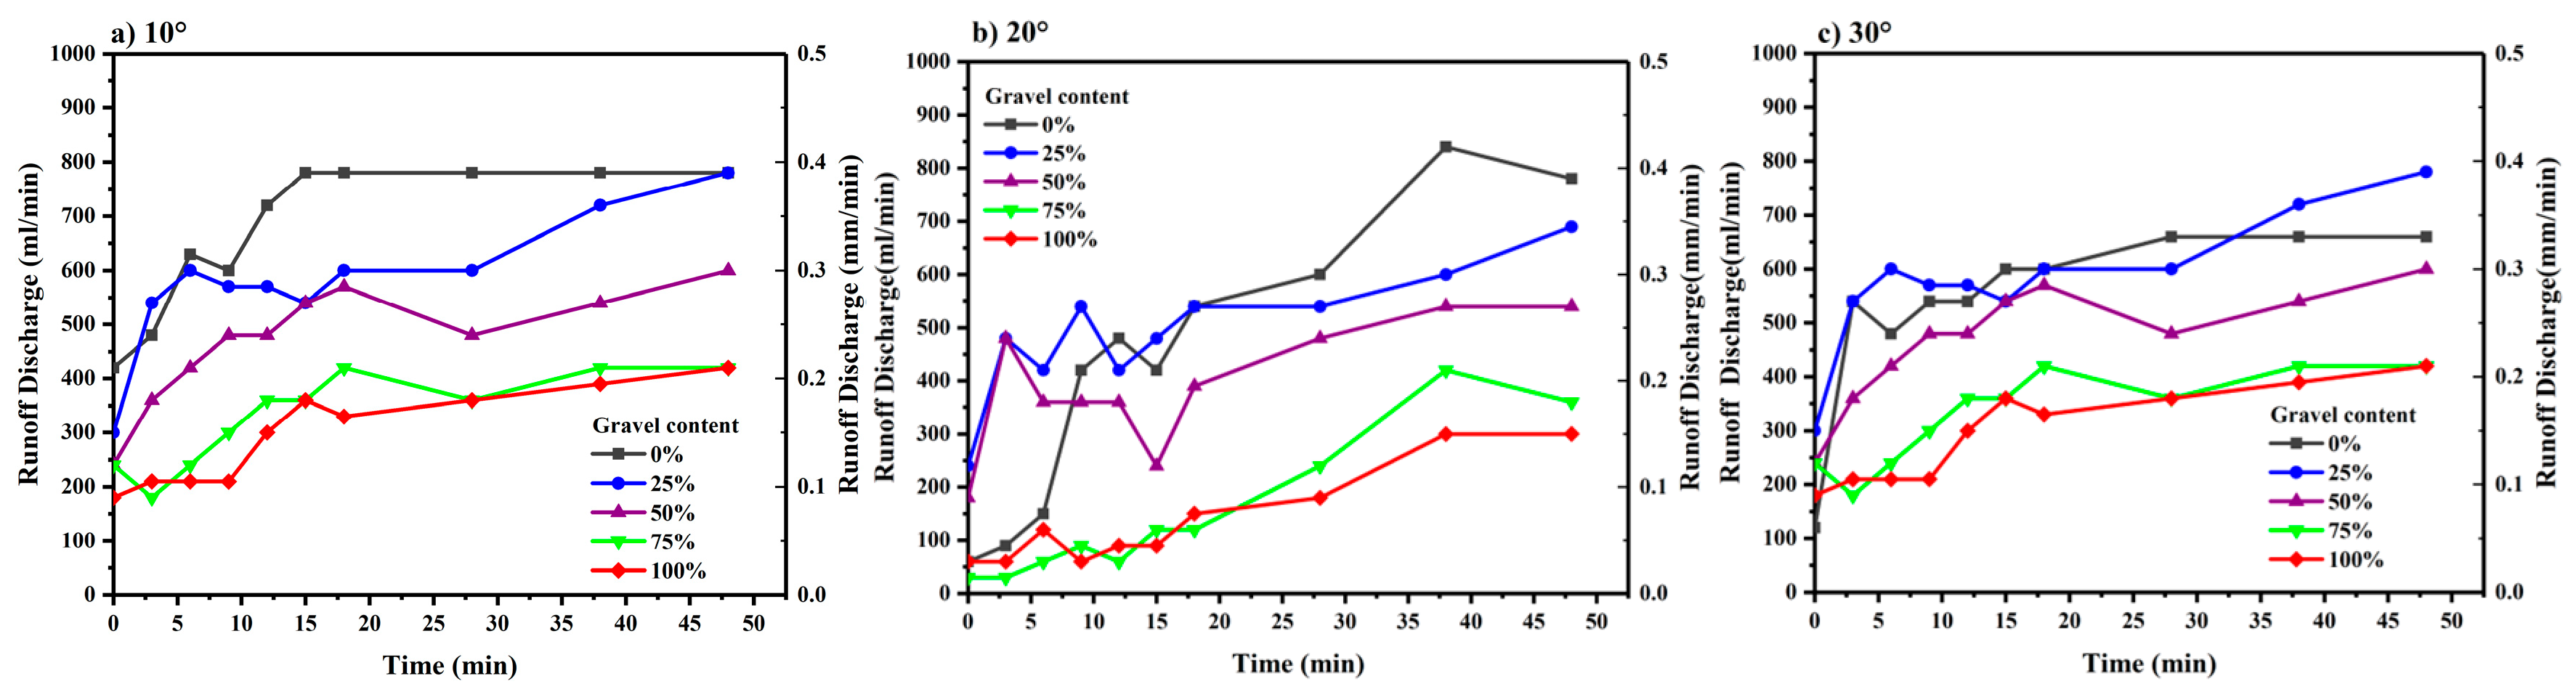
Figure 4 shows the runoff discharge for different soil surface gravel content conditions under different slope conditions at 30 mm/h rainfall.
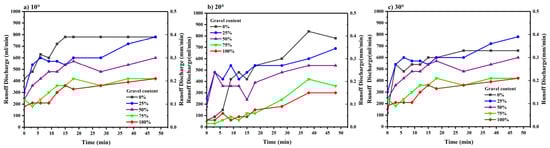
Figure 4.
Runoff discharge of different soil surface gravel contents at gradient of (a) 10°, (b) 20°, (c) 30°.
Compared with bare soil, the runoff discharge of gravelly soil under different slopes decreased by 7.2–13.78 (25% soil surface gravel content), 20.61–30.22 (50% soil surface gravel content), 33.33–69.09 (75% soil surface gravel content) and 38.89–71.52% (100% soil surface gravel content). It can be seen that the difference in runoff discharge between 75% and 100% soil surface gravel content conditions is small. That means after 75% soil surface gravel content there is no obvious change in runoff discharge. At a 10° slope, 25% soil surface gravel content reduced average runoff by 13.78%, and 100% gravel reduced average runoff by 56%. However, at 20° and 30° slopes, the reduction effect of less soil surface gravel content (25%) on runoff is no longer obvious, but the reduction effect of more soil surface gravel content on runoff is still significant.
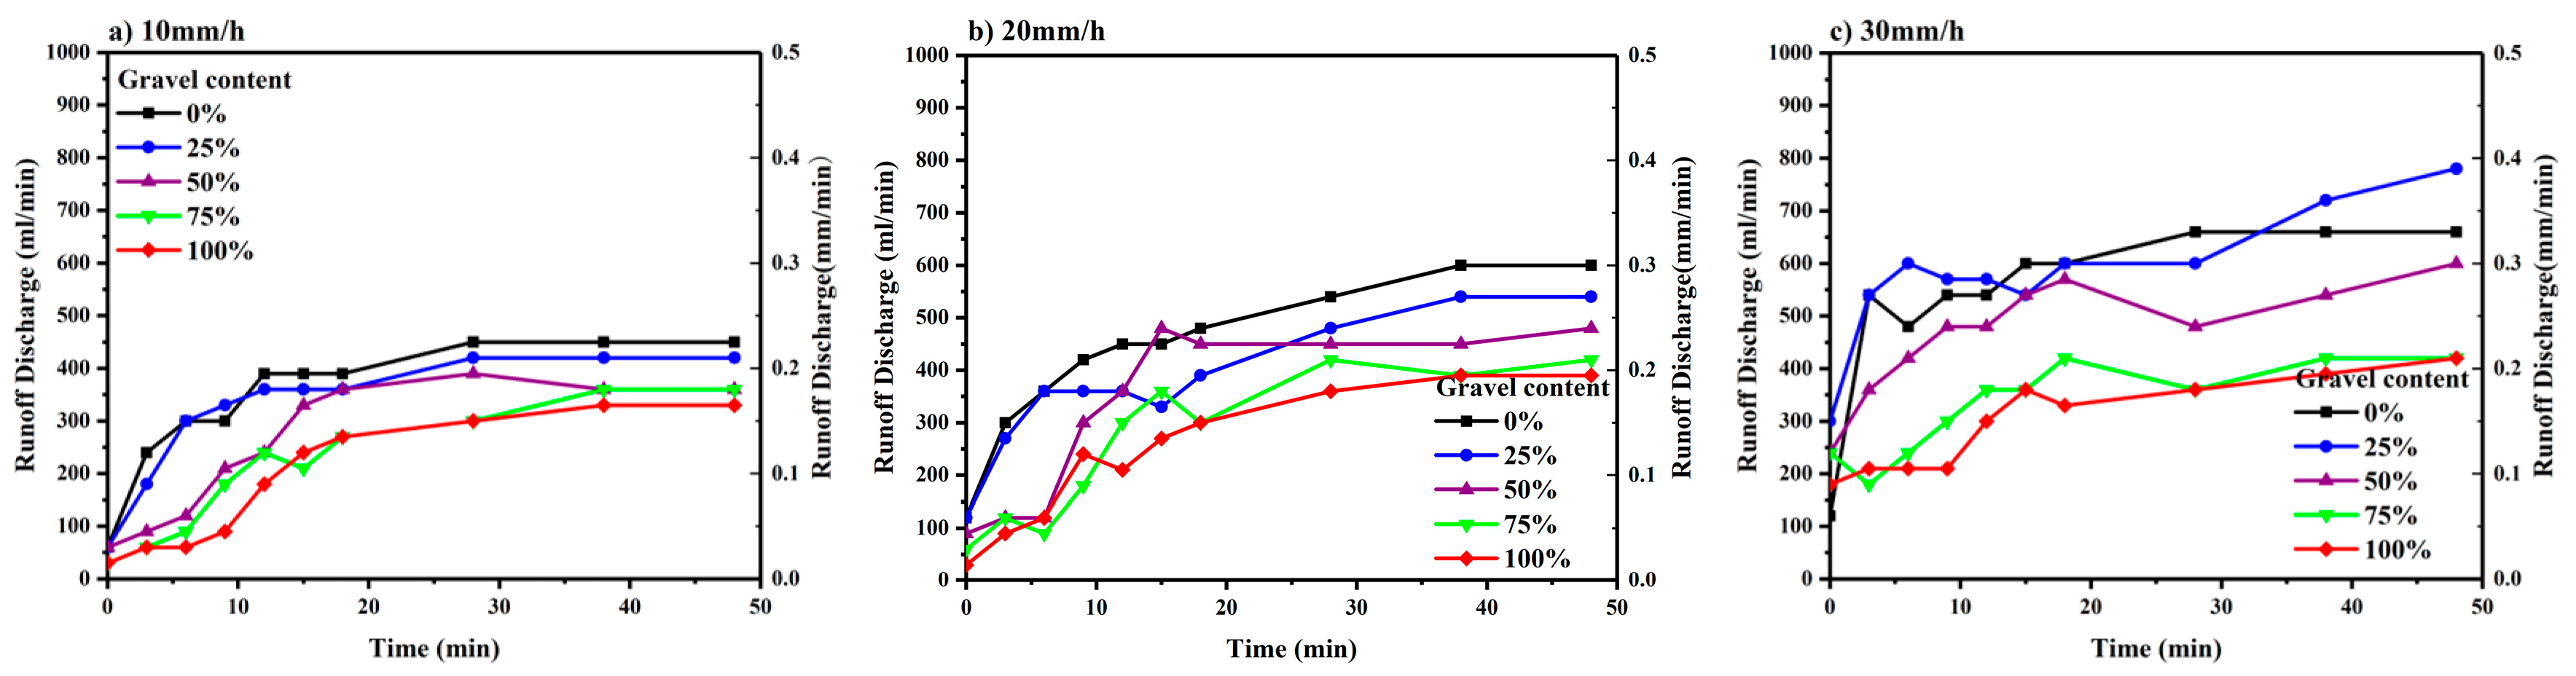
When the soil surface gravel content and slope are the same (30°), the runoff discharge increases with an increase in rainfall intensity (Figure 5).
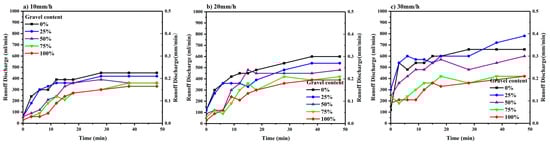
Figure 5.
Runoff discharge of 30° slope and different soil surface gravel contents under (a) 10 mm/h, (b) 20 mm/h, (c) 30 mm/h rainfall intensity.
Under different rainfall intensities, soil surface gravel content has an obvious reducing effect on runoff. In addition, the greater the rain intensity, the greater the peak runoff. With light rain intensity, stable runoff can be reached quickly.
Under any conditions (rainfall intensity, slope, soil surface gravel content), the runoff discharge first increases rapidly and then basically stabilizes. This phenomenon is related to changes in soil moisture and infiltration caused by rainfall. Adding gravel to soil can effectively reduce runoff, but the intensity of the effect is affected by slope and rainfall intensity [59].
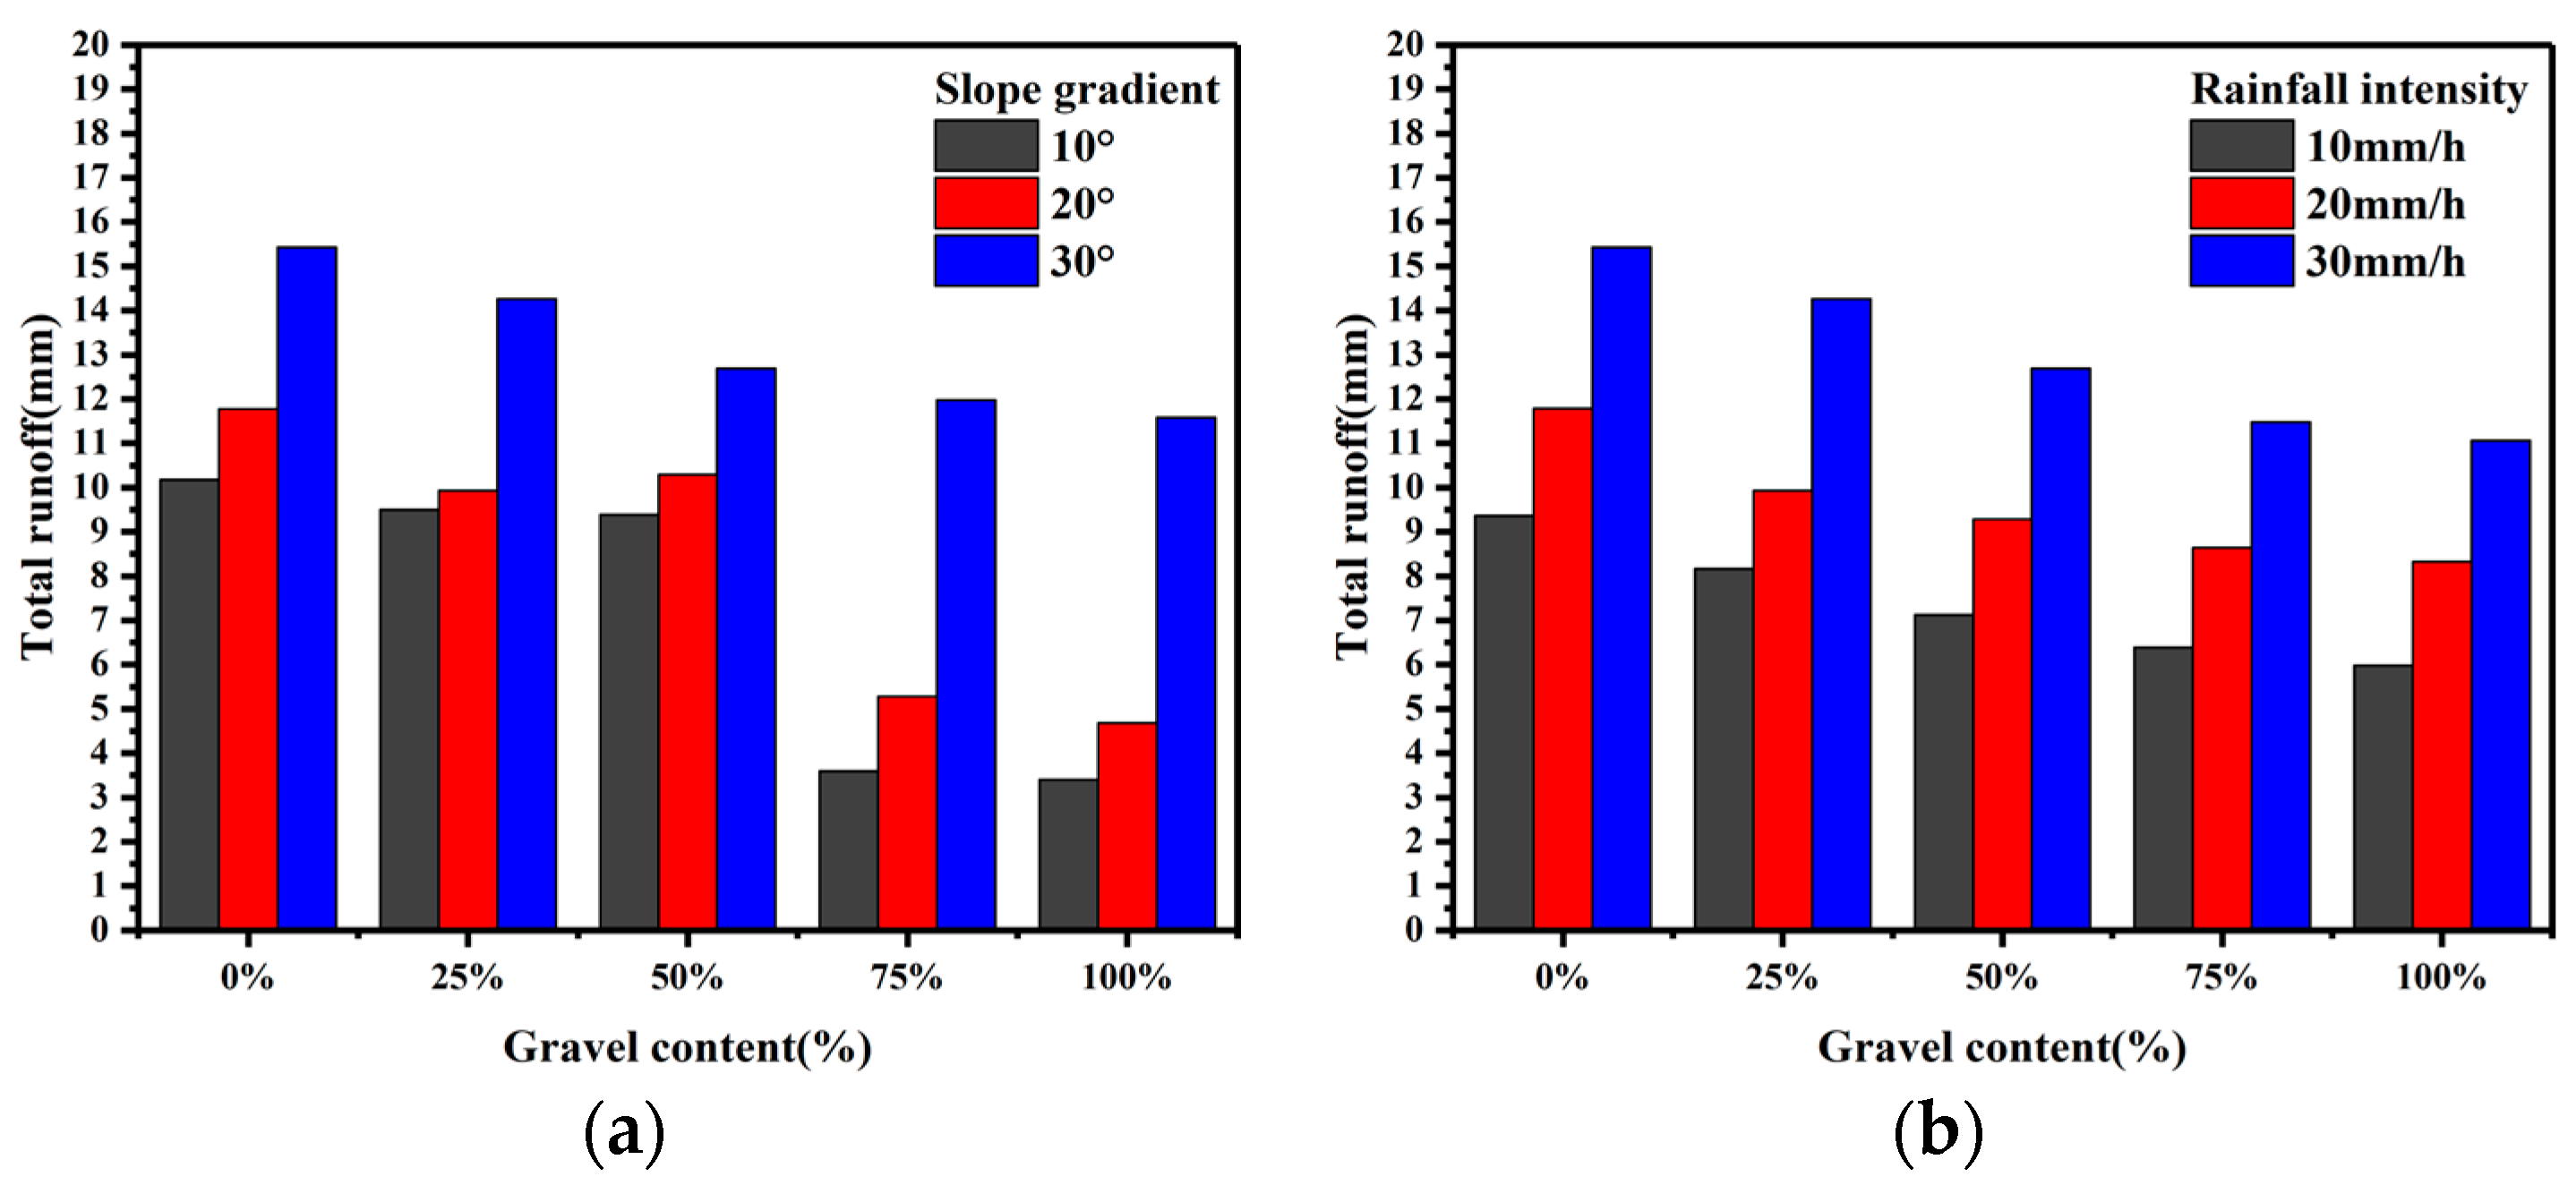
Figure 6a shows the total runoff under different slopes and different soil surface gravel contents when the rainfall intensity is 30 mm/h. When the soil surface gravel content and slope are the same, the total amount of runoff increases with the increase in the slope. As shown in Figure 6b, the total runoff of different soil surface gravel contents increased with the increase in rain intensity. Compared with the rainfall intensity of 10 mm/h, the total runoff under the rain intensity of 20 mm/h is significantly increased under the conditions of different soil surface gravel contents. For example, the increase rate is 25.89% under the condition of bare soil and 39.10% under the condition of pure gravel coverage. Regardless of the soil surface gravel content, the total runoff under 30 mm/h rain intensity increased by at least 60% compared with 10 mm/h rain intensity. As shown in Table 3, compared with bare soil, gravel mulch conditions can effectively reduce runoff discharge, especially when the rainfall intensity is 20 mm/h and the soil surface gravel content is 75%.
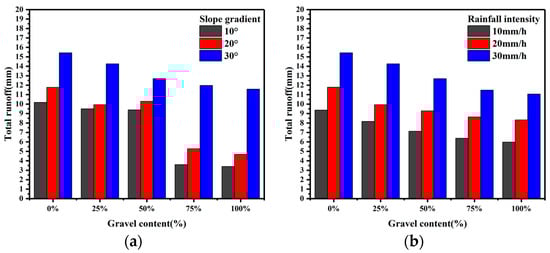
Figure 6.
Total runoff under (a) different slope gradients, (b) different rainfall intensities.
Table 3.
Flow and sediment reduction ratio of soil surface gravel contents under different rain intensities compared with bare soil condition.
3.3. Sediment Transport Rate and Soil Loss
Figure 7 shows the sediment transport rate curve of different slopes and soil surface gravel contents under 30 mm/h rainfall intensity. As can be seen from the figure, soil surface gravel content has different effects on the sediment transport rate for different slopes.
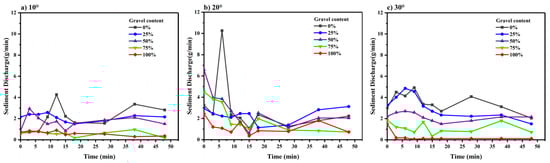
Figure 7.
Sediment discharge of each soil surface gravel content at a slope of (a) 10°, (b) 20°, (c) 30°.
When the slope is 10° and 20° (Figure 7a,b), the sediment transport rate curves of different soil surface gravel content conditions intersect each other in the middle and late stages of runoff, but the sediment transport rate curves of 75% soil surface gravel content and 100% soil surface gravel content conditions are below those of the other three soil surface gravel content conditions. When the slope is 30° (Figure 7c), the sediment transport rate under different soil surface gravel content conditions is basically as follows: bare soil > 25% soil surface gravel content > 50% soil surface gravel content > 75% soil surface gravel content > 100% soil surface gravel content. Overall, the sediment transport rate of the condition with low soil surface gravel content is mostly higher than the condition with high soil surface gravel content, and the sediment transport rate of the condition with low soil surface gravel content fluctuates distinctly.
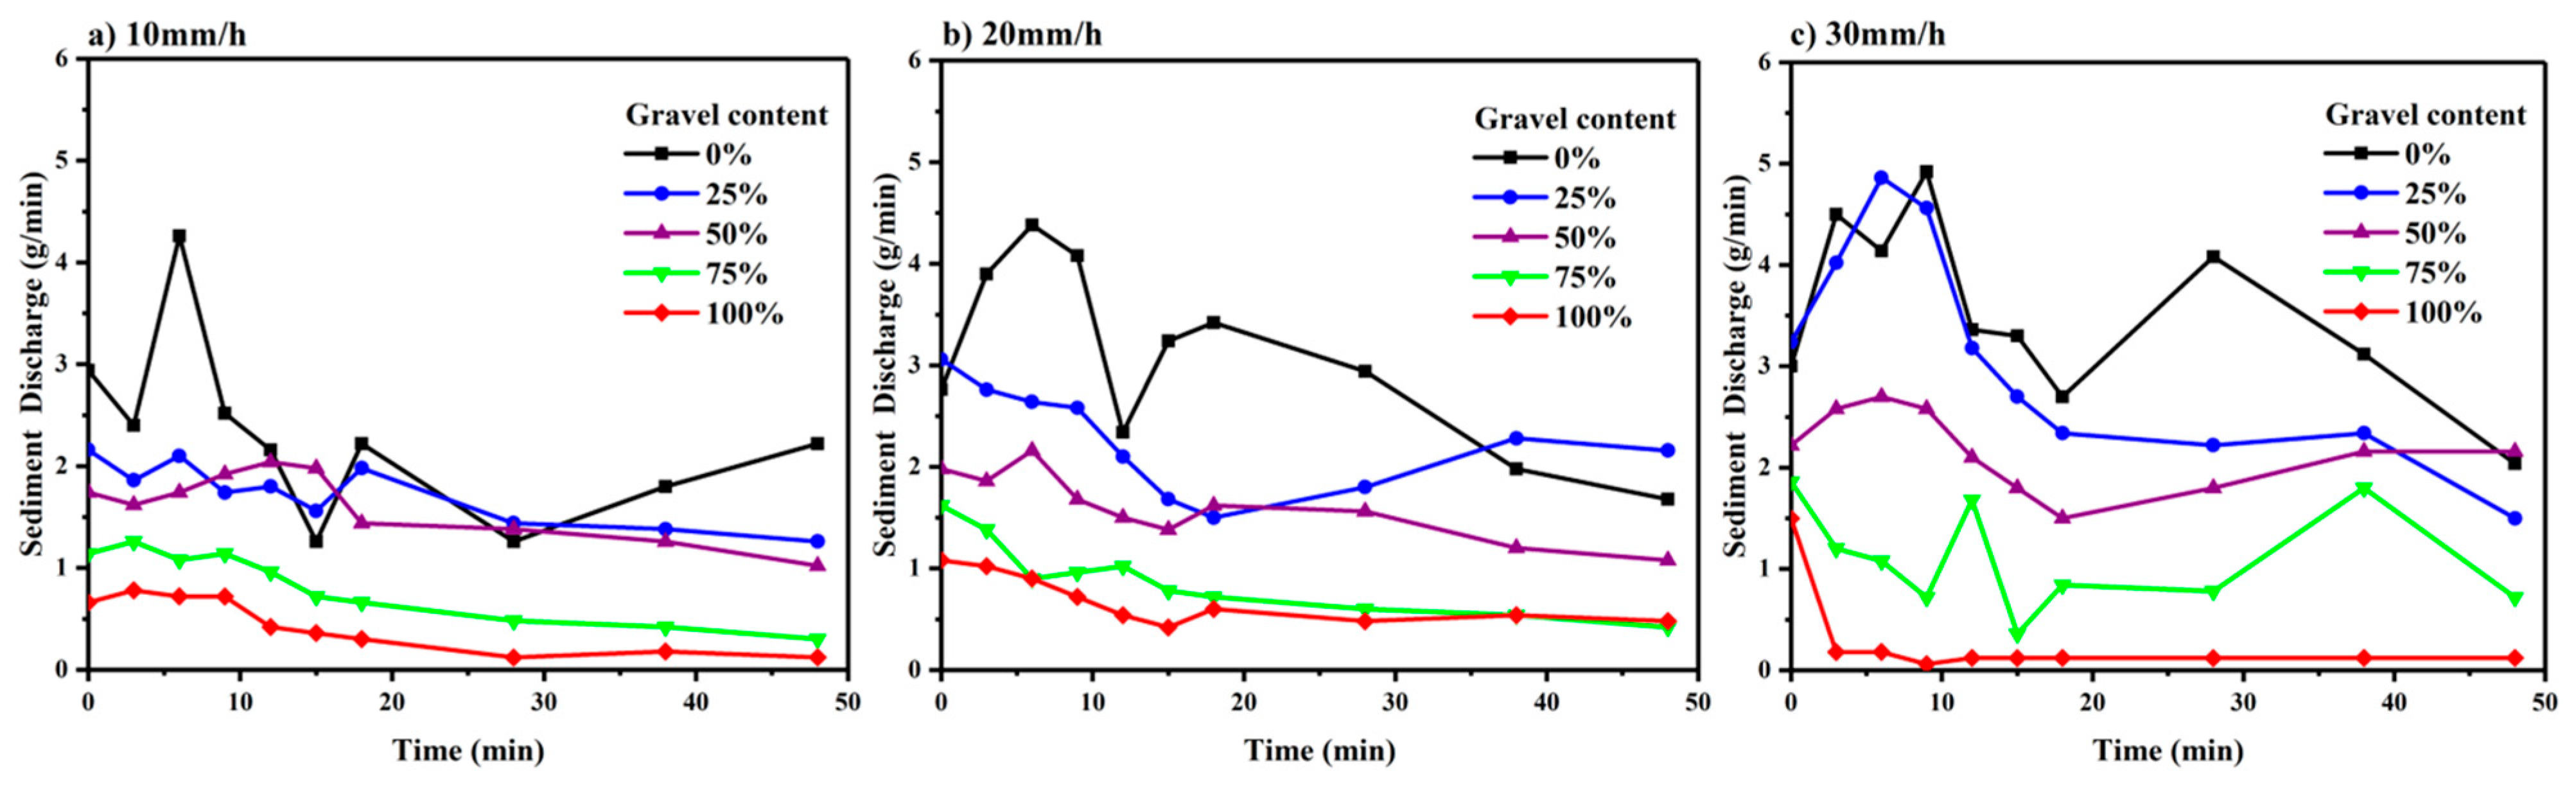
Figure 8 shows the sediment transport rate under various rainfall intensities and different gravel conditions. It can be seen that the sediment transport rate under various rainfall intensity conditions generally shows a trend of fluctuation and reduction with runoff duration and increases with increasing rainfall intensity.
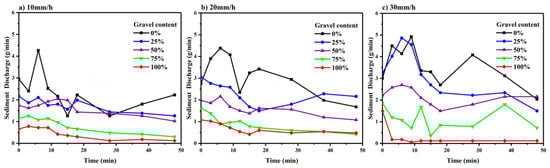
Figure 8.
Sediment discharge of each soil surface gravel content at a rainfall intensity of (a) 10 mm/h, (b) 20 mm/h, (c) 30 mm/h.
In addition, there are obvious peaks in the treatment of bare soil and 50% soil surface gravel content with a slope of 10° (Figure 7a), in the treatment of bare soil with a slope of 20° (Figure 7b), and in the treatment of bare soil and 25% soil surface gravel content with a slope of 30° (Figure 7c). A similar phenomenon can be seen in Figure 8. But this phenomenon only occurs under conditions of low gravel content.
Figure 9a shows the soil loss for each soil surface gravel content condition at different slopes at a rainfall intensity of 30 mm/h. It can be seen from the figure that, at the gradient of 10°, the soil loss of 25% soil surface gravel content was the largest, followed by that of bare soil, followed by that of 50% soil surface gravel content, followed by that of 75% soil surface gravel content, and pure gravel coverage treatment was the smallest, 67.71% less than that of bare soil treatment. When the soil surface gravel content is 25% and 50%, the soil loss is 17.17% and 37.27% lower than that of bare soil, respectively. When the soil surface gravel content is 75% and pure gravel is covered, soil loss is 88% lower than that of bare soil. Compared with bare soil at 30°, soil loss of different gravel contents is 7.94% (25% soil surface gravel content), 50.96% (50% soil surface gravel content), 63.41% (75% soil surface gravel content) and 84.57% (pure gravel coverage) lower than bare soil. In summary, gravel can effectively reduce soil loss and runoff, and the higher the soil surface gravel content, the better the effect. Under the conditions of three slopes, when the slope is 20°, the effect of gravel covering on soil loss is the most significant; 75% soil surface gravel content can reduce soil loss by 87.93%, followed by 30° and 10°.
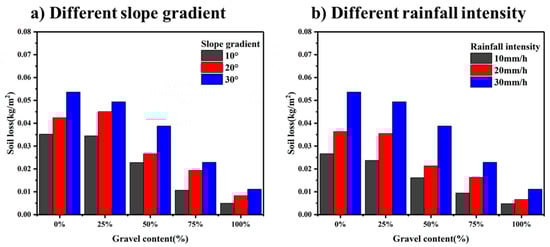
Figure 9.
Soil loss under (a) different slope gradients, (b) different rainfall intensities.
Figure 9b and Table 3 show the soil loss of overlying gravel under different rainfall intensities and different soil surface gravel content conditions. The figure and table show that with the same soil surface gravel content, soil loss increases with the increase in rainfall intensity. With the same rainfall intensity, soil loss decreased with the increase in soil surface gravel content. When the rainfall intensity was 10 mm/h, soil loss of each soil surface gravel content was 11.05% (25% soil surface gravel content), 39.49% (50% soil surface gravel content), 64.55% (75% soil surface gravel content) and 82.02% (pure gravel coverage) lower than that of bare soil condition. When the rainfall intensity was 20 mm/h, it decreased by 2.04% (25% soil surface gravel content), 41.39% (50% soil surface gravel content), 55.20% (75% soil surface gravel content) and 81.79% (pure gravel coverage). When the rainfall intensity was 30 mm/h, it decreased by 7.94% (25% soil surface gravel content), 50.96% (50% soil surface gravel content), 63.41% (75% soil surface gravel content) and 84.57% (pure gravel coverage). Regardless of the rainfall intensity, 50% soil surface gravel content condition can reduce soil loss by 40%~50%, and 100% soil surface gravel content can reduce soil loss by more than 80%.
4. Discussion
Runoff, as a sediment transporter, plays a significant role in soil erosion [60]. One of the most important variables influencing runoff is early soil moisture [61]. The soil moisture of all the experiments in this study was measured, and the soil moisture of each experiment was controlled at 3–5%. The difference in soil moisture had little influence on the experimental results, and its influence on runoff was not analyzed here. Runoff mechanisms differ significantly between gravelly soil and gravel-free soil [34,39,62]. In this study, 100% gravel content can be regarded as gravel on top of the soil and other soil surface gravel content conditions as gravel embedded in the soil. Research by Lavee et al. indicates that the embedded stone generates faster water flow on the ground and produces a higher flow rate than the “top” position [63]. This is contrary to the results of this study. This may be because natural gravel was used in this study, whereas the stones in their study had rectangular vertical cross-sections. In the case of the “top” position, water is less likely to penetrate near the edge of a stone with a rectangular vertical cross-section than it is in the case of natural stones.
4.1. Influence of Gravel Content on Runoff and Sediment
According to our findings, gravel mulching can greatly delay the runoff start time and reduce the discharge and total runoff and erosion. This is consistent with previous studies [49,54]. Qiu et al. studied the influence of different gravel sizes on runoff, and the results showed that the smaller the gravel size, the better the delay effect on runoff [45]. Martinez-Zavala et al. studied the influence of different gravel coverage on runoff and pointed out that the larger the gravel coverage area, the later the runoff was generated [50]. Gravel mulch increases the roughness of the soil’s surface [34]. Rough surfaces are thought to enhance soil resistance to disengagement by buffering raindrop impacts, increase the surface storage capacity of rainwater, lower runoff flow velocity, and thereby minimize runoff erosivity [23]. According to previous studies, the Darcy–Weisbach coefficient rises as the soil surface gravel content rises [64]. The flow of water on rough slopes, blocked by uneven gravel, consumes energy and slows down the flow rate. These combined effects cause a delay in runoff generation time and a reduction in runoff on gravelly soil slopes [65,66,67,68]. Increased soil surface gravel content increases soil porosity and considerably improves infiltration capacity, resulting in lower runoff [69]. Zhu and Shao (2006) investigated the impact of the debris content of four rock types on runoff in the loess region using a simulated rainfall experiment and came to the same conclusion. It should be emphasized that in this experiment, the gravel–soil mixture was covered on the soil surface, rather than implanted in the soil [70]. In this way, the surface of soil slopes is more porous and loose, and it is more conducive to infiltration [71]. However, there are some academics who argue the reverse. Li et al. studied the influence of different gravel contents on infiltration, and the results showed that gravel enhanced or weakened the infiltration capacity, which in turn affected the increase or decrease in accumulated runoff and accumulated sand. The cumulative infiltration volume of 25% gravel content is smaller than that of 0, 33.3% and 50% gravel content [42]. Luna et al. (2018) reported in their study that gravel reduces total porosity, easily leads to surface saturation and reduces infiltration capacity. This is most likely due to the fact that the gravel sizes they employ are too tiny (2–20 mm). A considerable amount of fine-grained gravel will not improve porosity, but it will clog the soil’s natural pores and reduce infiltration capability [72]. Qiu et al. (2020) found similar results, namely that cumulative infiltration decreases as gravel size decreases [45].
Our research discovered that when the soil surface gravel content increased, the total sediment yield and sediment discharge decreased. This is in line with the findings of Li et al. [66] and Kang et al. [73], who observed that as soil surface gravel content increased, soil loss on the Loess Plateau was reduced. Wang et al. (2014) found the same findings in their investigation of purple land area [74]. On the one hand, gravel content decreases erosion yield by increasing infiltration and reducing runoff [64]. Another benefit of gravel is that it preserves the soil. The total sediment yield depends on the ability of raindrop kinetic energy to damage soil aggregates. In the case of rainfall, the kinetic energy of raindrops decomposes soil aggregates into loose particles, which accelerates the rate of soil loss [75]. Gravel mulch may efficiently minimize raindrop splash erosion and raindrop kinetic energy [47,48] and decrease runoff erosivity by preventing raindrop impacts on soil [76]. However, Li et al.’s study on mountain yellow-brown soil drew different conclusions. Their study showed that the cumulative runoff under different gravel contents was 25 > 0 > 33.3 > 50%, while the cumulative erosion was 25 > 33.3 > 0 > 50% [42]. In conclusion, the influence of gravel cover on runoff varies with gravel size and soil type.
4.2. Influence of Rainfall Intensity on Runoff and Sediment
Runoff discharge and total runoff increased with the increase in rainfall intensity. High rainfall intensity usually leads to the destruction of more aggregates in the topsoil, thus increasing soil crust and pore blockage with the accumulation of rainfall [77,78]. Under the condition of the same slope gradient and soil surface gravel content, the greater the rainfall intensity, the smaller the fluctuation in the runoff rate. This is because the runoff erosion capacity is small when the rainfall intensity is small; the flow did not have sufficient power to detach particles and hence was essentially transporting sediment detached by raindrop impact [79], and it is easily affected by the soil surface micro-topography, so the runoff rate fluctuates dramatically. In the case of heavy rainfall intensity, runoff erosion capacity is stronger and runoff rate is higher, the influence from micro-topography is not significant. The erosion generation rate always increases with the increase in rainfall intensity. This can be attributed to the increased impact of raindrops and runoff on the soil; as the rainfall intensity increases, raindrop splashes provide more fine particles that can be carried away by runoff. With the increase in soil surface gravel content, the fluctuation in the erosion generation rate decreases. This is because the overlying gravel changes the soil surface structure. The greater the soil surface gravel content, the greater the hydraulic roughness. Flow energy is consumed by surface roughness [64], leading to a smaller fluctuation in sediment discharge.
4.3. Influence of Slope Change on Runoff and Sediment
The slope change will change the gravity component of the slope along the flow direction and the effective rain-bearing area of the slope. As the slope increases, the gravity component becomes larger, which may advance the start of runoff. In addition, the increase in slope may cause the small water storage space composed of gravel to tilt, making the micro-topography less capable of storing water and causing runoff to flow to the outlet earlier. The effective rain-bearing area will decrease as the slope increases, which may delay the start of runoff. In this study, under experiment conditions, the start time of runoff with a slope of 20° was not obviously advanced compared to 10°, which may be the result of the effective rain-bearing area playing a leading role. And the start time of runoff at a slope of 30° is much earlier than that of 20°, which may be caused by an increase in the gravity component due to the increase in the slope. When the gravel ratio and rainfall intensity are the same, the erosion yield increases with the increase in slope. Under normal circumstances, the increase in slope will accelerate the runoff, but the influence of other factors should be considered comprehensively under special terrain conditions. Similar conclusions were drawn by Chaplot et al. (2000), who studied the powdery loam in the Paris basin [80].
4.4. Analysis of Runoff Erosion Process
Under all conditions in this research, the runoff discharge increased first and then tended to stabilize or continue to rise. This is because, at the early stage of runoff, the soil water content has not reached saturation, the soil infiltration capacity is still strong, and there is more rainwater infiltration rather than runoff [81,82]. As the rainfall continues, the soil water gradually becomes saturated, the permeability weakens, and more rainwater forms runoff [83,84], so the runoff discharge increases. The sediment discharge gradually decreases with the duration and finally stabilizes. This is because there are some loose particles on the surface of the soil due to the disturbance during the loading process and the effect of rain splashing. These loose soil particles are quickly washed away by runoff at the beginning of runoff. Then, the separation and transportation of soil particles are carried out simultaneously, resulting in a lower sediment discharge in the later period [85,86].
In this experiment, the runoff and sediment discharge rate curve will have peaks and fluctuations. The authors believe that this may be due to the combined effect of micro-topography and runoff erosion. The gravel scattered on the surface of the soil may have a trapping effect on runoff, resulting in a small flow and erosion in a certain period. As more and more water is trapped, the potential energy of this part of the water gradually increases. When the runoff has accumulated enough energy to break through the small terrain that intercepts it, a large amount of erosion and runoff pours down. This phenomenon occurs repeatedly under the effect of runoff erosion, causing the runoff and sediment discharge to fluctuate. Compared with other soil surface gravel content conditions, the sediment discharge of bare soil or soil with a small soil surface gravel content at different stages is not only large but also fluctuates greatly, which indicates that the sediment yield of bare soil has a certain randomness. Because the soil is completely unprotected, the randomness of water flow when cutting the soil results in the randomness of sediment yield.
At present, gravel-mulched land is widely used in the study area. However, most of the previous studies focused on water-saving irrigation [87]. This study proved through laboratory experiments that gravel-mulched land has a good inhibitory effect on soil erosion. The research results can provide a reference for local soil erosion control and vegetation restoration and have a wide range of adaptability. For example, a combination of gravel mulch and jujube planting can be used to reforest the cultivated land. It is an ecological restoration measure worth promoting under local natural conditions. However, the potential environmental or ecological side effects of gravel mulch may require further study and discussion. For example, long-term gravel cover may lead to changes in soil chemical elements, which will have some positive or negative impacts on local soil, groundwater quality, and vegetation communities.
5. Conclusions
The central arid zone of Ningxia is windy all year round, with frequent heavy rainfall in the summer and serious soil erosion. In combination with the actual local weather and geographical conditions, this experiment set up three slopes (10°, 20°, 30°), five soil surface gravel content (0%, 25%, 50%, 75%, 100%) and three rainfall intensities (10 mm/h, 20 mm/h, 30 mm/h) as experimental variables to record and analyze the runoff and erosion deposition characteristics of gravel-mulched land.
The results suggested that gravel mulch has a good reduction effect on runoff and sediment. With the same slope and rainfall intensity, both the discharge and the total sediment yield decreased with the increase in soil surface gravel content. The start time of runoff is advanced with the increase in slope and rainfall intensity and delayed with the increase in soil surface gravel content. With the same rainfall intensity and soil surface gravel content, the discharge and the total sediment yield increased with the increase in slope; at the same slope gradient and soil surface gravel content, the discharge and total sediment yield increased with the increase in rainfall intensity. In general, gravel mulch has a strong reduction effect on runoff and sediment yield, and attention should be paid to its application potential in soil and water conservation. In future studies, studies on the long-term sustainability of gravel mulching and comparisons with other soil and water conservation measures should be carried out.
Author Contributions
Methodology, S.W.; Formal analysis, S.W.; Writing—original draft, S.W.; Writing—review & editing, P.L., W.L., J.L. and M.Z.; Supervision, P.L. and W.L. All authors have read and agreed to the published version of the manuscript.
Funding
Shaanxi Provincial Department of Education “Urban and Rural Spatial Hydrological Ecological Simulation and Management in Arid Area” Youth University Innovation Team, China Scholar-ship Council (Grant No.: Liujinmei [2022] No. 45; Liujinxuan [2022] No. 133; Liujinou [2023] No. 22), International Education Research Program of Chang’an University (300108221102), 2022 Guangdong University Youth Innovation Talent Program (2022KQNCX143) and Yinshanbeilu Grassland Eco-hydrology National Observation and Research Station, China Institute of Water Resources and Hydropower Research, Beijing 100038, China, Grant NO.YSS2022004.
Data Availability Statement
The original contributions presented in the study are included in the article, further inquiries can be directed to the corresponding author.
Conflicts of Interest
The authors declare no conflict of interest.
References
- Poesen, J.; Ingelmo-Sanchez, F.; Mucher, H. The hydrological response of soil surfaces to rainfall as affected by cover and position of rock fragments in the top layer. Earth Surf. Process. Landf. 2010, 15, 653–671. [Google Scholar] [CrossRef]
- Sinoga, J.D.R.; Murillo, J.F.M. Effects of soil surface components on soil hydrological behaviour in a dry Mediterranean environment (Southern Spain). Geomorphology 2009, 108, 234–245. [Google Scholar] [CrossRef]
- Dotterweich, M.; Stankoviansky, M.; Minár, J.; Koco, Š.; Papčo, P. Human induced soil erosion and gully system development in the Late Holocene and future perspectives on landscape evolution: The Myjava Hill Land, Slovakia. Geomorphology 2013, 201, 227–245. [Google Scholar] [CrossRef]
- Seeger, M.; Errea, M.-P.; Beguería, S.; Arnáez, J.; Martí, C.; García-Ruiz, J.M. Catchment soil moisture and rainfall characteristics as determinant factors for discharge/suspended sediment hysteretic loops in a small headwater catchment in the Spanish pyrenees. J. Hydrol. 2004, 288, 299–311. [Google Scholar] [CrossRef]
- Piao, S.; Ciais, P.; Huang, Y.; Shen, Z.; Peng, S.; Li, J.; Zhou, L.; Liu, H.; Ma, Y.; Ding, Y.; et al. The Impacts of Climate Change on Water Resources and Agriculture in China. Nature 2010, 467, 43–51. [Google Scholar] [CrossRef]
- Du, H.; Dou, S.; Deng, X.; Xue, X.; Wang, T. Assessment of wind and water erosion risk in the watershed of the Ningxia-Inner Mongolia Reach of the Yellow River, China. Ecol. Indic. 2016, 67, 117–131. [Google Scholar] [CrossRef]
- Wang, C.; Wang, B.; Wang, Y.; Wang, Y.; Zhang, W. Improved interrill erosion prediction by considering the impact of the near-surface hydraulic gradient. Soil Tillage Res. 2020, 203, 104687. [Google Scholar] [CrossRef]
- Jia, H.; Shun, D.; Fan, Z.; Dong, Y.; Shen, Y. Evolution in sandstone pore structures with freeze-thaw cycling and interpretation of damage mechanisms in saturated porous rocks. Catena 2020, 195, 104915. [Google Scholar] [CrossRef]
- Wang, T.; Jia, H.; Sun, Q.; Tan, X.; Tang, L. Effects of thawing-induced softening on fracture behaviors of frozen rock. J. Rock Mech. Geotech. Eng. 2023. [Google Scholar] [CrossRef]
- Liu, L.; Chen, M.; Luo, P.; Duan, W.; Hu, M. Quantitative Model Construction for Sustainable Security Patterns in Social–Ecological Links Using Remote Sensing and Machine Learning. Remote Sens. 2023, 15, 3837. [Google Scholar] [CrossRef]
- Wang, S.; Zhang, K.; Chao, L.; Chen, G.; Xia, Y.; Zhang, C. Investigating the feasibility of using satellite rainfall for the integrated prediction of flood and landslide hazards over Shaanxi Province in northwest China. Remote Sens. 2023, 15, 2457. [Google Scholar] [CrossRef]
- Gomes, L.; Arrúe, J.L.; López, M.V.; Sterk, G.; Richard, D.; Gracia, R.; Sabre, M.; Gaudichet, A.; Frangi, J.P. Wind erosion in a semiarid agricultural area of Spain: The WELSONS project. CATENA 2003, 52, 235–256. [Google Scholar] [CrossRef]
- Boer, M.; Puigdefábregas, J. Effects of spatially structured vegetation patterns on hillslope erosion in a semiarid Mediterranean environment: A simulation study. Earth Surf. Process. Landf. 2010, 30, 149–167. [Google Scholar] [CrossRef]
- Auzet, A.V.; Boiffin, J.; Ludwig, B. Concentrated flow erosion in cultivated catchments: Influence of soil surface state. Earth Surf. Process. Landf. 1995, 20, 759–767. [Google Scholar]
- You, Z.; Li, Z.B. Mechanism and experiment of vegetation on slope to reduce runoff and sediment. J. Sediment Res. 2011, 3, 59–62. [Google Scholar]
- Rmkens, M.J.M.; Helming, K.; Prasad, S.N. Soil Erosion under Different Rainfall Intensities, Surface Roughness, and Soil Water Regimes; Elsevier: Amsterdam, The Netherlands, 2002. [Google Scholar]
- Taguas, E.V.; Arroyo, C.; Lora, A.; Guzmán, G.; Vanderlinden, K.; Gómez, J.A. Exploring the linkage between spontaneous grass cover biodiversity and soil degradation in two olive orchard microcatchments with contrasting environmental and management conditions. SOIL Discuss. 2015, 2, 233–263. [Google Scholar] [CrossRef]
- Rimal, B.K.; Lal, R. Soil and carbon losses from five different land management areas under simulated rainfall. Soil Tillage Res. 2009, 106, 62–70. [Google Scholar] [CrossRef]
- Beullens, J.V.; van deNyssen, D.; Nyssen, J. Impact of slope aspect on hydrological rainfall and on the magnitude of rill erosion in Belgium and northern France. Catena Interdiscip. J. Soil Sci. Hydrol. Geomorphol. Focus. Geoecol. Landsc. Evol. 2014, 114, 129–139. [Google Scholar] [CrossRef]
- Sigua, G.; Coleman, S. Spatial distribution of soil carbon in pastures with cow-calf operation: Effects of slope aspect and slope position. J. Soils Sediments 2010, 10, 240–247. [Google Scholar] [CrossRef]
- Marzen, M.; Iserloh, T.; Casper, M.C.; Ries, J.B. Quantification of particle detachment by rain splash and wind-driven rain splash. Catena Interdiscip. J. Soil Sci. Hydrol. Geomorphol. Focus. Geoecol. Landsc. Evol. 2015, 127, 135–141. [Google Scholar] [CrossRef]
- El Kateb, H.; Zhang, H.; Zhang, P.; Mosandl, R. Soil erosion and surface runoff on different vegetation covers and slope gradients: A field experiment in Southern Shaanxi Province, China. Catena 2013, 105, 1–10. [Google Scholar] [CrossRef]
- Prosdocimi, M.; Jordán, A.; Tarolli, P.; Keesstra, S.; Novara, A.; Cerdà, A. The immediate effectiveness of barley straw mulch in reducing soil erodibility and surface runoff generation in Mediterranean vineyards. Sci. Total Environ. 2016, 547, 323–330. [Google Scholar] [CrossRef]
- Zhang, L.; Wang, J.; Bai, Z.; Lv, C. Effects of vegetation on runoff and soil erosion on reclaimed land in an opencast coal-mine dump in a loess area. Catena 2015, 128, 44–53. [Google Scholar] [CrossRef]
- Bahddou, S.; Otten, W.; Whalley, W.R.; Shin, H.-C.; El Gharous, M.; Rickson, R.J. Changes in soil surface properties under simulated rainfall and the effect of surface roughness on runoff, infiltration and soil loss. Geoderma 2023, 431, 116341. [Google Scholar] [CrossRef]
- Mombini, A.; Amanian, N.; Talebi, A.; Kiani-Harchegani, M.; Rodrigo-Comino, J. Surface roughness effects on soil loss rate in complex hillslopes under laboratory conditions. Catena 2021, 206, 105503. [Google Scholar] [CrossRef]
- Ma, Y.; Liu, Y.; Tian, L.; Yang, Y.; Long, Y.; Lei, M.; Zhang, Z.; Li, Q.; Zhu, H.; Li, Z. Effects of rainfall pattern and soil surface roughness on surface–subsurface hydrological response and particle size distribution of red soil slope. Catena 2023, 232, 107422. [Google Scholar] [CrossRef]
- Li, W.; Liu, Y.; Zheng, H.; Wu, J.; Yuan, H.; Wang, X.; Xie, W.; Qin, Y.; Zhu, H.; Nie, X. Complex vegetation patterns improve soil nutrients and maintain stoichiometric balance of terrace wall aggregates over long periods of vegetation recovery. Catena 2023, 227, 107141. [Google Scholar] [CrossRef]
- Parhizkar, M.; Shabanpour, M.; Lucas-Borja, M.E.; Zema, D.A.; Li, S.; Tanaka, N.; Cerda, A. Effects of length and application rate of rice straw mulch on surface runoff and soil loss under laboratory simulated rainfall. Int. J. Sediment Res. 2021, 36, 468–478. [Google Scholar] [CrossRef]
- Nachtergaele, J.; Poesen, J.; Van Wesemael, B. Gravel mulching in vineyards of southern Switzerland. Soil Tillage Res. 1998, 46, 51–59. [Google Scholar] [CrossRef]
- Xu, G.; Tang, S.; Lu, K.; Li, P.; Li, Z.; Gao, H.; Zhao, B. Runoff and sediment yield under simulated rainfall on sand-covered slopes in a region subject to wind–water erosion. Environ. Earth Sci. 2015, 74, 2523–2530. [Google Scholar] [CrossRef]
- Zhao, W.; Cui, Z.; Fan, Y.; Cao, Q. Predicting spatial variability of soil bulk density in gravel-mulched fields. J. Hydrol. Eng. 2018, 23, 04018022. [Google Scholar] [CrossRef]
- Li, X.-Y.; Liu, L.-Y. Effect of gravel mulch on aeolian dust accumulation in the semiarid region of northwest China. Soil Tillage Res. 2003, 70, 73–81. [Google Scholar] [CrossRef]
- Valentin, C.; Casenave, A. Infiltration into sealed soils as influenced by gravel cover. SSSAJ 1992, 56, 1667–1673. [Google Scholar] [CrossRef]
- Verstraeten, G.; Van Rompaey, A.; Poesen, J.; Van Oost, K.; Govers, G. Evaluating the impact of watershed management scenarios on changes in sediment delivery to rivers? In Proceedings of the Interactions between Sediments and Water: Proceedings of the 9th International Symposium on the Interactions between Sediments and Water, Banff, AB, Canada, 5–10 May 2002; pp. 153–158. [Google Scholar]
- Rai, S.; Sharma, E. Comparative assessment of runoff characteristics under different land use patterns within a Himalayan watershed. Hydrol. Process. 1998, 12, 2235–2248. [Google Scholar] [CrossRef]
- Van Wesemael, B.; Poesen, J.; de Figueiredo, T.; Govers, G. Surface roughness evolution of soils containing rock fragments. ESPL 1996, 21, 399–411. [Google Scholar] [CrossRef]
- Zhao, L.; Liang, X.; Wu, F. Soil surface roughness change and its effect on runoff and erosion on the Loess Plateau of China. J. Arid. Land 2014, 6, 400–409. [Google Scholar] [CrossRef]
- Poesen, J.; Lavee, H. Rock fragments in top soils: Significance and processes. Catena 1994, 23, 1–28. [Google Scholar] [CrossRef]
- Abrahams, A.D.; Li, G.; Krishnan, C.; Atkinson, J.F. A sediment transport equation for interrill overland flow on rough surfaces. ESPL 2001, 26, 1443–1459. [Google Scholar] [CrossRef]
- Chow, T.; Rees, H. Effects of coarse-fragment content and size on soil erosion under simulated rainfall. CaJSS 1995, 75, 227–232. [Google Scholar] [CrossRef]
- Li, T.; He, B.; Chen, Z.; Zhang, Y.; Liang, C.; Wang, R. Effects of gravel on infiltration, runoff, and sediment yield in landslide deposit slope in Wenchuan earthquake area, China. Environ. Sci. Pollut. Res. 2016, 23, 12075–12084. [Google Scholar] [CrossRef]
- Guo, T.; Wang, Q.; Li, D.; Zhuang, J. Effect of surface stone cover on sediment and solute transport on the slope of fallow land in the semi-arid loess region of northwestern China. J. Soils Sediments 2010, 10, 1200–1208. [Google Scholar] [CrossRef]
- Zuazo, V.H.D.; Pleguezuelo, C.R.R. Soil-erosion and runoff prevention by plant covers. A review. Agron. Sustain. Dev. 2008, 28, 65–86. [Google Scholar] [CrossRef]
- Qiu, Y.; Wang, X.; Xie, Z.; Wang, Y. Effects of gravel-sand mulch on the runoff, erosion, and nutrient losses in the Loess Plateau of north-western China under simulated rainfall. Soil Water Res. 2021, 16, 22–28. [Google Scholar] [CrossRef]
- Zheng, Z.-C.; He, S.-Q.; Wu, F.-Q. Changes of soil surface roughness under water erosion process. Hydrol. Process. 2014, 28, 3919–3929. [Google Scholar] [CrossRef]
- Mehuys, G.R.; Stolzy, L.H.; Letey, J. Effect of Stones on the Hydraulic Conductivity of Relatively Dry Desert Soil. SSSAJ 1975, 39, 37–42. [Google Scholar] [CrossRef]
- Ravina, I.; Magier, J. Hydraulic Conductivity and Water Retention of Clay Soils Containing Coarse Fragments. J. Soil Sci. Soc. Am. 1984, 48, 736–740. [Google Scholar] [CrossRef]
- Sauer, T.J.; Logsdon, S.D. Hydraulic and Physical Properties of Stone Soils in a Small Watershed. SSSAJ 2002, 66, 1947–1956. [Google Scholar] [CrossRef]
- Martínez-Zavala, L.; Jordán, A. Effect of rock fragment cover on interrill soil erosion from bare soils in Western Andalusia, Spain. Soil Use Manag. 2010, 24, 108–117. [Google Scholar] [CrossRef]
- Jomaa, S.; Barry, D.A.; Brovelli, A.; Heng, B.C.P.; Sander, G.C.; Parlange, J.Y.; Rose, C.W. Rain splash soil erosion estimation in the presence of rock fragments. Catena Interdiscip. J. Soil Sci. Hydrol.-Geomorphol. Focus. Geoecol. Landsc. Evol. 2012, 92, 38–48. [Google Scholar] [CrossRef]
- Jomaa, S.; Barry, D.A.; Heng, B.C.P.; Brovelli, A.; Sander, G.C.; Parlange, J.Y. Effect of antecedent conditions and fixed rock fragment coverage on soil erosion dynamics through multiple rainfall events. J. Hydrol. 2013, 484, 115–127. [Google Scholar] [CrossRef]
- Jomaa, S.; Barry, D.A.; Heng, B.C.P.; Brovelli, A.; Sander, G.C.; Parlange, J.Y. Influence of rock fragment coverage on soil erosion and hydrological response: Laboratory flume experiments and modeling. Water Resour. Res. 2012, 48, 213–223. [Google Scholar] [CrossRef]
- Wang, X.; Li, Z.; Cai, C.; Shi, Z.; Xu, Q.; Fu, Z.; Guo, Z. Effects of rock fragment cover on hydrological response and soil loss from Regosols in a semi-humid environment in South-West China. Geomorphology 2012, 151–152, 234–242. [Google Scholar] [CrossRef]
- Guang, Z.; Tianyu, L.; Jia, L. Effect of Upslope Runoff on Soil Erosion and Nutrient Loss in Slope Cropland of Purple Soil. J. Irrig. Drain. 2015, 34, 101–104. [Google Scholar] [CrossRef]
- Ai, N. Study on the Influence of Soil sand Covering on Soil Erosion in Xiangshan Area of Ningxia. Master’s Thesis, Ningxia University, Yinchuan, China, 2016. [Google Scholar]
- Kibet, L.C.; Saporito, L.S.; Allen, A.L.; May, E.B.; Bryant, R.B. A Protocol for Conducting Rainfall Simulation to Study Soil Runoff. J. Vis. Exp. 2014, 86, 51664. [Google Scholar]
- Xue, S.; Ma, B. Technical standards for construction of sand-pressed land in the arid zone of central Ningxia. In Proceedings of the 2010 Annual Conference of China Hydraulic Engineering Society, Guiyang, China, 24 November 2010. [Google Scholar]
- Sobol, N.; Gabbasova, I.; Komissarov, M. Effect of rainfall intensity and slope steepness on the development of soil erosion in the Southern Cis-Ural region (A model experiment). Eurasian Soil Sci. 2017, 50, 1098–1104. [Google Scholar] [CrossRef]
- Peng, X.; Shi, D.; Jiang, D.; Wang, S.; Li, Y. Runoff erosion process on different underlying surfaces from disturbed soils in the Three Gorges Reservoir Area, China. Catena Interdiscip. J. Soil Sci. Hydrol. Geomorphol. Focus. Geoecol. Landsc. Evol. 2014, 123, 215–224. [Google Scholar] [CrossRef]
- Liu, P.; Zhang, H.; Wang, J.; Yan, G. Summary on influencing factors of soil surface crust or seal. Arid. Land Geogr. 2009, 32, 662–668. [Google Scholar]
- Sun, J.; Yu, X.; Fan, D.; Huang, C. Hydrological and erosive response of soil surfaces to rainfall intensity as affected by gravel fragment coverage. J. Soil Water Conserv. 2018, 73, 353–362. [Google Scholar] [CrossRef]
- Lavee, H.; Imeson, A.C.; Sarah, P. The impact of climate change on geomorphology and desertification along a Mediterranean-arid transect. LDD 2015, 9, 407–422. [Google Scholar] [CrossRef]
- Rieke-Zapp, D.; Poesen, J.; Nearing, M. Effects of rock fragments incorporated in the soil matrix on concentrated flow hydraulics and erosion. Earth Surf. Process. Landf. J. Br. Geomorphol. Res. Group 2007, 32, 1063–1076. [Google Scholar] [CrossRef]
- Li, J.; Wang, W.; Li, H.; Huang, P.; Guo, M.; Dong, Y.; Li, Y. Experimental study of runoff velocity and sediment yield affected by gravels of engineering deposits in loess area. J. Hydroelectr. Eng. 2015, 9, 64–74. [Google Scholar]
- Chen, L.; Xie, Y.; Tian, F.; Jing, M. Study on runoff and sediment yield of spoil-banks with different ratios of soil to rock under simulated rainfall condition. Res. Soil Water Conserv. 2014, 3, 6–10. [Google Scholar]
- Luo, P.; Yan, P.; Wang, X.; Wu, Y.; Lyu, J.; He, B.; Duan, W.; Wang, S.; Zha, X. Historical and comparative overview of sponge campus construction and future challenges. Sci. Total Environ. 2024, 907, 167477. [Google Scholar] [CrossRef]
- Luo, P.; Wang, X.; Zhang, L.; Mohd, M.; Duan, W.; Hu, M.; Guo, B.; Zhang, Y.; Wang, Y.; Nover, D. Future Land Use and Flood Risk Assessment in the Guanzhong Plain, China: Scenario Analysis and the Impact of Climate Change. Remote Sens. 2023, 15, 5778. [Google Scholar] [CrossRef]
- Nasri, B.; Fouché, O.; Torri, D. Coupling published pedotransfer functions for the estimation of bulk density and saturated hydraulic conductivity in stony soils. Catena 2015, 131, 99–108. [Google Scholar] [CrossRef]
- Zhu, Y.; Shao, M. Processes of rainfall infiltration and sediment yield in soils containing different rock fragment contents. Trans. Chin. Soc. Agric. Eng 2006, 22, 62–67. [Google Scholar]
- Luo, H.; Rong, Y.; Lv, J.; Xie, Y. Runoff erosion processes on artificially constructed conically-shaped overburdened stockpiles with different gravel contents: Laboratory experiments with simulated rainfall. Catena 2019, 175, 93–100. [Google Scholar] [CrossRef]
- Luna, L.; Vignozzi, N.; Miralles, I.; Solé-Benet, A. Organic amendments and mulches modify soil porosity and infiltration in semiarid mine soils. LDD 2018, 29, 1019–1030. [Google Scholar] [CrossRef]
- Kang, H.; Wang, W.; Xue, Z.; Guo, M.; Li, J.; Bai, Y.; Deng, L.; Li, Y.; Li, Y. Effect of gravel on runoff and erosion characteristics on engineering accumulation slope in windy and sandy area, northern China. Trans. Chin. Soc. Agric. Eng. 2016, 32, 125–134. [Google Scholar]
- Wang, X.; Wang, T.-W.; Cai, C.; Xie, D. Processes of rainfall infiltration, runoff and sediment yield on purple soil slope containing rock fragments. Adv. Water Sci. 2014, 25, 189–195. [Google Scholar]
- Bruce-Okine, E.; Lal, R. Soil erodibility as determined by raindrop technique. Soil Sci. 1975, 119, 149–157. [Google Scholar] [CrossRef]
- Poesen, J. Mechanisms of Overland Flow Generation and Sediment Production on Loamy and Sandy Soils with and without Rock Fragments; ULC Press: London, UK, 1992; pp. 275–305. [Google Scholar]
- Lu, J.; Zheng, F.; Li, G.; Bian, F.; An, J. The effects of raindrop impact and runoff detachment on hillslope soil erosion and soil aggregate loss in the Mollisol region of Northeast China. Soil Tillage Res. 2016, 161, 79–85. [Google Scholar] [CrossRef]
- Vaezi, A.R.; Ahmadi, M.; Cerdà, A. Contribution of raindrop impact to the change of soil physical properties and water erosion under semi-arid rainfalls. Sci. Total Environ. 2017, 583, 382–392. [Google Scholar] [CrossRef] [PubMed]
- Poesen, J.; Lavee, H. Effects of size and incorporation of synthetic mulch on runoff and sediment yield from interrils in a laboratory study with simulated rainfall. Soil Tillage Res. 1991, 21, 209–223. [Google Scholar] [CrossRef]
- Chaplot, V.; Le Bissonnais, Y. Field measurements of interrill erosion under different slopes and plot sizes. Earth Surf. Process. Landf. J. Br. Geomorphol. Res. Group 2000, 25, 145–153. [Google Scholar] [CrossRef]
- Wang, S.; Luo, P.; Xu, C.; Zhu, W.; Cao, Z.; Ly, S. Reconstruction of Historical Land Use and Urban Flood Simulation in Xi’an, Shannxi, China. Remote Sensing 2022, 14, 6067. [Google Scholar] [CrossRef]
- Zhu, W.; Cao, Z.; Luo, P.; Tang, Z.; Zhang, Y.; Hu, M.; He, B. Urban Flood-Related Remote Sensing: Research Trends, Gaps and Opportunities. Remote Sens. 2022, 14, 5505. [Google Scholar] [CrossRef]
- Lado, M.; Ben-Hur, M. Soil mineralogy effects on seal formation, runoff and soil loss. Appl. Clay Sci. 2004, 24, 209–224. [Google Scholar] [CrossRef]
- Shi, Z.-H.; Yan, F.-L.; Li, L.; Li, Z.-X.; Cai, C.-F. Interrill erosion from disturbed and undisturbed samples in relation to topsoil aggregate stability in red soils from subtropical China. Catena 2010, 81, 240–248. [Google Scholar] [CrossRef]
- Kinnell, P. Raindrop-impact-induced erosion processes and prediction: A review. Hydrol. Process. Int. J. 2005, 19, 2815–2844. [Google Scholar] [CrossRef]
- Assouline, S.; Ben-Hur, M. Effects of rainfall intensity and slope gradient on the dynamics of interrill erosion during soil surface sealing. Catena 2006, 66, 211–220. [Google Scholar] [CrossRef]
- Zhao, W.; Cui, Z.; Zhang, J.; Jin, J. Temporal stability and variability of soil-water content in a gravel-mulched field in northwestern China. J. Hydrol. 2017, 552, 249–257. [Google Scholar] [CrossRef]


Disclaimer/Publisher’s Note: The statements, opinions and data contained in all publications are solely those of the individual author(s) and contributor(s) and not of MDPI and/or the editor(s). MDPI and/or the editor(s) disclaim responsibility for any injury to people or property resulting from any ideas, methods, instructions or products referred to in the content. |
© 2024 by the authors. Licensee MDPI, Basel, Switzerland. This article is an open access article distributed under the terms and conditions of the Creative Commons Attribution (CC BY) license (https://creativecommons.org/licenses/by/4.0/).