Article

Spatial Pattern and Coordination Relationship of Production–Living–Ecological Space Function and Residents’ Behavior Flow in Rural–Urban Fringe Areas

1
School of Architecture, Tianjin University, Tianjin 300072, China
2
School of Civil Engineering, Tianjin University, Tianjin 300072, China
*
Authors to whom correspondence should be addressed.
Land 2024, 13(4), 446; https://doi.org/10.3390/land13040446
Submission received: 21 February 2024 / Revised: 27 March 2024 / Accepted: 30 March 2024 / Published: 31 March 2024
(This article belongs to the Section Land Planning and Landscape Architecture)

Abstract

:
Territorial spatial planning requires thoughtful consideration of the scientific layout and synergistic control of production, living, and ecological spaces (PLESs). However, research in this field often neglects the human perspective and fails to account for people’s demands and behavioral characteristics. This study evaluates the level and spatial characteristics of residents’ production, living, and ecological behavioral (PLEB) flow, as well as the spatial pattern of the PLES functions, within the framework of the human–land coupling system. Therefore, to analyze the behavior–space coupling coordination relationship, the coupling coordination model is applied. The results indicate that the overall level of residents’ PLEB flow in rural–urban fringe areas is at a lower middle level and the functionality of the PLES is at a medium level, with a spatial distribution pattern of high in the northern and low in the southern areas. Most of the behavior–space matching types are in a state of mismatch between supply and demand. Meanwhile, the PLEB–PLES coupling coordination relationship is generally unbalanced, which is particularly noticeable in the production space. Regardless of whether the behavior–space matching type is a supply deficit or a supply surplus, the mismatch between supply and demand leads to uncoordinated and unreasonable spatial utilization. Overall, the findings of the study provide guidance for future research endeavors about PLESs and suggest embracing a human-centered scientific paradigm. Such a paradigm can promote high-quality, sustainable development of territorial spatial planning while strengthening the capacity and effectiveness of spatial governance and control.

1. Introduction

Since the reform and opening-up, China’s urbanization process has advanced rapidly [1]. While great achievements have been made in urban construction, serious challenges still need to be addressed in the domains of land use, population movement, and environmental health. Changes in the mode of production, living, and ecological functions have led to incoordination in the human–land system and spatial development, which is increasingly apparent [2,3]. Currently, urbanization is focused on promoting quality and efficiency. The guiding principles of the new phase of territorial spatial planning prioritize ecological protection, green sustainable development, and land use intensification and conservation [4]. In the context of a rural revitalization strategy, urban–rural relations are becoming more integrated, and rural factors, such as manpower and resources, are gradually adapting to the cities. As a result, there is a gradual increase in residents’ behavior flow between urban and rural areas [5]. This promotes the flow intensification of the urban–rural pattern, further expanding the idea of using cities to lead rural areas and using industry to promote agriculture [6]. The rural–urban fringe area is a complex human–land system that extends from the urban area, facilitating the flow of factors between them. It embodies the integration of urban and rural areas and has outstanding multifunctional use characteristics [7,8]. Therefore, it is a significant research objective in the field of geography and planning.
In 2012, the Chinese government proposed the goal of developing intensive and efficient production spaces, livable and moderate living spaces, and clear and beautiful ecological spaces [9]. This led to the gradual application of the concept of production–living–ecological spaces (PLESs), which has become an important aspect of territorial space development and protection [10]. The PLES is a complex system of multifunctional iterations and interactions, serving as a carrier for human survival, development, and corresponding activities [2]. It reflects the functions of the products and services that regional spaces can provide [11]. Current research on the PLES mainly focuses on function identification [12,13,14,15], function evaluation [16,17,18], and function coordination [19,20,21]. Function identification draws on ecosystem services, landscape analysis, and land function analysis to construct the function system of the urban PLES and analyze the evolution of its spatial pattern and the factors affecting it [13,22]. The study of functional evaluation primarily concerns the comprehensive evaluation of the PLES function using the land type combination and index system methods. The concept of the PLES function is used in various fields, including land regulation, measurement of resource and environmental carrying capacity, and land suitability evaluation [23]. Functional coordination mainly uses coupling coordination [19], spatial autocorrelation [20], and the mechanical equilibrium model [21] to quantitatively study the coordination relationship between production, living, and ecological spaces. The research scale mainly focuses on the macro level, including nationwide [20], provincial [13], and urban agglomerations [16]. It serves the macro decision-making process of territorial space development and protection. However, it lacks guidance for grassroots governance at the micro level, making it difficult to meet the concerns of people’s livelihood demands during the planning process [24]. The existing research on the function of PLESs has provided valuable insights. However, research gaps. exist related to people’s behavioral demands, practical activities, and the interaction between human behavior and spatial representation. Overall, identifying and evaluating the function of PLESs based on human activities is crucial for implementing a people-oriented approach and enhancing people’s sense of satisfaction and well-being [25].
In recent years, there has been an increased emphasis on spatial research, particularly regarding the characteristics of human behavior in the context of people-oriented city construction. The production–living–ecological behavior (PLEB) of residents has been investigated and estimated through participatory mapping, semi-structured interviews, and grading methods [8]. The functional changes in land use have been described from a temporal perspective [26]. A framework for optimizing PLESs based on residents’ behavior has been proposed. The framework explores the interactive relationship between PLEB and the PLES [25]. Behavior refers to the actions or methods that humans use to adapt to their environment and meet their demands [27]. Various human behaviors arise in response to different needs. Production behavior refers to the process by which residents seek livelihoods and create wealth, such as providing agricultural products through planting and breeding, industrial products through off-farm work, and service products through management. Living behavior refers to all kinds of behaviors undertaken to meet the needs of daily life, including shopping, socializing, education, and medical treatment. Ecological behavior refers to residents’ spontaneous behaviors of environmental protection, green agriculture, and ecological leisure under the influence of ecological awareness. Flow refers to the exchange and integration of various elements between regions, while behavior flow in the PLES refers to the process of changes and transformations of urban and rural residents between different regions to seek livelihoods, meet daily demands, and cope with the ecological environment [5].
Human behavior is influenced by geographical space. A specific regional dynamic coupling system can be formed by the complex interaction between residents’ PLEB and the PLES [25]. Therefore, systematic research is needed to understand the relationship between the residents’ behavior demand and the supply of space, to achieve a reasonable behavioral flow and PLES functional allocation. Based on the research status described above, this paper aims to analyze the spatial pattern and coordination relationship between PLEB and PLES function within the framework of the human–land coupling system. This study focuses on different types of behavior flow and space supply matching of residents. The contributions of this study are outlined as follows: (1) the functional evaluation and behavior flow analysis are more refined when taking the micro-scale space of township streets as the basic unit; (2) a behavior flow evaluation index system is built using the PLEB activity data of residents in the rural–urban fringe area to measure the residents’ behavior in the PLES and identify the flow characteristics of urban and rural residents’ behavior in the region; and (3) the evaluation index system for the PLES function is established based on space membership and space quality. The relationship between spatial function and residents’ behavior flow is explored from a humanistic perspective, with a focus on promoting research and providing different perspectives for the optimization of PLESs.

2. Materials and Methods
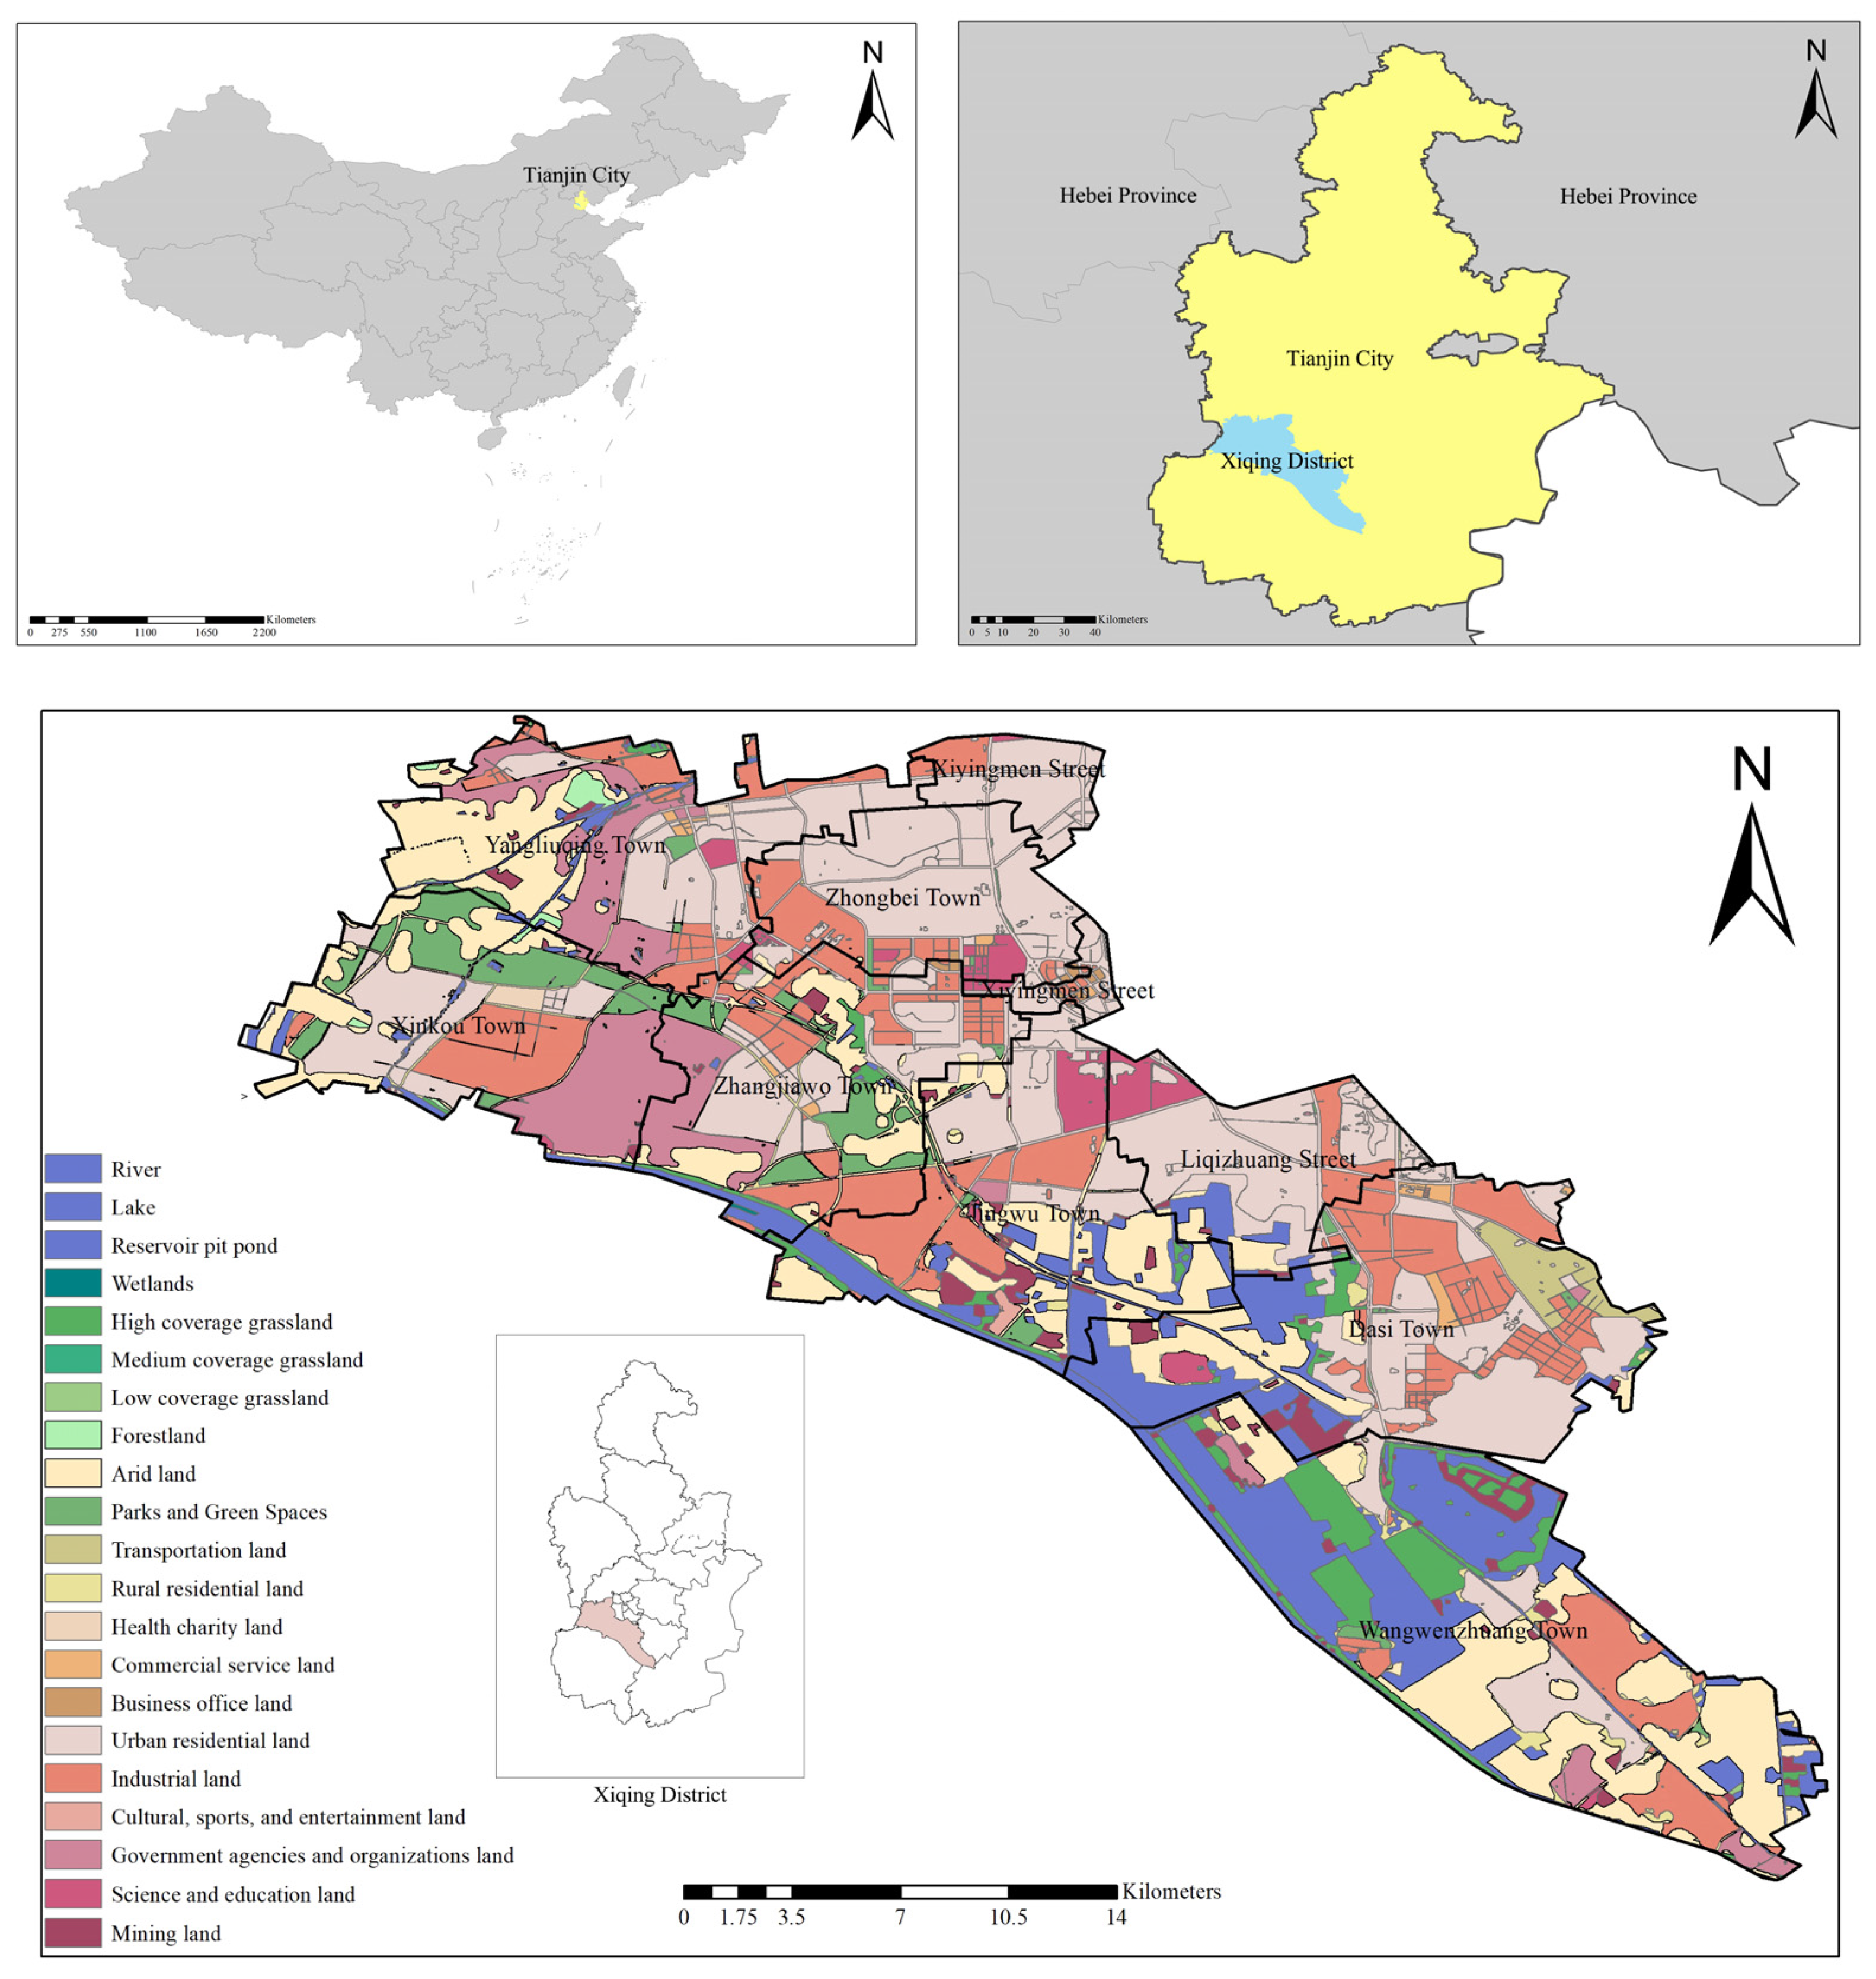
2.1. Study Area

The land area of Tianjin City covers approximately 11,966.45 km2 [28] and includes two urban centers, “Jincheng” and “Bincheng”, with the surrounding districts and counties forming the rural–urban fringe area. This paper focuses on Xiqing District, one of the four districts surrounding the urban centers, located between east longitudes 116°53′~117°20′ and north latitudes 38°50′~39°10′. It measures 48 km from north to south and 11 km from east to west (Figure 1). Currently, Xiqing District governs seven towns and five streets. However, due to administrative division adjustments in 2020, this study’s regional scope includes seven towns and two streets: Zhongbei Town, Yangliuqing Town, Xiyingmen Street, Xinkou Town, Zhangjiawo Town, Liqizhuang Street, Dasi Town, Jingwu Town, and Wangwenzhuang Town. The terrain of Xiqing District is generally flat, and it is situated in the urban agricultural belt surrounding Tianjin City. In terms of the functions and population spillover of the central city and the expansion of construction land, basic farmland, ecological control areas, rivers, and lakes, etc. are also strictly protected, with the Grand Canal passing through them. Xiqing District has a variety of land uses, integrating primary, secondary, and tertiary industries, making it an ideal location to study the function of PLESs and the flow of residents’ behavior.

2.2. Data Source and Processing

The study utilized data from three aspects, namely: (1) Space membership. The land use data were obtained from the China Multi-Period Land Use Remote Sensing Monitoring Dataset (CNLUCC) with a resolution of 30 m × 30 m in 2020, which was provided by the Resources and Environmental Sciences and Data Processing Center, Chinese Academy of Sciences (https://www.resdc.cn/) (accessed on 31 October 2023) [29]. The dataset was constructed using Landsat MSS, TM/ETM, and Landsat 8 satellite remote sensing data through human–computer interactive visual interpretation. The land use was classified into six primary categories and 25 secondary categories, including cultivated land, forest land, grassland, water area, construction land, and unused land. (2) Space quality. This paper adheres to the conventional practice of evaluating spatial quality levels based on PLES criteria and analysis of performance indicators in the fields of urban production, living, and ecology. Statistical data are primarily sourced from the 7th population census of Tianjin, the Tianjin Statistical Yearbook, the Tianjin Xiqing District Statistical Yearbook, and other relevant data from 2020. (3) Residents’ behavior. Population information of residents and the flow characteristics of production, living, and ecological behavior were obtained through study area investigation, interviews, and a questionnaire survey conducted in October 2023. According to the random sample size formula: n = Z 2 p ( 1 p ) E 2 , where n represents the required sample size. For this article, the Z-statistic value of 1.96 at the 95% confidence level was used. With an error of E = ±5%, the minimum sample size calculated was 384. Considering the response rate of the questionnaire, a total of 500 questionnaires were distributed, with 487 returned. Upon exclusion of 37 invalid questionnaires resulting from duplicate or incomplete responses, the overall validity rate was 92%. The questionnaire was reasonably distributed among towns and streets, including residents with different demographic characteristics. Short-term residents (less than 1 day) were excluded to ensure the reliability of the research results.

2.3. Methods

Based on the idea of “the flow characteristics of residents’ behavior—the spatial supply of the PLES function—behavior-space supply and demand matching type and coupling coordination relationships”, this paper analyses the level of residents’ behavior flow and spatial characteristics, as well as the spatial pattern of the PLES functions. Finally, the supply and demand matching type and coupling coordination relationship between the two are examined (Figure 2).

2.3.1. Behavior Flow Measurement of Residents

The behavior flow of residents is a complex phenomenon influenced by various factors such as nature, economy, and society, which cannot be fully characterized by a single or limited number of indicators. Therefore, establishing a behavior flow evaluation index system is crucial [5]. The first-level indicators are production behavior flow, living behavior flow, and ecological behavior flow. The secondary indicators are flow distance, flow mode, and flow frequency (Table 1). Values ranging from 1 to 5 are assigned to the distance, mode, and frequency of different behavior flows. The higher the value, the greater the distance and behavior flow frequency, the more complex the flow mode, and the higher the level of PLEB flow.
  • Data standardization
The data are assigned and transformed according to the quantitative standards of the residents’ behavior flow evaluation index system. The transformed data are then standardized using the decimal scaling method [5]:
Z i j = X i j 10 × p
where Z i j is the standardized value of the j t h indicator value of the i t h sample; X i j is the j t h indicator value of the i t h sample; and p is the smallest integer that satisfies the condition. The standardization process ensures that all data values are within the open interval between 0 and 1. A higher level of flow corresponds to a value closer to 1.
  • Indicator weighting
The entropy method is an objective and accurate weighting method for calculating index weights [30]. Firstly, the entropy of the evaluation index is calculated. In the formula, m is the evaluation index, n is the number of survey samples, and X i j is the value of the j t h indicator of the i t h regional unit. The calculation process is as follows:
Assuming k = 1 / ln n , the index entropy is:
E j = k i = 1 n Z i j ln Z i j
The index difference G j is calculated using the following formula:
G j = 1 E j
The index weight W j is calculated as follows:
W j = G j / j = 1 m G j
  • Production–living–ecological behavior flow level
By multiplying the weight W j with the standard value Z i j of the j t h indicator value of the i t h sample, the flow level of residents’ production, living, and ecological behavior can be obtained ( L i ). The formula is as follows:
L i = j = 1 m W j Z i j
The flow level of residents’ PLEB is the average of the flow level of production behavior, life behavior, and ecological behavior.

2.3.2. Evaluation of Production–Living–Ecological Space Functions

Function refers to the capabilities and services displayed by specific things or structures [31]. Drawing upon prior findings, this paper develops PLES function evaluation indicators considering space membership and space quality [24]. Land has multifunctional attributes, and a land use type can have multiple functions, but the strength of these functions may vary. Referring to the research results on production–living–ecological land use classification and the assessment of Jilai Liu et al., the land use types consist of 10 primary classifications and 21 secondary classifications in this paper, which uses a four-level scoring system of 5, 3, 1, 0 to grade and assign space membership (Table 2) [32]. The specific evaluation and assignment rules are as follows. Taking production space as an example, the highest score is 5 points for production land, 3 points for semi-production land, 1 point for weak production land, and 0 points for non-production land. The scoring rules for living space and ecological space are the same. Based on the land type value and the corresponding land area, the weighted average of production, living, and ecology in each town and street is calculated as the space membership value. The space membership values for production, living, and ecological space are denoted by M 1 , M 2 , and M 3 respectively.
To measure the quality of the production–living–ecological space, an analysis is conducted based on performance indicators in both urban and rural production, living, and ecology domains. Based on the development goals mentioned in the introduction of “intensive and efficient production spaces, livable and moderate living spaces, as well as clear and beautiful ecological spaces”, the evaluation of space quality should be based on three aspects: whether the production space is intensive and efficient, whether the living space is livable and appropriate, and whether the ecological space is green and safe [33]. Following the principles of system integration, hierarchy, avoidance of duplication, and data availability, multiple evaluation index schemes for the PLES in Xiqing District have been formed. The key point of production space optimization is to measure the degree of consumption of production factors during the production process, that is, production input; it also includes the value of the products and services produced during the production process, that is, production output. The production space quality index (PQI) includes an input index and an output index. The optimization goal of living space is livability and moderateness, and the living space quality index (LQI) should reflect the comfort and convenience. The goal of ecological space optimization is green safety, and the ecological space quality index (EQI) includes increasing green space (green development) and reducing pollution impacts (environmental protection). Considering the comprehensiveness and simplicity of the indicator system, the final plan consists of 3 first-level indicators, 6 second-level indicators, and 24 specific index calculation methods (Table 3). All indicator data are standardized, calculated, and summed according to the equal weighting method. The calculation formula of the PLES quality index (TQI) is as follows:
T Q I = 1 / 3 P Q I + 1 / 3 L Q I + 1 / 3 E Q I = i = 1 2 1 2 P Q I i + i = 1 2 1 2 L Q I i + i = 1 2 1 2 E Q I i
where PQI is the production space quality, LQI is the living space quality, and EQI is the ecological space quality. The natural breakpoint method based on ArcGIS was used to divide the data into five types: high quality, relatively high quality, medium quality, relatively low quality, and low quality to determine the spatial distribution characteristics of TQI in Xiqing District.
Using Xiqing District as an example, the coefficient of variation (CV) method is used to calculate the space membership index weight and space quality index weight of production, living, and ecological spaces (Table 4). The coefficient of variation is a statistical indicator commonly used in statistics to measure differences in data. This method assigns weights to each indicator based on the degree of variation in the observed values of all evaluated objects. The larger the coefficient of variation, the more information it conveys. Therefore, the weight assigned to it will be higher [34]. The CV is calculated as the ratio of the standard deviation to the sample mean, that is:
V i = σ i x ¯ i
where V i is the coefficient of variation of the i t h indicator, σ i is the standard deviation of the i t h indicator, and x ¯ i is the average value of the i t h indicator.
Based on all of the above processes, the production, living, and ecological space function values are:
G 1 = α 1 M 1 + β 1 P Q I · G 2 = α 2 M 2 + β 2 L Q I · G 3 = α 3 M 3 + β 3 E Q I
G = G 1 + G 2 + G 3
where G 1 , G 2 , and G 3 are the production, living, and ecological space function values, G represents the PLES function values, and α 1 , α 2 , α 3 , β 1 , β 2 , β 3 , M 1 , M 2 , and M 3 are the production, living, and ecological space membership weight, space quality weight, and space membership values, respectively.

2.3.3. Behavior–Space Supply and Demand Matching Type and Coupling Coordination Relationship

The values for evaluating PLEB flow and PLES function are normalized and divided into hierarchies. The supply–demand matching type of behavioral demand and space supply is determined by calculating the range [35]. The coupling coordination model describes the relationship between two or more systems that promote or restrict each other at high and low levels during the development process. It reflects the degree of coordinated development between the systems [36]. This paper employs the coupling coordination model to explore the coupling coordination of spatial functions and residents’ behavior flow from the perspective of the production–living–ecological relationship. The calculation formula is as follows:
C = 2 U 1 U 2 U 1 + U 2
T = α U 1 + β U 2
D = C × T
where C is the coupling degree value of behavior–space, T is the comprehensive evaluation score, and D is the coupling coordination degree value, which ranges from 0 to 1; U 1 and U 2 are the normalized PLEB and PLES function evaluation values, and α   and   β are their weights, respectively. Since behavior and function are equally important, this paper considers α = β = 0.5. The behavior–space supply and demand matching type and coupling coordination degree are divided into different levels based on the range calculation results and D value, using the natural breakpoint method and the uniform distribution function method (Table 5 Already added in the original article) [37].

3. Results

3.1. Behavior Flow Measurement of Residents

3.1.1. Behavior Flow Value Calculation

Table 6 shows that the overall behavior flow level of residents in Xiqing District is 1.377, with production behavior flow of 0.852, living behavior flow of 1.577, and ecological behavior flow of 1.701. The overall flow level is lower middle on a five-point scale. The production behavior flow values for each town and street range from 0.75 to 1.02, living behavior flow values range from 1.28 to 1.78, and ecological behavior flow values range from 1.34 to 1.96. The flow level of production behavior is considerably lower than that of living and ecological behaviors. The production behavior-related flow distances of residents in Xiqing District are generally short, mostly within the village/community, as well as the towns/streets. Non-motorized vehicles are the most common mode of transportation, followed by private cars, walking, and public transportation. The flow frequency mostly occurs multiple times per week, with rare exceptions. The flow distance of living behaviors also mainly occurs within the village/community and the towns/streets; predominant modes of flow include walking and private cars. Non-motorized vehicles and public transportation are used less frequently in living behaviors compared to production behaviors. The living flow frequency is diverse, with the majority engaging multiple times per week, while many residents flow once every half month and once a month. The range of ecological behavior flow levels varies greatly in each town and street. The flow distance and frequency are relatively balanced, while the polarization of flow modes is more apparent, with a clear dominance of certain modes, such as walking, private cars, and public transportation.

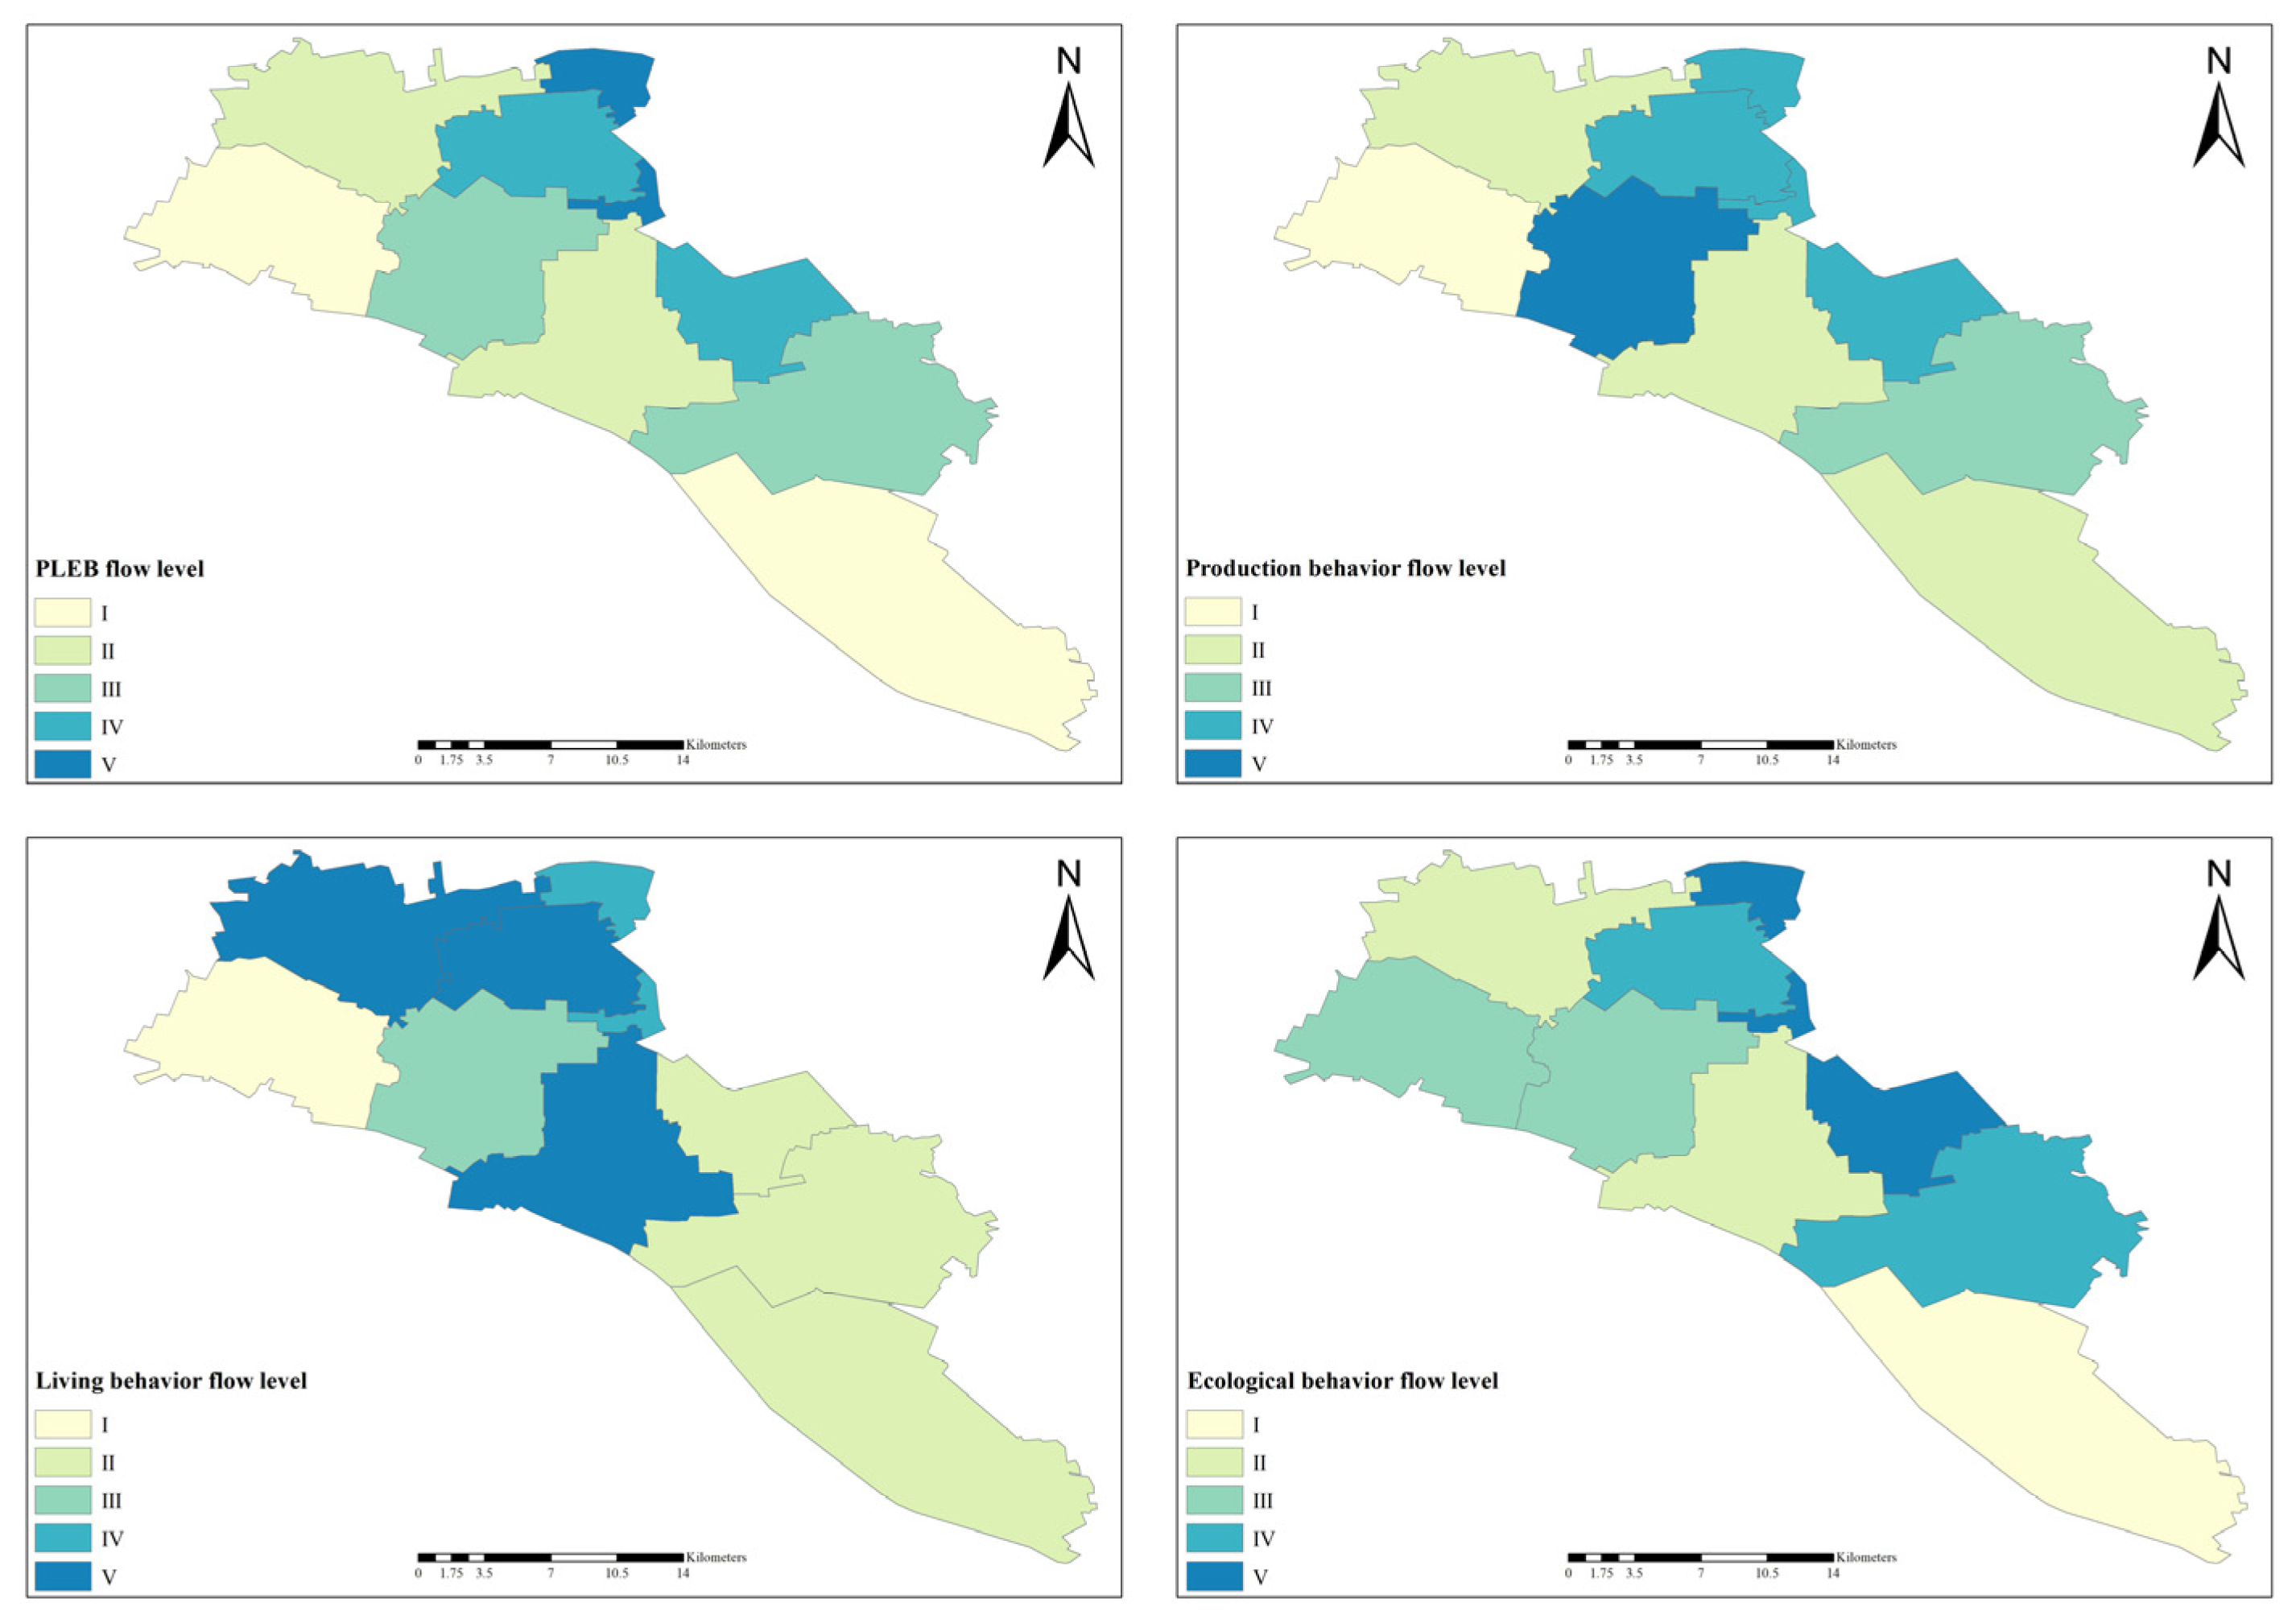
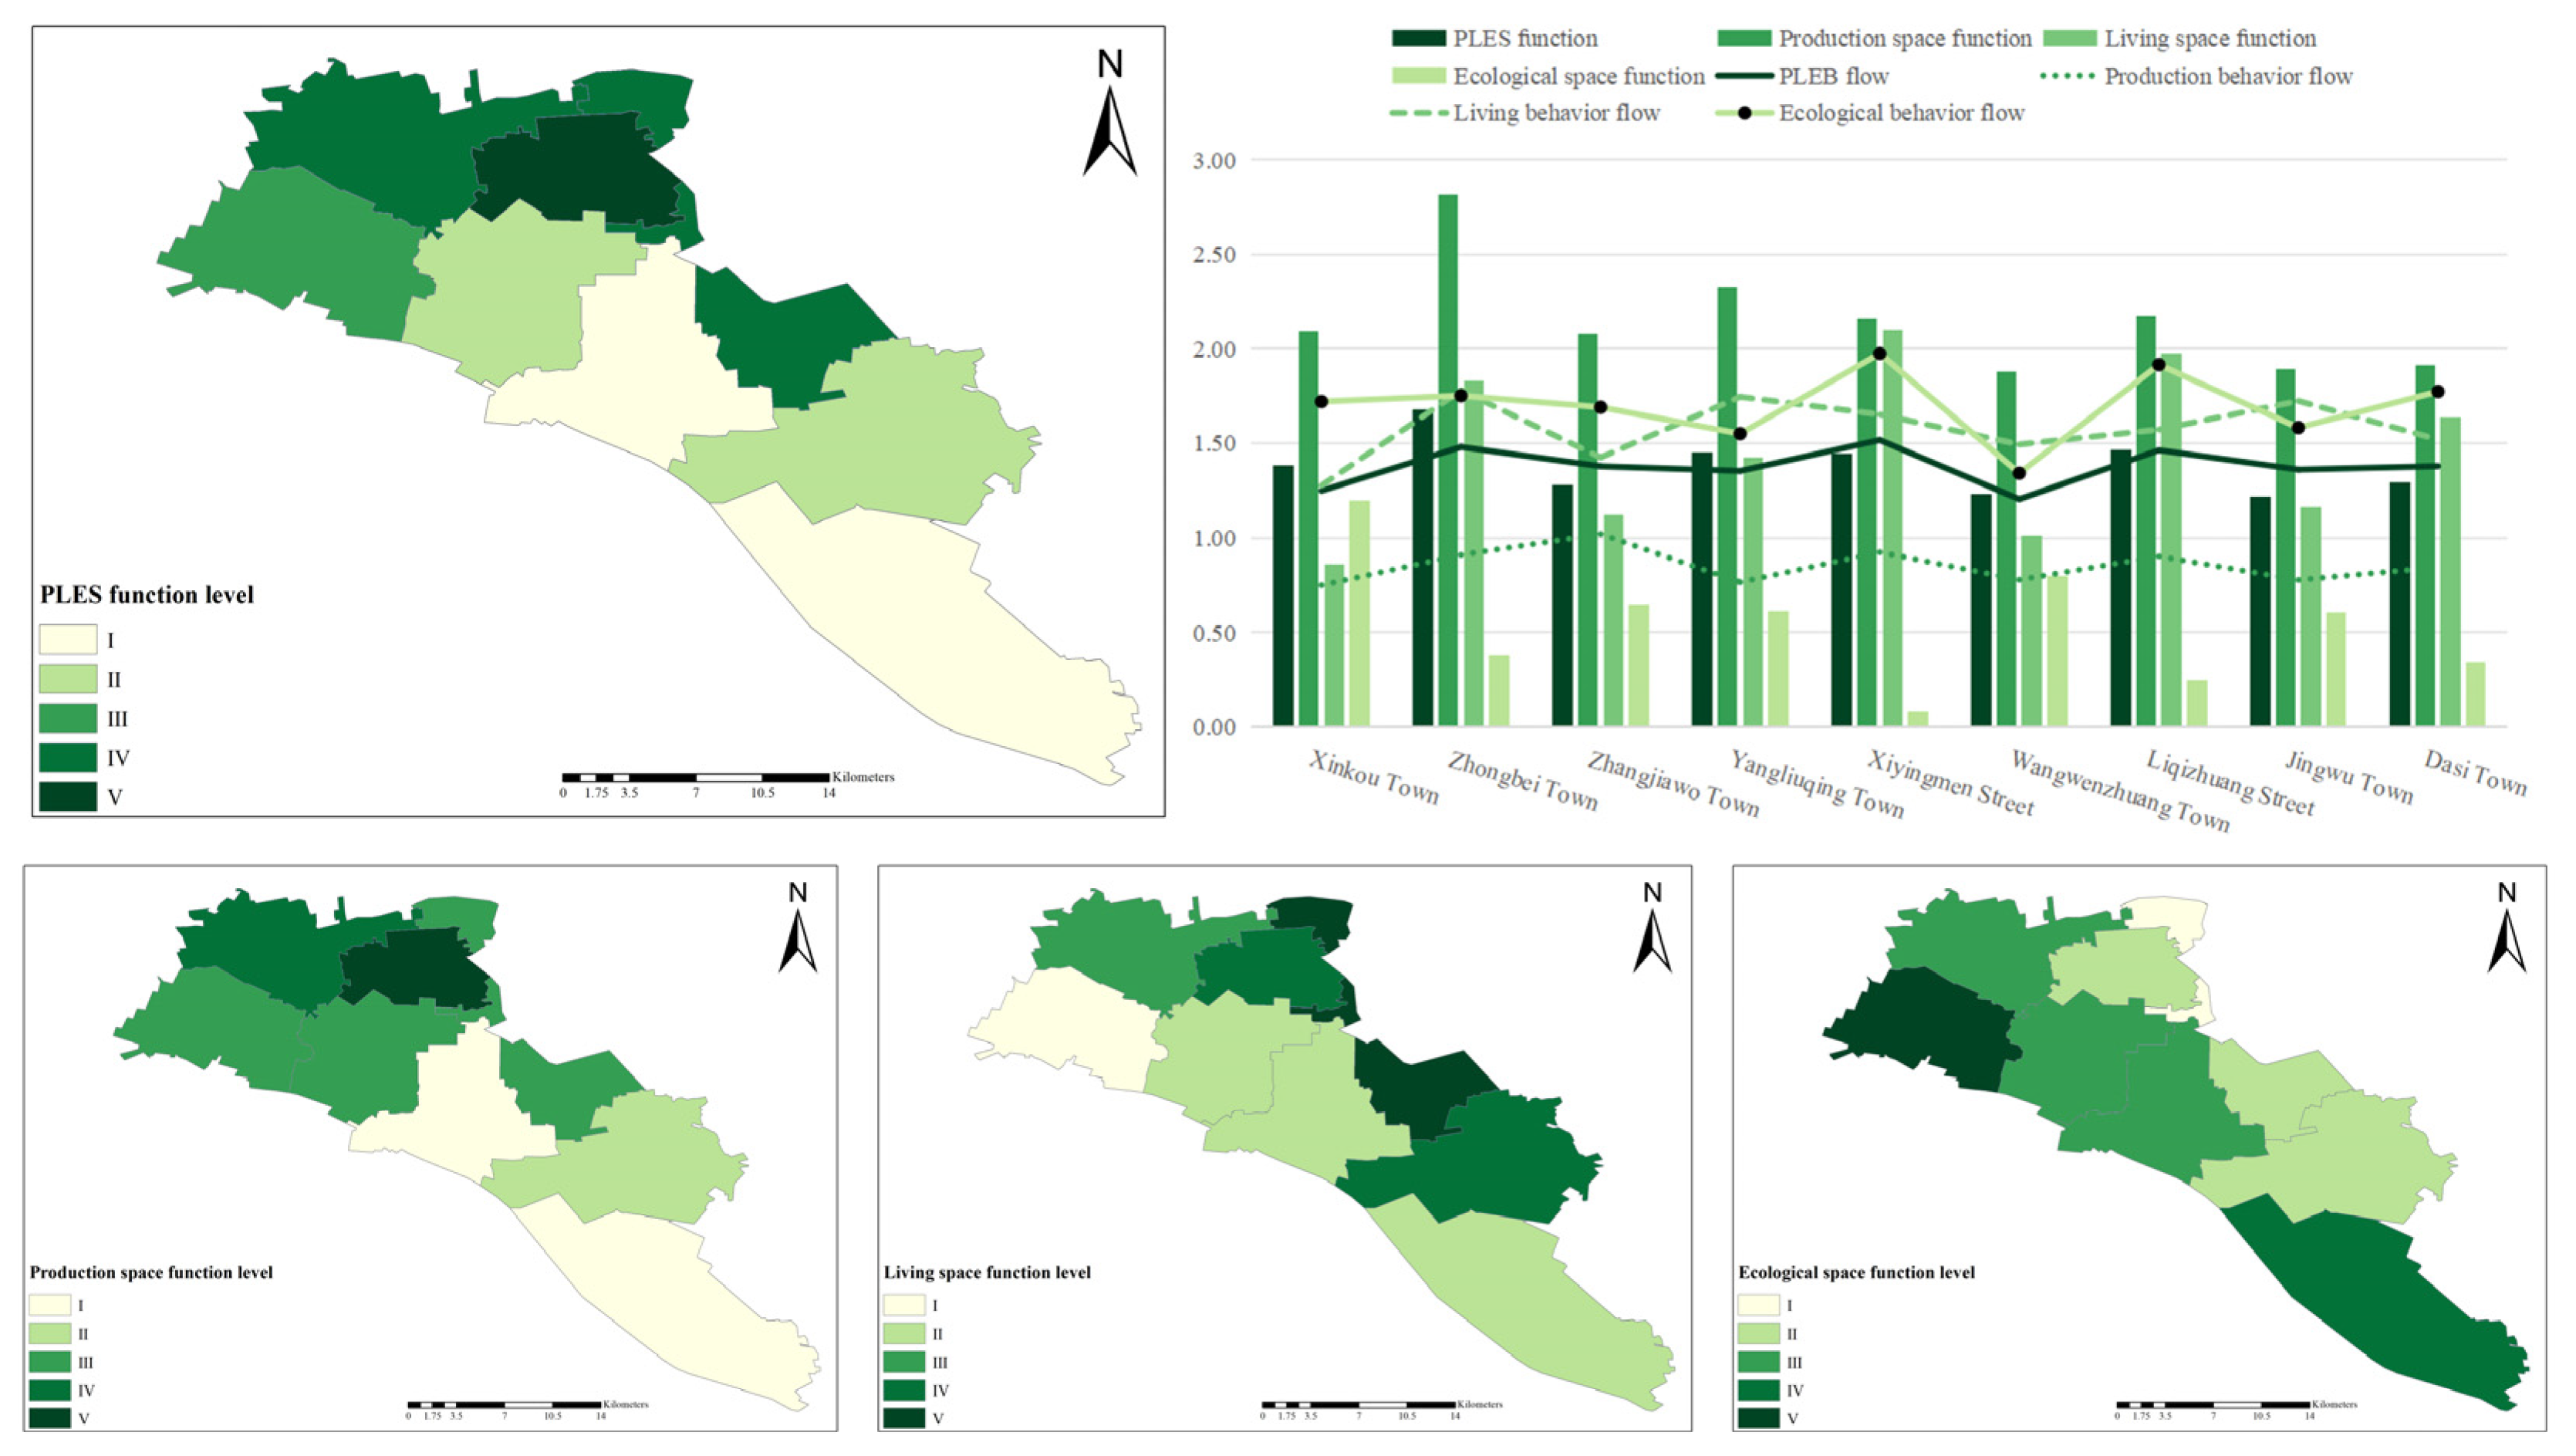
3.1.2. Behavior Flow Space Characteristics

The study employed ArcGIS 10.5 software to analyze the data in Table 6 on residents’ behavior flow levels obtained from statistical surveys. The natural breakpoint method was then used to categorize the flow of production, living, and ecological behaviors into five levels (I–V), with higher levels indicating increased flow. The spatial characteristics of residents’ PLEB flow in Xiqing District are reflected in Figure 3. Figure 3 shows a spatial distribution pattern characterized by higher levels concentrated in the eastern and northern settlements, with relatively lower levels concentrated in the western and southern settlements. This aligns with Xiqing District’s spatial planning pattern, where the district’s eastern and northern settlements are adjacent to the city center, while the western and southern settlements form part of the urban agricultural belt around the city with a combination of urban development boundaries and ecological control zones. Production behavior flows mainly occur at levels I–III, namely, Xinkou Town, Yangliuqing Town, Jingwu Town, Dasi Town, and Wangwenzhuang Town. These areas have a lower urbanization rate compared to the other four towns and are also situated far from the central urban areas. Thus, most residents prefer to carry out production activities, such as farming or working, close to their residences. The areas classified as level IV and V include Zhangjiawo Town, Zhongbei Town, Xiyingmen Street, and Liqizhuang Street. These streets/towns are generally close to the city center, serving as a hub for cross-district production activities. Among them, Zhangjiawo Town hosts Tianjin South Railway Station; therefore, a minority of residents seek employment opportunities outside Tianjin. The living behavior flow levels of residents in Xinkou Town, Zhangjiawo Town, Liqizhuang Street, Dasi Town, and Wangzhanzhuang Town are categorized as levels I, II, and III. These areas have lower living behavior flow distances and modes compared to settlements categorized as level IV or V. The living demands that are met nearby and concentrated are the characteristics of residents’ living behavior. Meanwhile, residents of Yangliuqing Town, Zhongbei Town, Xiyingmen Street, and Jingwu Town with level IV and V levels are more likely to travel to further away places to carry out daily activities. The ecological behavior flow levels of Xiyingmen Street, Liqizhuang Street, Zhongbei Town, and Dasi Town are at levels IV and V. These areas are also economically developed zones near the city center. Here, residents engage in ecological behaviors more frequently, which reflects that residents have higher income, leisure time, and the ability to engage in ecological behaviors in distant places. In contrast, residents of Yangliuqing Town, Xinkou Town, Zhangjiawo Town, Jingwu Town, and Wangwenzhuang Town exhibit relatively simple ecological behaviors and rarely venture out of their local areas.

3.2. Evaluation of Production–Living–Ecological Space Functions

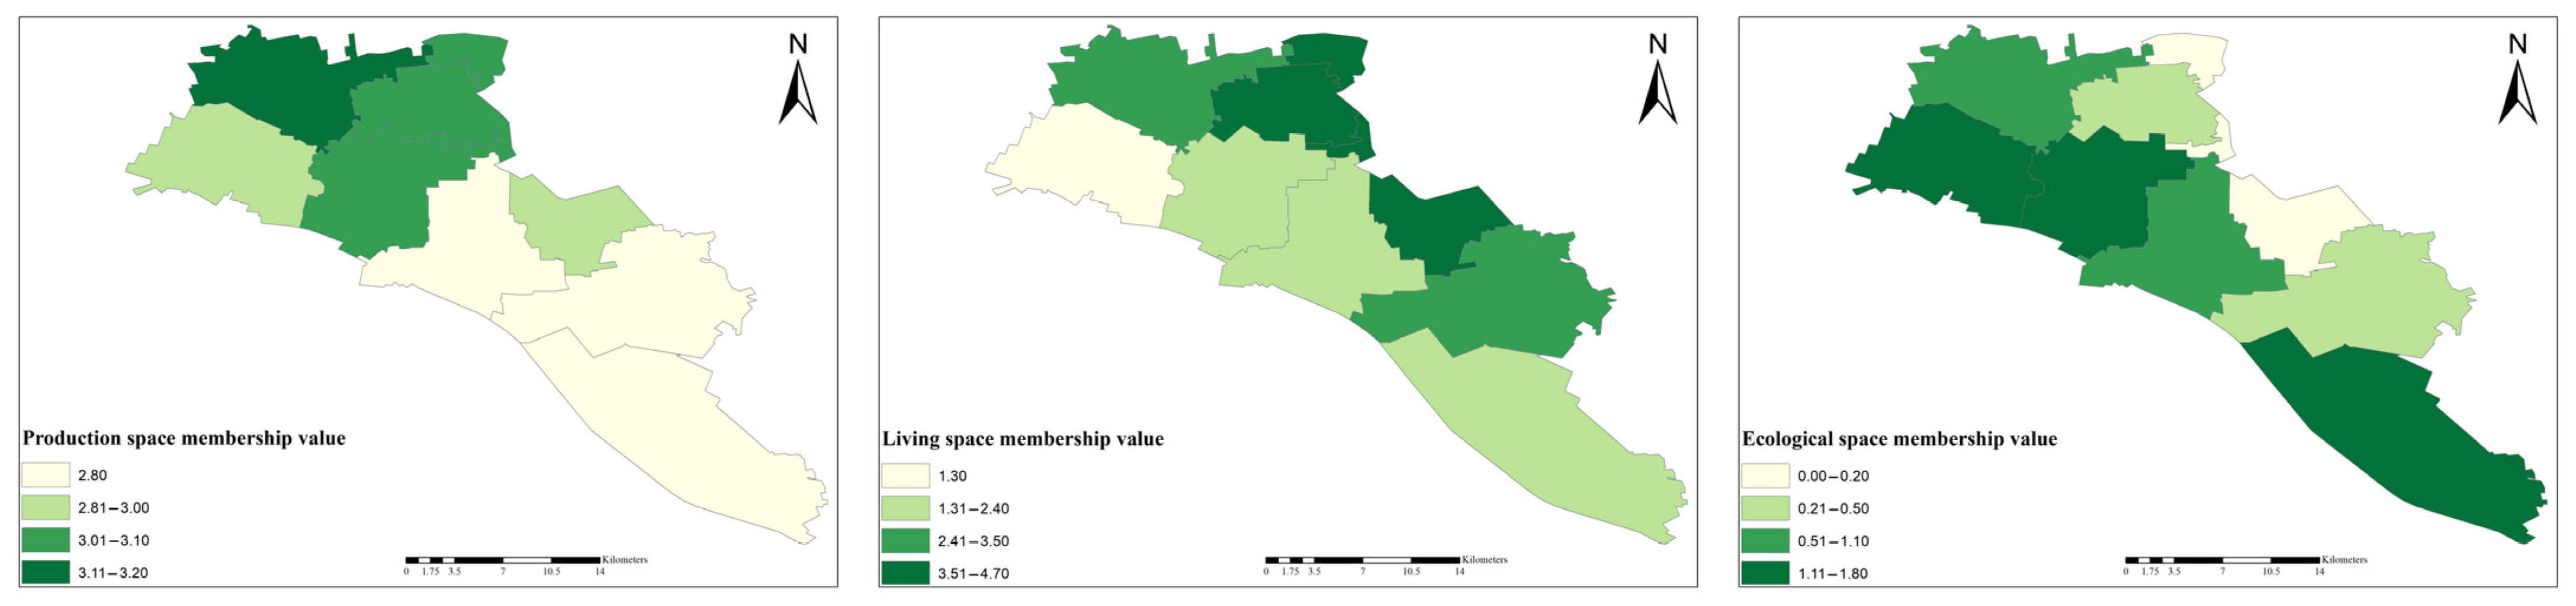
3.2.1. PLES Membership Pattern

With the application of ArcGIS spatial analysis and visualization technology, the pattern distribution map of production space, living space, and ecological space in Xiqing District was generated (Figure 4). Production space is distributed evenly throughout Xiqing District, with high values (5 points) mainly in industrial parks and mining areas across various towns and streets. Living space is mainly located in the north and east of Xiqing District. In southern areas, Wangwenzhuang Town, Dasi Town, and Jingwu Town all demonstrate function deficiency in living space (0 points). This is closely related to the local urbanization status and the area of cultivated land. The ecological space and living space show complementary patterns and are primarily located in the western and southern areas of Xiqing District, consisting of forests, grasslands, and water bodies. However, there are a few areas with high values (5 points). To classify the membership values of production space, living space, and ecological space ( M 1 , M 2 , and M 3 ) in each town and street, the natural breakpoint method is used to obtain the hierarchy of space membership values of production, living, and ecological space (Figure 5). The hierarchy of the production space value exhibits a trend of being high in the northern areas and low in the southern areas. In the northern areas of Xiqing District, with Zhongbei Town as the core, several industrial parks have been formed, including Jinsheng Industrial Park, Zhongbei Industrial Park, Zhongbei Science and Technology Industrial Park, and Xinkou Town Industrial Park. Furthermore, Yangliuqing Town and Xinkou Town still cover a significant amount of cultivated land, indicating the development of the primary industry. The living space membership value typically exhibits a distribution pattern of being high in the eastern area and low in the western area. Xiyingmen Street, Liqizhuang Street, and Zhongbei Town, which are characterized by higher average values, also exhibit high urbanization rates, a high proportion of construction land area, and a dense population. Xinkou Town and Wangwenzhuang Town exhibit lower urbanization rates and relatively higher proportions of cultivated land and other non-construction land, resulting in lower average values. The distribution of ecological space membership values is opposite to that of living space, with a pattern of high values in the west and low values in the east. Towns and streets with more non-construction land have higher ecological space membership values, whereas the opposite case has lower values.

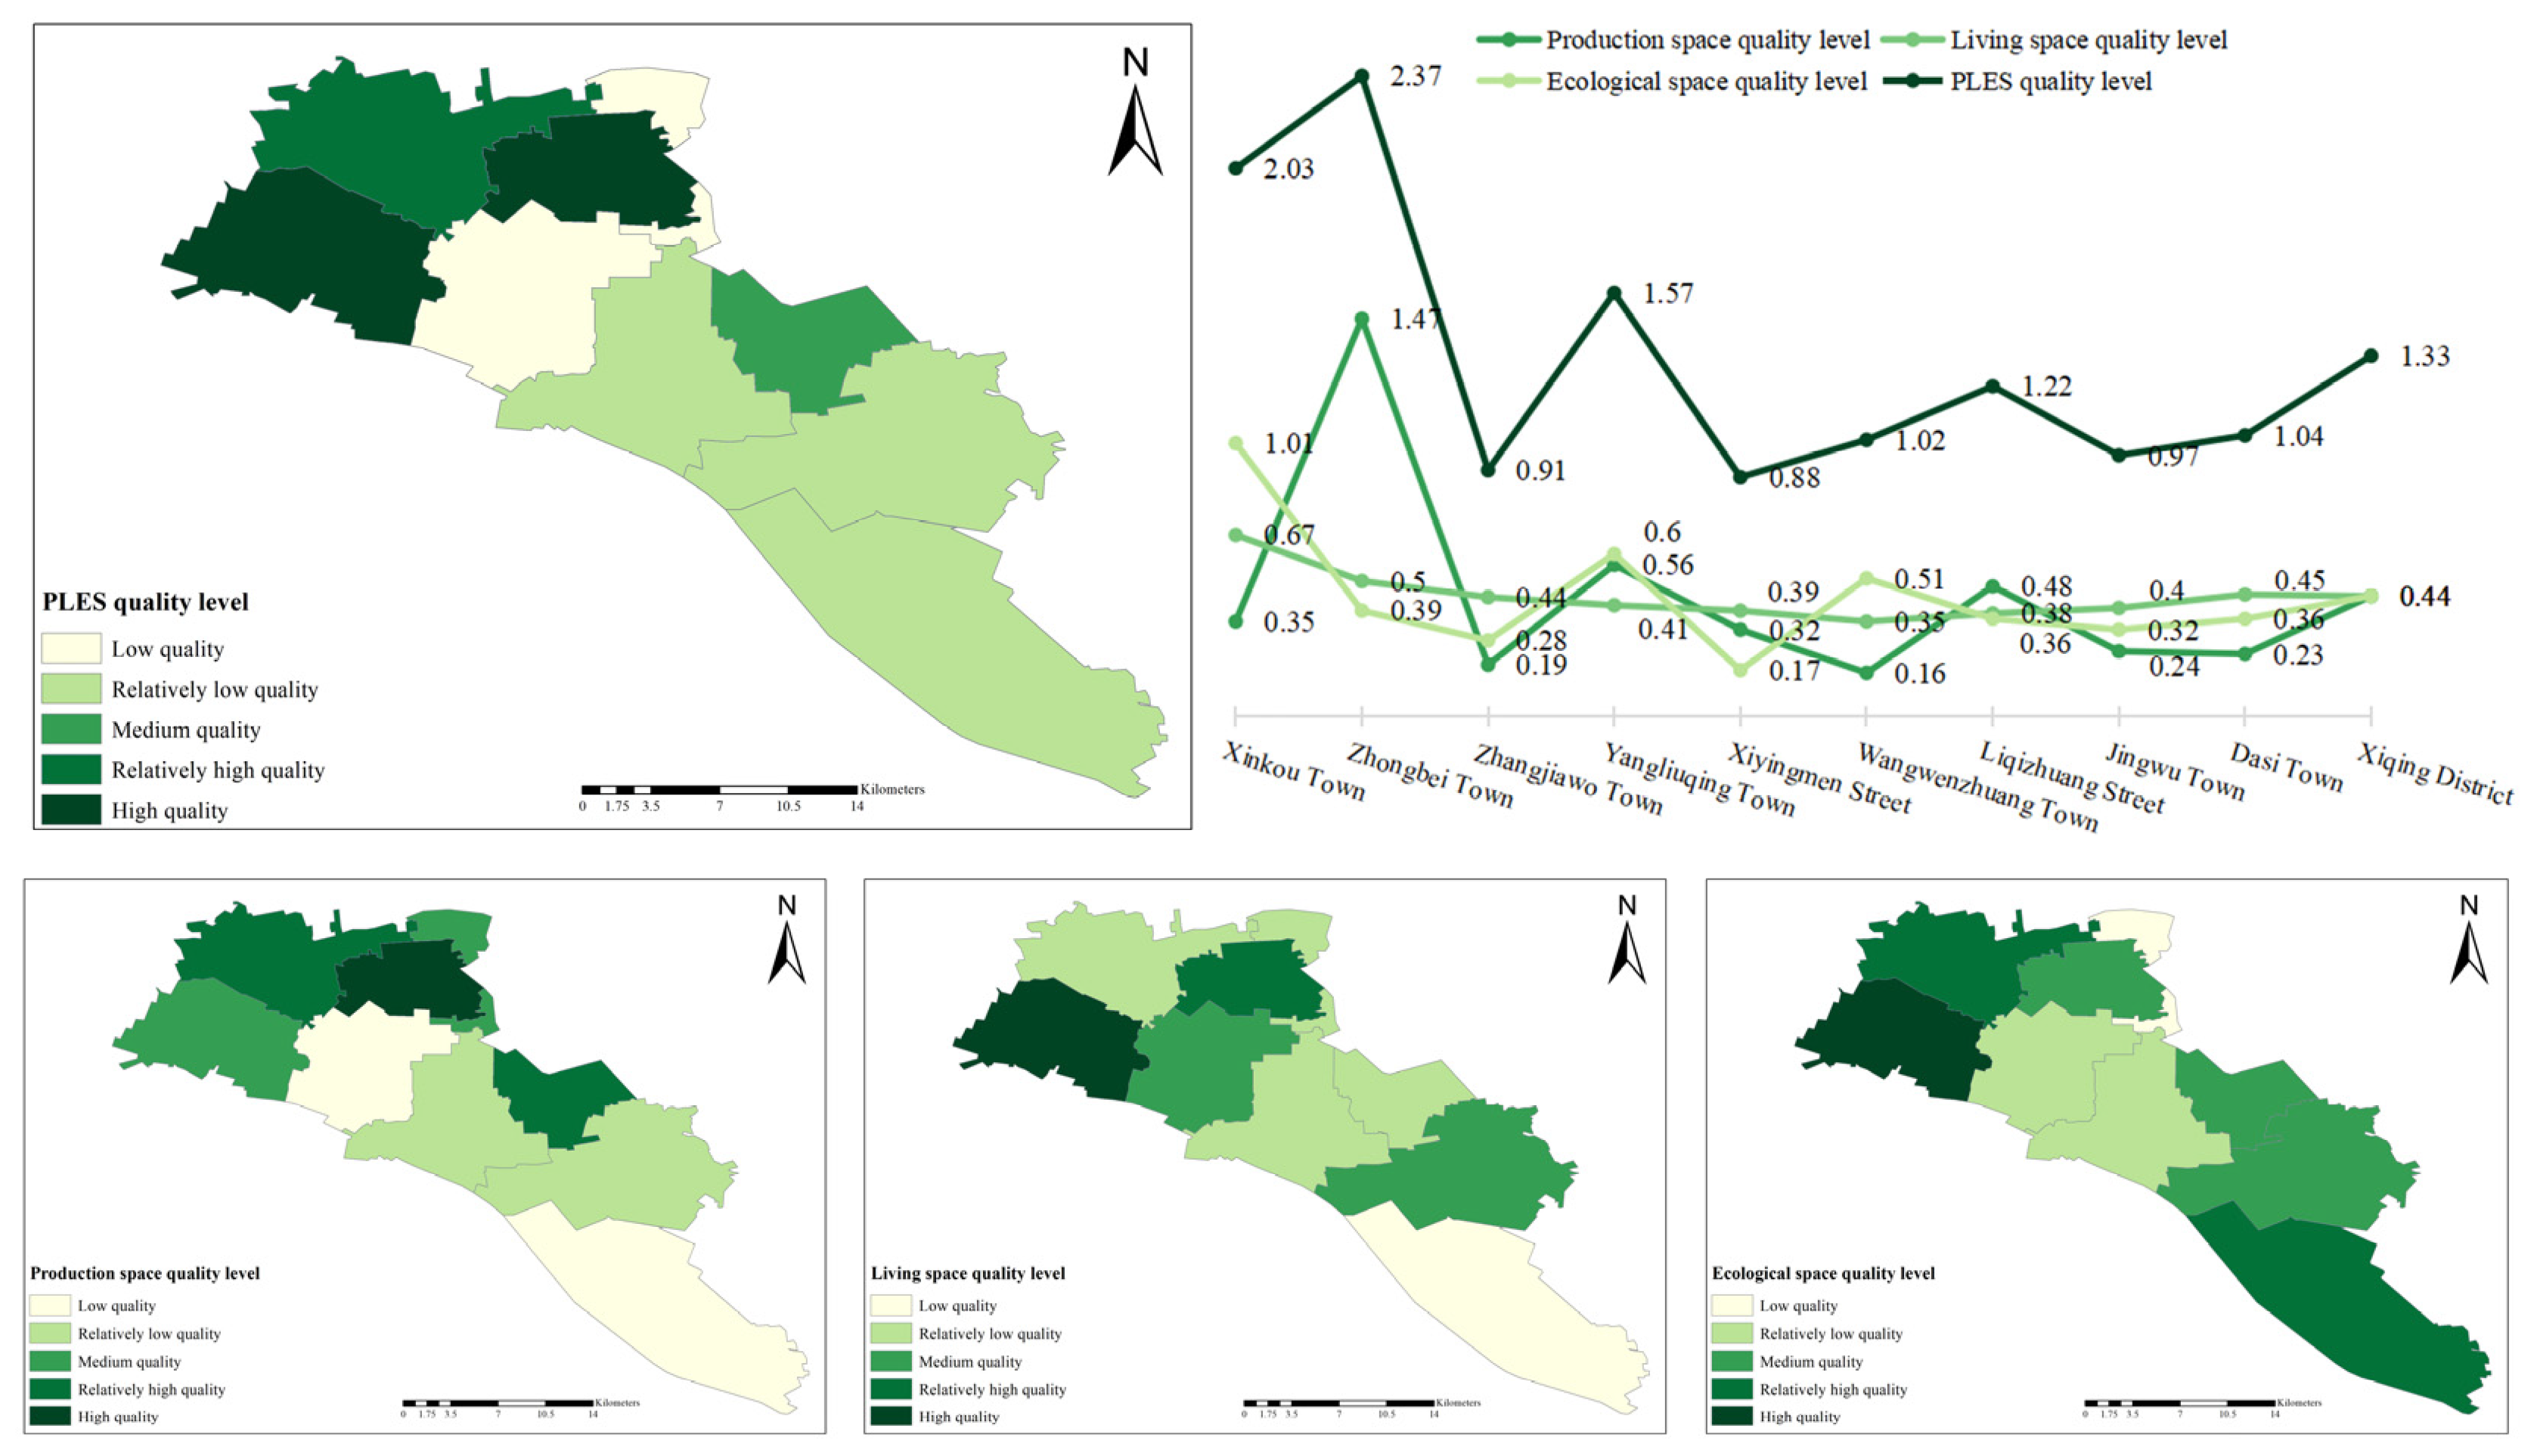
3.2.2. PLES Quality Evaluation

The production space quality index (PQI), living space quality index (LQI), and ecological space quality index (EQI) of each town and street were calculated, as shown in Table 4. The PLES quality index of Xiqing District is calculated using Formula (7), followed by the TQI spatial distribution, and its classification into 5 levels, which are presented in Figure 6. The results indicate that the PQI, LQI, and EQI of Xiqing District are all 0.44, reflecting a balanced development. However, the TQI at the town and street level exhibits significant spatial differentiation characteristics, with high- and relatively high-quality areas mainly concentrated in Xinkou Town, Zhongbei Town, and Yangliuqing Town in the northern area. The central area is dominated by low quality, while the southern area is of medium and relatively low quality. When considering production, living, and ecology separately, the high- and relatively high-quality PQI areas are found to be located in Zhongbei Town, Yangliuqing Town, and Liqizhuang Street. The output value and added value of the primary, secondary, and tertiary industries, as well as the number of employees in these industries, are relatively high in these areas. Xinkou Town and Zhongbei Town are the high- and relatively high-quality areas of LQI, while Wangwenzhuang Town is the low-quality area. Compared to Wangwenzhuang Town, Xinkou Town and Zhongbei Town have a higher road network density, more schools, and more cultural and sports activity centers per 10,000 people. In terms of EQI, the areas with high and relatively high quality are Xinkou Town, Yangliuqing Town, and Wangwenzhuang Town, where the per capita green space area and ecological land area are relatively high. On the other hand, Xiyingmen Street, Zhangjiawo Town, and Jingwu Town are the areas with low and relatively low quality.

3.2.3. PLES Function Evaluation

Based on the weight of each indicator in Table 2, the space membership value and space quality value are superimposed to analyze the PLES function level of each town and street in Xiqing District (Figure 7). The analysis reveals that the function value of the PLES in Xiqing District ranges from 1.22 to 1.68, with an average value of 1.38. The overall functional value is at a middle level, with high-value and relatively high-value areas accounting for 33.33%, medium-value areas accounting for 11.11%, and low-value and relatively low-value areas accounting for 44.44%. The spatial distribution still shows the overall characteristics of being high in the north and low in the south. Zhongbei Town is considered one of the top 100 towns in the country and is the economic hub of Tianjin. It boasts strong comprehensive strength and relatively well-developed infrastructure, making it the highest in terms of the comprehensive function level in Xiqing District. The relatively high-value areas surround Zhongbei Town, including Yangliuqing Town, Xiyingmen Street, and Li Qizhuang Street. These three areas are near the central city and have well-developed transportation. The economy in the area has experienced rapid development under the influence of Zhongbei Town. The medium value area is Xinkou Town, whose LQI, EQI, and ecology space membership values are all high; when superimposed, this makes up for the lack of living space membership values. Zhangjiawo Town and Dasi Town have relatively low values, while Jingwu Town and Wangwenzhuang Town have low values. Each of these four settlements has its focus on industrial development. The overall economic level is relatively low, the territorial space has a single function, and the land utilization rate is low. Ecological space is dominant, and production and living factors are relatively scarce.

3.3. Behavior-Space Supply and Demand Matching Type and Coupling Coordination Relationships

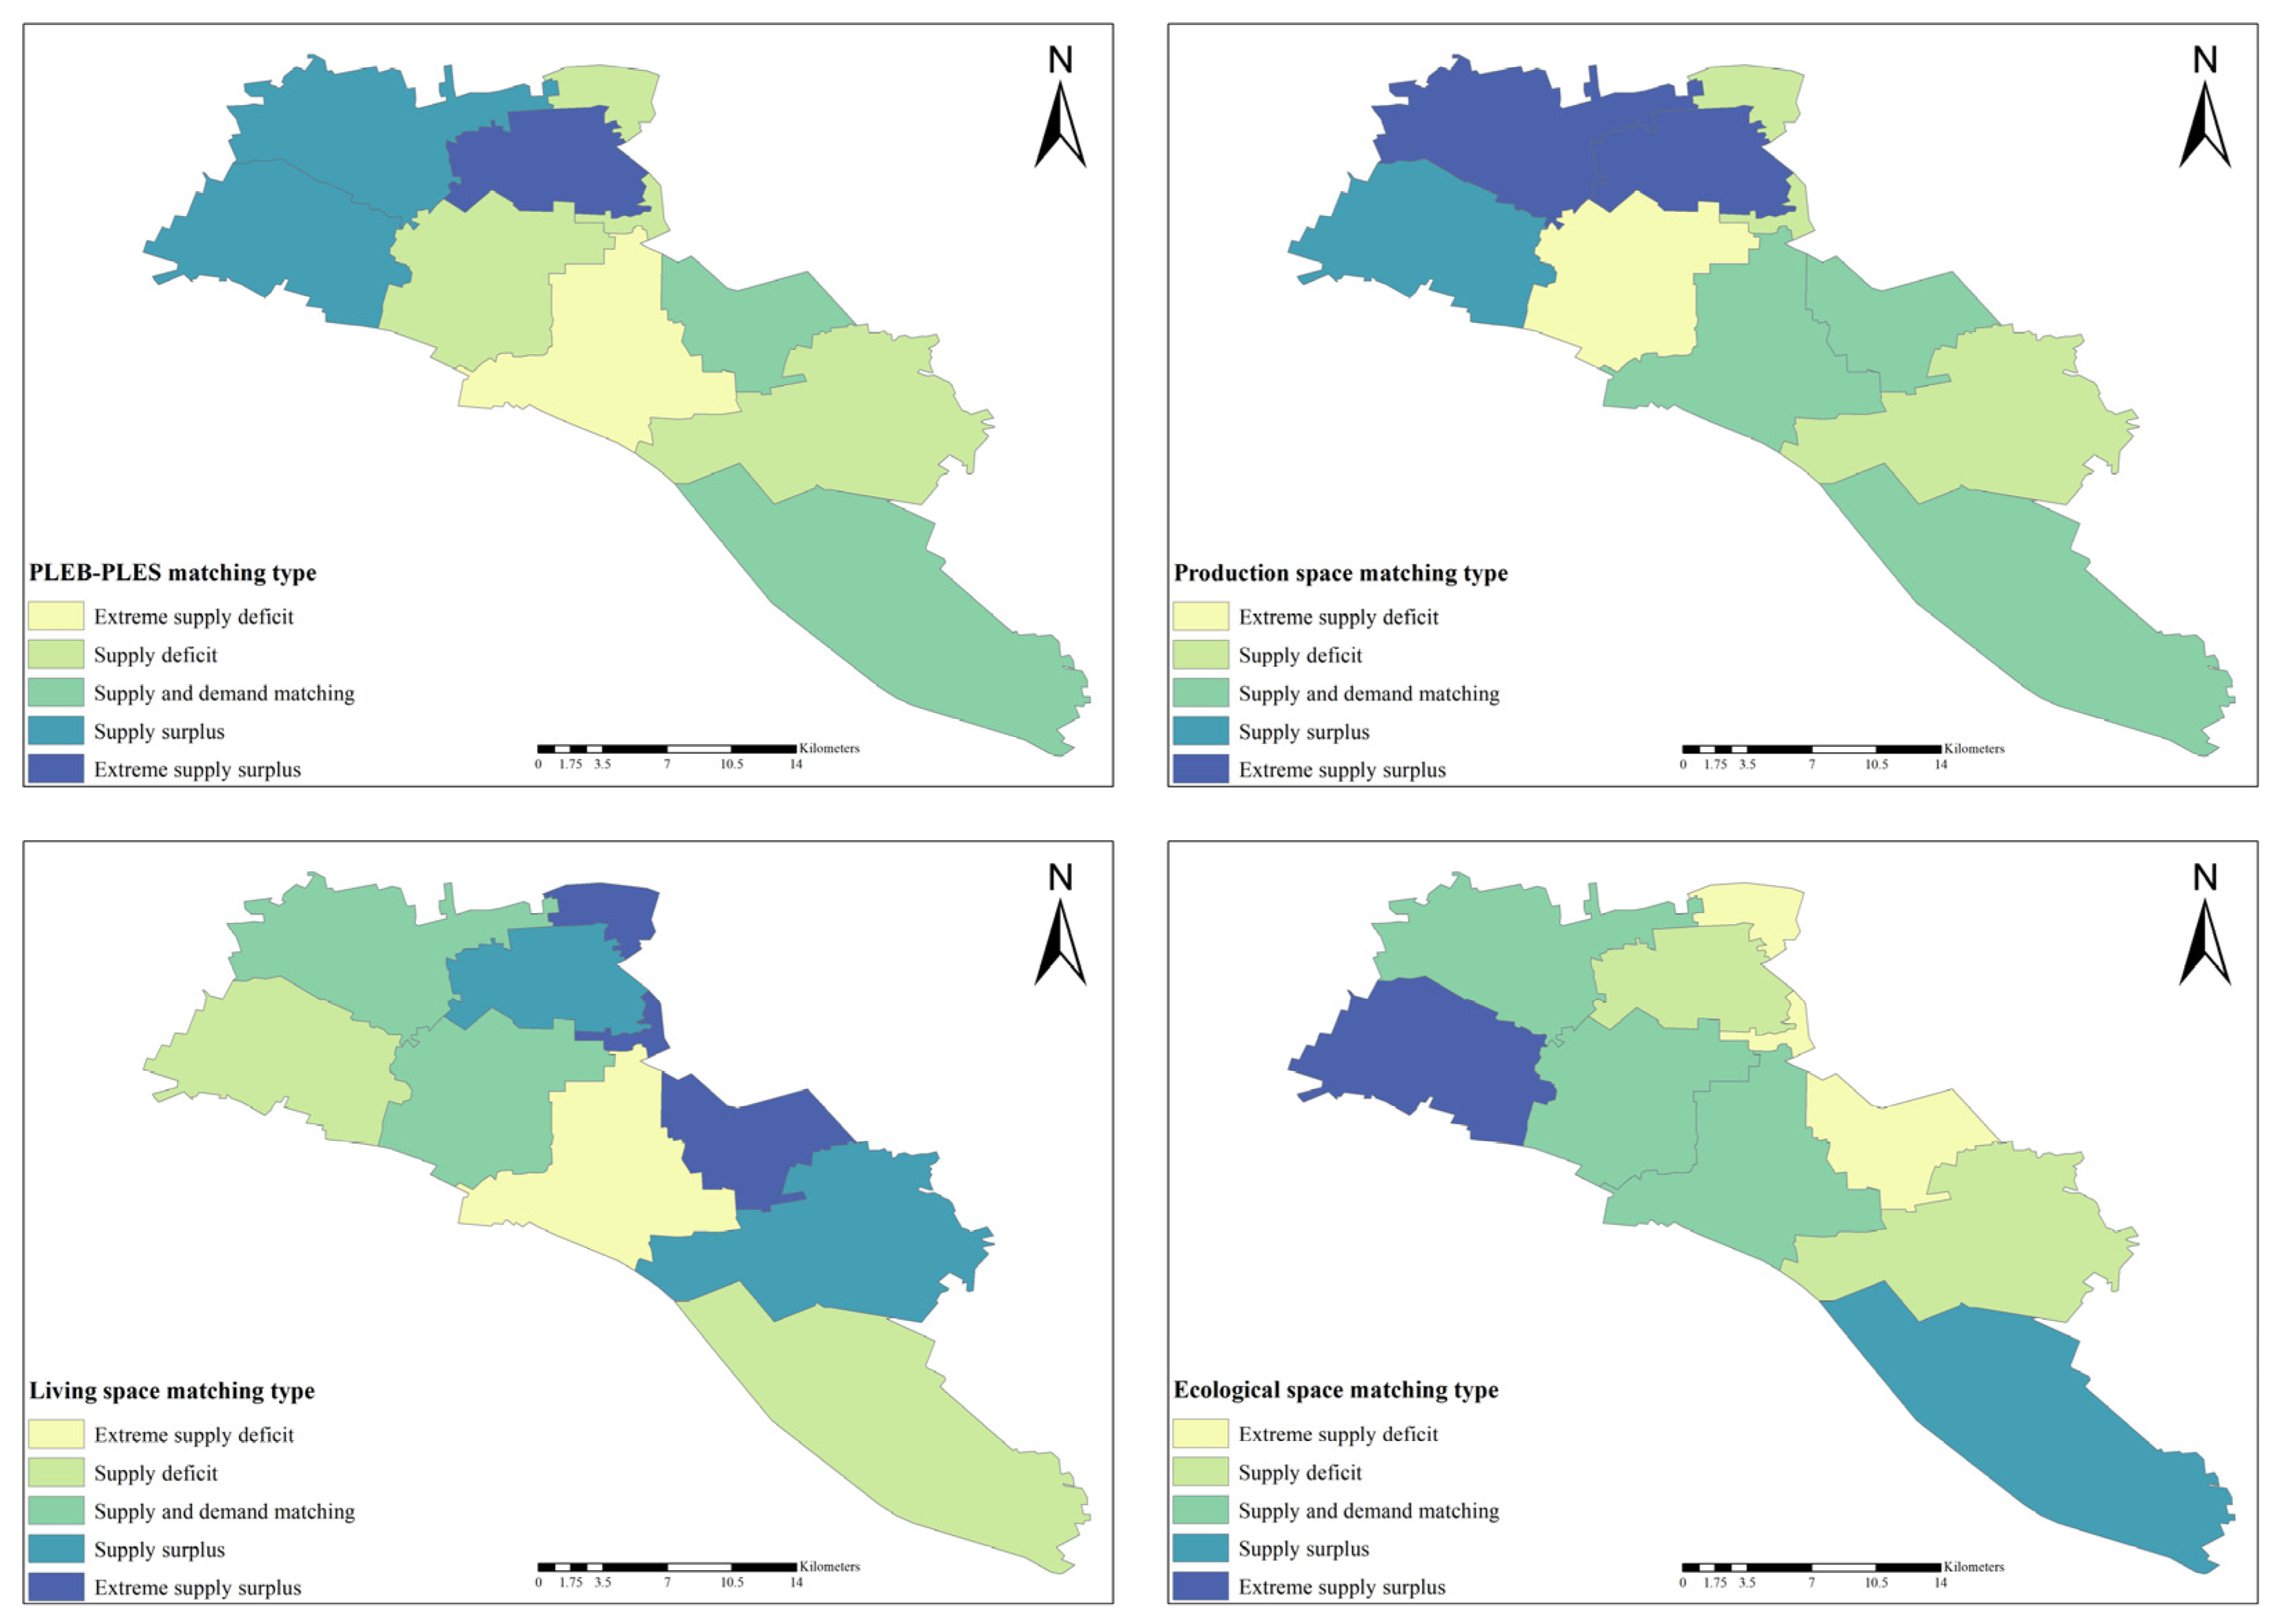
3.3.1. Behavior–Space Supply and Demand Matching Type

Figure 8 shows the matching type between residents’ PLEB and the PLES functions in Xiqing District. In general, there is a match of supply and demand on the north and south areas, while the middle part experiences a supply deficit. Regarding production space matching, Zhongbei Town, Yangliuqing Town, and Xinkou Town have a supply surplus, while Jingwu Town, Xiyingmen Street, and Dasi Town have a supply deficit. Regarding living space matching, Xiyingmen Street, Liqizhuang Street, Zhong Beizhen, and Dasi Town are also considered supply surplus areas. Jingwu Town, Xinkou Town, and Wangwenzhuang Town experience supply deficits. The ecological space matching has the largest supply deficit in four areas, i.e., Xiyingmen Street, Liqizhuang Street, Zhongbei Town, and Dasi Town.

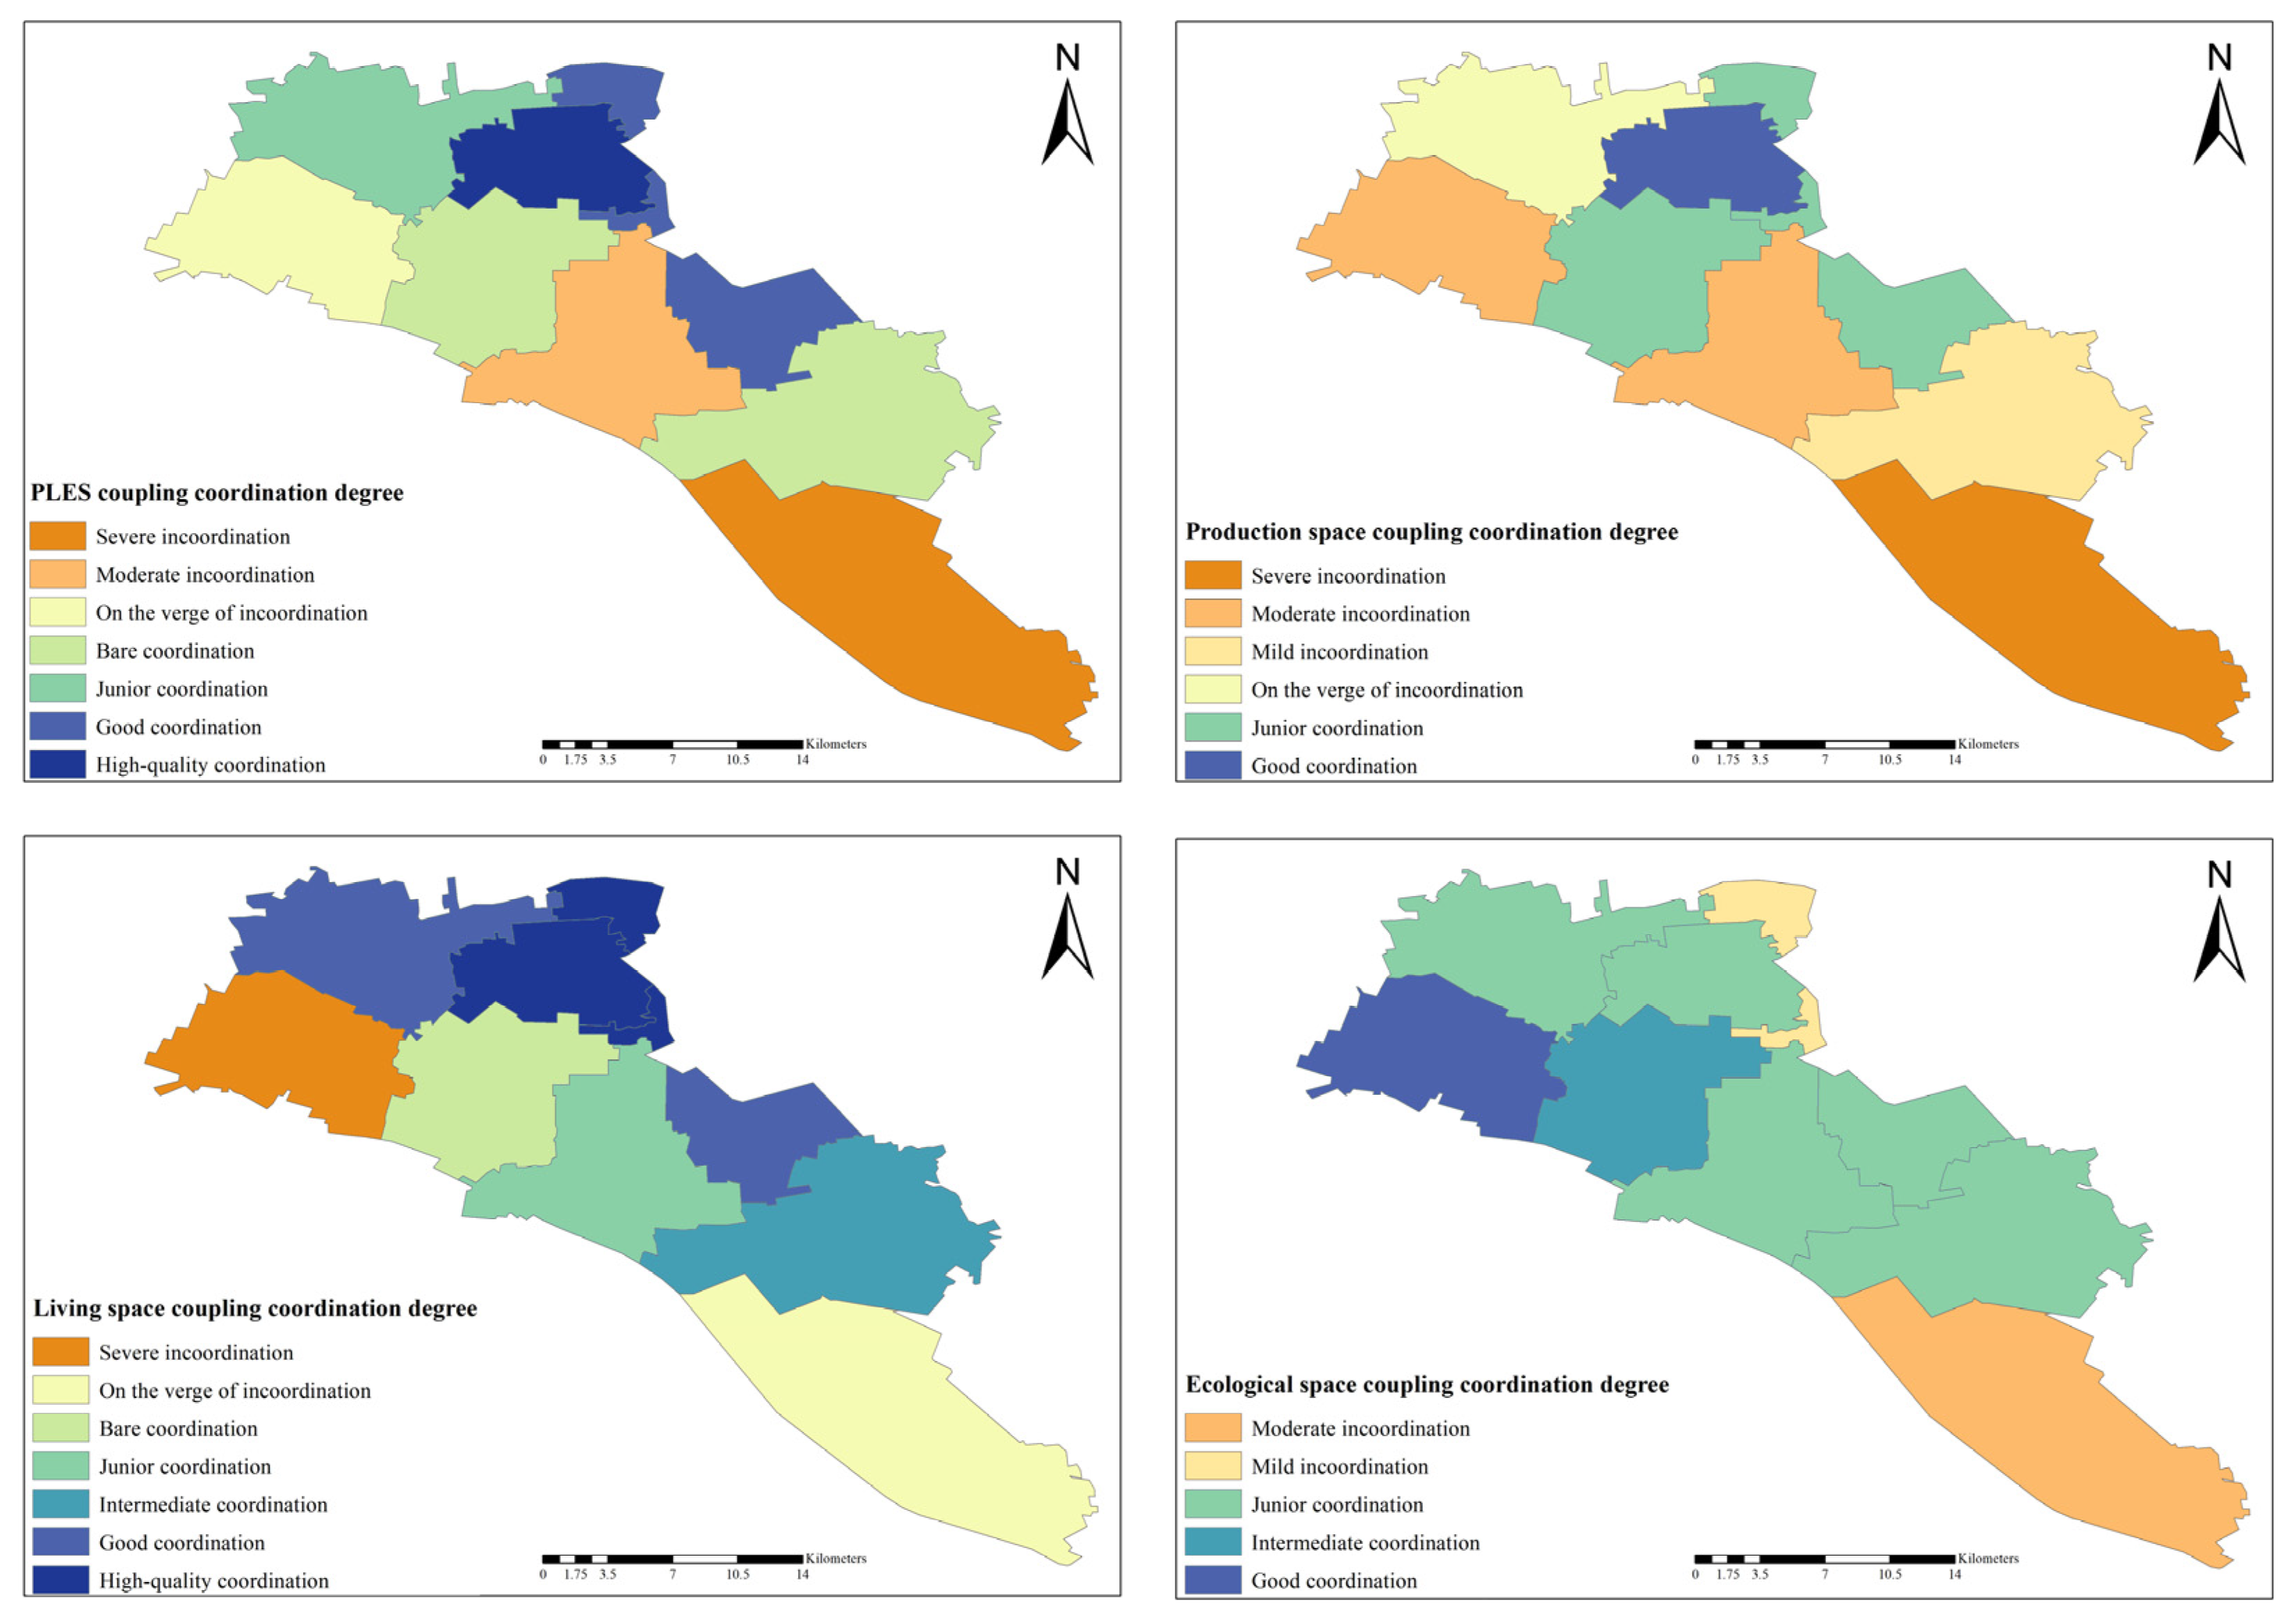
3.3.2. Behavior–Space Coupling Coordination Relationship

The coupling coordination analysis of residents’ behavior and PLES function in Xiqing District (Figure 9) shows obvious differences and partial dissonance between the flow level of residents’ PLEB and the comprehensive coordination level of territorial space PLES function at the town and street level. Within the study area, the degree of incoordination is more severe in Wangwenzhuang Town and Jingwu Town, with Xinkou Town also on the verge of incoordination, with an imbalance rate of 33.33%. Among the towns and streets that can reach the coordination level, Zhongbei Town has high-quality coordination, Xiyingmen Street and Liqizhuang Street have good coordination, Yangliuqing Town has primary coordination, and Zhangjiawo Town and Dasi Town have bare coordination. When considered separately, the rate of incoordination between production behavior and production space functions is high, reaching 55.56%. Xinkou Town, Yangliuqing Town, Wangwenzhuang Town, Jingwu Town, and Dasi Town all show incoordination. Among the three, the degree of coupling coordination between living behaviors and living space functions is the best, and only Xinkou Town and Wangwenzhuang Town are in a state of incoordination. The ecological behavior and ecological space function are the least differentiated among the three, with minimum variance and fluctuation. Liqizhuang Street, Jingwu Town, Dasi Town, Zhongbei Town, and Yangliuqing Town are all in a state of primary coordination, while Zhangjiawo Town shows intermediate coordination, and Xinkou Town shows good coordination. Only Xiyingmen Street and Wangwenzhuang Town are in a state of incoordination.

4. Discussion

4.1. Residents’ Behavior and PLES Function

Space is defined as an invisible spatial system formed by residents through various daily behaviors, embodying a spatial form and structure system formed by continuous and habitual behaviors of individuals [25]. Human beings carry out different behaviors to meet their demands. In adapting to their demands, behaviors are constantly adjusted, selected, and adapted to the environment, prompting the creation and reconstruction of different spaces. The space can restrict human behaviors, affect human demand standards, and generate new behaviors during the reconstruction process, leading to a cyclical and interactive relationship between the two [38]. Many previous studies have revealed associations between the urban structure, built environment, behavior flow, and space utilization [39]. While factors such as residents’ income level, family structure, age, and leisure interests may impact flow distance and route selection [40], land use remains an important determinant of behavior, even after considering socio-economic and demographic variables [41]. Land use diversity around residences is a key trigger for behavioral change [42]. People living in communities with a systematic spatial layout interact more with their neighbors [43], and more urban residential communities not only stimulate more positive behavior flow, but also change attitudes towards various modes of flow [44,45]. Even in homogeneous communities, demand preferences can have a significant impact on behavior [46]. At the same time, environmental changes in space such as climate [47], the COVID-19 pandemic [48,49], and other factors also have a huge impact on people’s lifestyles and space use.
Xiqing District is one of the four districts surrounding the urban center of Tianjin City, situated between the central urban area and the outer suburban counties. It is classified as part of the rural–urban fringe with a complex human–land system. The primary function is to serve as the urban center in the west of Tianjin City and as a demonstration of national ecological civilization construction [50]. A wide range of business districts and industrial parks are located within the district. In recent years, the scale and proportion of primary, secondary, and tertiary industries in various towns and streets have been adjusted based on local development planning and the current status of urbanization promotion. The proportion of residents engaged solely in agriculture has decreased, with part-time agricultural and non-agricultural residents who work or are self-employed becoming the predominant residents of Xiqing District. Spatial characteristics have a profound impact on behavioral demand motivation. The human decisions regarding spatial development and transformation methods are considered adaptive behaviors [25]. Therefore, the values and spatial differences in the distance, mode, and frequency of residents’ PLEB flow in the towns and streets of Xiqing District reflect their varying demands for the PLES, influenced by different natural and social backgrounds. Furthermore, this also highlights various ways in which these behaviors affect space, with varying intensities and influence mechanisms [51].
The research results indicate that in areas such as Xinkou Town and Yangliuqing Town, where a significant amount of cultivated land is still retained, the production activities of some pure farmers and part-time farmers primarily focus on the villages and towns near their residences. Although non-agricultural residents live across different districts and cities, they often rarely return home, resulting in a low level of production behavior flow in these areas. Additionally, these areas have a significant number of secondary and tertiary industries, with relatively high membership and quality values within production spaces. The production space’s function value and production behavior level have a supply surplus, while the degree of coupling coordination remains a state of incoordination. Wangwenzhuang Town, situated in the Tianjin Green Ecological Protection Zone, stands out, with more rivers, lakes, forests, and grasslands compared to other towns and streets. Moreover, while its ecological space function ranks second among settlements, the ecological behavior flow level is relatively low. Currently, there is a moderate incoordination phenomenon caused by a surplus in Wangwenzhuang Town’s ecological space supply. Xiyingmen Street has the highest level of ecological behavior flow in the district, but its jurisdiction area is small, and the ecological space membership and quality values are extremely low. Therefore, it is classified as a supply deficit type, which cannot meet the ecological behavioral demands of residents. As a result, residents have to travel longer distances and use more complex modes to meet their demands. These cases include situations where the level of behavior flow is low, but the functional value of space supply is high, resulting in incoordination. Alternatively, there are also cases where the flow level is excessively high, but the functional value of space supply is excessively low, and thus cannot meet the demands, leading to incoordination. This phenomenon confirms the inseparable relationship between space and behavior mentioned above, in which they affect and restrict each other, and demonstrates that individuals’ behavioral demands are influenced and constrained by their surrounding spatial environment. However, it also suggests that there is a certain degree of subjective initiative involved in the process of adapting to spatial functions. This initiative depends on the family’s resource endowment, subjective cognitive ability, and individual behavioral preferences [52]. To sum up, this subjective initiative can guide the optimization of the spatial layout of production–living–ecological spaces.

4.2. Suggestions

Territorial spatial planning is the outcome of arranging future human activities in accordance with natural laws. It involves the scientific layout of production, living, and ecological spaces, aiming to address various human spatial behaviors and manage changes in the use of different spaces. The main objective is to coordinate and solve challenges related to space competition [53]. By exploring the flow characteristics of residents’ PLEB and clarifying the cause-and-effect dynamics between these behaviors and the PLES functions, it becomes possible to take human demands as the key starting point and integrate the layouts of production, living, and ecology, and identify the most effective spatial optimization approach for the PLES. This will promote the coordinated development of the human–land system. Firstly, despite the different functional orientations of the PLES, they are not isolated; instead, they are interconnected through human interactions, providing mutual feedback to each other [52]. Therefore, meeting only the basic production or living behavior demands of residents is insufficient. Based on comprehensive surveys and statistical analysis of residents’ behavioral demands and space usage, prioritizing the “demand–behavior–well-being” of human activities, the supply–demand dynamics of the PLES should be redistributed, and the amount of supply should be adjusted accordingly to address the diverse demands of different groups in different areas. Secondly, it is crucial to uphold the fairness principles and strengthen bottom-line controls for the various types of PLES. This will enhance the availability of public services and spatial resources for low- and middle-income groups, ensuring equal distribution of resources among residents and consideration of specific demands. Finally, when planning the production, living, and ecological spaces in Xiqing District, it is essential to consider the natural conditions, socio-economic development, and residents’ behavioral preferences of each town and street. This will ensure that the strategy is adapted to the regional characteristics and local development trends, rather than mechanically superimposing the spaces [38].
In terms of specific strategies, the following can be noted: (1) Production space: In response to the incoordination in the main grain-producing areas of Xinkou Town, Yangliuqing Town, and Wangwenzhuang Town, where the former two show a surplus production function supply, the government should focus on enhanced utilization of local production spaces and transformation of the space types, while ensuring the supply of production functions. This will prevent the inefficient spread of production space and non-essential encroachment on agricultural, living, and ecological space [54]. To address the supply and demand matching coupled with severe incoordination in Wangwenzhuang Town, it is important to adhere to agricultural development. This could be achieved by enhancing local characteristics of agricultural products based on the cultivation of food crops and promoting the integration of agriculture, culture, and tourism. For instance, the Shawo radish standardized cultivation in Xinkou Town can be emulated. The town has successfully held several Shawo radish-themed Cultural and Tourism Festivals, which have become a significant source of income for the residents. Additionally, standardization of agricultural development can be continued, emphasizing green and intelligent practices aimed at improving production efficiency and ensuring high-quality output. The Agricultural Technical Service Center, located in Wangwenzhuang Town, has been chosen as the initial area for agricultural high-quality development demonstration bases. (2) Living space: Improve the quality and level of public service facilities near residences, strengthen the maintenance of public service facilities, and provide residents with accessible living space for daily life, education, and medical care, rather than causing unnecessary cross-regional flow caused by daily essential demands. The forthcoming projects in Xiqing District aim to enhance the construction of fitness venues, community facilities, electric vehicle charging infrastructure, and underground garage lighting, etc. This will meet the diverse demands of the residents. (3) Ecological space: Promote the sharing of ecological resources in various places, form a region-wide ecological structure encompassing multiple areas, multiple connections, and multiple hubs, and plan to build or transform compact ecological leisure spaces. For incoordination areas with a surplus supply such as Wangwenzhuang Town and Xinkou Town, residents are appropriately encouraged to engage in industries and services related to the ecological environment, such as eco-tourism and ecological agriculture, to achieve the integrated development of multiple industries. In response to the supply deficit in Xiyingmen Street, residents are encouraged to adopt eco-friendly transportation and consumption practices, which can contribute to reducing the strain on and damage to the local ecological space.

4.3. Limitations

This research has certain limitations. (1) The values assigned to the PLES membership through land types only correspond to the second-level classification of land use and cannot be further subdivided. (2) The study is limited to analyzing Xiqing District at one scale and does not consider multi-scale spatial connectivity or indicator assessment. (3) The study failed to explore the differences in the behavior flow and intrinsic demands of residents with different demographic characteristics regarding the coupling coordination of the PLES, leaving room for further investigation in future research.

5. Conclusions

A large number of publications have studied the segmentation, classification, and assessment of PLESs concerning the multifunctionality of land use. However, few studies have addressed the interactive relationship between residents’ behavior and PLESs. The study area of this article is Xiqing District, Tianjin City. The behavior and space are coupled and matched via field research and data crawling, leading to the establishment of an analysis method of the spatial pattern and correlation of residents’ behavior and PLES functions. This methodology reveals the evaluation level and coordination relationship between the PLEB and PLES functions. The main conclusions are as follows: (1) The overall flow level of residents’ PLEB is lower middle. The flow level of production behaviors is significantly lower than the level of living and ecological behaviors. The spatial distribution shows a high level in the eastern areas with a low level in the western areas, and a high level in the northern areas with a low level in the southern areas. (2) The PLES function is at a medium level, and the spatial distribution still shows the overall characteristics of being high in the northern areas and low in the southern areas. (3) Most behavior–space matching types represent supply deficit and supply surplus states, with relatively few ideal states of supply and demand matching. (4) Both the overall and sub-items of the behavior–space coupling coordination relationship are in a state of incoordination in some towns/streets. Among the spaces, production space exhibits the most severe incoordination, followed by ecological space, while the degree of coordination in living space is better. (5) Regardless of whether the behavior–space matching type is a supply deficit or a supply surplus, the mismatch between supply and demand leads to uncoordinated and unreasonable space utilization, which is not conducive to the harmonious and orderly development of the human–land system. In the future, PLES research should establish a human-centered scientific research paradigm, achieve high-quality and sustainable development of territorial spatial planning, and enhance the capacity and effectiveness of spatial governance.

Author Contributions

Conceptualization, X.S., B.Z. and S.Y.; methodology, X.S.; software, X.S., B.Z. and S.Y.; validation, X.S., S.G. and Y.H.; formal analysis, X.S. and B.Z.; investigation, X.S., B.Z. and S.Y.; resources, Y.H. and Y.Z.; data curation, X.S.; writing—original draft preparation, X.S.; writing—review and editing, X.S., S.G. and Y.H.; visualization, X.S., B.Z. and S.Y.; supervision, S.G., Y.H. and Y.Z.; project administration, Y.H. and Y.Z.; funding acquisition, Y.H. and Y.Z. All authors have read and agreed to the published version of the manuscript.

Funding

This research was funded by Reconstructing the Architecture System based on the Coherence Mechanism of “Architecture-human-environment” in the Chinese Context, Key Project of National Natural Science Foundation of China, grant number 52038007.

Institutional Review Board Statement

Not applicable.

Data Availability Statement

The data used to support the findings of this study are available from the authors upon request.

Conflicts of Interest

The authors declare no conflicts of interest.

References

  1. Bai, X.A.; Shi, P.; Liu, Y. Society: Realizing China’s urban dream. Nature 2014, 509, 158–160. [Google Scholar] [CrossRef] [PubMed]
  2. Li, X.; Fang, B.; Yin, R.; Xu, X.; Chen, T.Y. Spatial pattern and association of production-living-ecological function and life quality on the village scale: A case of Yangzhong City, Jiangsu Province. Sci. Geogr. Sin. 2020, 40, 599–607. [Google Scholar] [CrossRef]
  3. DeFries, R.S.; Foley, J.A.; Asner, G.P. Land-use choices: Balancing human needs and ecosystem function. Front. Ecol. Environ. 2004, 2, 249–257. [Google Scholar] [CrossRef]
  4. Zhong, Y.; Li, L.; Qu, Y.; Xia, M. Research on the index allocation method of county urban construction land under the background of territorial space. In Proceedings of the 2022/2023 China Urban Planning Conference, Wuhan, China, 23–25 September 2023. [Google Scholar]
  5. Liu, Y. A Study on Spatial Optimization Strategy Based on the Characteristics of Rural Residents Production-Living-Ecological Behaviors—A Case Study of Lanzhou City. Master’s Thesis, Northwest Normal University, Lanzhou, China, 2019. [Google Scholar]
  6. Akkoyunlu, S. The Potential of Rural–Urban Linkages for Sustainable Development and Trade. Int. J. Sustain. Dev. World Policy 2015, 4, 20–40. [Google Scholar] [CrossRef]
  7. Xu, B.; Fu, B. Conceptual evolution and classification system reconstruction of urban fringe. Arid Land Geogr. 2023, 46, 1903–1914. [Google Scholar]
  8. Duan, Y.; Wang, H.; Huang, A.; Xu, Y.; Lu, L.; Ji, Z. Identification and spatial-temporal evolution of rural “production-living-ecological” space from the perspective of villagers’ behavior—A case study of Ertai Town, Zhangjiakou City. Land Use Policy 2021, 106, 105457. [Google Scholar] [CrossRef]
  9. Wang, D.; Jiang, D.; Fu, J.; Lin, G.; Zhang, J. Comprehensive Assessment of Production-Living-Ecological Space Based on the Coupling Coordination Degree Model. Sustainability 2020, 12, 2009. [Google Scholar] [CrossRef]
  10. Cui, X.; Xu, N.; Chen, W.; Wang, G.; Liang, J.; Pan, S.; Duan, B. Spatio-Temporal Variation and Influencing Factors of the Coupling Coordination Degree of Production-Living-Ecological Space in China. Int. J. Environ. Res. Public Health 2022, 19, 10370. [Google Scholar] [CrossRef] [PubMed]
  11. Willemen, L.; Hein, L.; van Mensvoort, M.E.F.; Verburg, P.H. Space for people, plants, and livestock? Quantifying interactions among multiple landscape functions in a Dutch rural region. Ecol. Indic. Landsc. Assess. Sustain. Plan. 2010, 10, 62–73. [Google Scholar] [CrossRef]
  12. Liu, D.; Ma, X.; Gong, J.; Li, H. Functional identification and spatiotemporal pattern analysis of production-living-ecological space in watershed scale: A case study of Bailongjiang Watershed in Gansu. Chin. J. Ecol. 2018, 37, 1490–1497. [Google Scholar] [CrossRef]
  13. Xie, X.T.; Li, X.S. Spatio-temporal evolution characteristics and influencing factors of “production-living-ecological” functions in Henan Province, China. Trans. Chin. Soc. Agric. Eng. 2021, 37, 243–252. [Google Scholar]
  14. Pan, F.; Shu, N.; Wan, Q.; Huang, Q. Land Use Function Transition and Associated Ecosystem Service Value Effects Based on Production-Living-Ecological Space: A Case Study in the Three Gorges Reservoir Area. Land 2023, 12, 391. [Google Scholar] [CrossRef]
  15. Xie, X.; Li, X.; Fan, H.; He, W. Spatial analysis of production-living-ecological functions and zoning method under symbiosis theory of Henan, China. Environ. Sci. Pollut. Res. 2021, 28, 6909–69110. [Google Scholar] [CrossRef]
  16. Jin, G.; Deng, X.; Zhang, Q.; Wang, Z.Q.; Li, Z.H. Comprehensive function zoning of national land space for Wuhan metropolitan region. Geogr. Res. 2017, 36, 541–552. [Google Scholar]
  17. Cheng, T.; Zhao, R.; Liang, Y. Production-living-ecological Space Classification and Its Functional Evaluation. Remote Sens. Inf. 2018, 33, 114–121. [Google Scholar]
  18. Fu, J.; Zhang, S. Functional Assessment and Coordination Characteristics of Production, Living, Ecological Function—A Case Study of Henan Province, China. Int. J. Environ. Res. Public Health 2021, 18, 8051. [Google Scholar] [CrossRef]
  19. Wang, C.; Tang, N. Spatio-temporal characteristics and evolution of rural production-living-ecological space function coupling coordination in Chongqing Municipality. Geogr. Res. 2018, 37, 1100–1114. [Google Scholar]
  20. Li, X.; Fang, B.; Yin, R.; Rong, H. Spatial-temporal change and collaboration/trade-off relationship of "production-living-ecological" functions in county area of Jiangsu province. J. Nat. Resour. 2019, 34, 2363–2377. [Google Scholar]
  21. Zhao, J.; Zhao, Y. Synergy/trade-offs and differential optimization of production, living, and ecological functions in the Yangtze River economic Belt, China. Ecol. Indic. 2023, 147, 109925. [Google Scholar] [CrossRef]
  22. Li, G.; Fang, C. Quantitative function identification and analysis of urban ecological-production-living spaces. Acta Geogr. Sin. 2016, 71, 49–65. [Google Scholar]
  23. Duan, Y.; Xu, Y.; Huang, A.; Lu, L.; Ji, Z. Progress and prospects of “production-living ecological” functions evaluation. J. China Agric. Univ. 2021, 26, 113–124. [Google Scholar]
  24. Zhang, Z.; Hou, Y.; Sun, H.; Guo, S. Study on the evaluation of the spatial function and coordination relationship of the territorial “production-living-ecological” spaces at the township-street scale. J. Nat. Resour. 2022, 37, 2898–2914. [Google Scholar] [CrossRef]
  25. Liu, C.; Wang, Y.; He, R.; Wang, C. An analysis framework for identifying and optimizing ecological-production-living space based on resident behavior. J. Nat. Resour. 2019, 34, 2113–2122. [Google Scholar] [CrossRef]
  26. Zhao, Q.; Jiang, G.; Yang, Y.; Tian, Y.; Fan, L.; Zhou, T.; Tian, Y. Multifunction change of rural housing land in metropolitan suburbs from the perspective of farmer households’ land-use behavior. Land Use Policy 2022, 119, 106206. [Google Scholar] [CrossRef]
  27. Carter, I. Human Behavior in the Social Environment: A Social Systems Approach, 6th ed.; Routledge: New York, NY, USA, 2017. [Google Scholar] [CrossRef]
  28. Tianjin Government Affairs. 2021; Location of Tianjin. Available online: https://www.tj.gov.cn/sq/tjgk/zrdl/dlwz/ (accessed on 14 December 2023).
  29. Xu, X.; Liu, J.; Zhang, S.; Li, R.; Yan, C.; Wu, S. Remote Sensing Data Set of Multi-Period Land Use Monitoring in China (CNLUCC). Data Registration and Publishing System of Data Center of Resources and Environmental Sciences; Chinese Academy of Sciences: Beijing, China, 2018. [Google Scholar] [CrossRef]
  30. Gorgij, A.D.; Kisi, O.; Moghaddam, A.A.; Taghipour, A. Groundwater quality ranking for drinking purposes, using the entropy method and the spatial autocorrelation index. Environ. Earth Sci. 2017, 76, 269. [Google Scholar] [CrossRef]
  31. Liu, Y.; Liu, Y.; Chen, Y. Territorial Multi-functionality Evaluation and Decision-making Mechanism at County Scale in China. Acta Geogr. Sin. 2011, 66, 1379–1389. [Google Scholar]
  32. Liu, J.L.; Liu, Y.; Li, Y. Classification evaluation and spatial-temporal analysis of “production-living-ecological” spaces in China. Acta Geogr. Sin. 2017, 72, 1290–1304. [Google Scholar]
  33. Liu, P.; Sun, B. The spatial pattern of urban production-living-ecological space quality and its related factors in China. Geogr. Res. 2020, 39, 13–24. [Google Scholar]
  34. Lovie, P. Coefficient of Variation. In Encyclopedia of Statistics in Behavioral Science; John Wiley & Sons, Ltd.: Hoboken, NJ, USA, 2005. [Google Scholar] [CrossRef]
  35. Wang, M.; Wang, Y.C. Measurement and Optimization of Supply and Demand of Park Green Space at Urban Block Scale: A Case Study of Yangpu District, Shanghai. Landsc. Archit. 2021, 28, 22–27. [Google Scholar] [CrossRef]
  36. Lin, G.; Fu, J.; Jiang, D. Production–Living–Ecological Conflict Identification Using a Multiscale Integration Model Based on Spatial Suitability Analysis and Sustainable Development Evaluation: A Case Study of Ningbo, China. Land 2021, 10, 383. [Google Scholar] [CrossRef]
  37. Tian, J.; Wang, B.; Wang, S. Urban Land Use Efficiency and Its Coupling Relationship in the Three Provinces of Northeast China. Sci. Geogr. Sin. 2019, 39, 305–315. [Google Scholar] [CrossRef]
  38. Zhang, L.; Hou, Q.; Duan, Y. A literature review on Production-Living-Ecological Spaces in the context of ecological civilization: Connotation, problems and countermeasures. Acta Ecol. Sin. 2024, 44, 47–59. [Google Scholar] [CrossRef]
  39. Fan, Y.; Khattak, A.J. Urban Form, Individual Spatial Footprints, and Travel: Examination of Space-Use Behavior. Transp. Res. Rec. 2008, 2082, 98–106. [Google Scholar] [CrossRef]
  40. Næss, P. Residential location affects travel behavior—But how and why? The case of Copenhagen metropolitan area. Prog. Plan. 2005, 63, 167–257. [Google Scholar] [CrossRef]
  41. Silva, J.D.A.E.; Golob, T.F.; Goulias, K.G. Effects of Land Use Characteristics on Residence and Employment Location and Travel Behavior of Urban Adult Workers. Transp. Res. Rec. 2006, 1977, 121–131. [Google Scholar] [CrossRef]
  42. Lee, J.H.; Davis, A.W.; Goulias, K.G. Triggers of behavioral change: Longitudinal analysis of travel behavior, household composition and spatial characteristics of the residence. J. Choice Model. 2017, 24, 4–21. [Google Scholar] [CrossRef]
  43. Kim, J.Y.; Kim, Y.O. Residents’ Spatial-Usage Behavior and Interaction According to the Spatial Configuration of a Social Housing Complex: A Comparison between High-Rise Apartments and Perimeter Block Housing. Sustainability 2022, 14, 1138. [Google Scholar] [CrossRef]
  44. De Vos, J.; Cheng, L.; Witlox, F. Do changes in the residential location lead to changes in travel attitudes? A structural equation modeling approach. Transportation 2021, 48, 2011–2034. [Google Scholar] [CrossRef]
  45. Klinger, T.; Lanzendorf, M. Moving between mobility cultures: What affects the travel behavior of new residents? Transportation 2016, 43, 243–271. [Google Scholar] [CrossRef]
  46. Jarass, J.; Scheiner, J. Residential self-selection and travel mode use in a new inner-city development neighbourhood in Berlin. J. Transp. Geogr. 2018, 70, 68–77. [Google Scholar] [CrossRef]
  47. Tsoulou, I.; Andrews, C.J.; He, R.; Mainelis, G.; Senick, J. Summertime thermal conditions and senior resident behaviors in public housing: A case study in Elizabeth, NJ, USA. Build. Environ. 2020, 168, 106411. [Google Scholar] [CrossRef]
  48. Gür, M. Post-pandemic lifestyle changes and their interaction with resident behavior in housing and neighborhoods: Bursa, Turkey. J. Hous. Built Environ. 2022, 37, 823–862. [Google Scholar] [CrossRef] [PubMed]
  49. Yamazaki, T.; Iida, A.; Hino, K.; Murayama, A.; Hiroi, U.; Terada, T.; Koizumi, H.; Yokohari, M. Use of Urban Green Spaces in the Context of Lifestyle Changes during the COVID-19 Pandemic in Tokyo. Sustainability 2021, 13, 9817. [Google Scholar] [CrossRef]
  50. Wang, H.T.; Ma, S.; Wan, T.; Guo, B.F.; Zhao, S.M. Assessment of road traffic carbon emission reduction in urban development area: A case study of Xiqing District, Tianjin. Presented at the Resilient Transport: Quality and Service—China Urban Transport Planning Annual Conference 2023, Xi’an China, 12–13 October 2023; p. 23.
  51. Golledge, R.G. Spatial Behavior: A Geographic Perspective; Guilford Press, New York, NY, USA, 1997.
  52. Fang, F.; He, R. Study on the characteristics and mechanism of spatial evolution of rural three-life from the perspective of peasant household behavior. Study Pract. 2018, 1, 101–110. [Google Scholar] [CrossRef]
  53. Sun, S. The Types and Structure of Knowledge in Territorial Spatial Planning. Urban Plan. Forum 2020, 1, 11–18. [Google Scholar]
  54. Zhang, Y.; Deng, W.T.; Zhao, L.Z. Evaluation of urban construction land use efficiency and optimization strategy of land allocation: Based on the empirical study on 2165 municipal districts, county-level cities, and counties in China. City Plan. Rev. 2023, 1–8. Available online: http://kns.cnki.net/kcms/detail/11.2378.tu.20230525.1712.004.html (accessed on 4 December 2023).
Figure 1. Map of the geographical location of Xiqing District.
Land 13 00446 g001
Figure 2. Research framework.
Land 13 00446 g002
Figure 3. Behavior flow space characteristics.
Land 13 00446 g003
Figure 4. Production, living, and ecological space distribution patterns.
Land 13 00446 g004
Figure 5. Production, living, and ecological space membership values.
Land 13 00446 g005
Figure 6. PLES quality evaluation.
Land 13 00446 g006
Figure 7. PLES function evaluation.
Land 13 00446 g007
Figure 8. Behavior–space supply and demand matching type.
Land 13 00446 g008
Figure 9. Behavior–space coupling coordination relationship.
Land 13 00446 g009
Table 1. Behavior flow evaluation index system.
First Level IndicatorsSecondary IndicatorsIndicator Quantification LayerAssignmentWeight
Production behavior flowProduction behavior flow distanceIn and around the village/community112.35%
Within the town/street2
Other towns/streets in Xiqing District3
Outside Xiqing District4
Outside Tianjin5
Production behavior flow modeOn foot17.90%
Non-motor vehicle2
Motorcycle3
Public transport4
Private car5
Production behavior flow frequencyOnce every six months10.42%
Once in three months2
Once a month3
Once every half month4
Multiple times a week5
Life behavior flowLife behavior flow distanceIn and around the village/community122.99%
Within the town/street2
Other towns/streets in Xiqing District3
Outside Xiqing District4
Outside Tianjin5
Life behavior flow modeOn foot116.21%
Non-motor vehicle2
Motorcycle3
Public transport4
Private car5
Life behavior flow frequencyOnce every six months12.88%
Once in three months2
Once a month3
Once every half month4
Multiple times a week5
Ecological behavior flowEcological behavior flow distanceIn and around the village/community113.30%
Within the town/street2
Other towns/streets in Xiqing District3
Outside Xiqing District4
Outside Tianjin5
Ecological behavior flow modeOn foot113.65%
Non-motor vehicle2
Motorcycle3
Public transport4
Private car5
Ecological behavior flow frequencyOnce every six months110.30%
Once in three months2
Once a month3
Once every half month4
Multiple times a week5
Table 2. PLES membership value.
Primary ClassificationSecondary ClassificationSpace Membership Value
CodeLand use typeCodeLand use typeProduction spaceLiving spaceEcological space
1Arable land13Arid land303
3Forestland31Forestland005
4Grassland41High coverage grassland005
42Medium coverage grassland005
43Low coverage grassland005
5Commercial land51Commercial service land510
52Business office land510
6Industrial and mining storage land61Industrial land510
62Mining land510
7Residential land71Urban residential land350
72Rural residential land350
8Public management and public service land81Government agencies and organizations land330
83Science and education land330
84Health charity land330
85Cultural, sports, and entertainment land330
87Parks and green spaces131
10Transportation land 500
11Water areas and water conservancy facility land111River005
112Lake005
113Reservoir pit pond101
12Other land125Wetlands005
Table 3. PLES quality evaluation system.
First-Level IndicatorsSecond-Level IndicatorsSpecific Index Calculation Methods (Unit)Index Property
Production space quality index
(PQI)
Input indexNumber of employees in secondary and tertiary industries per unit of construction land (Person/km2)+
Investment in fixed assets per unit of construction land (100 million yuan/km2)+
Population density per unit of construction land (Person/km2)+
Output indexGross industrial output value per unit of construction land (10,000 yuan/km2)+
Tertiary industry operating income per unit of construction land (10,000 yuan/km2)+
Primary production value added per unit of cultivated land area (100 million yuan/km2)+
Tax completion status per unit of construction land (10,000 yuan/km2)+
Total power of agricultural machinery per unit cultivated land area (kW/km2)+
Living space quality index (LQI)Comfort indexDisposable income of residents (yuan)+
GDP per capita (yuan)+
Per capita disposable income as a share of per capita GDP (%)+
Convenience indexRoad network density (km/km2)+
Number of park squares per 10,000 people+
Number of schools per 10,000 people +
Number of hospitals and health stations per 10,000 people +
Number of cultural and sport activity centers per 10,000 people+
Ecological space quality index (EQI)Green developmentGreen coverage rate (%)+
Per capita green space area (m2/person)+
Ecological land area (km2)+
Proportion of ecological land area to total land area (%)+
Environmental protectionLand area for construction of domestic waste transfer station (m2)+
Scale of domestic waste transfer station (tons/day)+
Agricultural chemical fertilizer usage per unit cultivated land area (tons/km2)-
Effective irrigation area (km2)-
Table 4. PLES function evaluation index weights.
Space MembershipSpace Quality
IndexWeightIndexWeight
Production space membership α 1   = 21.14%Production space quality β 1   = 19.25%
Living space membership α 2   = 13.36%Living space quality β 2   = 16.84%
Ecological space membership α 3   = 13.36%Ecological space quality β 3   = 16.04%
Table 5. Behavior–space supply and demand matching type and degree of coordination.
Type/DegreeDivision Basis
Supply–demand matching typeExtreme supply deficitNatural breakpoint method
Supply deficit
Supply and demand matching
Supply surplus
Extreme supply surplus
Coupling coordination degreeExtreme incoordinationD ∈ (0.0~0.1)
Severe incoordinationD ∈ [0.1~0.2)
Moderate incoordinationD ∈ [0.2~0.3)
Mild incoordinationD ∈ [0.3~0.4)
On the verge of incoordinationD ∈ [0.4~0.5)
Bare coordinationD ∈ [0.5~0.6)
Junior coordinationD ∈ [0.6~0.7)
Intermediate coordinationD ∈ [0.7~0.8)
Good coordinationD ∈ [0.8~0.9)
High-quality coordinationD ∈ [0.9~1.0)
Table 6. Behavior flow value calculation.
Production Behavior FlowLife Behavior FlowEcological Behavior FlowPLEB Flow
Xiqing District0.8521.5771.7011.377
Xiyingmen Street0.9241.6531.9751.249
Liqizhuang Street0.9021.5731.9161.480
Zhongbei Town0.9101.7801.7521.379
Yangliuqing Town0.7651.7461.5511.354
Xinkou Town0.7491.2771.7211.517
Zhangjiawo Town1.0201.4251.6911.204
Jingwu Town0.7771.7241.5831.464
Dasi Town0.8441.5201.7741.361
Wangwenzhuang Town0.7781.4941.3421.379
Disclaimer/Publisher’s Note: The statements, opinions and data contained in all publications are solely those of the individual author(s) and contributor(s) and not of MDPI and/or the editor(s). MDPI and/or the editor(s) disclaim responsibility for any injury to people or property resulting from any ideas, methods, instructions or products referred to in the content.

